Attached files
| file | filename |
|---|---|
| 8-K - 8-K - Carolina Trust BancShares, Inc. | form8k.htm |
Carolina Trust BancShares, Inc. holding company for: Investor PresentationFIG Partners
CEO Forum – Scottsdale, AZ NASDAQ: CARTJanuary 2019 Exhibit 99.1
Caution Regarding Forward-Looking Statements This presentation prepared by Carolina Trust
BancShares, Inc. (the “Company”) includes forward-looking statements within the meaning of the Private Securities Litigation Reform Act of 1995, including those identified by the words “may,” “will,” “should,” “could,” “anticipate,” “believe,”
“continue,” “estimate,” “expect,” “forecast,” “intend,” “focused,” “plan,” “potential,” or “project” and similar expressions. These statements are subject to known and unknown risks, uncertainties, and other factors that could cause the actual
results to differ materially from such forward-looking statements. Such risks, uncertainties, and other factors include, but are not limited to: (i) deterioration in the financial condition of borrowers resulting in significant increases in
loan losses and provisions for those losses; (ii) changes in the short-term interest rate environment; (iii) the inability of Carolina Trust Bank (the “Bank”) to maintain the historical growth rate with respect to its loans or deposits; (iv)
changes in loan underwriting, credit review or loss reserve policies associated with economic conditions, examination conclusions, or regulatory developments; (v) the effectiveness of the Bank’s asset management activities in improving,
resolving or liquidating lower-quality assets; (vi) adverse conditions in the national or local economies including the North Carolina market, particularly in commercial and residential real estate markets; (vii) rapid fluctuations or
unanticipated changes in interest rates on loans or deposits; (viii) the results of regulatory examinations; (ix) the ability to implement integration plans associated with our recent merger, which integration may be more difficult,
time-consuming or costly than expected; (x) risks of expansion into new geographic or product markets; (xi) the ability to achieve the cost savings and synergies contemplated by the merger within the expected timeframe, or at all; (xii)
disruptions to customer and employee relationships and business operations caused by the Clover merger; (xiii) deterioration in the valuation of other real estate owned and increased expenses associated therewith; (xiv) inability to comply with
regulatory capital requirements, including those resulting from changes to capital calculation methodologies and required capital maintenance levels; (xv) risks associated with litigation, including the applicability of insurance coverage;
(xvi) the vulnerability of the Bank’s network and online banking portals to unauthorized access, computer viruses, phishing schemes, spam attacks, human error, natural disasters, power loss and other security breaches; (xvii) the possibility of
increased compliance costs as a result of increased regulatory oversight; (xviii) changes in state and federal legislation, regulations or policies applicable to banks and other financial service providers, including regulatory or legislative
developments; and (xix) risks associated with the Company’s outstanding indebtedness, including the risk that a deterioration in the Company’s financial condition could adversely affect the Company’s ability to make payments of principal and
interest on borrowings and cause a default on outstanding indebtedness. Any projections of future results of operations included herein are based on a number of assumptions, many of which are outside the Company’s control and should not be
construed in any manner as a guarantee that such results will in fact occur. This presentation speaks only as of the date it was given. The Company assumes no obligation to revise, update, or clarify forward-looking statements to reflect events
or conditions after the date of this presentation, except as may be required by law. This presentation does not constitute an offer to sell or the solicitation of an offer to buy any securities of the Company.
Other Important Information Non-GAAP Financial MeasuresCertain financial measures we use to
evaluate our performance and discuss in this presentation are identified as being “non-GAAP financial measures.” In accordance with the rules of the Securities and Exchange Commission, or the SEC, we classify a financial measure as being a
non-GAAP (generally accepted accounting principles) financial measure if that financial measure excludes or includes amounts, or is subject to adjustments that have the effect of excluding or including amounts, that are included or excluded, as
the case may be, in the most directly comparable measure calculated and presented in accordance with GAAP as in effect from time to time in the United States in our statements of operations, balance sheet, or statements of cash flows. Non-GAAP
financial measures do not include operating and other statistical measures or ratios or statistical measures calculated using exclusively either financial measures calculated in accordance with GAAP, operating measures, or other measures that
are not non-GAAP financial measures or both. The non-GAAP financial measures that we discuss in this presentation should not be considered in isolation or as a substitute for the most directly comparable or other financial measures calculated
in accordance with GAAP. Moreover, the manner in which we calculate the non-GAAP financial measures that we discuss in this presentation may differ from that of other companies’ reporting measures with similar names. You should understand how
such other banking organizations calculate their financial measures with names similar to the non-GAAP financial measures we have discussed in this presentation when comparing such non-GAAP financial measures. Tangible common equity, tangible
assets, tangible book value per share, and efficiency ratio are non-GAAP measures generally used by financial analysts and investment bankers to evaluate financial institutions. Readers of this presentation are directed to the reconciliation of
non-GAAP measures that is included in the Appendix to this presentation. We believe that these non-GAAP measures are important to many investors in the marketplace who are interested in changes from period to period in common equity, total
assets, and book value per common share exclusive of changes in intangible assets, as well as the additional context related to our expense management that the efficiency ratio provides.
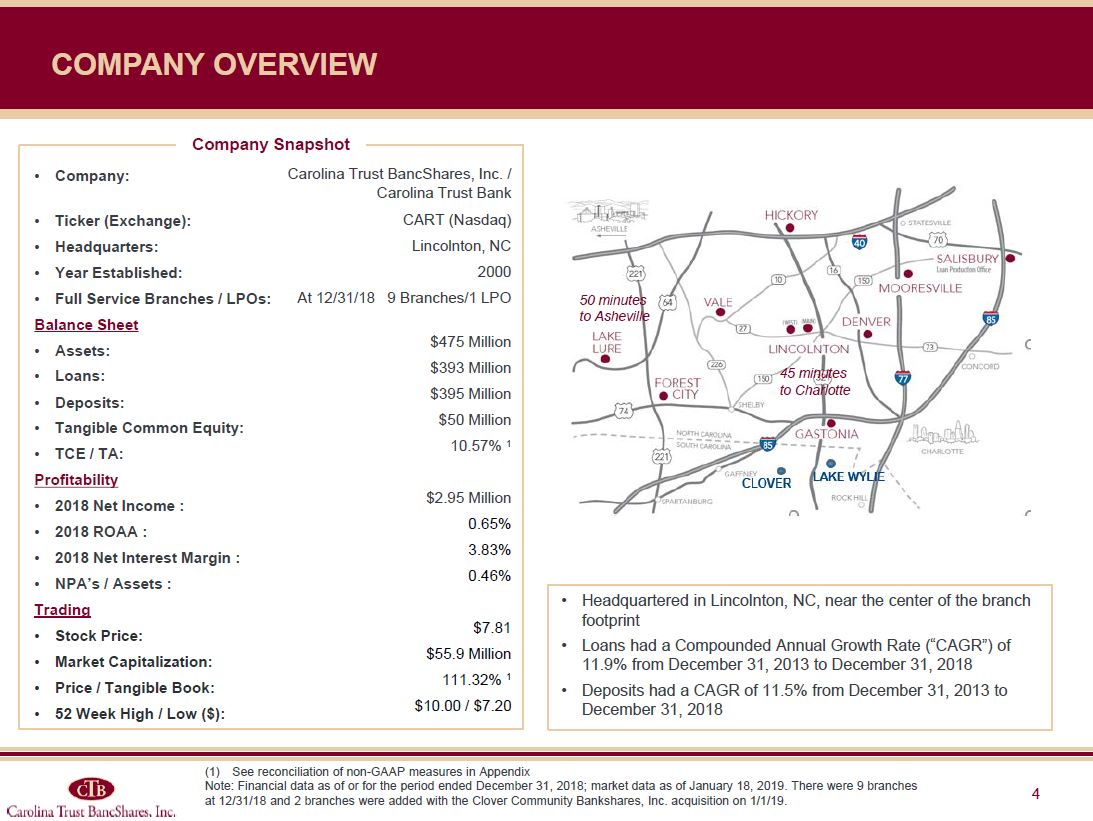
Headquartered in Lincolnton, NC, near the center of the branch footprintLoans had a
Compounded Annual Growth Rate (“CAGR”) of 11.9% from December 31, 2013 to December 31, 2018Deposits had a CAGR of 11.5% from December 31, 2013 to December 31, 2018 Company Snapshot Company:Ticker (Exchange):Headquarters:Year
Established:Full Service Branches / LPOs:Balance SheetAssets:Loans:Deposits:Tangible Common Equity:TCE / TA:Profitability2018 Net Income :2018 ROAA :2018 Net Interest Margin :NPA’s / Assets :TradingStock Price:Market Capitalization:Price /
Tangible Book:52 Week High / Low ($): Carolina Trust BancShares, Inc. / Carolina Trust BankCART (Nasdaq)Lincolnton, NC2000At 12/31/18 9 Branches/1 LPO $475 Million$393 Million$395 Million$50 Million10.57% 1$2.95 Million0.65%
3.83%0.46%$7.81$55.9 Million111.32% 1$10.00 / $7.20 See reconciliation of non-GAAP measures in AppendixNote: Financial data as of or for the period ended December 31, 2018; market data as of January 18, 2019. There were 9 branches at 12/31/18
and 2 branches were added with the Clover Community Bankshares, Inc. acquisition on 1/1/19. Company Overview 45 minutes to Charlotte 50 minutes to Asheville
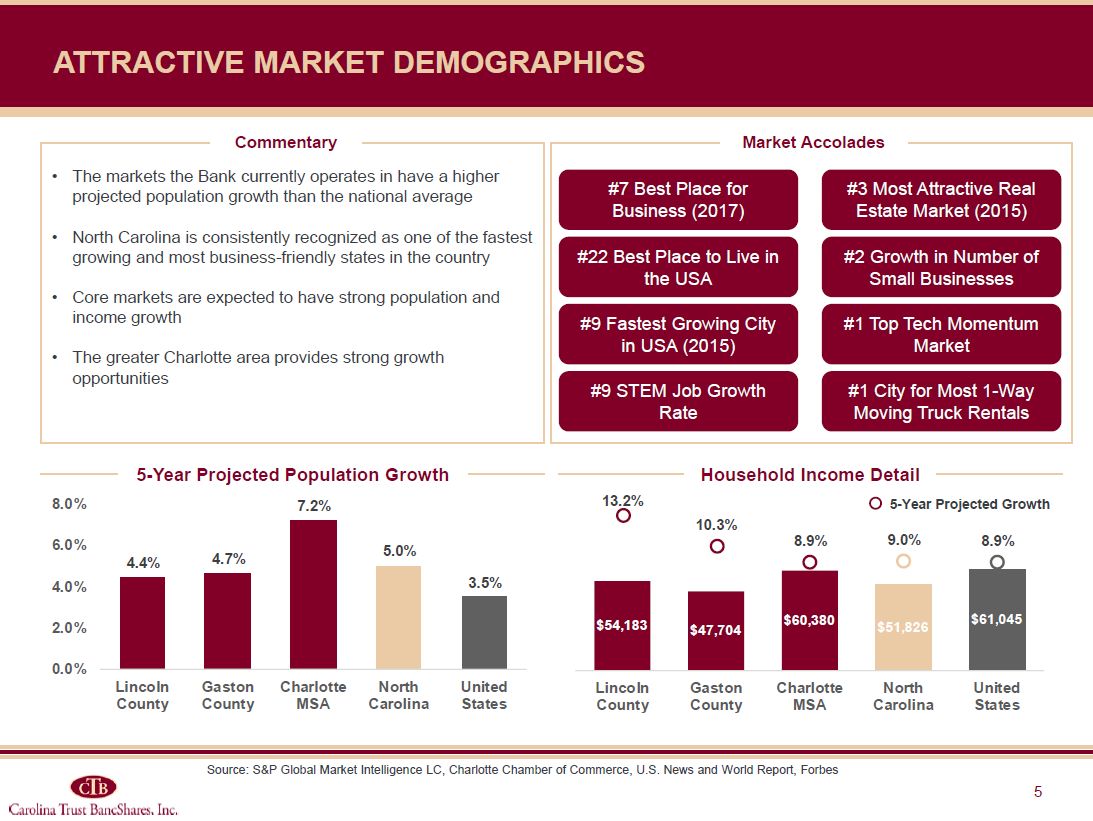
5-Year Projected Population Growth Household Income Detail Commentary The markets
the Bank currently operates in have a higher projected population growth than the national averageNorth Carolina is consistently recognized as one of the fastest growing and most business-friendly states in the country Core markets are expected
to have strong population and income growth The greater Charlotte area provides strong growth opportunities Attractive Market Demographics Source: S&P Global Market Intelligence LC, Charlotte Chamber of Commerce, U.S. News and World
Report, Forbes #7 Best Place for Business (2017) #3 Most Attractive Real Estate Market (2015) #22 Best Place to Live in the USA #9 Fastest Growing City in USA (2015) #9 STEM Job Growth Rate #2 Growth in Number of Small Businesses #1 Top
Tech Momentum Market #1 City for Most 1-Way Moving Truck Rentals Market Accolades 5-Year Projected Growth
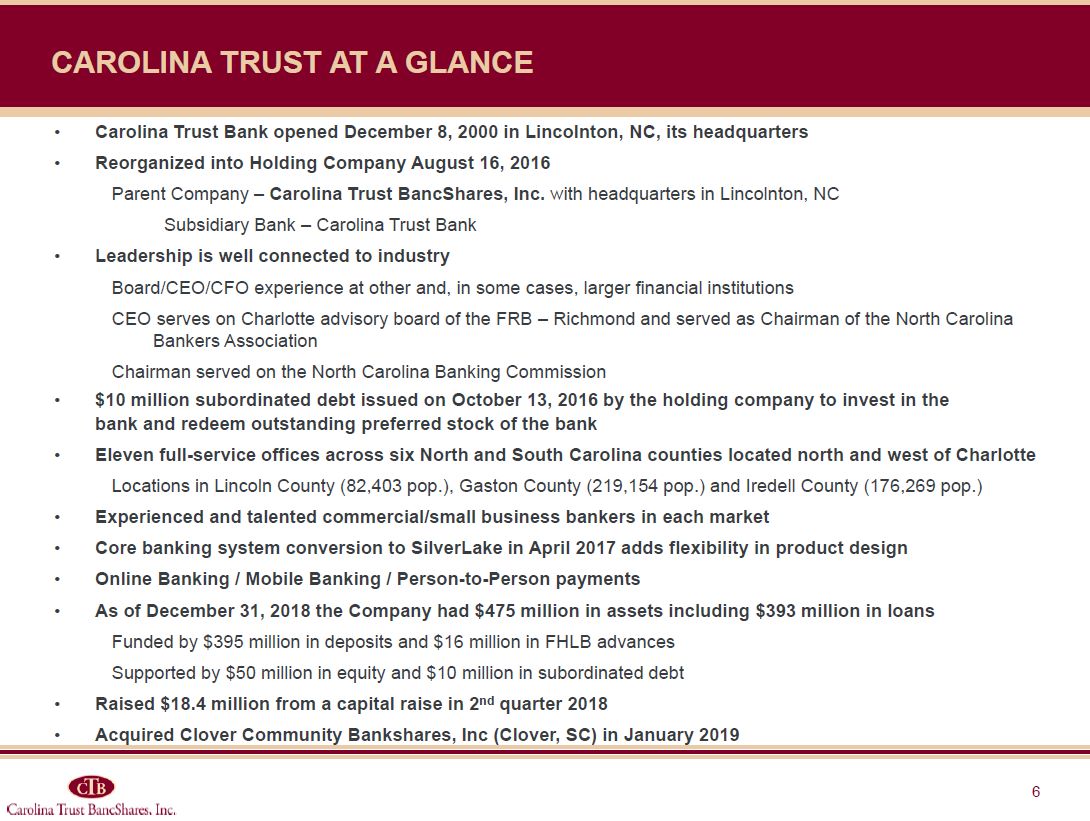
Carolina Trust at a glance Carolina Trust Bank opened December 8, 2000 in Lincolnton, NC,
its headquartersReorganized into Holding Company August 16, 2016Parent Company – Carolina Trust BancShares, Inc. with headquarters in Lincolnton, NCSubsidiary Bank – Carolina Trust Bank Leadership is well connected to industryBoard/CEO/CFO
experience at other and, in some cases, larger financial institutionsCEO serves on Charlotte advisory board of the FRB – Richmond and served as Chairman of the North Carolina Bankers AssociationChairman served on the North Carolina Banking
Commission$10 million subordinated debt issued on October 13, 2016 by the holding company to invest in the bank and redeem outstanding preferred stock of the bankEleven full-service offices across six North and South Carolina counties located
north and west of Charlotte Locations in Lincoln County (82,403 pop.), Gaston County (219,154 pop.) and Iredell County (176,269 pop.)Experienced and talented commercial/small business bankers in each marketCore banking system conversion to
SilverLake in April 2017 adds flexibility in product designOnline Banking / Mobile Banking / Person-to-Person paymentsAs of December 31, 2018 the Company had $475 million in assets including $393 million in loansFunded by $395 million in
deposits and $16 million in FHLB advancesSupported by $50 million in equity and $10 million in subordinated debt Raised $18.4 million from a capital raise in 2nd quarter 2018Acquired Clover Community Bankshares, Inc (Clover, SC) in January
2019
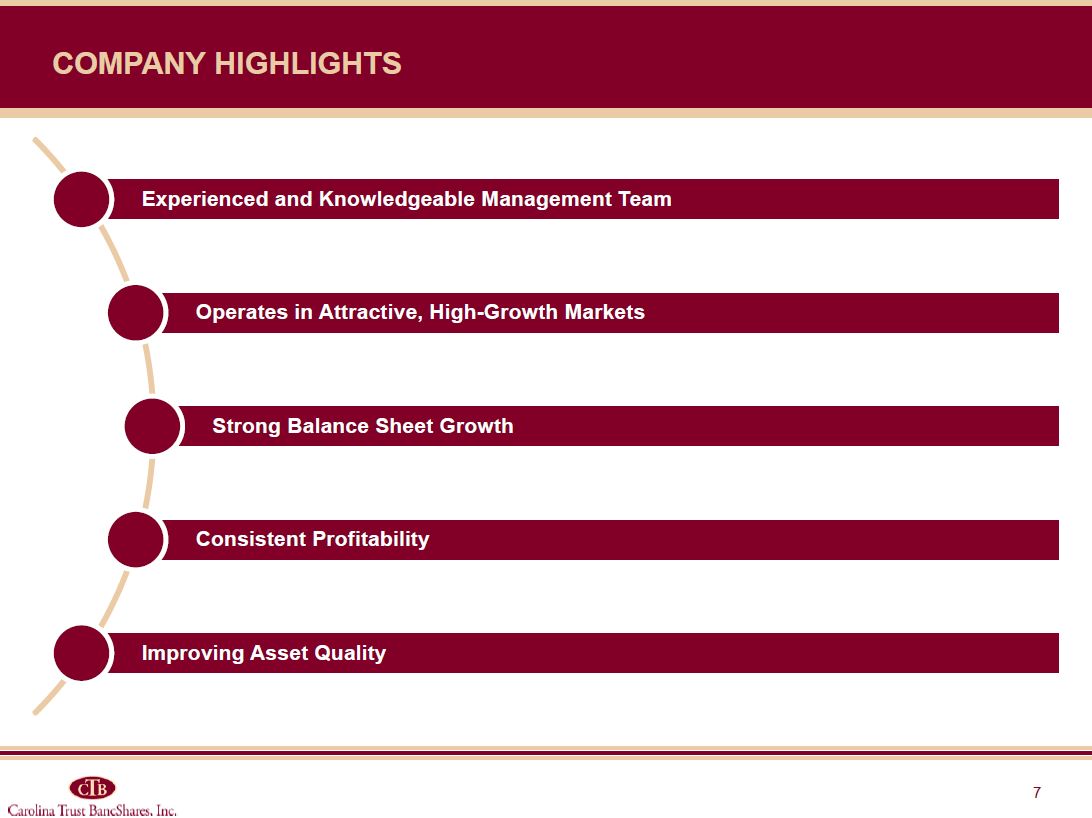
Company Highlights
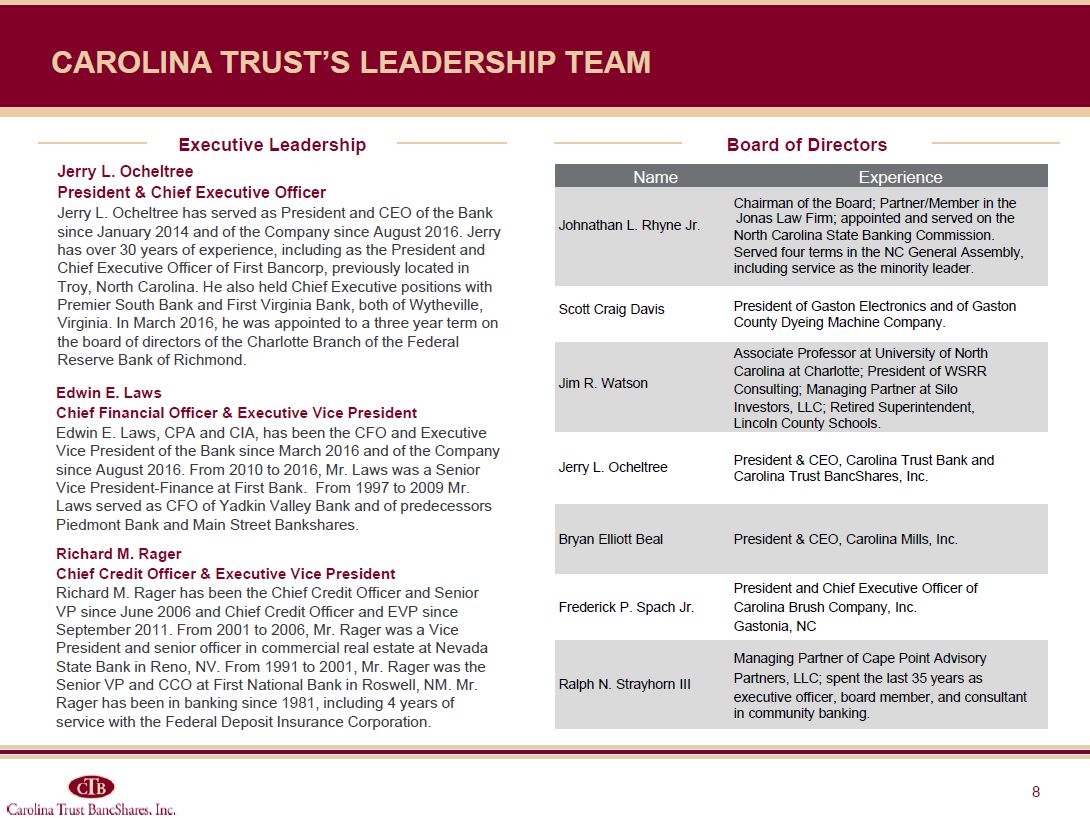
Executive Leadership Board of Directors Jerry L. OcheltreePresident & Chief
Executive OfficerJerry L. Ocheltree has served as President and CEO of the Bank since January 2014 and of the Company since August 2016. Jerry has over 30 years of experience, including as the President and Chief Executive Officer of First
Bancorp, previously located in Troy, North Carolina. He also held Chief Executive positions with Premier South Bank and First Virginia Bank, both of Wytheville, Virginia. In March 2016, he was appointed to a three year term on the board of
directors of the Charlotte Branch of the Federal Reserve Bank of Richmond. Edwin E. LawsChief Financial Officer & Executive Vice PresidentEdwin E. Laws, CPA and CIA, has been the CFO and Executive Vice President of the Bank since March
2016 and of the Company since August 2016. From 2010 to 2016, Mr. Laws was a Senior Vice President-Finance at First Bank. From 1997 to 2009 Mr. Laws served as CFO of Yadkin Valley Bank and of predecessors Piedmont Bank and Main Street
Bankshares. Name Experience Johnathan L. Rhyne Jr. Chairman of the Board; Partner/Member in the Jonas Law Firm; appointed and served on the North Carolina State Banking Commission. Served four terms in the NC General
Assembly, including service as the minority leader. Scott Craig Davis President of Gaston Electronics and of Gaston County Dyeing Machine Company. Jim R. Watson Associate Professor at University of North Carolina at Charlotte; President
of WSRR Consulting; Managing Partner at Silo Investors, LLC; Retired Superintendent, Lincoln County Schools. Jerry L. Ocheltree President & CEO, Carolina Trust Bank and Carolina Trust BancShares, Inc. Bryan Elliott Beal President
& CEO, Carolina Mills, Inc. Frederick P. Spach Jr. President and Chief Executive Officer of Carolina Brush Company, Inc. Gastonia, NC Ralph N. Strayhorn III Managing Partner of Cape Point Advisory Partners, LLC; spent the last 35
years as executive officer, board member, and consultant in community banking. Richard M. RagerChief Credit Officer & Executive Vice PresidentRichard M. Rager has been the Chief Credit Officer and Senior VP since June 2006 and Chief
Credit Officer and EVP since September 2011. From 2001 to 2006, Mr. Rager was a Vice President and senior officer in commercial real estate at Nevada State Bank in Reno, NV. From 1991 to 2001, Mr. Rager was the Senior VP and CCO at First
National Bank in Roswell, NM. Mr. Rager has been in banking since 1981, including 4 years of service with the Federal Deposit Insurance Corporation. Carolina Trust’s Leadership Team
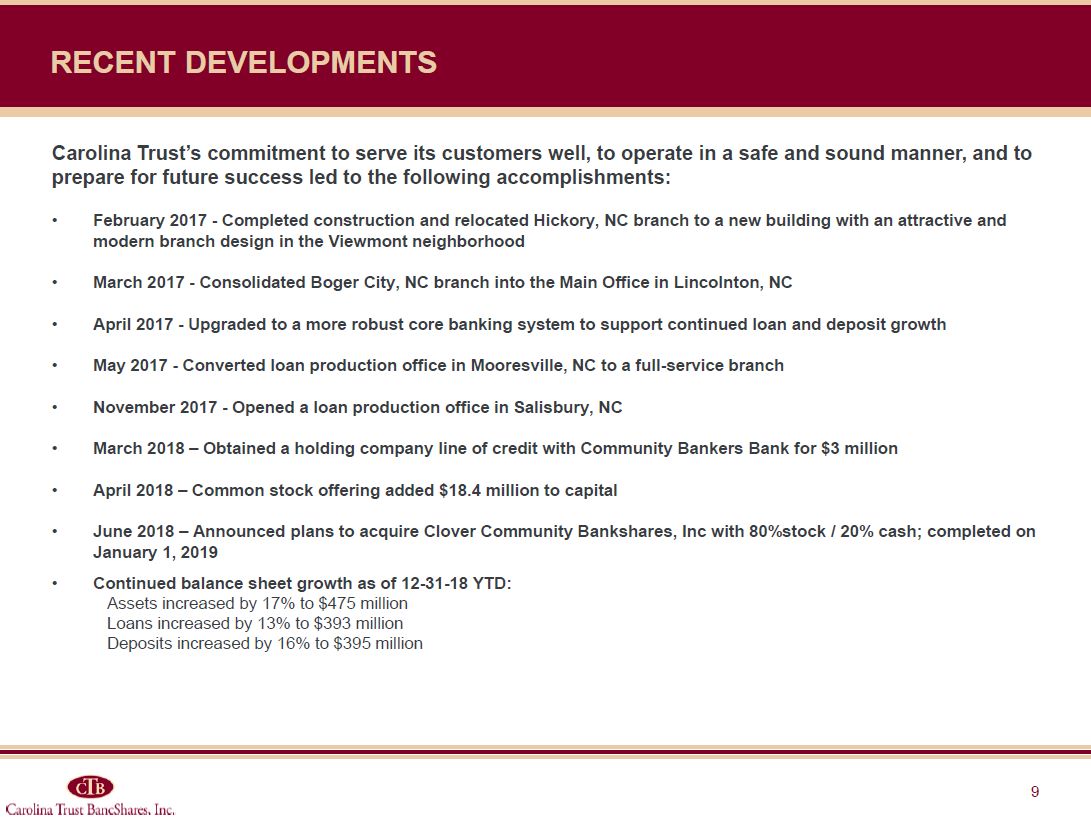
Recent DEVELOPMENTS Carolina Trust’s commitment to serve its customers well, to operate in a
safe and sound manner, and to prepare for future success led to the following accomplishments:February 2017 - Completed construction and relocated Hickory, NC branch to a new building with an attractive and modern branch design in the Viewmont
neighborhoodMarch 2017 - Consolidated Boger City, NC branch into the Main Office in Lincolnton, NCApril 2017 - Upgraded to a more robust core banking system to support continued loan and deposit growthMay 2017 - Converted loan production office
in Mooresville, NC to a full-service branchNovember 2017 - Opened a loan production office in Salisbury, NCMarch 2018 – Obtained a holding company line of credit with Community Bankers Bank for $3 millionApril 2018 – Common stock offering added
$18.4 million to capitalJune 2018 – Announced plans to acquire Clover Community Bankshares, Inc with 80%stock / 20% cash; completed on January 1, 2019Continued balance sheet growth as of 12-31-18 YTD: Assets increased by 17% to $475 million
Loans increased by 13% to $393 million Deposits increased by 16% to $395 million
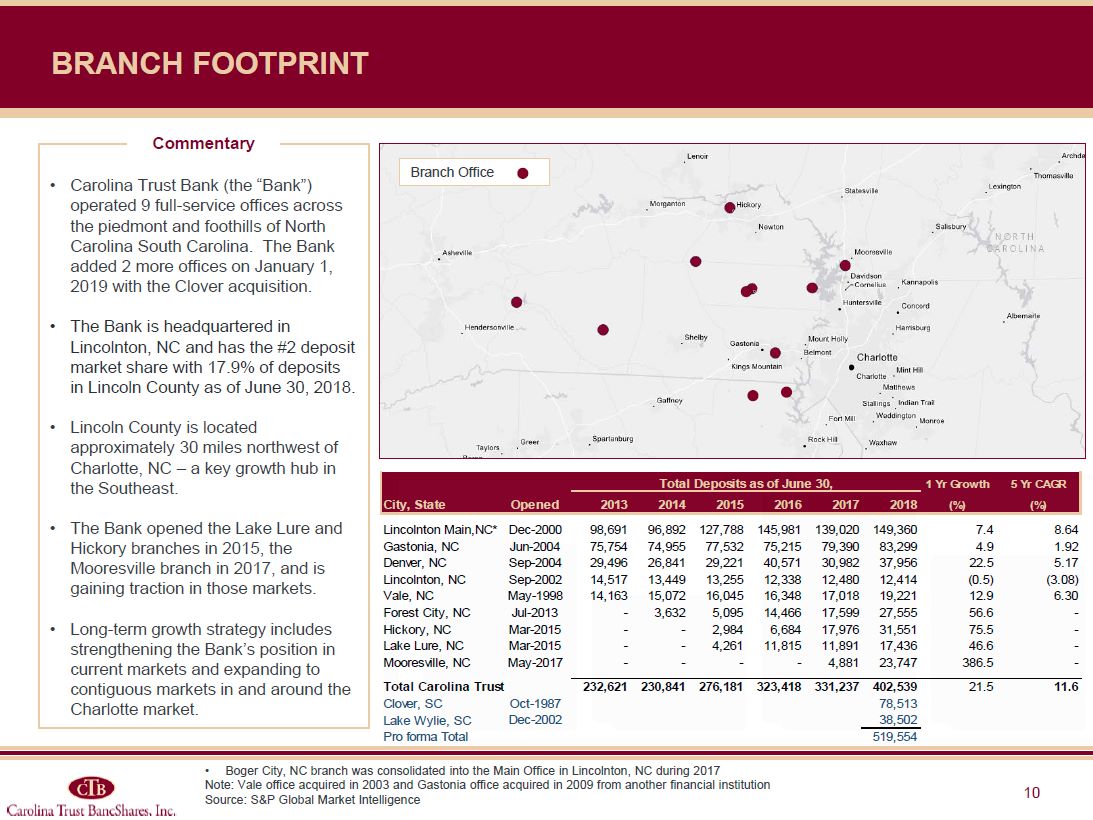
Branch Footprint Commentary Carolina Trust Bank (the “Bank”) operated 9 full-service
offices across the piedmont and foothills of North Carolina South Carolina. The Bank added 2 more offices on January 1, 2019 with the Clover acquisition.The Bank is headquartered in Lincolnton, NC and has the #2 deposit market share with 17.9%
of deposits in Lincoln County as of June 30, 2018.Lincoln County is located approximately 30 miles northwest of Charlotte, NC – a key growth hub in the Southeast.The Bank opened the Lake Lure and Hickory branches in 2015, the Mooresville branch
in 2017, and is gaining traction in those markets.Long-term growth strategy includes strengthening the Bank’s position in current markets and expanding to contiguous markets in and around the Charlotte market. Branch Office Boger City, NC
branch was consolidated into the Main Office in Lincolnton, NC during 2017Note: Vale office acquired in 2003 and Gastonia office acquired in 2009 from another financial institutionSource: S&P Global Market Intelligence
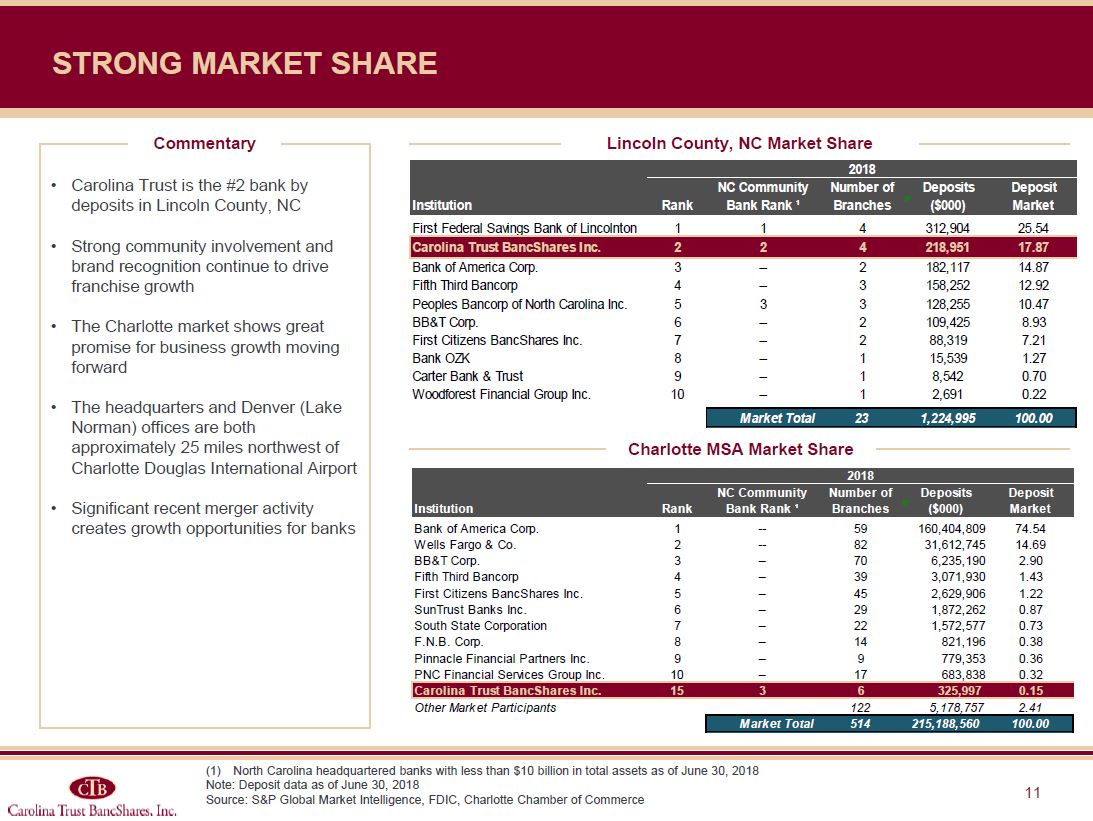
Lincoln County, NC Market Share Charlotte MSA Market Share Commentary Carolina Trust is
the #2 bank by deposits in Lincoln County, NCStrong community involvement and brand recognition continue to drive franchise growthThe Charlotte market shows great promise for business growth moving forwardThe headquarters and Denver (Lake
Norman) offices are both approximately 25 miles northwest of Charlotte Douglas International AirportSignificant recent merger activity creates growth opportunities for banks Strong MARKET sHARE North Carolina headquartered banks with less
than $10 billion in total assets as of June 30, 2018Note: Deposit data as of June 30, 2018Source: S&P Global Market Intelligence, FDIC, Charlotte Chamber of Commerce
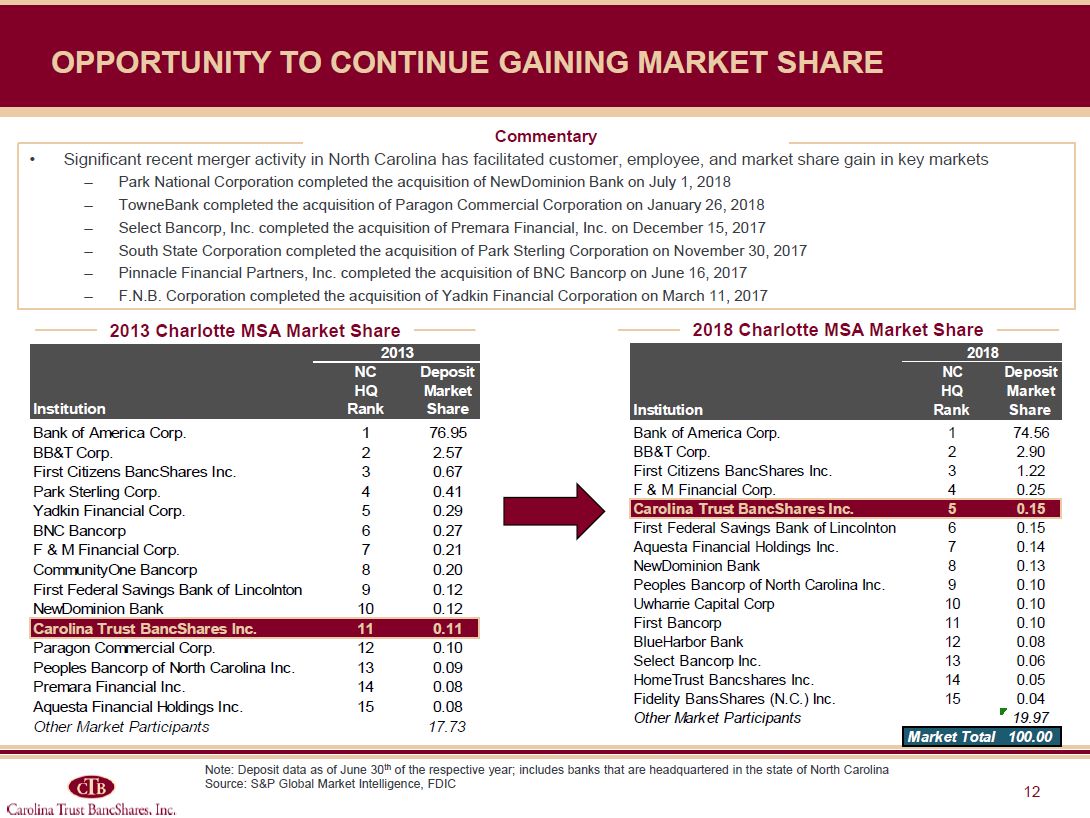
Opportunity to continue gaining market share Significant recent merger activity in North
Carolina has facilitated customer, employee, and market share gain in key marketsPark National Corporation completed the acquisition of NewDominion Bank on July 1, 2018TowneBank completed the acquisition of Paragon Commercial Corporation on
January 26, 2018Select Bancorp, Inc. completed the acquisition of Premara Financial, Inc. on December 15, 2017South State Corporation completed the acquisition of Park Sterling Corporation on November 30, 2017Pinnacle Financial Partners, Inc.
completed the acquisition of BNC Bancorp on June 16, 2017F.N.B. Corporation completed the acquisition of Yadkin Financial Corporation on March 11, 2017 Commentary 2013 Charlotte MSA Market Share 2018 Charlotte MSA Market Share Note:
Deposit data as of June 30th of the respective year; includes banks that are headquartered in the state of North CarolinaSource: S&P Global Market Intelligence, FDIC
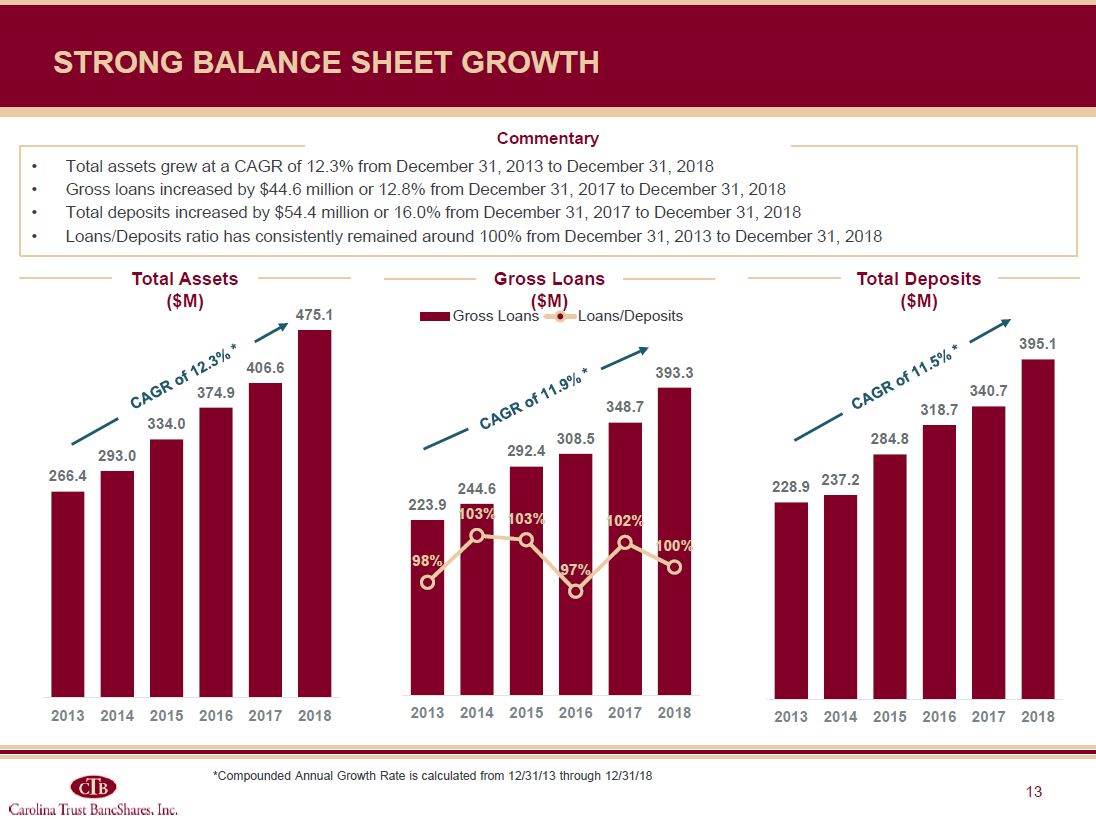
Strong Balance Sheet Growth Total Assets ($M) Gross Loans ($M) Total Deposits
($M) CAGR of 12.3% * CAGR of 11.5% * CAGR of 11.9% * Total assets grew at a CAGR of 12.3% from December 31, 2013 to December 31, 2018Gross loans increased by $44.6 million or 12.8% from December 31, 2017 to December 31, 2018Total deposits
increased by $54.4 million or 16.0% from December 31, 2017 to December 31, 2018 Loans/Deposits ratio has consistently remained around 100% from December 31, 2013 to December 31, 2018 Commentary *Compounded Annual Growth Rate is calculated
from 12/31/13 through 12/31/18
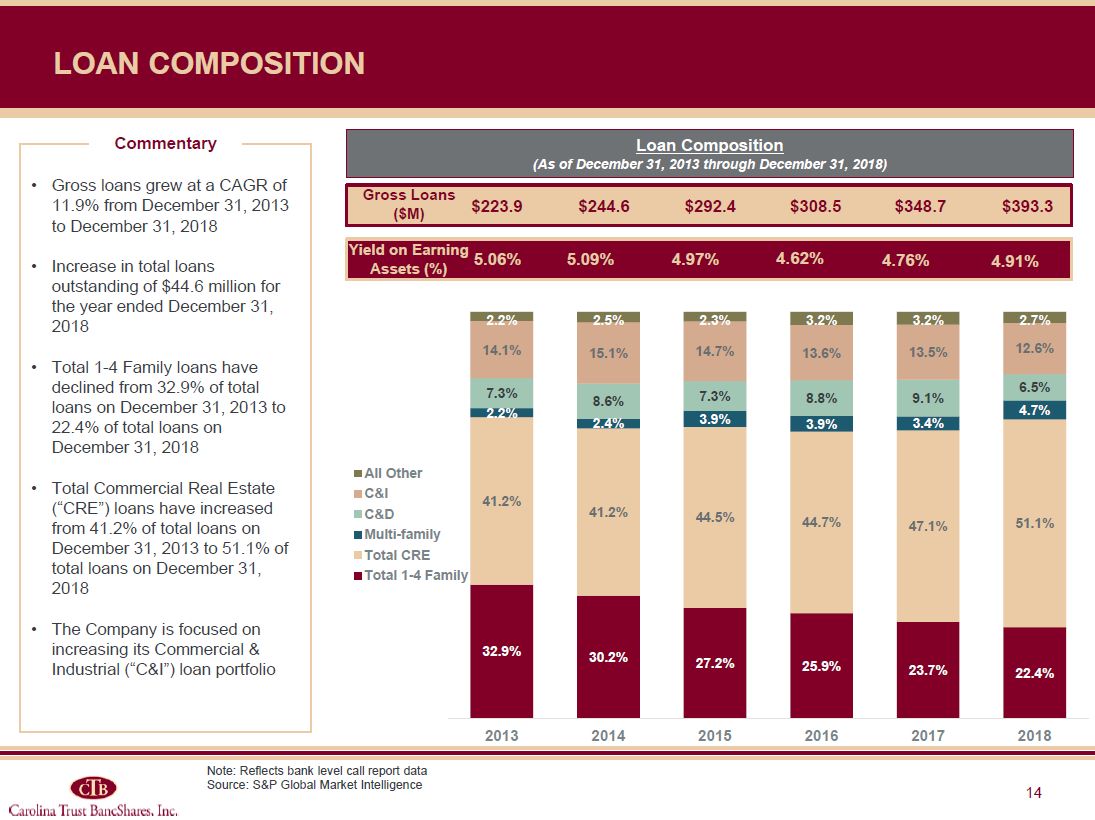
Commentary Loan Composition (As of December 31, 2013 through December 31, 2018) Gross
loans grew at a CAGR of 11.9% from December 31, 2013 to December 31, 2018Increase in total loans outstanding of $44.6 million for the year ended December 31, 2018Total 1-4 Family loans have declined from 32.9% of total loans on December 31,
2013 to 22.4% of total loans on December 31, 2018Total Commercial Real Estate (“CRE”) loans have increased from 41.2% of total loans on December 31, 2013 to 51.1% of total loans on December 31, 2018The Company is focused on increasing its
Commercial & Industrial (“C&I”) loan portfolio ($millions) Loan Composition Note: Reflects bank level call report dataSource: S&P Global Market Intelligence Gross Loans
($M) $223.9 $244.6 $292.4 $393.3 $308.5 $348.7 Yield on Earning Assets (%) 5.06% 5.09% 4.97% 4.91% 4.62% 4.76%
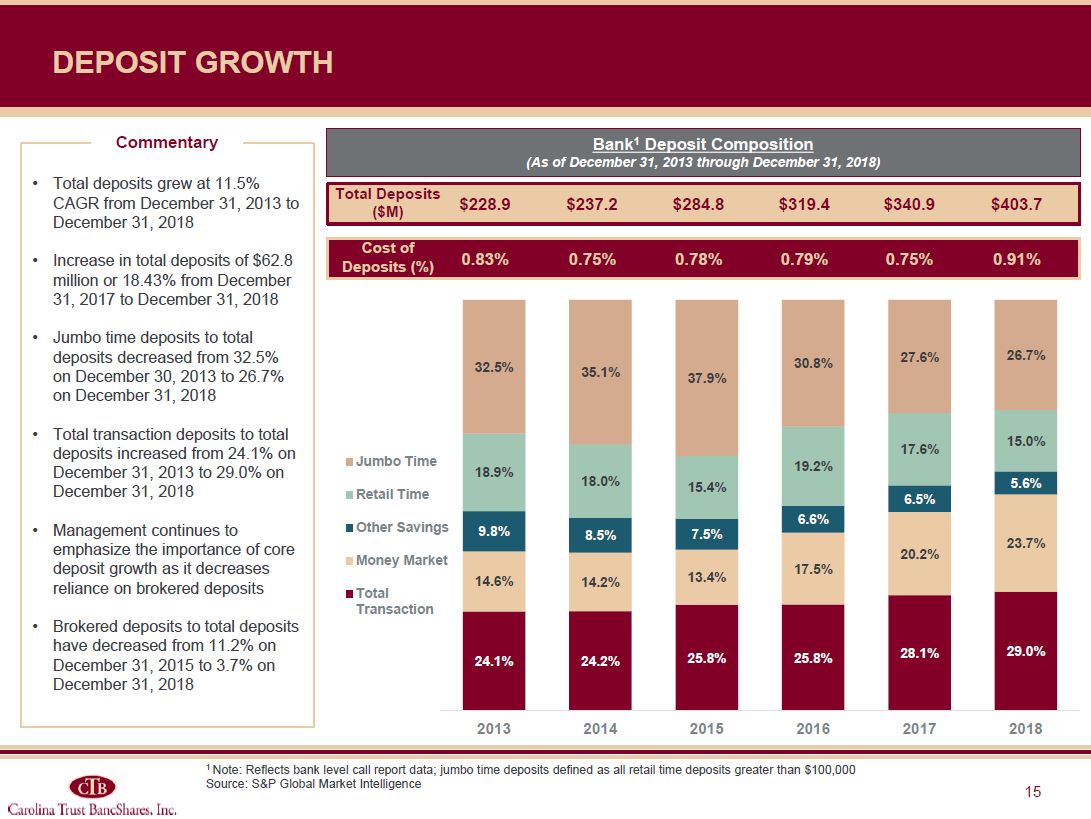
Commentary ($ millions) Total deposits grew at 11.5% CAGR from December 31, 2013 to
December 31, 2018Increase in total deposits of $62.8 million or 18.43% from December 31, 2017 to December 31, 2018Jumbo time deposits to total deposits decreased from 32.5% on December 30, 2013 to 26.7% on December 31, 2018Total transaction
deposits to total deposits increased from 24.1% on December 31, 2013 to 29.0% on December 31, 2018Management continues to emphasize the importance of core deposit growth as it decreases reliance on brokered depositsBrokered deposits to total
deposits have decreased from 11.2% on December 31, 2015 to 3.7% on December 31, 2018 ($ millions) Deposit Growth 1 Note: Reflects bank level call report data; jumbo time deposits defined as all retail time deposits greater than
$100,000Source: S&P Global Market Intelligence Bank1 Deposit Composition (As of December 31, 2013 through December 31, 2018) Total Deposits ($M) $228.9 $237.2 $284.8 $403.7 $319.4 $340.9 Cost of Deposits
(%) 0.83% 0.75% 0.78% 0.91% 0.79% 0.75%
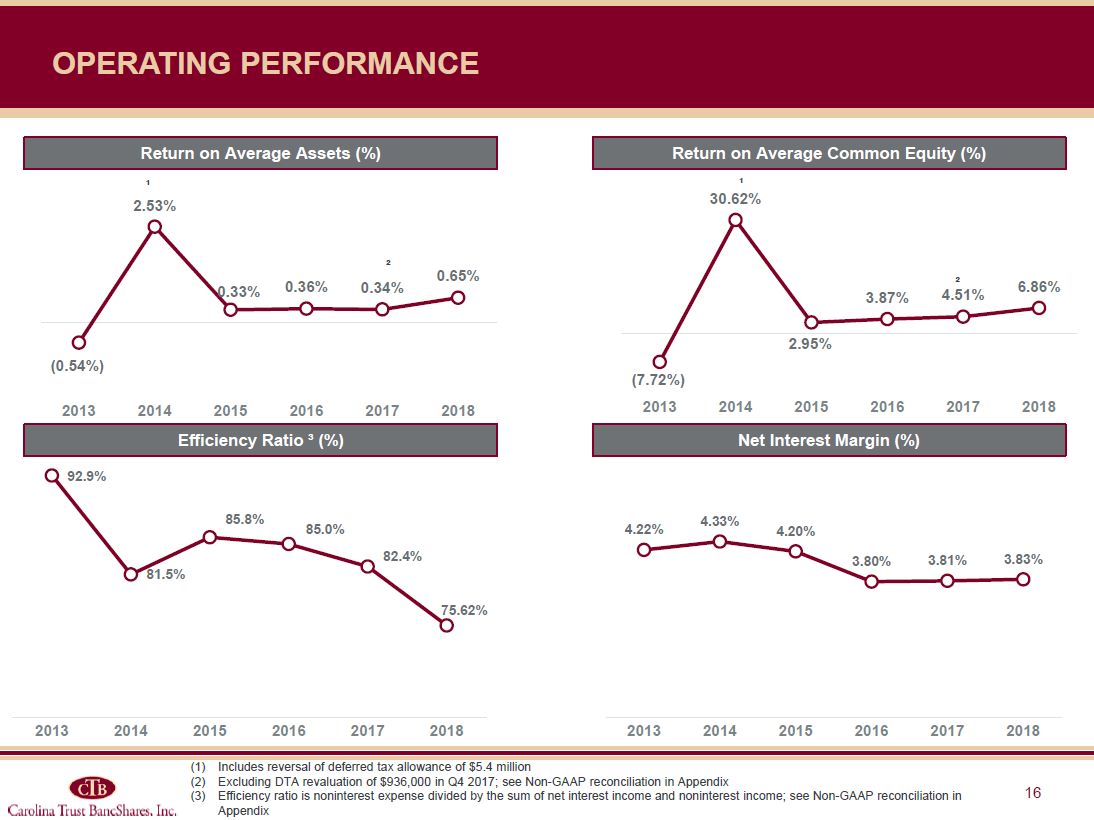
Operating Performance Return on Average Assets (%) Return on Average Common Equity
(%) Efficiency Ratio ³ (%) Net Interest Margin (%) Includes reversal of deferred tax allowance of $5.4 millionExcluding DTA revaluation of $936,000 in Q4 2017; see Non-GAAP reconciliation in AppendixEfficiency ratio is noninterest expense
divided by the sum of net interest income and noninterest income; see Non-GAAP reconciliation in Appendix ² ² ¹ ¹
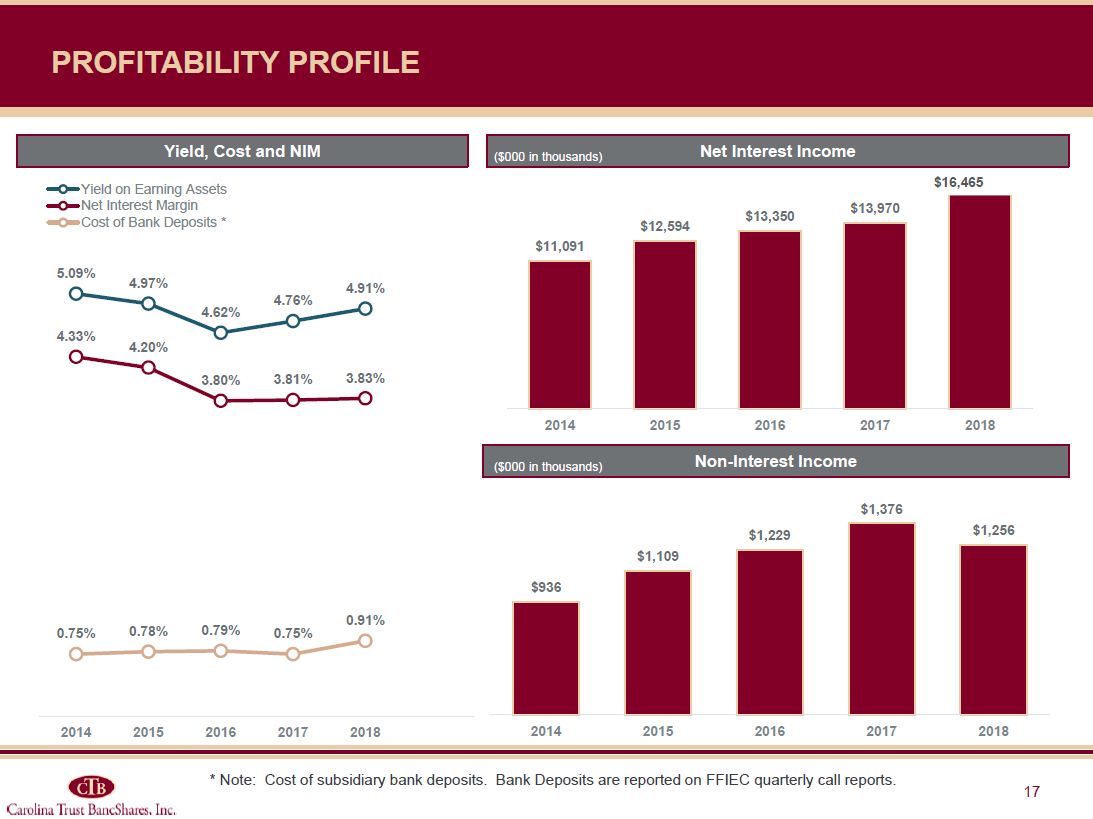
Profitability Profile Net Interest Income ($000 in thousands) Non-Interest Income ($000
in thousands) Yield, Cost and NIM $16,465 * Note: Cost of subsidiary bank deposits. Bank Deposits are reported on FFIEC quarterly call reports.
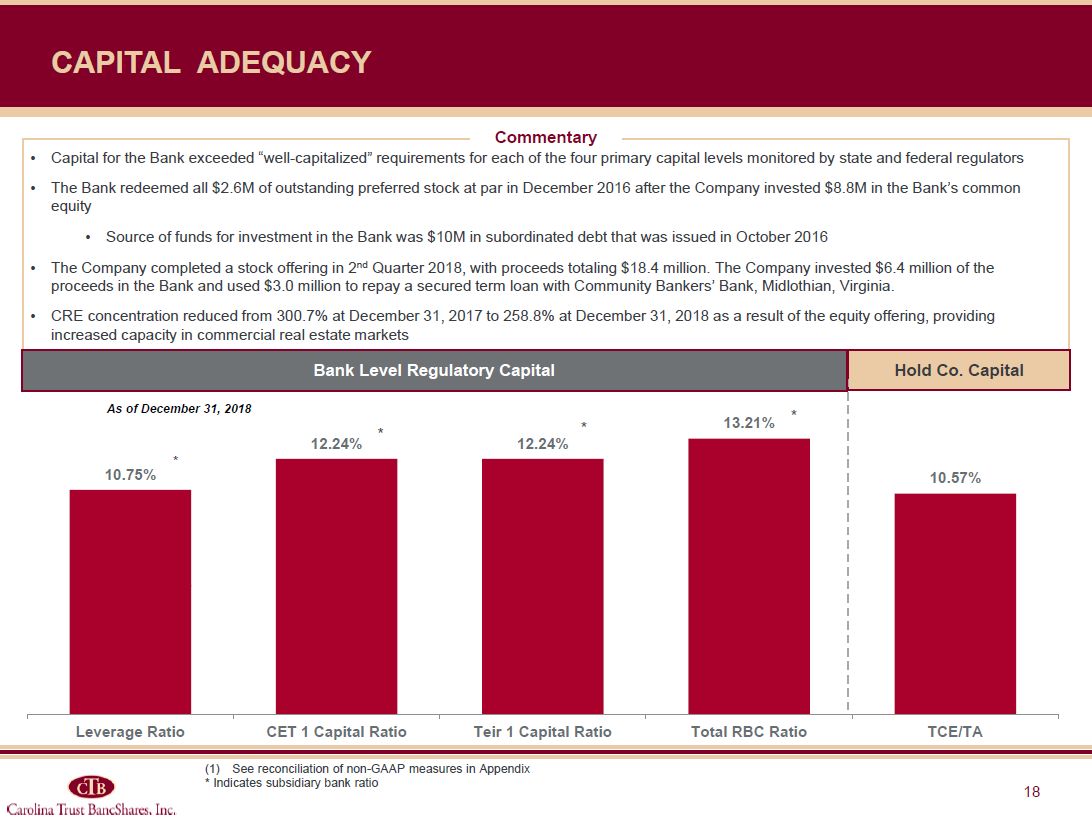
Capital Adequacy Commentary Capital for the Bank exceeded “well-capitalized” requirements
for each of the four primary capital levels monitored by state and federal regulatorsThe Bank redeemed all $2.6M of outstanding preferred stock at par in December 2016 after the Company invested $8.8M in the Bank’s common equitySource of funds
for investment in the Bank was $10M in subordinated debt that was issued in October 2016The Company completed a stock offering in 2nd Quarter 2018, with proceeds totaling $18.4 million. The Company invested $6.4 million of the proceeds in the
Bank and used $3.0 million to repay a secured term loan with Community Bankers’ Bank, Midlothian, Virginia.CRE concentration reduced from 300.7% at December 31, 2017 to 258.8% at December 31, 2018 as a result of the equity offering, providing
increased capacity in commercial real estate markets Hold Co. Capital Bank Level Regulatory Capital See reconciliation of non-GAAP measures in Appendix* Indicates subsidiary bank ratio * * * * 5.00% 6.50% 8.00% 10.00% * * * As of
December 31, 2018
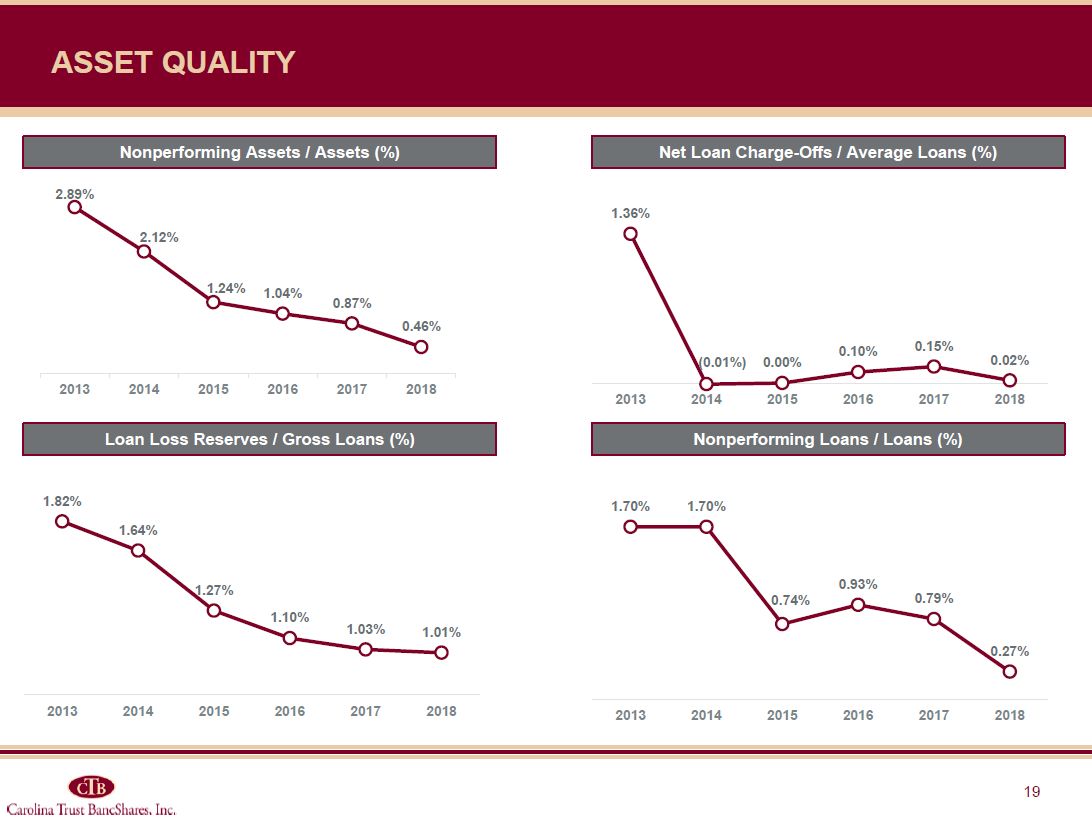
Asset Quality Nonperforming Assets / Assets (%) Net Loan Charge-Offs / Average Loans
(%) Loan Loss Reserves / Gross Loans (%) Nonperforming Loans / Loans (%)
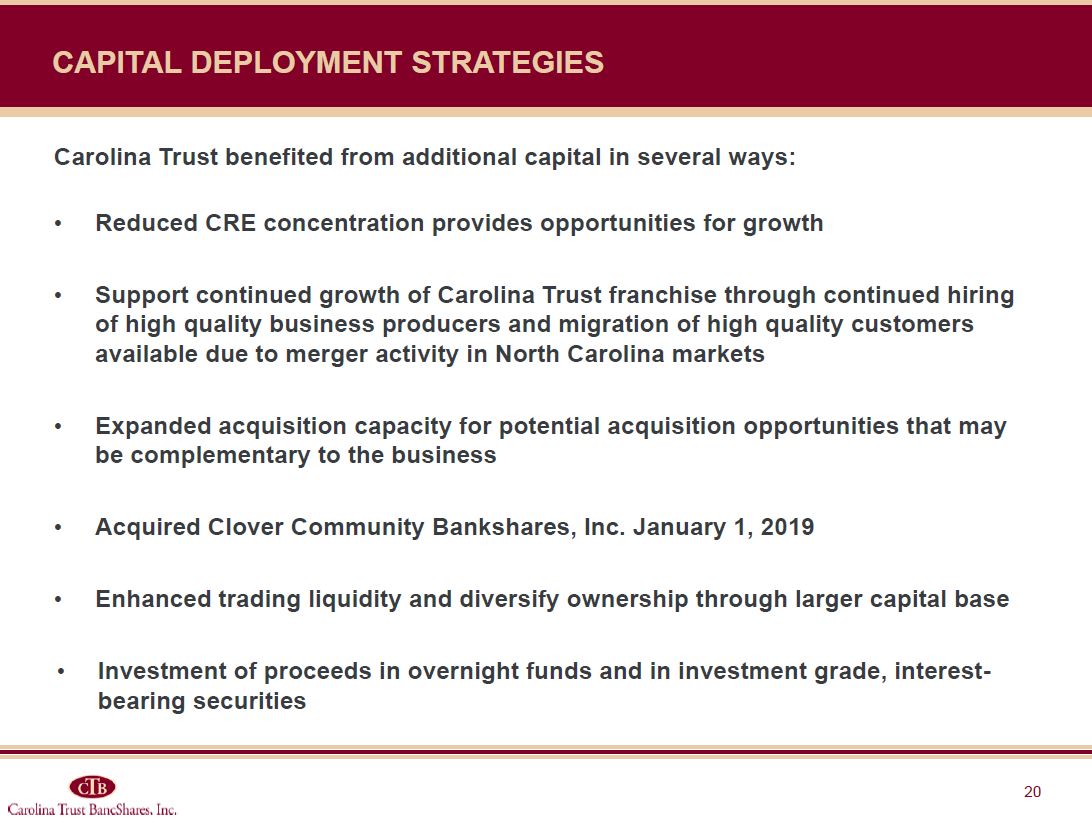
Capital Deployment Strategies Carolina Trust benefited from additional capital in several
ways:Reduced CRE concentration provides opportunities for growthSupport continued growth of Carolina Trust franchise through continued hiring of high quality business producers and migration of high quality customers available due to merger
activity in North Carolina marketsExpanded acquisition capacity for potential acquisition opportunities that may be complementary to the businessAcquired Clover Community Bankshares, Inc. January 1, 2019Enhanced trading liquidity and diversify
ownership through larger capital baseInvestment of proceeds in overnight funds and in investment grade, interest-bearing securities
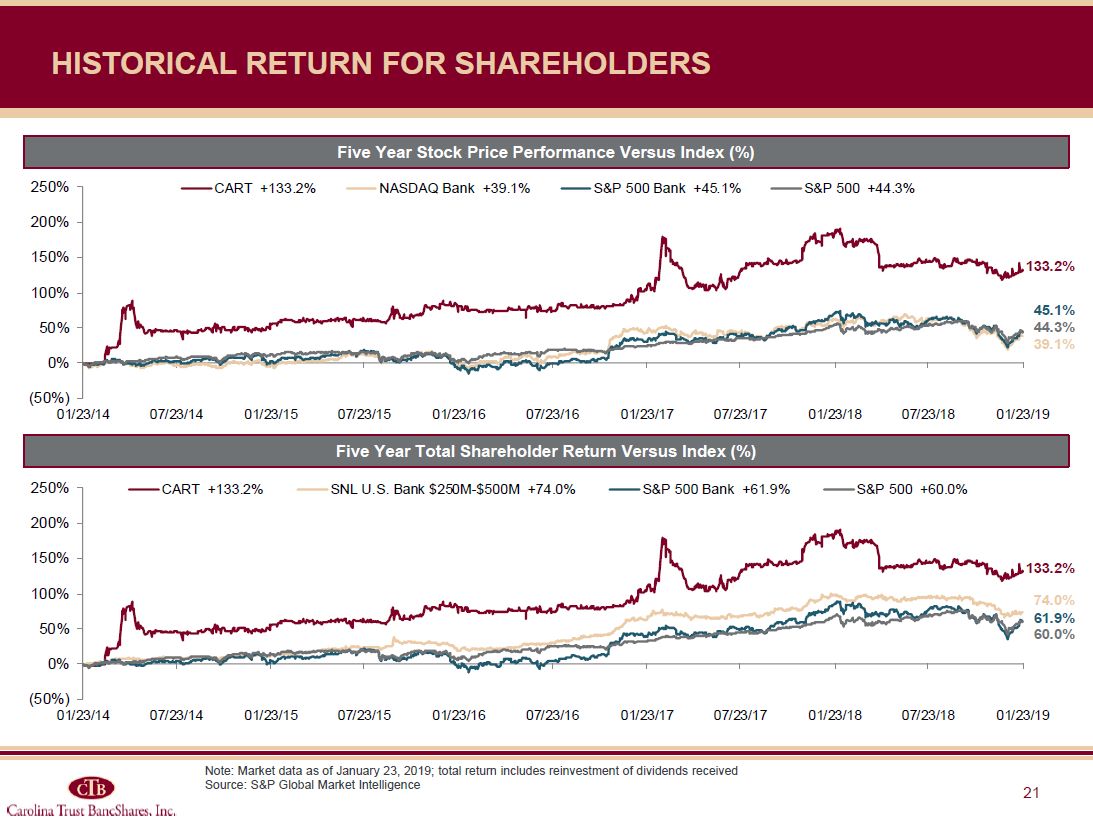
Historical return for shareholders Note: Market data as of January 23, 2019; total return
includes reinvestment of dividends receivedSource: S&P Global Market Intelligence Five Year Stock Price Performance Versus Index (%) Five Year Total Shareholder Return Versus Index (%)
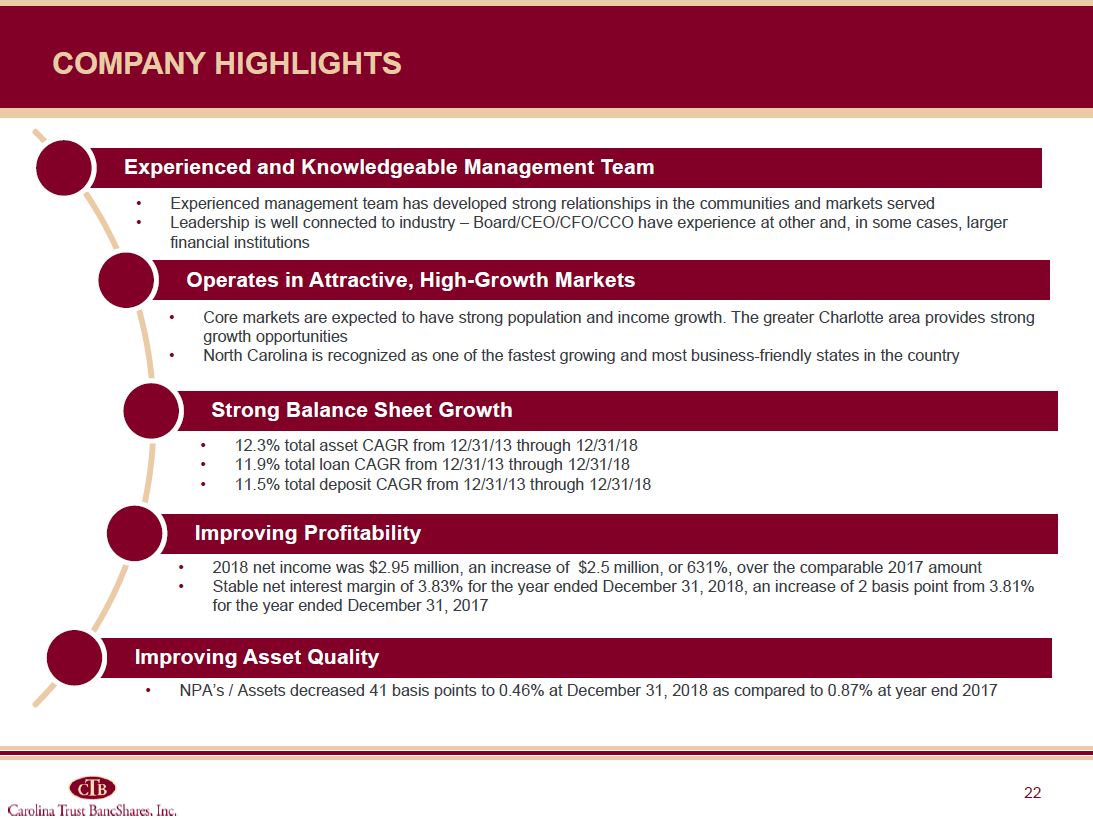
Core markets are expected to have strong population and income growth. The greater Charlotte
area provides strong growth opportunitiesNorth Carolina is recognized as one of the fastest growing and most business-friendly states in the country company Highlights Experienced management team has developed strong relationships in the
communities and markets servedLeadership is well connected to industry – Board/CEO/CFO/CCO have experience at other and, in some cases, larger financial institutions 12.3% total asset CAGR from 12/31/13 through 12/31/1811.9% total loan CAGR
from 12/31/13 through 12/31/1811.5% total deposit CAGR from 12/31/13 through 12/31/18 2018 net income was $2.95 million, an increase of $2.5 million, or 631%, over the comparable 2017 amountStable net interest margin of 3.83% for the year
ended December 31, 2018, an increase of 2 basis point from 3.81% for the year ended December 31, 2017 NPA’s / Assets decreased 41 basis points to 0.46% at December 31, 2018 as compared to 0.87% at year end 2017
Appendix
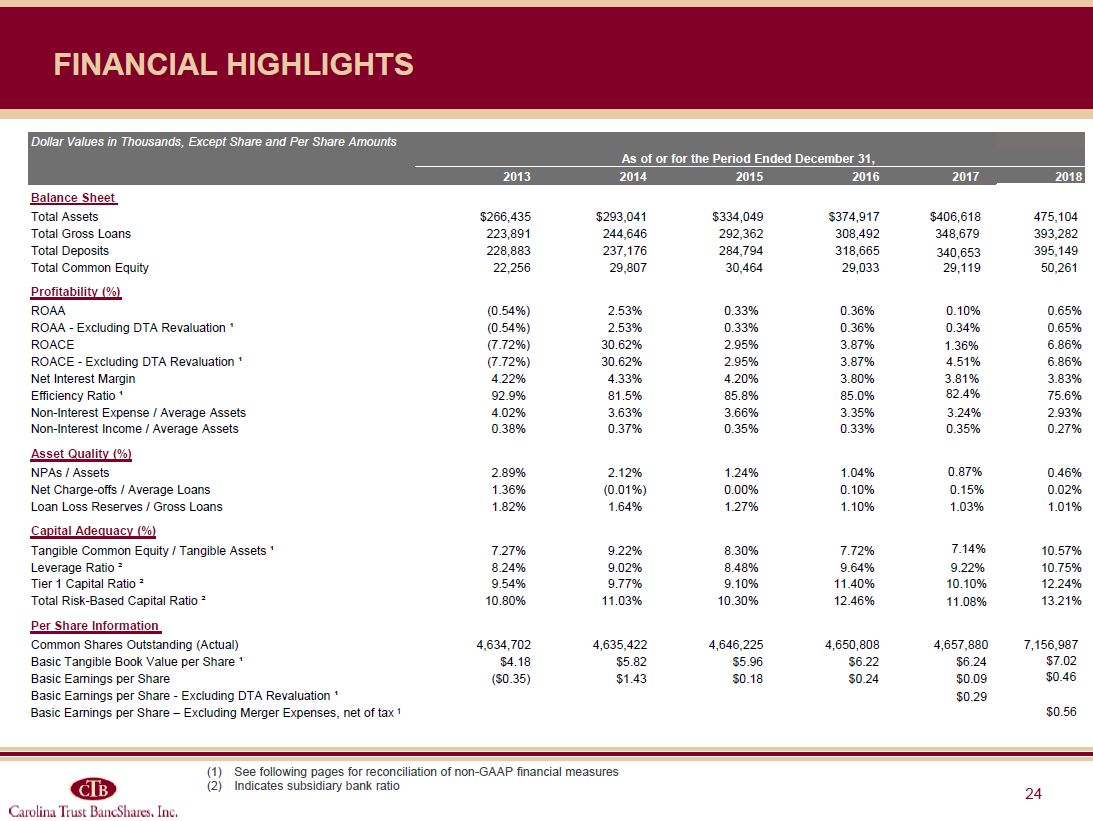
Financial Highlights See following pages for reconciliation of non-GAAP financial
measuresIndicates subsidiary bank ratio Dollar Values in Thousands, Except Share and Per Share Amounts 2013 2014 2015 2016 2017 2018 Balance Sheet Total Assets $266,435 $293,041 $334,049 $374,917 $406,618 475,104
Total Gross Loans 223,891 244,646 292,362 308,492 348,679 393,282 Total Deposits 228,883 237,176 284,794 318,665 340,653 395,149 Total Common
Equity 22,256 29,807 30,464 29,033 29,119 50,261 Profitability (%) ROAA (0.54%) 2.53% 0.33% 0.36% 0.10% 0.65% ROAA - Excluding DTA Revaluation
¹ (0.54%) 2.53% 0.33% 0.36% 0.34% 0.65% ROACE (7.72%) 30.62% 2.95% 3.87% 1.36% 6.86% ROACE - Excluding DTA Revaluation ¹ (7.72%) 30.62% 2.95% 3.87% 4.51% 6.86% Net Interest
Margin 4.22% 4.33% 4.20% 3.80% 3.81% 3.83% Efficiency Ratio ¹ 92.9% 81.5% 85.8% 85.0% 82.4% 75.6% Non-Interest Expense / Average Assets 4.02% 3.63% 3.66% 3.35% 3.24% 2.93% Non-Interest Income / Average
Assets 0.38% 0.37% 0.35% 0.33% 0.35% 0.27% Asset Quality (%) NPAs / Assets 2.89% 2.12% 1.24% 1.04% 0.87% 0.46% Net Charge-offs / Average Loans 1.36% (0.01%) 0.00% 0.10% 0.15% 0.02% Loan Loss Reserves / Gross
Loans 1.82% 1.64% 1.27% 1.10% 1.03% 1.01% Capital Adequacy (%) Tangible Common Equity / Tangible Assets ¹ 7.27% 9.22% 8.30% 7.72% 7.14% 10.57% Leverage Ratio ² 8.24% 9.02% 8.48% 9.64% 9.22% 10.75% Tier 1 Capital Ratio
² 9.54% 9.77% 9.10% 11.40% 10.10% 12.24% Total Risk-Based Capital Ratio ² 10.80% 11.03% 10.30% 12.46% 11.08% 13.21% Per Share Information Common Shares Outstanding (Actual) 4,634,702 4,635,422 4,646,225
4,650,808 4,657,880 7,156,987 Basic Tangible Book Value per Share ¹ $4.18 $5.82 $5.96 $6.22 $6.24 $7.02 Basic Earnings per Share ($0.35) $1.43 $0.18 $0.24 $0.09 $0.46 Basic Earnings per Share -
Excluding DTA Revaluation ¹ $0.29 $0.56 As of or for the Period Ended December 31, Basic Earnings per Share – Excluding Merger Expenses, net of tax 1
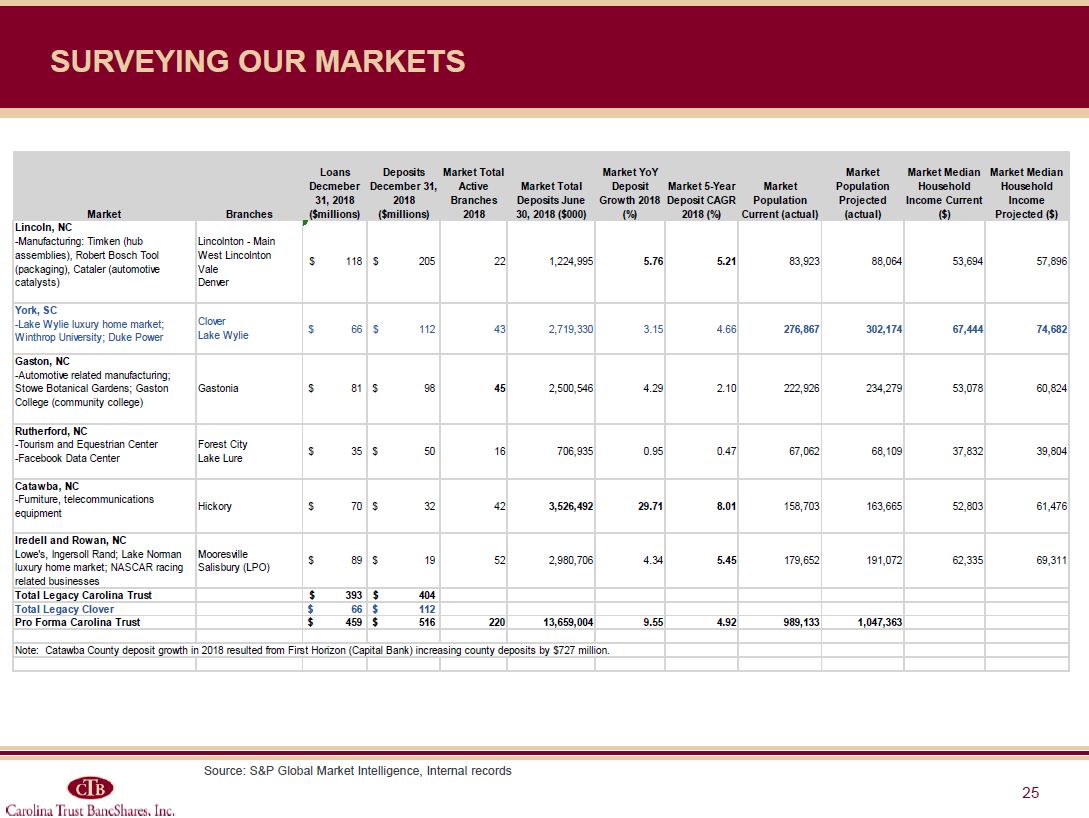
Source: S&P Global Market Intelligence, Internal records Surveying our Markets
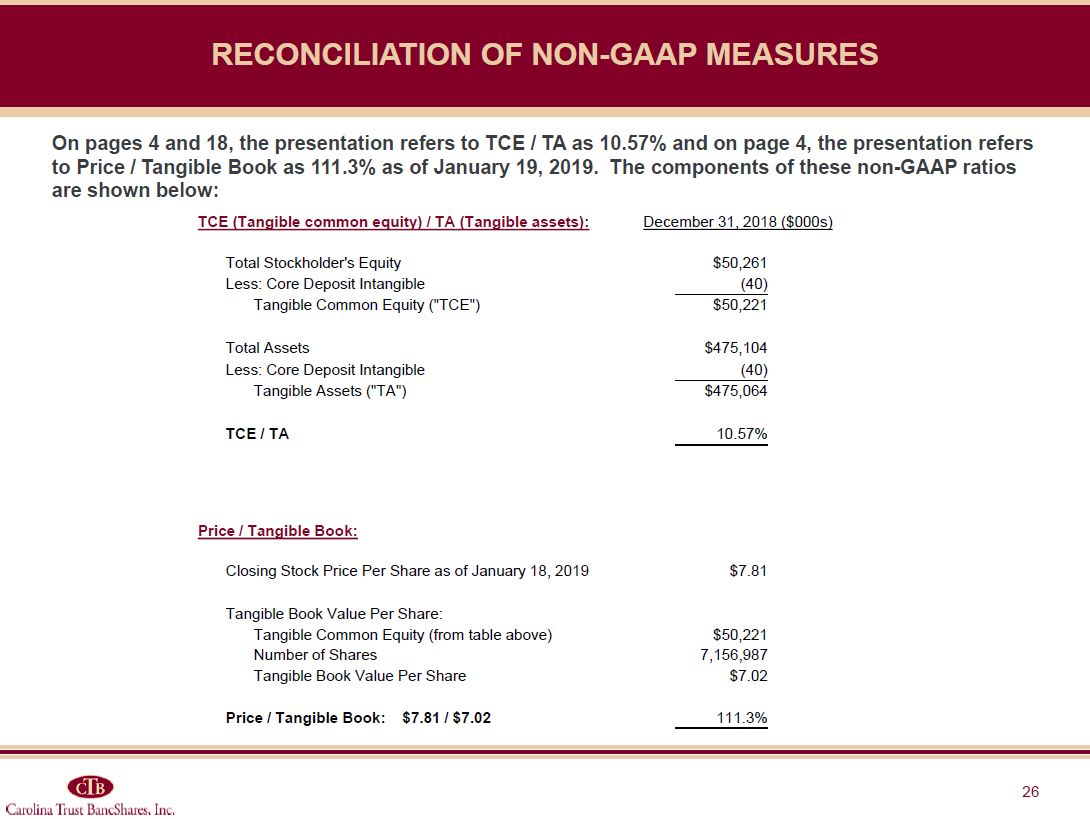
Reconciliation of Non-GAAP Measures On pages 4 and 18, the presentation refers to TCE / TA
as 10.57% and on page 4, the presentation refers to Price / Tangible Book as 111.3% as of January 19, 2019. The components of these non-GAAP ratios are shown below: TCE (Tangible common equity) / TA (Tangible assets): December 31, 2018
($000s) Total Stockholder’s Equity $50,261 Less: Core Deposit Intangible (40) Tangible Common Equity (“TCE”) $50,221 Total Assets $475,104 Less: Core Deposit Intangible (40) Tangible Assets
(“TA”) $475,064 TCE / TA 10.57% Price / Tangible Book: Closing Stock Price Per Share as of January 18, 2019 $7.81 Tangible Book Value Per Share: Tangible Common
Equity (from table above) $50,221 Number of Shares 7,156,987 Tangible Book Value Per Share $7.02 Price / Tangible Book: $7.81 / $7.02 111.3%
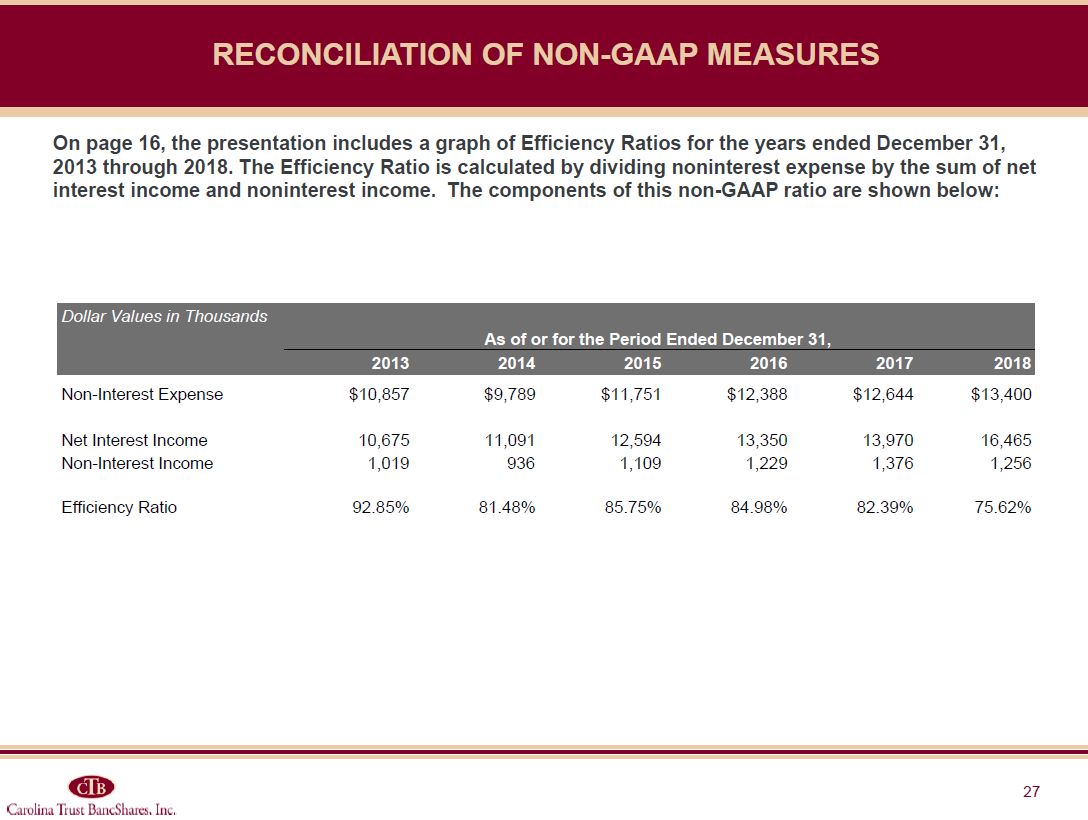
On page 16, the presentation includes a graph of Efficiency Ratios for the years ended
December 31, 2013 through 2018. The Efficiency Ratio is calculated by dividing noninterest expense by the sum of net interest income and noninterest income. The components of this non-GAAP ratio are shown below: Reconciliation of Non-GAAP
Measures Nine Months Ended Dollar Values in Thousands 2013 2014 2015 2016 2017 2018 Non-Interest Expense $10,857 $9,789 $11,751 $12,388 $12,644 $13,400 Net Interest Income 10,675 11,091 12,594 13,350
13,970 16,465 Non-Interest Income 1,019 936 1,109 1,229 1,376 1,256 Efficiency Ratio 92.85% 81.48% 85.75% 84.98% 82.39% 75.62% As of or for the Period Ended December 31,
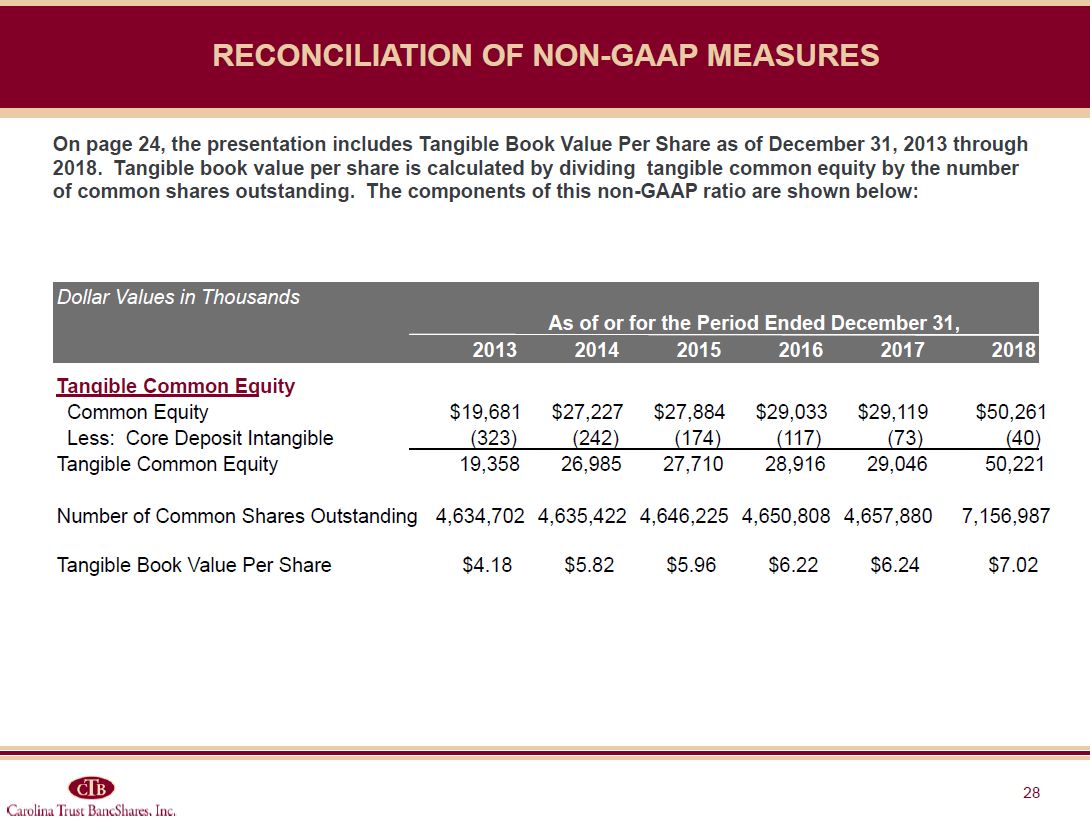
Reconciliation of Non-GAAP Measures On page 24, the presentation includes Tangible Book
Value Per Share as of December 31, 2013 through 2018. Tangible book value per share is calculated by dividing tangible common equity by the number of common shares outstanding. The components of this non-GAAP ratio are shown below: Dollar
Values in Thousands 2013 2014 2015 2016 2017 2018 Tangible Common Equity Common Equity $19,681 $27,227 $27,884 $29,033 $29,119 $50,261 Less: Core Deposit Intangible (323) (242) (174) (117) (73)
(40) Tangible Common Equity 19,358 26,985 27,710 28,916 29,046 50,221 Number of Common Shares Outstanding 4,634,702 4,635,422 4,646,225 4,650,808 4,657,880
7,156,987 Tangible Book Value Per Share $4.18 $5.82 $5.96 $6.22 $6.24 $7.02 As of or for the Period Ended December 31,
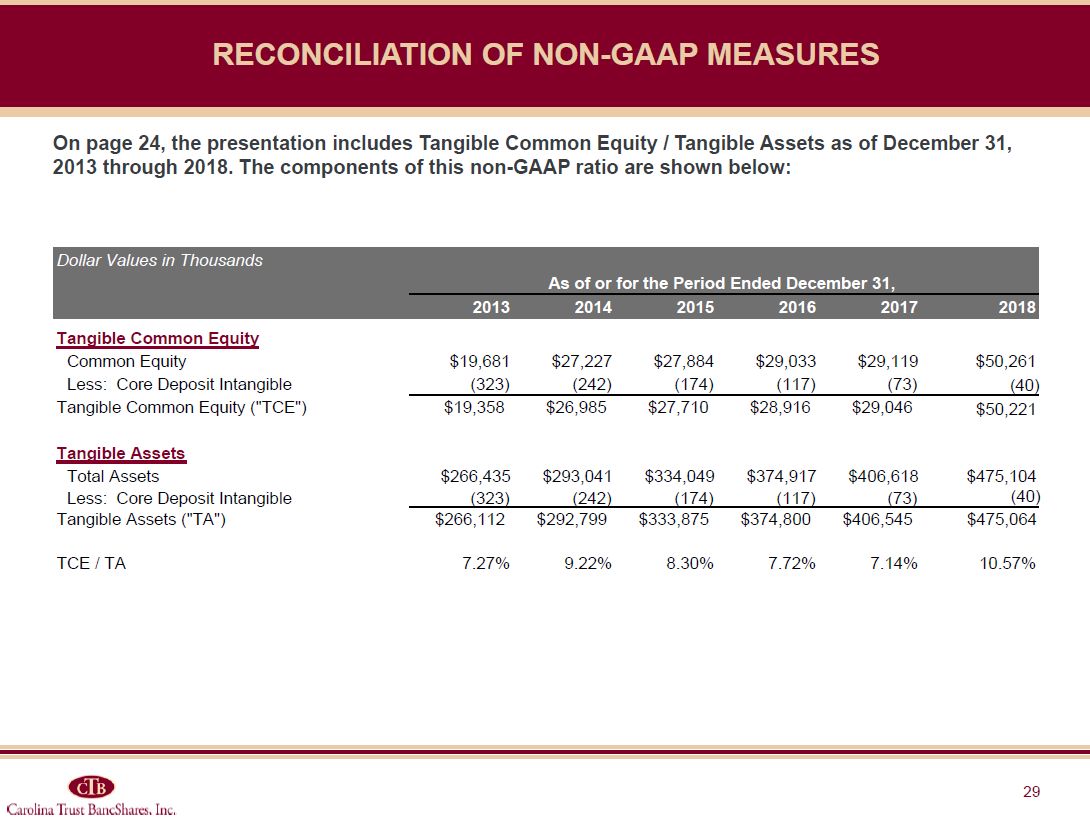
Reconciliation of Non-GAAP Measures On page 24, the presentation includes Tangible Common
Equity / Tangible Assets as of December 31, 2013 through 2018. The components of this non-GAAP ratio are shown below: Dollar Values in Thousands 2013 2014 2015 2016 2017 2018 Tangible Common Equity Common
Equity $19,681 $27,227 $27,884 $29,033 $29,119 $50,261 Less: Core Deposit Intangible (323) (242) (174) (117) (73) (40) Tangible Common Equity
(“TCE”) $19,358 $26,985 $27,710 $28,916 $29,046 $50,221 Tangible Assets Total Assets $266,435 $293,041 $334,049 $374,917 $406,618 $475,104 Less: Core Deposit Intangible (323) (242) (174) (117)
(73) (40) Tangible Assets (“TA”) $266,112 $292,799 $333,875 $374,800 $406,545 $475,064 TCE / TA 7.27% 9.22% 8.30% 7.72% 7.14% 10.57% As of or for the Period Ended December 31,
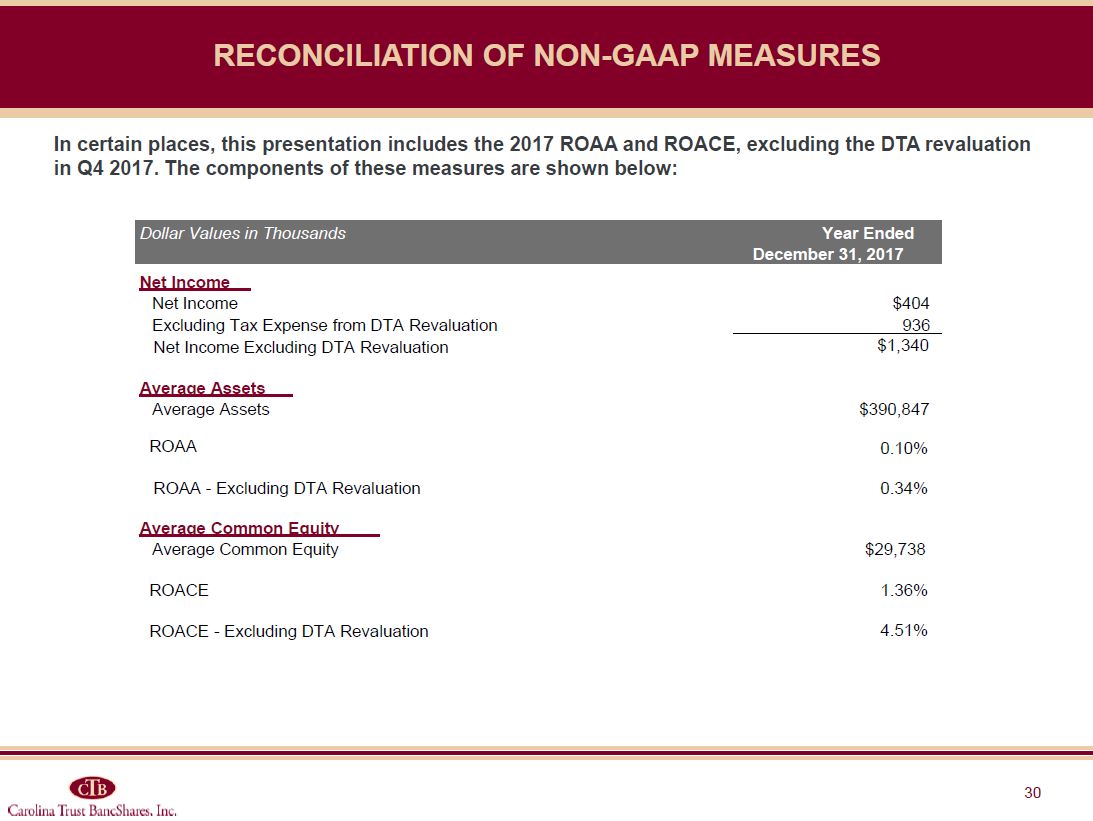
Reconciliation of Non-GAAP Measures In certain places, this presentation includes the 2017
ROAA and ROACE, excluding the DTA revaluation in Q4 2017. The components of these measures are shown below: Dollar Values in Thousands Year Ended December 31, 2017 Net Income Net Income $404 Excluding Tax Expense from DTA
Revaluation 936 Net Income Excluding DTA Revaluation $1,340 Average Assets Average Assets $390,847 ROAA 0.10% ROAA - Excluding DTA Revaluation 0.34% Average Common Equity Average Common Equity $29,738 ROACE 1.36% ROACE
- Excluding DTA Revaluation 4.51%
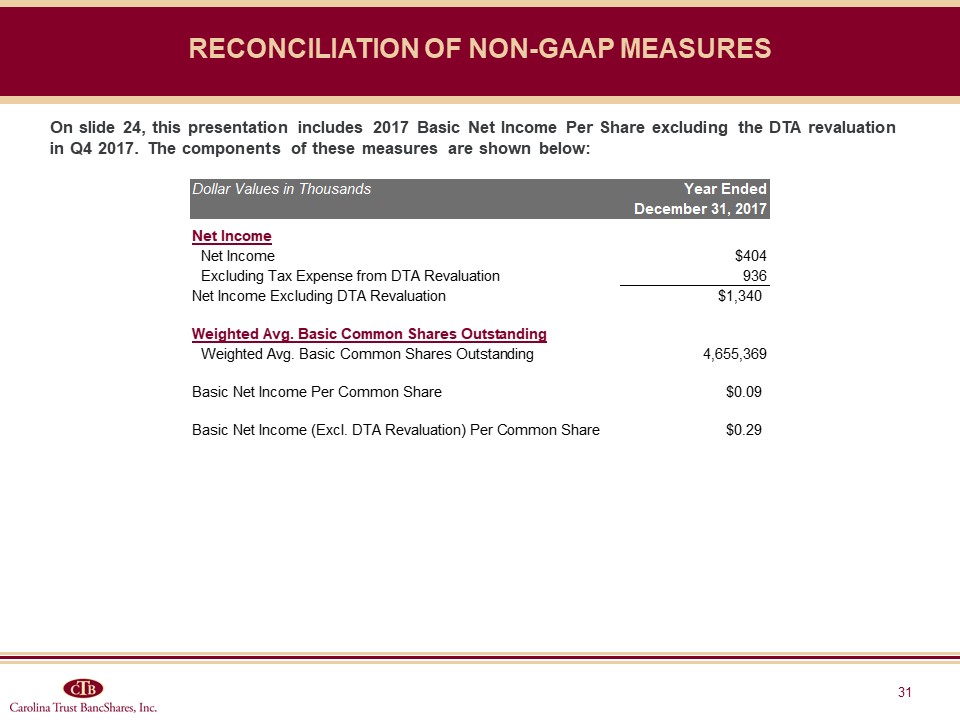
Reconciliation of Non-GAAP Measures On slide 24, this presentation includes 2017 Basic Net Income Per
Share excluding the DTA revaluation in Q4 2017. The components of these measures are shown below:
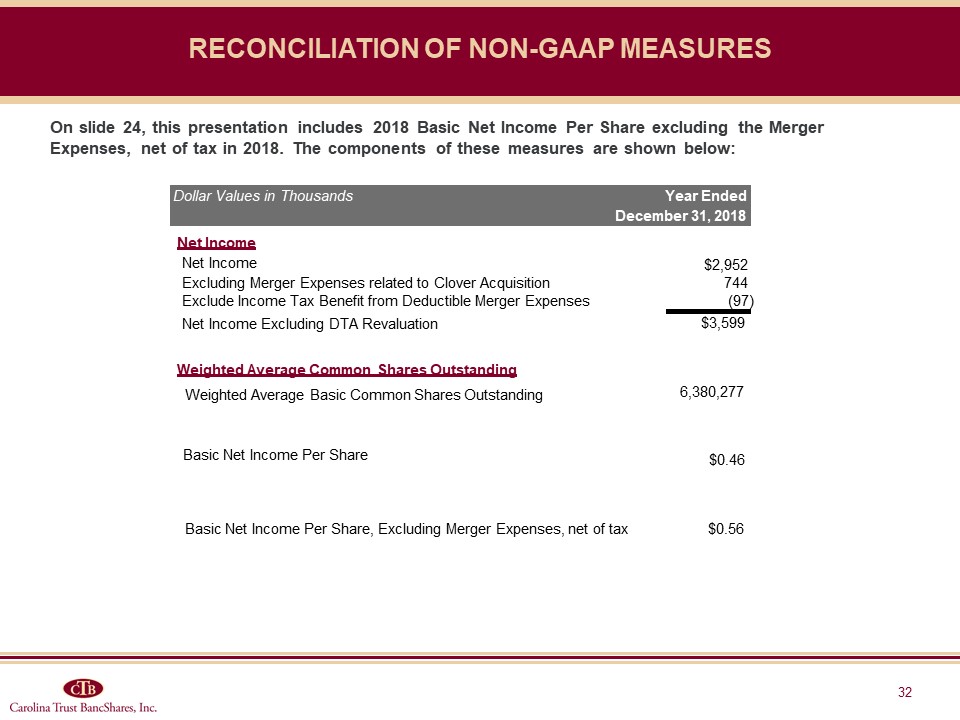
Reconciliation of Non-GAAP Measures On slide 24, this presentation includes 2018 Basic Net Income Per
Share excluding the Merger Expenses, net of tax in 2018. The components of these measures are shown below: Dollar Values in Thousands Year Ended December 31, 2018 Net Income Net Income $2,952 Excluding Merger Expenses related to
Clover Acquisition 744 (97) Net Income Excluding DTA Revaluation $3,599 Exclude Income Tax Benefit from Deductible Merger Expenses Weighted Average Common Shares Outstanding Weighted Average Basic Common Shares
Outstanding 6,380,277 Basic Net Income Per Share Basic Net Income Per Share, Excluding Merger Expenses, net of tax $0.46 $0.56