Attached files
| file | filename |
|---|---|
| EX-99.1 - EXHIBIT 99.1 - CIRRUS LOGIC, INC. | a51932489ex99_1.htm |
| 8-K - CIRRUS LOGIC, INC. 8-K - CIRRUS LOGIC, INC. | a51932489.htm |
|
|
Exhibit 99.2
|

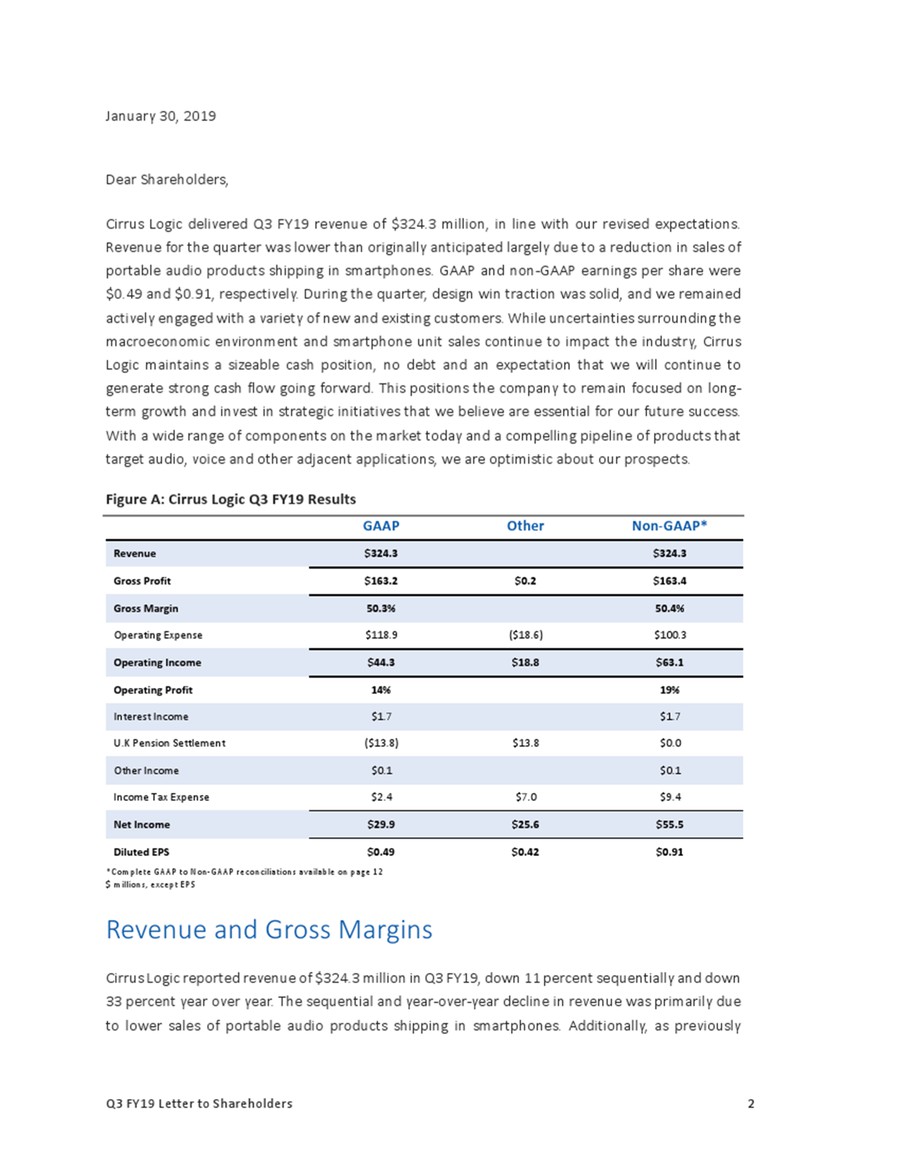
January 30, 2019 Dear Shareholders, Cirrus Logic delivered Q3 FY19 revenue of $324.3 million, in line with our revised expectations. Revenue for the quarter was lower than originally anticipated largely due to a reduction in sales of portable audio products shipping in smartphones. GAAP and non‐GAAP earnings per share were $0.49 and $0.91, respectively. During the quarter, design win traction was solid, and we remained actively engaged with a variety of new and existing customers. While uncertainties surrounding the macroeconomic environment and smartphone unit sales continue to impact the industry, Cirrus Logic maintains a sizeable cash position, no debt and an expectation that we will continue to generate strong cash flow going forward. This positions the company to remain focused on long‐ term growth and invest in strategic initiatives that we believe are essential for our future success. With a wide range of components on the market today and a compelling pipeline of products that target audio, voice and other adjacent applications, we are optimistic about our prospects.

disclosed, the year‐over‐year decline also reflects lower unit volumes of one of our digital
headset products. One customer contributed 83 percent of sales for the quarter. Our relationship with our largest customer remains outstanding with design activity continuing on various products. While we understand there is intense interest in
this customer, in accordance with our policy, we do not discuss specifics about our business relationship. Figure B: Cirrus Logic Revenue Q3 FY17 to Q4 FY19 (M) $600 $500 $523 $483 $400 $300 $328 $321 $426 $303 $254 $366 $324 $220* $200 $100 $0
Q3/FY17 Q4/FY17 Q1/FY18 Q2/FY18 Q3/FY18 Q4/FY18 Q1/FY19 Q2/FY19 Q3/FY19 Q4/FY19 *Midpoint of guidance as of January 30, 2019 In the March quarter, we expect revenue to range from $200 million to $240 million, down 32 percent sequentially and
27 percent year over year at the midpoint. Guidance reflects our expectation for continued weakness in smartphone unit sales, which is partially offset by new product ramps ahead of customer launches in the spring. Despite this softness, we are
encouraged as thompany is executing on new product development and design wins with new and existing customers are accelerating. Cirrus Logic has historically provided commentary on our revenue expectations for the upcoming fiscal year when
reporting our third quarter results; however, given the wide array of uncertainties surrounding the macroeconomic environment and their unknowable impact on smartphone volumes, we are not currently providing a revenue outlook for FY20. Nonetheless,
we anticipate revenue generated by Android customers in the next fiscal year will increase year over year, driven by content gains with various OEMs, including our largest Android customer. With a solid pipeline of products launching with both new
and existing customers across our target markets as we move through FY20, we continue to be optimistic about our future. e c


to our target operating profit margin model in the mid‐20s. Our total headcount exiting Q3 was 1,580. Figure D: GAAP R&D and SG&A Expenses (M)/Headcount Q3 FY17 to Q4 FY19 $140 $130 $120 1,406 1,444 1,467 1,529 1,568 1,596 1,609 1,592 1,580 $110 $100 $90 $80 $70 $60 $50 $40 $30 $20 $10 $0 Q3/FY17 Q4/FY17 Q1/FY18 Q2/FY18 Q3/FY18 Q4/FY18 Q1/FY19 Q2/FY19 Q3/FY19 Q4 FY19 R&D SG&A *Reflects midpoint of combined R&D and SG&A guidance as of January 30, 2019 GAAP earnings per share for the December quarter were $0.49, compared to $0.93 the prior quarter and earnings per share of $0.52 in Q3 FY18. GAAP earnings per share include approximately $13.8 million of non‐operating expense associated with the settlement of a United Kingdom defined benefit pension scheme. Non‐GAAP earnings per share for the quarter were $0.91, versus $1.08 in Q2 FY19 and $1.59 in Q3 FY18. Our ending cash balance in the December quarter was approximately $444 million, up from $396 million the prior quarter. Cash from operations was approximately $118 million for the quarter. In the December quarter, we used $55 million to repurchase roughly 1.4 million shares at an average price of $39.03. As of December 29, 2018, the company has $50 million remaining in the January 2018 share repurchase authorization. Further, the Board of Directors recently authorized the company to repurchase up to an additional $200 million of the company’s common stock. We expect to continue to have strong cash flow generation going forward and will evaluate potential Q3 FY19 Letter to Shareholders 5
uses of this cash, including acquisitions and the repurchase of shares on an opportunistic basis. Net interest income is currently expected to be roughly $2 million in Q4FY19. Taxes and
Inventory We realized GAAP tax expense for the December quarter of approximately $2.4 million on GAAP pre‐tax income of approximately $32.3 million, resulting in an effective tax rate of 7.4 percent. Non‐ GAAP tax expense for the quarter was
approximately $9.4 million on non‐GAAP pre‐tax income of approximately $64.9 million, resulting in an effective tax rate of 14.5 percent. Non‐GAAP tax expense includes approximately $7 million related to the tax effect of higher non‐GAAP income in
various jurisdictions. We expect that our worldwide non‐GAAP effective tax rate in FY19 will range from 17 percent to 19 percent. Q3 inventory was $167.9 million, up from $142.3 million the prior quarter. The sequential increase in inventory was
largely due to lower than anticipated sales of portable audio products. While we are supporting new product launches in FYQ4, overall inventory is expected to be relatively flat to Q3 FY19. Company Strategy Cirrus Logic is investing in long‐term
strategic initiatives and innovative technologies that we believe will fuel new growth opportunities. Despite the uncertainties surrounding the macroeconomic environment and smartphone unit sales, we have not experienced a meaningful shift in the
key trends driving demand for our technology. As we look to the future, we believe our expertise is becoming even more important as the need for low‐power, low‐latency, secure signal processing is increasing, particularly at the intelligent edge
where certain functions benefit from being implemented locally on the consumer device to ensure a high‐performance experience for the user. For example, in recent years, Cirrus Logic technologies have become critical enablers for the voice
assistant interfaces through our delivery of features such as low‐power always‐on voice wake. Today, Cirrus Logic’s products enable these features in smartphones, wired and wireless digital headsets and smart home devices. We see significant
customer interest across these device categories for our new generation of technologies such as advanced far‐field voice processing and speaker identification. Moreover, we believe the potential ubiquity of the voice interface and the desire to
seamlessly interact with intelligent assistants via wearables, IoT devices and automobiles represents a tremendous market opportunity. Accordingly, we continue to make considerable investments in what we see as critical technology building blocks
such as voice biometrics, anti‐ spoofing techniques, machine‐learning algorithms, far‐field voice processing and low‐power signal processing. While we continue to expand our portfolio of compelling audio and voice products, we Q3 FY19 Letter to
Shareholders 6

are also leveraging our core intellectual property to develop components in adjacent applications. The company’s expertise around closed‐loop controllers and systems, coupled with our ability
to provide low‐latency, low‐power, high‐performance signal processing is transferrable beyond the markets we currently serve. We expect to sample our first products that incorporate some of these new technologies and intellectual property in the
first half of calendar 2019 and look forward to launching a variety of compelling new products over the next several years. We are delighted with the success of our boosted amplifier and haptic driver product lines and anticipate revenue in FY20
from these components will continue to increase meaningfully year‐ over‐year. Growth is expected to be fueled by broadening our penetration of the Android smartphone market through sales of products shipping today in flagship and mid‐tier devices
and a strong pipeline of design wins that should be introduced over the next 12 months. Demand for boosted amplifiers is accelerating across tiers as OEMs push to introduce louder devices with high‐ quality stereo audio output, while ensuring
overall system and speaker reliability. With integrated low‐power DSP, Cirrus Logic’s 55‐nanometer boosted amplifiers enable customers to achieve louder and higher‐performance sound output while reducing board space and improving system integration
and flexibility. Customers utilizing our haptic driver benefit from the low‐power, low‐ latency fully integrated closed‐loop system that delivers a high‐definition haptic experience to consumers. Although we believe the largest opportunity for
haptic drivers remains smartphones, we are experiencing increased interest from non‐smartphone applications. With solid design wins and customer engagements, we anticipate several of these applications utilizing our haptic technology to be
introduced this year. While these markets are in the early stages of adoption within Android, we believe boosted amplifiers and haptic drivers will continue to contribute significantly to future revenue growth. Given this sizeable market
opportunity and the differentiated technology we want to provide customers, we are continuing to increase our investment in hardware, software and key audio, voice and acoustics engineers that we view as important for executing on our roadmap. We
believe the resulting diverse product portfolio will solidify our position as the leading supplier of these components. Since our digital headset technology started high volume production shipments in calendar 2016, Cirrus Logic has sold nearly a
billion units. While the company’s components are utilized today in a variety of wired and wireless digital headsets and dongles, the success of this business has been largely driven by inbox wired headset opportunities. Despite the success of this
business, we continue to experience a slower than anticipated transition to the USB‐C interface in the Android market. That said, with a wide range of products on the market today and more expected to be introduced over the next 3 to 12 months,
with particular emphasis on those products with differentiated feature sets that have the potential to ship in volume, we continue to be confident about our design opportunities in this market going forward. Q3 FY19 Letter to Shareholders 7
In conclusion, as we move into calendar 2019, the company is laser‐focused on executing on our product roadmap and increasing our penetration at new and existing customers. We believe the need
for our low‐power, low‐latency complex analog and digital signal processing components will continue to expand across traditional audio, voice and other adjacent applications and we remain optimistic in the long‐term success of Cirrus Logic. Other
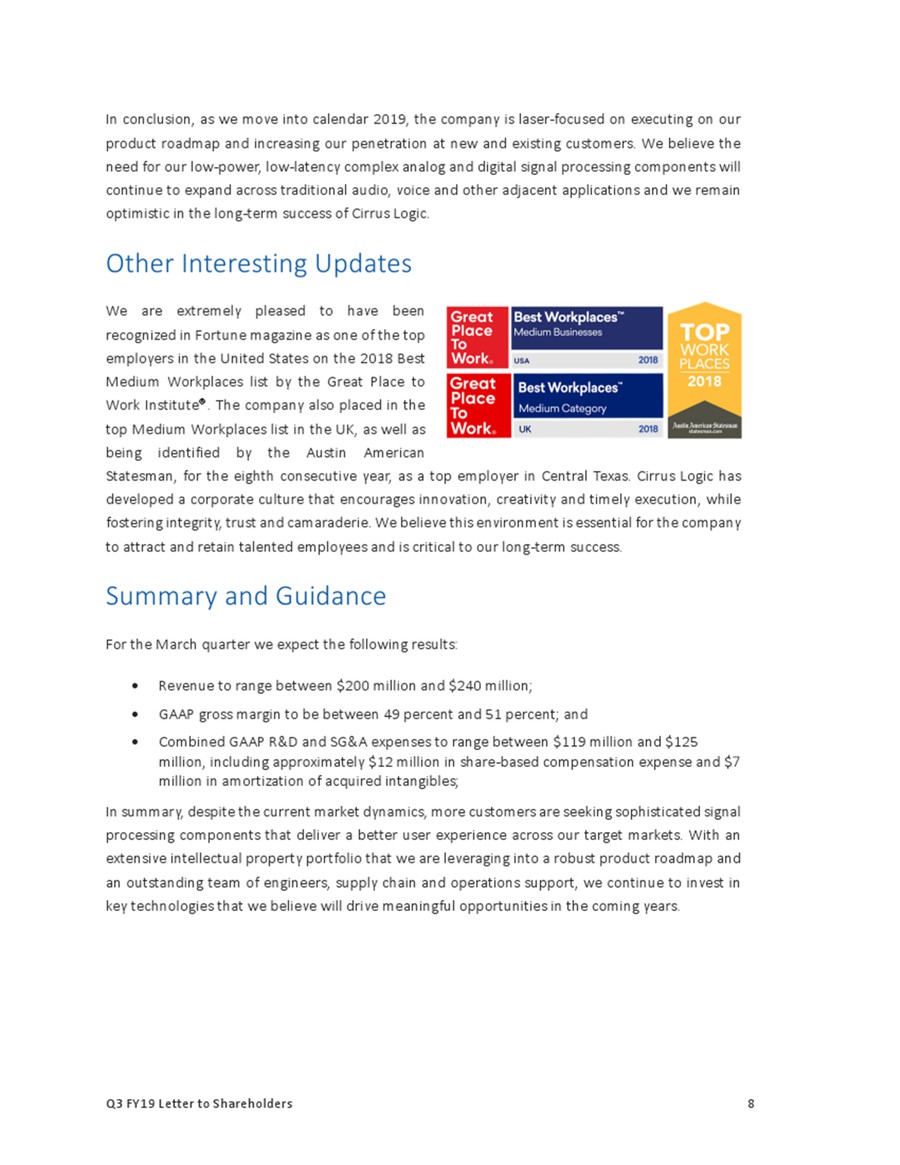
Interesting Updates We are extremely pleased to have been recognized in Fortune magazine as one of the top employers in the United States on the 2018 Best Medium Workplaces list by the Great Place to Work Institute. The company also placed in the
top Medium Workplaces list in the UK, as well as being identified by the Austin American Statesman, for the eighth consecutive year, as a top employer in Central Texas. Cirrus Logic has developed a corporate culture that encourages
innovation, creativity and timely execution, while fostering integrity, trust and camaraderie. We believe this environment is essential for the company to attract and retain talented employees and is critical to our long‐term success. Summary and
Guidance For the March quarter we expect the following results: • Revenue to range between $200 million and $240 million; • GAAP gross margin to be between 49 percent and 51 percent; and • Combined GAAP R&D and SG&A expenses to
range between $119 million and $125 million, including approximately $12 million in share‐based compensation expense and $7 million in amortization of acquired intangibles; In summary, despite the current market dynamics, more customers are seeking
sophisticated signal processing components that deliver a better user experience across our target markets. With an extensive intellectual property portfolio that we are leveraging into a robust product roadmap and an outstanding team of engineers,
supply chain and operations support, we continue to invest in key technologies that we believe will drive meaningful opportunities in the coming years. Q3 FY19 Letter to Shareholders 8

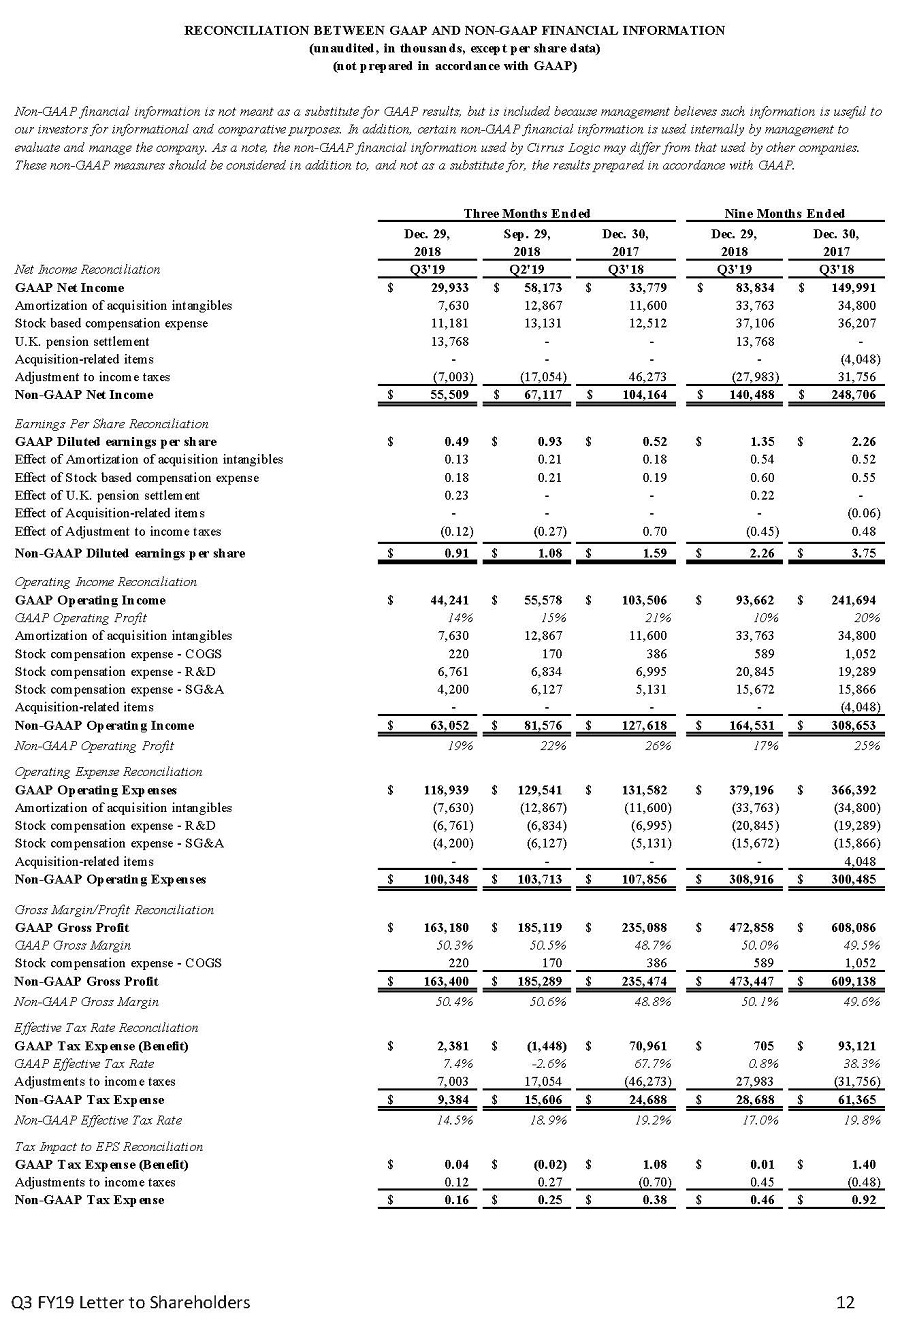
Sincerely, Jason Rhode President and Chief Executive Officer Thurman Case Chief Financial Officer Conference Call Q&A Session Cirrus Logic will host a live Q&A session at 5 p.m. EST today to answer questions related to its financial results and business outlook. Participants may listen to the conference call on the Cirrus Logic website. Participants who would like to submit a question to be addressed during the call are requested to email investor.relations@cirrus.com. A replay of the webcast can be accessed on the Cirrus Logic website approximately two hours following its completion, or by calling (416) 621‐4642 or toll free at (800) 585‐8367 (Access Code: 9569708). Use of Non-GAAP Financial Information To supplement Cirrus Logic's financial statements presented on a GAAP basis, Cirrus has provided non‐GAAP financial information, including non‐GAAP net income, diluted earnings per share, operating income and profit, operating expenses, gross margin and profit, tax expenses and tax expense impact on earnings per share. A reconciliation of the adjustments to GAAP results is included in the tables below. We are also providing guidance on our non‐GAAP expected effective tax rate. We are not able to provide guidance on our GAAP tax rate or a related reconciliation without unreasonable efforts since our future GAAP tax rate depends on our future stock price and related share‐based compensation information that is not currently available. Non‐GAAP financial information is not meant as a substitute for GAAP results, but is included because management believes such information is useful to our investors for informational and comparative purposes. In addition, certain non‐GAAP financial information is used internally by management to evaluate and manage the company. The non‐GAAP financial information used by Cirrus Logic may differ from that used by other companies. These non‐GAAP measures should be considered in addition to, and not as a substitute for, the results prepared in accordance with GAAP. Q3 FY19 Letter to Shareholders 9

Safe Harbor Statement Except for historical information contained herein, the matters set forth in this shareholder letter contain forward‐looking statements, including statements about our
outlook in the coming years and optimism for the long‐term success of the company; future revenue growth and market opportunities, future new product tape outs and introductions, and expected customer product introductions and ramps; our
expectation of year‐over‐year revenue growth associated with revenue generated by Android customers; our ability to continue to generate strong cash flow; our ability to manage our hiring and operating expenses for the remainder of fiscal year
2019; effective tax rates for fiscal year 2019; our ability to achieve mid‐20 percent operating profit in the longer term; and our forecasts for the fourth quarter of fiscal year 2019 revenue, profit, net interest income, gross margin, combined
research and development and selling, general and administrative expense levels, share‐based compensation expense, amortization of acquired intangibles and inventory levels. In some cases, forward‐looking statements are identified by words such as
“emerge,” “expect,” “anticipate,” “foresee,” “target,” “project,” “believe,” “goals,” “opportunity,” “estimates,” “intend,” “will,” and variations of these types of words and similar expressions. In addition, any statements that refer to our plans,
expectations, strategies or other characterizations of future events or circumstances are forward‐looking statements. These forward‐looking statements are based on our current expectations, estimates and assumptions and are subject to certain risks
and uncertainties that could cause actual results to differ materially. These risks and uncertainties include, but are not limited to, the following: the level and timing of orders and shipments during the fourth quarter of fiscal year 2019,
customer cancellations of orders, or the failure to place orders consistent with forecasts; changes with respect to our current expectations of future smartphone unit volumes; any delays in the timing and/or success of customers’ new product ramps;
failure to win new designs or additional content as expected at Android customers; any changes in U.S. trade policy, including potential adoption and expansion of trade restrictions, higher tariffs, or cross border taxation by the U.S. government
involving other countries, particularly China, that might impact overall customer demand for our products or affect our ability to manufacture and/or sell our products overseas; and the risk factors listed in our Form 10‐K for the year ended March
31, 2018 and in our other filings with the Securities and Exchange Commission, which are available at www.sec.gov. The foregoing information concerning our business outlook represents our outlook as of the date of this news release, and we
undertake no obligation to update or revise any forward‐looking statements, whether as a result of new developments or otherwise.Cirrus Logic and Cirrus are registered trademarks of Cirrus Logic, Inc. All other company or product names noted herein
may be trademarks of their respective holders.Q3 FY19 Letter to Shareholders

Summary of Financial Data Below: CONSOLIDATED CONDENSED STATEMENT OF OPERATIONS (unaudited) (in
thousands, except per share data) Three Months Ended Nine Months Ended Dec. 29,Sep. 29,Dec. 30, Dec. 29, Dec. 30,2018 2018 20172018 2017Q3'19Q2'19 Q3'18Q3'19 Q3'18 Portable audio products $288,640 $324,049 $ 438,650 $ 824,950 $ 1,101,099
Non-portable audio and other products 35,655 42,256 44,091 120,133127,914 Net sales324,295366,305 482,741 945,083 1,229,013 Cost of sales 161,115 181,186 247,653 472,225 620,927 Gross profit 163,180 185,119 235,088 472,858 608,086 Gross
margin 50.3%50.5% 48.7% 50.0% 49.5% Research and development 88,575 96,381 96,978 282,888 270,888 Selling, general and administrative 30,364 33,160 34,604 96,308 95,504 Total operating expenses 118,939 129,541131,582 379,196 366,392 Income
from operations 44,241 55,578 103,506 93,662 241,694 Interest income (expense), net 1,740 1,525 912 4,712 2,231 U.K. pension settlement (13,768) - - (13,768)- Other income (expense), net 101 (378) 322 (67) (813) Income before income
taxes 32,31456,725 104,740 84,539243,112 Provision (benefit) for income taxes 2,381 (1,448) 70,961 70593,121 Net income $ 29,933 $ 58,173 $ 33,779 $ 83,834 $ 149,991 Basic earnings per share: Diluted earnings per share: $
0.50 $ $ 0.49 $ 0.96 $ 0.93 $ 0.53 $ 0.52 $ 1.39 $ 1.35 $ 2.36 2.26 Weighted average number of shares: Basic 59,511 60,472 63,453 60,482 63,655 Diluted 60,783 62,431 65,557 62,076 66,377 Prepared in accordance
with Generally Accepted Accounting Principles Q3 FY19 Letter to Shareholders