Attached files
| file | filename |
|---|---|
| EX-99.1 - EXHIBIT 99.1 - MERCURY SYSTEMS INC | q22019earningsreleaseexhib.htm |
| 8-K - 8-K - MERCURY SYSTEMS INC | q22019earningsrelease8-k.htm |

2nd Quarter Fiscal Year 2019 Financial Results & GECO Avionics, LLC Acquisition Overview Mark Aslett President and CEO Conference call: Dial (877) 303-6977 in the USA and Canada, Michael Ruppert (760) 298-5079 in all other countries Executive Vice President and CFO Webcast login at www.mrcy.com/investor January 29, 2019, 5:00 pm ET Webcast replay available by 7:00 p.m. ET January 29, 2019 © 2019 Mercury Systems, Inc.
Forward-looking safe harbor statement This presentation contains certain forward-looking statements, as that term is defined in the Private Securities Litigation Reform Act of 1995, including those relating to the acquisition described herein and to fiscal 2019 business performance and beyond and the Company’s plans for growth and improvement in profitability and cash flow. You can identify these statements by the use of the words “may,” “will,” “could,” “should,” “would,” “plans,” “expects,” “anticipates,” “continue,” “estimate,” “project,” “intend,” “likely,” “forecast,” “probable,” “potential,” and similar expressions. These forward-looking statements involve risks and uncertainties that could cause actual results to differ materially from those projected or anticipated. Such risks and uncertainties include, but are not limited to, continued funding of defense programs, the timing and amounts of such funding, general economic and business conditions, including unforeseen weakness in the Company’s markets, effects of any U.S. Federal government shutdown or extended continuing resolution, effects of continued geopolitical unrest and regional conflicts, competition, changes in technology and methods of marketing, delays in completing engineering and manufacturing programs, changes in customer order patterns, changes in product mix, continued success in technological advances and delivering technological innovations, changes in, or in the U.S. Government’s interpretation of, federal export control or procurement rules and regulations, market acceptance of the Company's products, shortages in components, production delays or unanticipated expenses due to performance quality issues with outsourced components, inability to fully realize the expected benefits from acquisitions and restructurings, or delays in realizing such benefits, challenges in integrating acquired businesses and achieving anticipated synergies, increases in interest rates, changes to cyber-security regulations and requirements, changes in tax rates or tax regulations, changes to generally accepted accounting principles, difficulties in retaining key employees and customers, unanticipated costs under fixed-price service and system integration engagements, and various other factors beyond our control. These risks and uncertainties also include such additional risk factors as are discussed in the Company's filings with the U.S. Securities and Exchange Commission, including its Annual Report on Form 10-K for the fiscal year ended June 30, 2018. The Company cautions readers not to place undue reliance upon any such forward-looking statements, which speak only as of the date made. The Company undertakes no obligation to update any forward-looking statement to reflect events or circumstances after the date on which such statement is made. Use of Non-GAAP (Generally Accepted Accounting Principles) Financial Measures In addition to reporting financial results in accordance with generally accepted accounting principles, or GAAP, the Company provides adjusted EBITDA, adjusted income, adjusted EPS, free cash flow, organic revenue and acquired revenue which are non-GAAP financial measures. Adjusted EBITDA, adjusted income, and adjusted EPS exclude certain non-cash and other specified charges. The Company believes these non-GAAP financial measures are useful to help investors better understand its past financial performance and prospects for the future. However, these non-GAAP measures should not be considered in isolation or as a substitute for financial information provided in accordance with GAAP. Management believes these non-GAAP measures assist in providing a more complete understanding of the Company’s underlying operational results and trends, and management uses these measures along with the corresponding GAAP financial measures to manage the Company’s business, to evaluate its performance compared to prior periods and the marketplace, and to establish operational goals. A reconciliation of GAAP to non-GAAP financial results discussed in this presentation is contained in the Appendix hereto. © 2019 Mercury Systems, Inc. 2
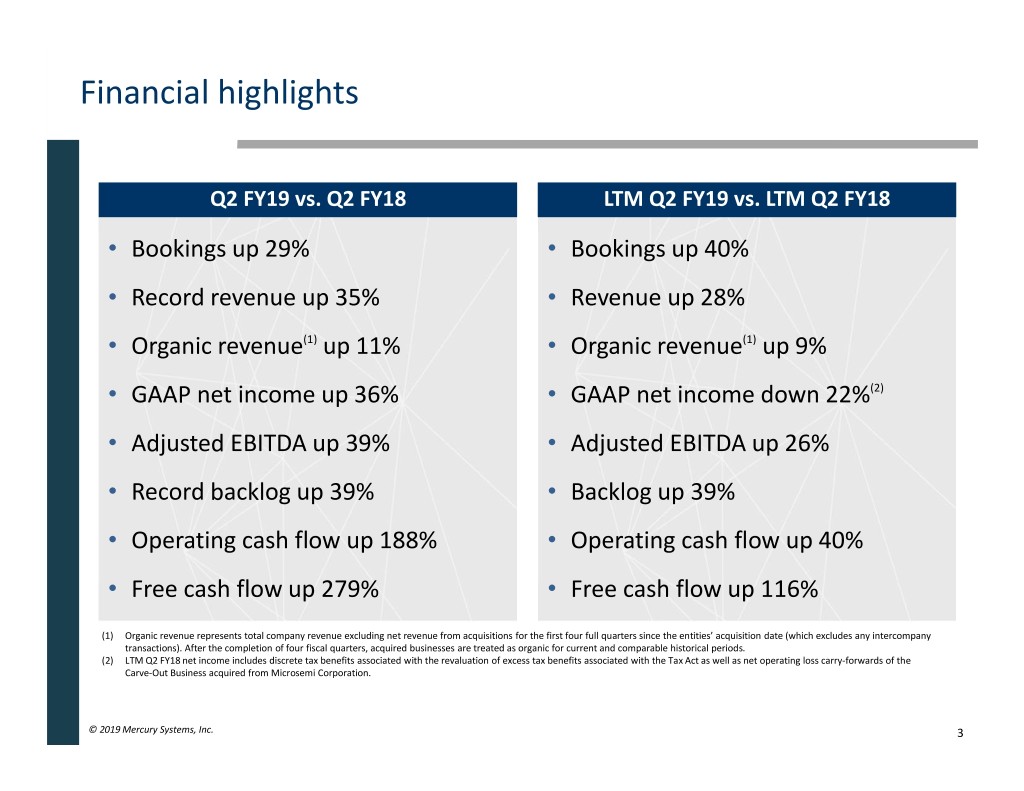
Financial highlights Q2Q2 FY19 FY19 vs.vs. Q2Q2 FY18FY18 LTMLTM Q2 Q2 FY19 FY19 vs.vs. LTMLTM Q2 Q2 FY18 FY18 • Bookings up 29% • Bookings up 40% • Record revenue up 35% • Revenue up 28% • Organic revenue(1) up 11% • Organic revenue(1) up 9% • GAAP net income up 36% • GAAP net income down 22%(2) • Adjusted EBITDA up 39% • Adjusted EBITDA up 26% • Record backlog up 39% • Backlog up 39% • Operating cash flow up 188% • Operating cash flow up 40% • Free cash flow up 279% • Free cash flow up 116% (1) Organic revenue represents total company revenue excluding net revenue from acquisitions for the first four full quarters since the entities’ acquisition date (which excludes any intercompany transactions). After the completion of four fiscal quarters, acquired businesses are treated as organic for current and comparable historical periods. (2) LTM Q2 FY18 net income includes discrete tax benefits associated with the revaluation of excess tax benefits associated with the Tax Act as well as net operating loss carry-forwards of the Carve-Out Business acquired from Microsemi Corporation. © 2019 Mercury Systems, Inc. 3
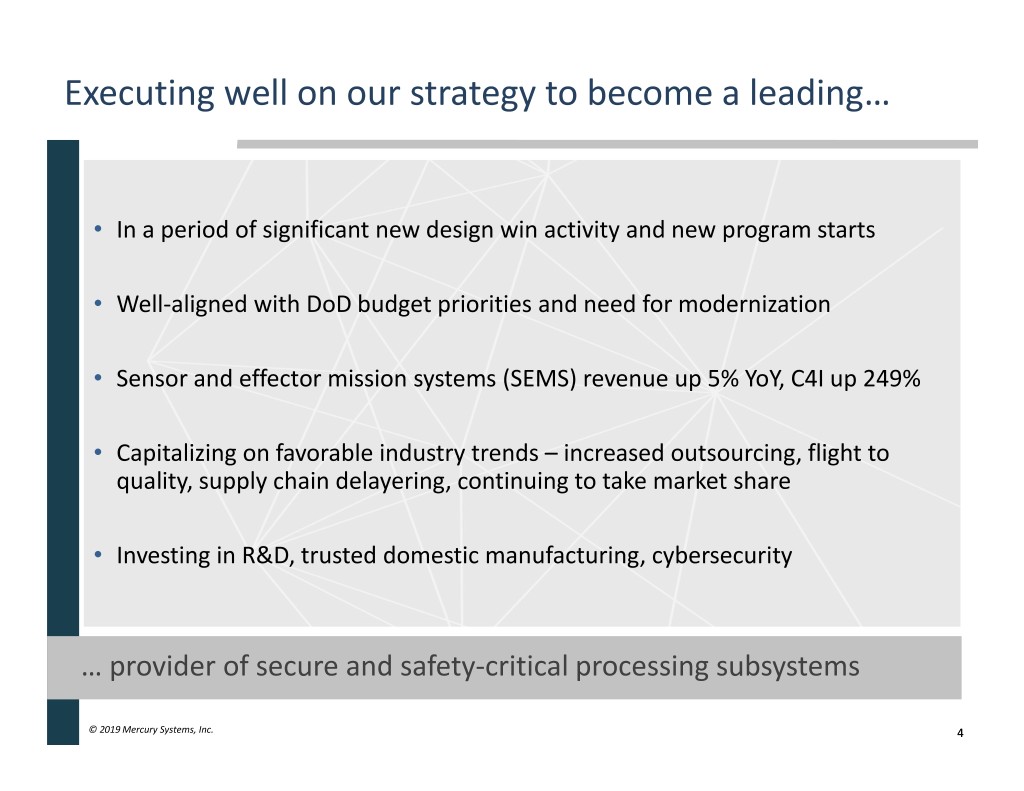
Executing well on our strategy to become a leading… • In a period of significant new design win activity and new program starts • Well-aligned with DoD budget priorities and need for modernization • Sensor and effector mission systems (SEMS) revenue up 5% YoY, C4I up 249% • Capitalizing on favorable industry trends – increased outsourcing, flight to quality, supply chain delayering, continuing to take market share • Investing in R&D, trusted domestic manufacturing, cybersecurity … provider of secure and safety-critical processing subsystems © 2019 Mercury Systems, Inc. 4
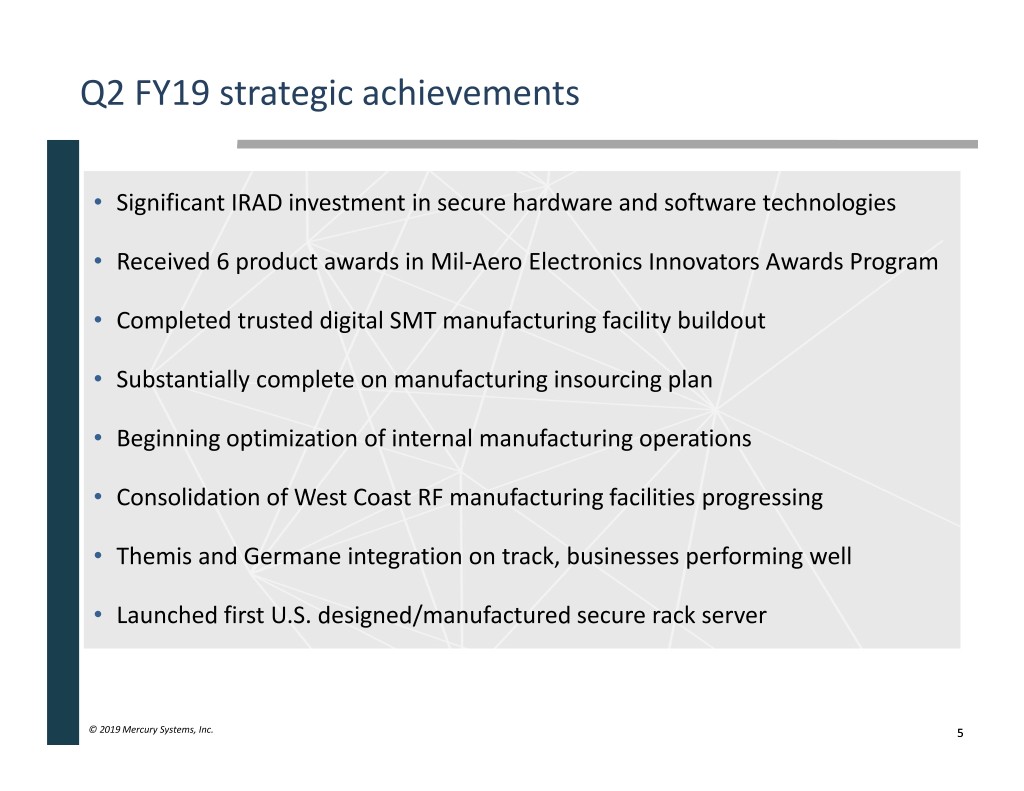
Q2 FY19 strategic achievements • Significant IRAD investment in secure hardware and software technologies • Received 6 product awards in Mil-Aero Electronics Innovators Awards Program • Completed trusted digital SMT manufacturing facility buildout • Substantially complete on manufacturing insourcing plan • Beginning optimization of internal manufacturing operations • Consolidation of West Coast RF manufacturing facilities progressing • Themis and Germane integration on track, businesses performing well • Launched first U.S. designed/manufactured secure rack server © 2019 Mercury Systems, Inc. 5
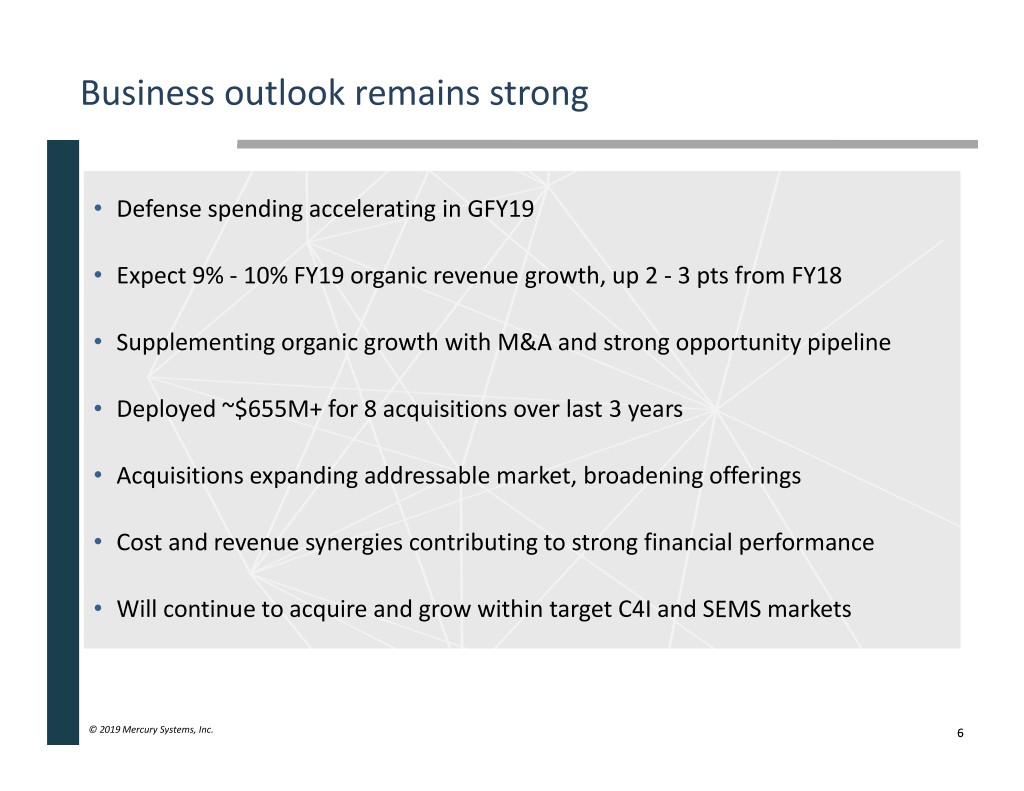
Business outlook remains strong • Defense spending accelerating in GFY19 • Expect 9% - 10% FY19 organic revenue growth, up 2 - 3 pts from FY18 • Supplementing organic growth with M&A and strong opportunity pipeline • Deployed ~$655M+ for 8 acquisitions over last 3 years • Acquisitions expanding addressable market, broadening offerings • Cost and revenue synergies contributing to strong financial performance • Will continue to acquire and grow within target C4I and SEMS markets © 2019 Mercury Systems, Inc. 6
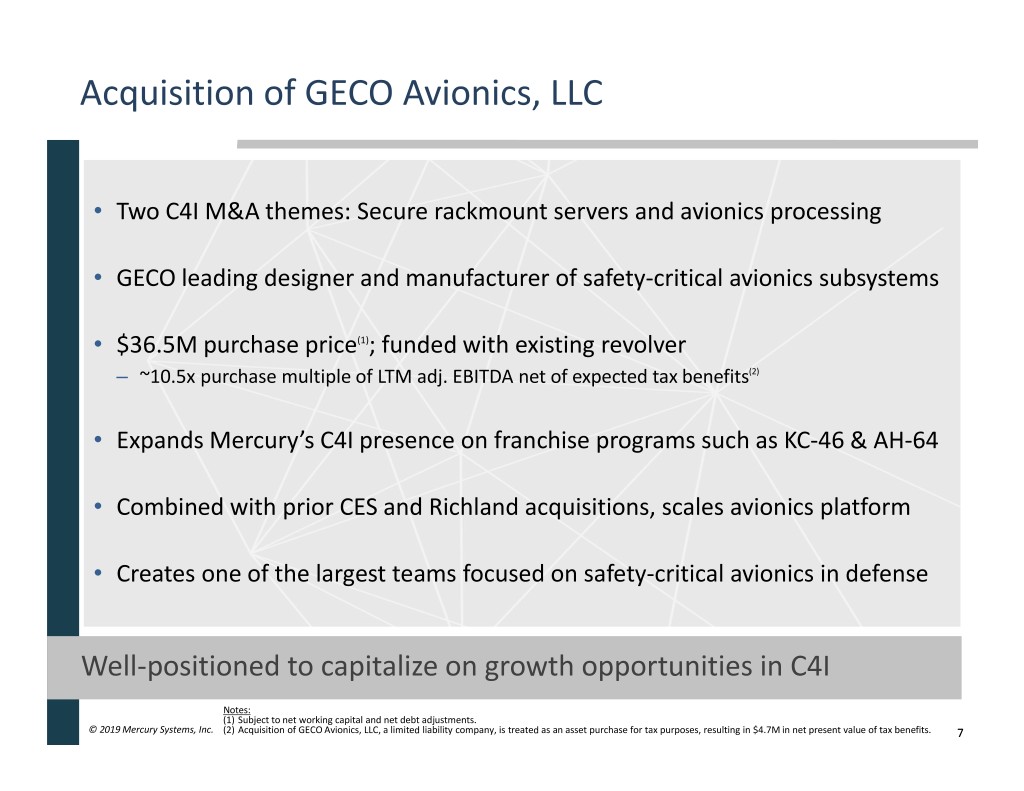
Acquisition of GECO Avionics, LLC • Two C4I M&A themes: Secure rackmount servers and avionics processing • GECO leading designer and manufacturer of safety-critical avionics subsystems • $36.5M purchase price(1); funded with existing revolver – ~10.5x purchase multiple of LTM adj. EBITDA net of expected tax benefits(2) • Expands Mercury’s C4I presence on franchise programs such as KC-46 & AH-64 • Combined with prior CES and Richland acquisitions, scales avionics platform • Creates one of the largest teams focused on safety-critical avionics in defense Well-positioned to capitalize on growth opportunities in C4I Notes: (1) Subject to net working capital and net debt adjustments. © 2019 Mercury Systems, Inc. (2) Acquisition of GECO Avionics, LLC, a limited liability company, is treated as an asset purchase for tax purposes, resulting in $4.7M in net present value of tax benefits. 7
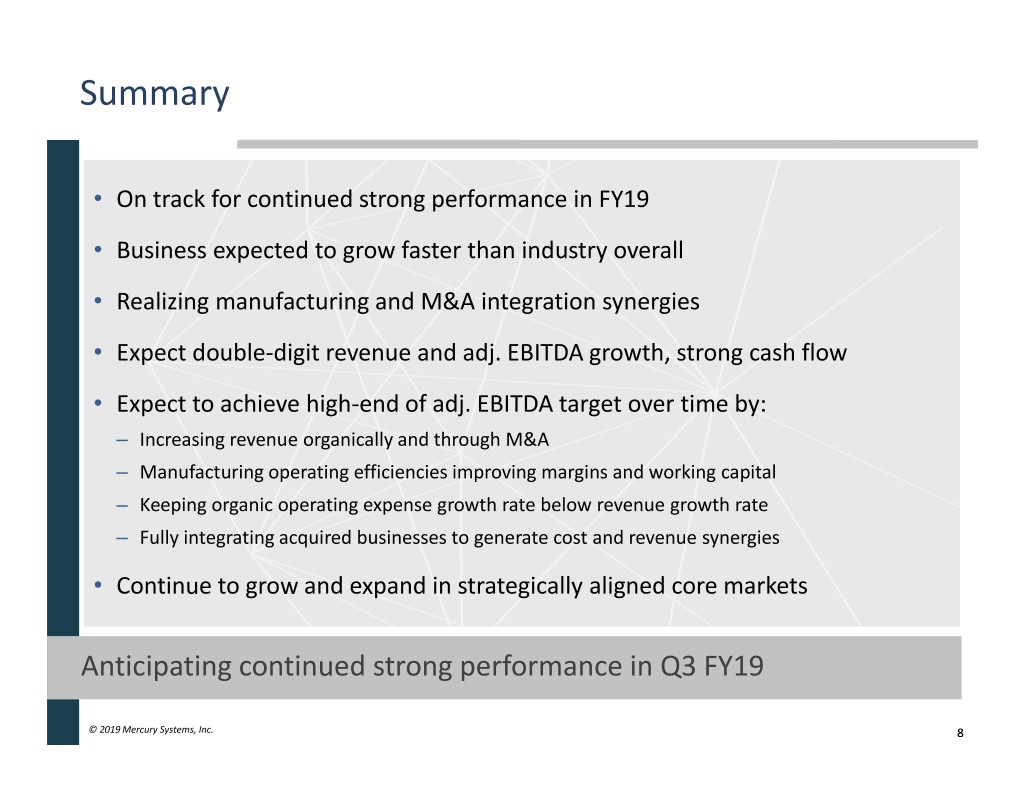
Summary • On track for continued strong performance in FY19 • Business expected to grow faster than industry overall • Realizing manufacturing and M&A integration synergies • Expect double-digit revenue and adj. EBITDA growth, strong cash flow • Expect to achieve high-end of adj. EBITDA target over time by: – Increasing revenue organically and through M&A – Manufacturing operating efficiencies improving margins and working capital – Keeping organic operating expense growth rate below revenue growth rate – Fully integrating acquired businesses to generate cost and revenue synergies • Continue to grow and expand in strategically aligned core markets Anticipating continued strong performance in Q3 FY19 © 2019 Mercury Systems, Inc. 8
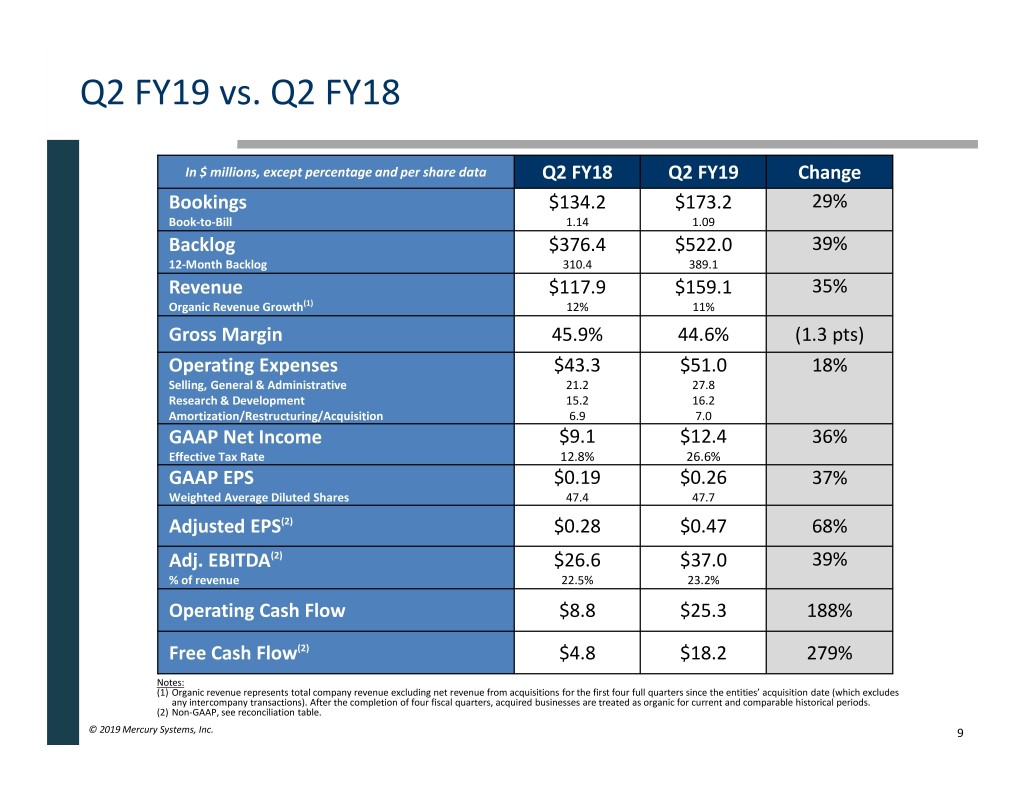
Q2 FY19 vs. Q2 FY18 In $ millions, except percentage and per share data Q2 FY18 Q2 FY19 Change Bookings $134.2 $173.2 29% Book-to-Bill 1.14 1.09 Backlog $376.4 $522.0 39% 12-Month Backlog 310.4 389.1 Revenue $117.9 $159.1 35% Organic Revenue Growth(1) 12% 11% Gross Margin 45.9% 44.6% (1.3 pts) Operating Expenses $43.3 $51.0 18% Selling, General & Administrative 21.2 27.8 Research & Development 15.2 16.2 Amortization/Restructuring/Acquisition 6.9 7.0 GAAP Net Income $9.1 $12.4 36% Effective Tax Rate 12.8% 26.6% GAAP EPS $0.19 $0.26 37% Weighted Average Diluted Shares 47.4 47.7 Adjusted EPS(2) $0.28 $0.47 68% Adj. EBITDA(2) $26.6 $37.0 39% % of revenue 22.5% 23.2% Operating Cash Flow $8.8 $25.3 188% Free Cash Flow(2) $4.8 $18.2 279% Notes: (1) Organic revenue represents total company revenue excluding net revenue from acquisitions for the first four full quarters since the entities’ acquisition date (which excludes any intercompany transactions). After the completion of four fiscal quarters, acquired businesses are treated as organic for current and comparable historical periods. (2) Non-GAAP, see reconciliation table. © 2019 Mercury Systems, Inc. 9
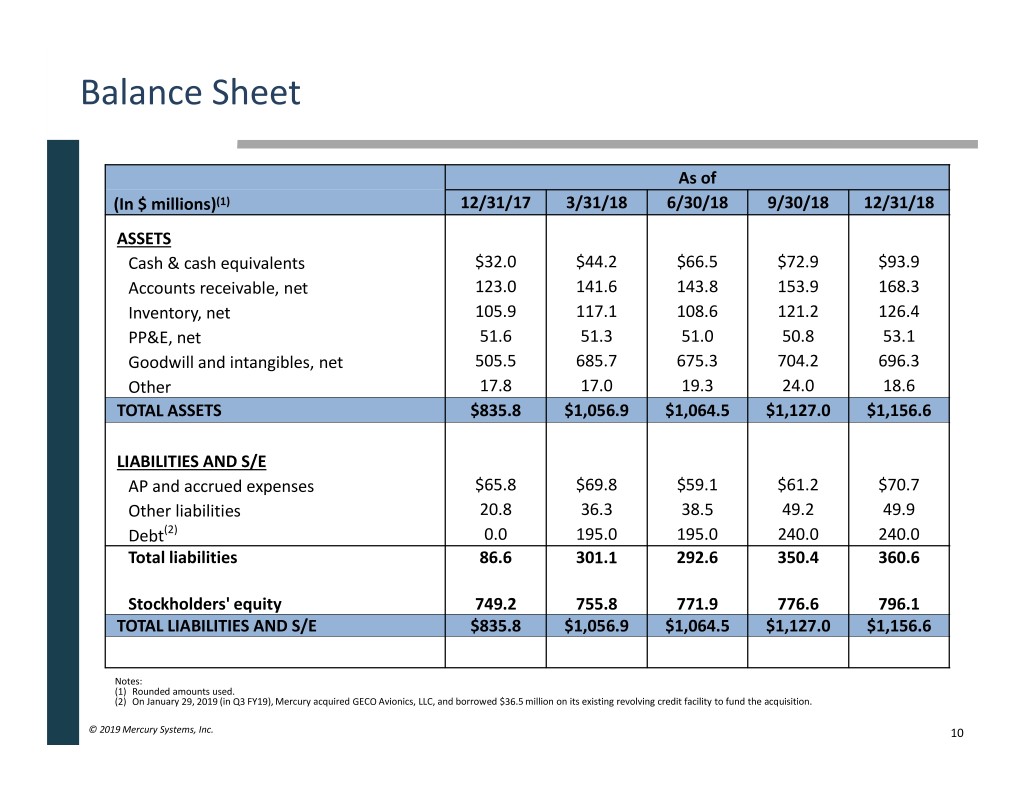
Balance Sheet As of (In $ millions)(1) 12/31/17 3/31/18 6/30/18 9/30/18 12/31/18 ASSETS Cash & cash equivalents $32.0 $44.2 $66.5 $72.9 $93.9 Accounts receivable, net 123.0 141.6 143.8 153.9 168.3 Inventory, net 105.9 117.1 108.6 121.2 126.4 PP&E, net 51.6 51.3 51.0 50.8 53.1 Goodwill and intangibles, net 505.5 685.7 675.3 704.2 696.3 Other 17.8 17.0 19.3 24.0 18.6 TOTAL ASSETS $835.8 $1,056.9 $1,064.5 $1,127.0 $1,156.6 LIABILITIES AND S/E AP and accrued expenses $65.8 $69.8 $59.1 $61.2 $70.7 Other liabilities 20.8 36.3 38.5 49.2 49.9 Debt(2) 0.0 195.0 195.0 240.0 240.0 Total liabilities 86.6 301.1 292.6 350.4 360.6 Stockholders' equity 749.2 755.8 771.9 776.6 796.1 TOTAL LIABILITIES AND S/E $835.8 $1,056.9 $1,064.5 $1,127.0 $1,156.6 Notes: (1) Rounded amounts used. (2) On January 29, 2019 (in Q3 FY19), Mercury acquired GECO Avionics, LLC, and borrowed $36.5 million on its existing revolving credit facility to fund the acquisition. © 2019 Mercury Systems, Inc. 10
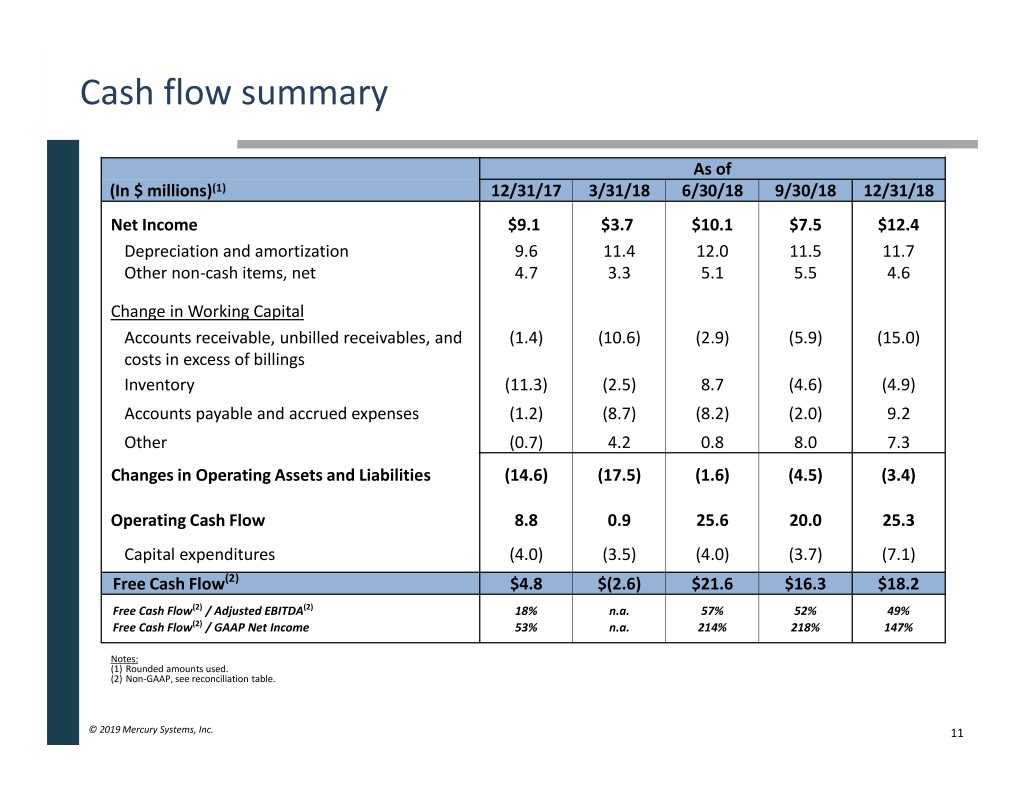
Cash flow summary As of (In $ millions)(1) 12/31/17 3/31/18 6/30/18 9/30/18 12/31/18 Net Income $9.1 $3.7 $10.1 $7.5 $12.4 Depreciation and amortization 9.6 11.4 12.0 11.5 11.7 Other non-cash items, net 4.7 3.3 5.1 5.5 4.6 Change in Working Capital Accounts receivable, unbilled receivables, and (1.4) (10.6) (2.9) (5.9) (15.0) costs in excess of billings Inventory (11.3) (2.5) 8.7 (4.6) (4.9) Accounts payable and accrued expenses (1.2) (8.7) (8.2) (2.0) 9.2 Other (0.7) 4.2 0.8 8.0 7.3 Changes in Operating Assets and Liabilities (14.6) (17.5) (1.6) (4.5) (3.4) Operating Cash Flow 8.8 0.9 25.6 20.0 25.3 Capital expenditures (4.0) (3.5) (4.0) (3.7) (7.1) Free Cash Flow(2) $4.8 $(2.6) $21.6 $16.3 $18.2 Free Cash Flow(2) / Adjusted EBITDA(2) 18% n.a. 57% 52% 49% Free Cash Flow(2) / GAAP Net Income 53% n.a. 214% 218% 147% Notes: (1) Rounded amounts used. (2) Non-GAAP, see reconciliation table. © 2019 Mercury Systems, Inc. 11
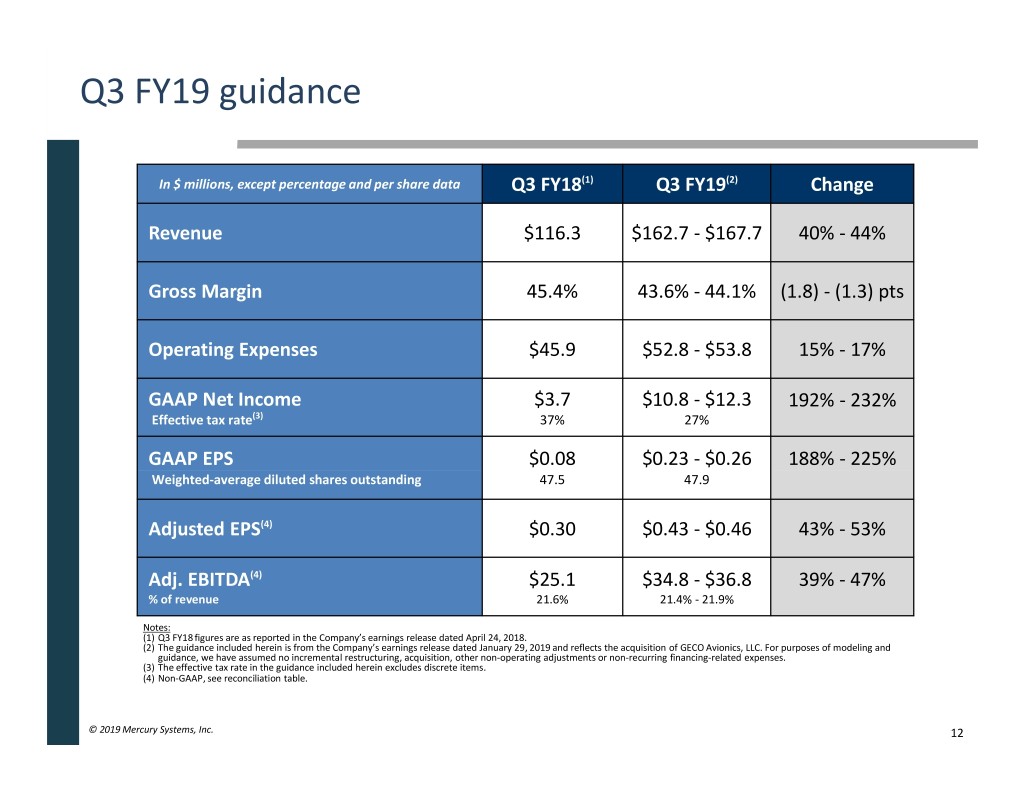
Q3 FY19 guidance In $ millions, except percentage and per share data Q3 FY18(1) Q3 FY19(2) Change Revenue $116.3 $162.7 - $167.7 40% - 44% Gross Margin 45.4% 43.6% - 44.1% (1.8) - (1.3) pts Operating Expenses $45.9 $52.8 - $53.8 15% - 17% GAAP Net Income $3.7 $10.8 - $12.3 192% - 232% Effective tax rate(3) 37% 27% GAAP EPS $0.08 $0.23 - $0.26 188% - 225% Weighted-average diluted shares outstanding 47.5 47.9 Adjusted EPS(4) $0.30 $0.43 - $0.46 43% - 53% Adj. EBITDA(4) $25.1 $34.8 - $36.8 39% - 47% % of revenue 21.6% 21.4% - 21.9% Notes: (1) Q3 FY18 figures are as reported in the Company’s earnings release dated April 24, 2018. (2) The guidance included herein is from the Company’s earnings release dated January 29, 2019 and reflects the acquisition of GECO Avionics, LLC. For purposes of modeling and guidance, we have assumed no incremental restructuring, acquisition, other non-operating adjustments or non-recurring financing-related expenses. (3) The effective tax rate in the guidance included herein excludes discrete items. (4) Non-GAAP, see reconciliation table. © 2019 Mercury Systems, Inc. 12
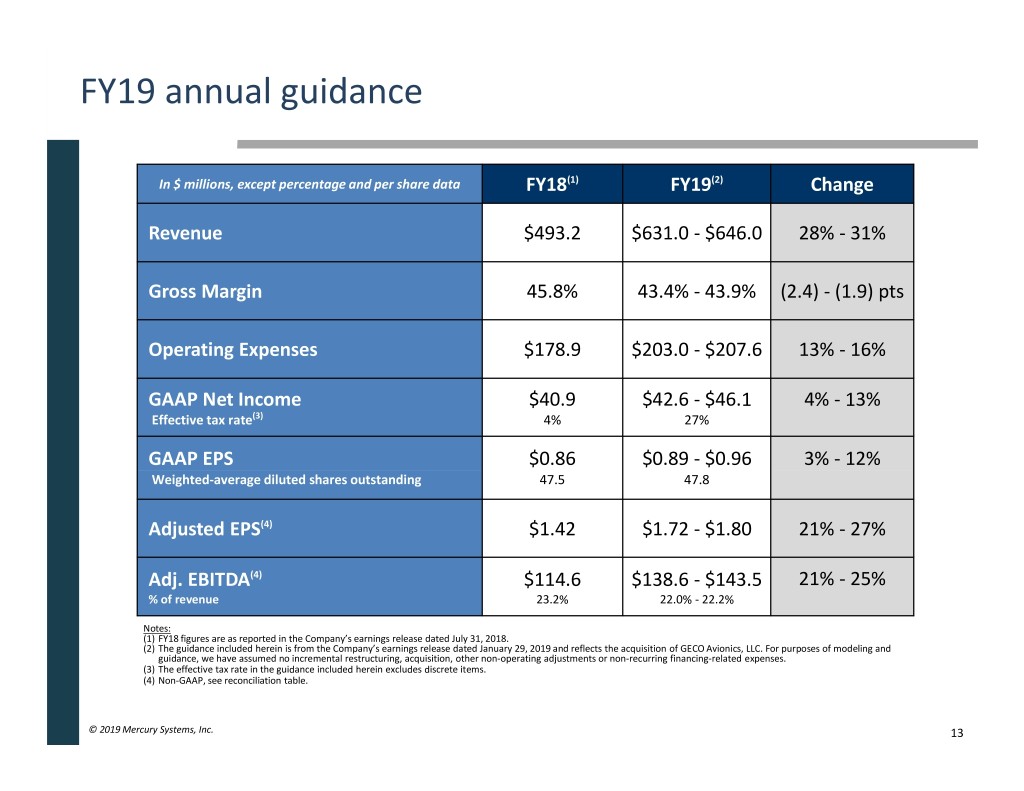
FY19 annual guidance In $ millions, except percentage and per share data FY18(1) FY19(2) Change Revenue $493.2 $631.0 - $646.0 28% - 31% Gross Margin 45.8% 43.4% - 43.9% (2.4) - (1.9) pts Operating Expenses $178.9 $203.0 - $207.6 13% - 16% GAAP Net Income $40.9 $42.6 - $46.1 4% - 13% Effective tax rate(3) 4% 27% GAAP EPS $0.86 $0.89 - $0.96 3% - 12% Weighted-average diluted shares outstanding 47.5 47.8 Adjusted EPS(4) $1.42 $1.72 - $1.80 21% - 27% Adj. EBITDA(4) $114.6 $138.6 - $143.5 21% - 25% % of revenue 23.2% 22.0% - 22.2% Notes: (1) FY18 figures are as reported in the Company’s earnings release dated July 31, 2018. (2) The guidance included herein is from the Company’s earnings release dated January 29, 2019 and reflects the acquisition of GECO Avionics, LLC. For purposes of modeling and guidance, we have assumed no incremental restructuring, acquisition, other non-operating adjustments or non-recurring financing-related expenses. (3) The effective tax rate in the guidance included herein excludes discrete items. (4) Non-GAAP, see reconciliation table. © 2019 Mercury Systems, Inc. 13
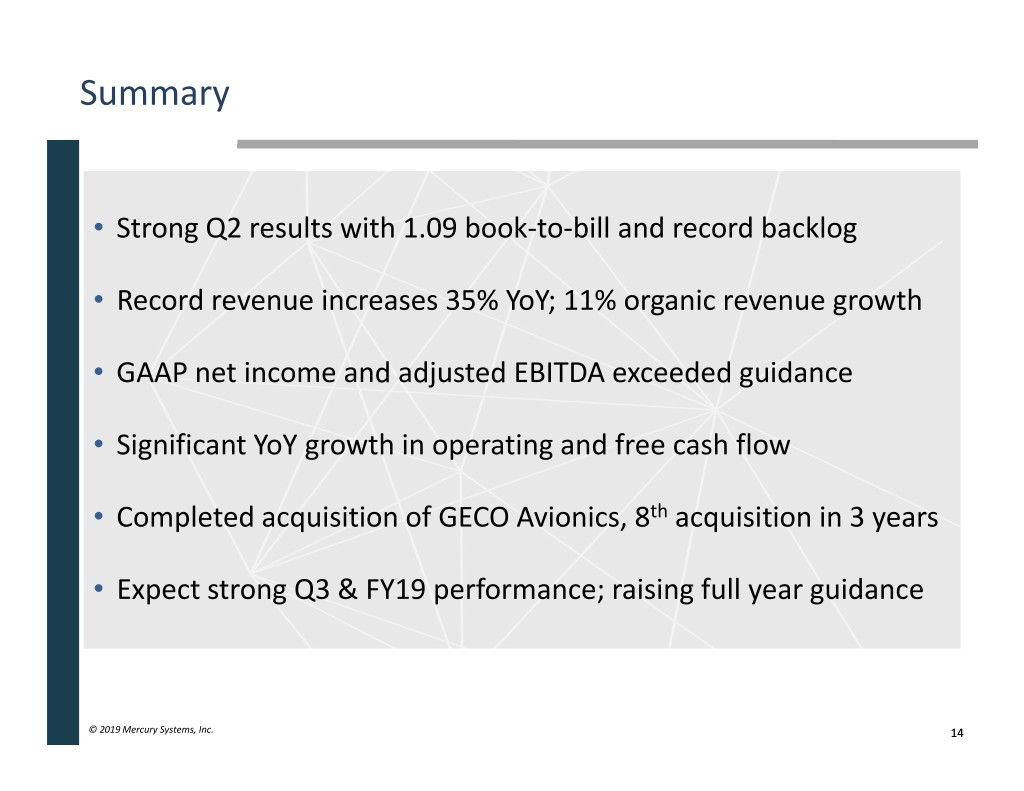
Summary • Strong Q2 results with 1.09 book-to-bill and record backlog • Record revenue increases 35% YoY; 11% organic revenue growth • GAAP net income and adjusted EBITDA exceeded guidance • Significant YoY growth in operating and free cash flow • Completed acquisition of GECO Avionics, 8th acquisition in 3 years • Expect strong Q3 & FY19 performance; raising full year guidance © 2019 Mercury Systems, Inc. 14
Appendix © 2019 Mercury Systems, Inc.
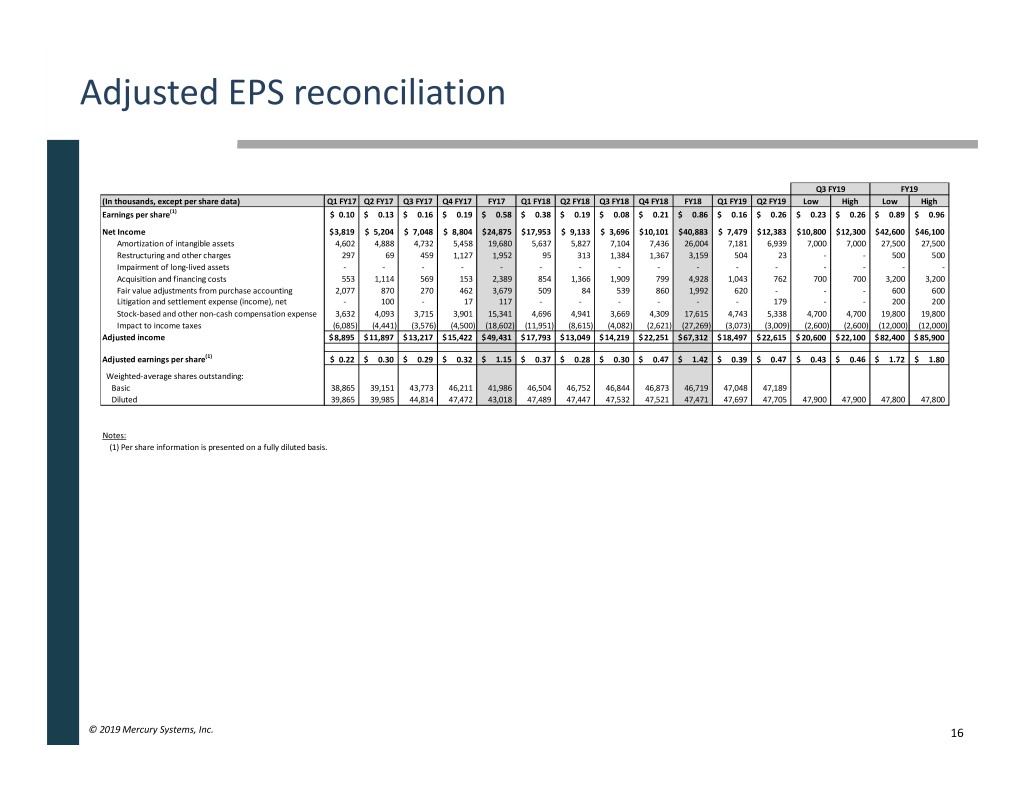
Adjusted EPS reconciliation Q3 FY19 FY19 (In thousands, except per share data) Q1 FY17 Q2 FY17 Q3 FY17 Q4 FY17 FY17 Q1 FY18 Q2 FY18 Q3 FY18 Q4 FY18 FY18 Q1 FY19 Q2 FY19 Low High Low High Earnings per share(1) $ 0.10 $ 0.13 $ 0.16 $ 0.19 $ 0.58 $ 0.38 $ 0.19 $ 0.08 $ 0.21 $ 0.86 $ 0.16 $ 0.26 $ 0.23 $ 0.26 $ 0.89 $ 0.96 Net Income $ 3,819 $ 5,204 $ 7,048 $ 8,804 $ 24,875 $ 17,953 $ 9,133 $ 3,696 $ 10,101 $ 40,883 $ 7,479 $ 12,383 $ 10,800 $ 12,300 $ 42,600 $ 46,100 Amortization of intangible assets 4,602 4,888 4,732 5,458 19,680 5,637 5,827 7,104 7,436 26,004 7,181 6,939 7,000 7,000 27,500 27,500 Restructuring and other charges 297 69 459 1,127 1,952 95 313 1,384 1,367 3,159 504 23 - - 500 500 Impairment of long-lived assets - - - - - - - - - - - - - - - - Acquisition and financing costs 553 1,114 569 153 2,389 854 1,366 1,909 799 4,928 1,043 762 700 700 3,200 3,200 Fair value adjustments from purchase accounting 2,077 870 270 462 3,679 509 84 539 860 1,992 620 - - - 600 600 Litigation and settlement expense (income), net - 100 - 17 117 - - - - - - 179 - - 200 200 Stock-based and other non-cash compensation expense 3,632 4,093 3,715 3,901 15,341 4,696 4,941 3,669 4,309 17,615 4,743 5,338 4,700 4,700 19,800 19,800 Impact to income taxes (6,085) (4,441) (3,576) (4,500) (18,602) (11,951) (8,615) (4,082) (2,621) (27,269) (3,073) (3,009) (2,600) (2,600) (12,000) (12,000) Adjusted income $ 8,895 $ 11,897 $ 13,217 $ 15,422 $ 49,431 $ 17,793 $ 13,049 $ 14,219 $ 22,251 $ 67,312 $ 18,497 $ 22,615 $ 20,600 $ 22,100 $ 82,400 $ 85,900 Adjusted earnings per share(1) $ 0.22 $ 0.30 $ 0.29 $ 0.32 $ 1.15 $ 0.37 $ 0.28 $ 0.30 $ 0.47 $ 1.42 $ 0.39 $ 0.47 $ 0.43 $ 0.46 $ 1.72 $ 1.80 Weighted-average shares outstanding: Basic 38,865 39,151 43,773 46,211 41,986 46,504 46,752 46,844 46,873 46,719 47,048 47,189 Diluted 39,865 39,985 44,814 47,472 43,018 47,489 47,447 47,532 47,521 47,471 47,697 47,705 47,900 47,900 47,800 47,800 Notes: (1) Per share information is presented on a fully diluted basis. © 2019 Mercury Systems, Inc. 16
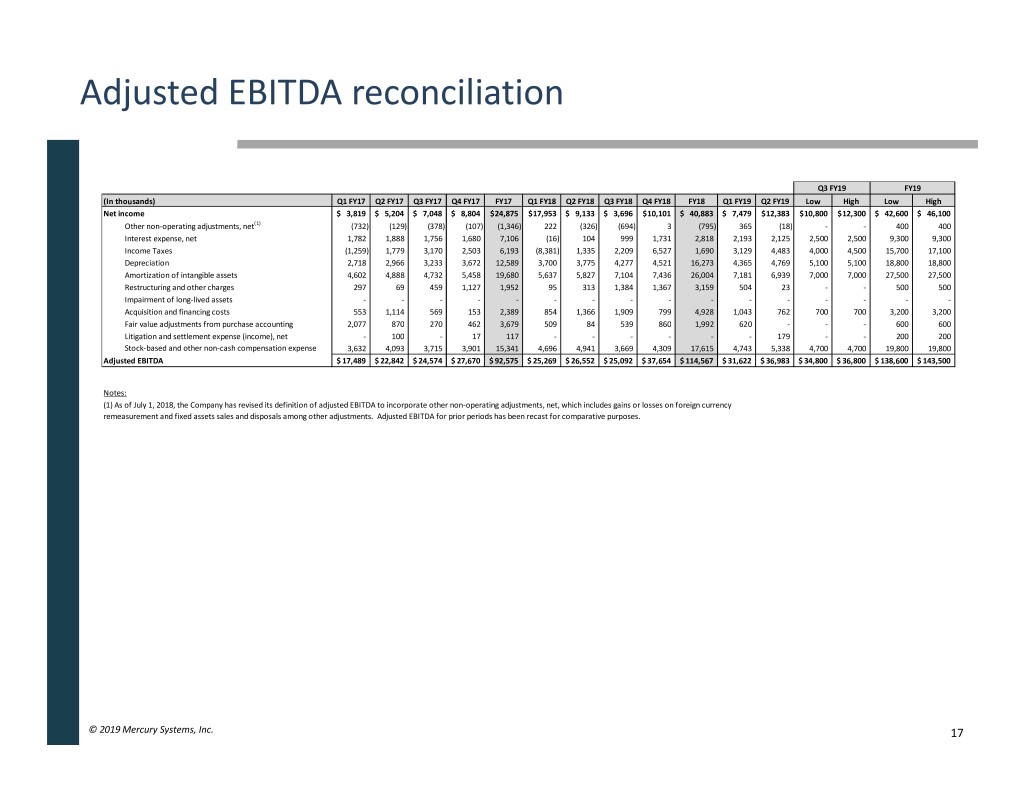
Adjusted EBITDA reconciliation Q3 FY19 FY19 (In thousands) Q1 FY17 Q2 FY17 Q3 FY17 Q4 FY17 FY17 Q1 FY18 Q2 FY18 Q3 FY18 Q4 FY18 FY18 Q1 FY19 Q2 FY19 Low High Low High Net income $ 3,819 $ 5,204 $ 7,048 $ 8,804 $ 24,875 $ 17,953 $ 9,133 $ 3,696 $ 10,101 $ 40,883 $ 7,479 $ 12,383 $ 10,800 $ 12,300 $ 42,600 $ 46,100 Other non-operating adjustments, net(1) (732) (129) (378) (107) (1,346) 222 (326) (694) 3 (795) 365 (18) - - 400 400 Interest expense, net 1,782 1,888 1,756 1,680 7,106 (16) 104 999 1,731 2,818 2,193 2,125 2,500 2,500 9,300 9,300 Income Taxes (1,259) 1,779 3,170 2,503 6,193 (8,381) 1,335 2,209 6,527 1,690 3,129 4,483 4,000 4,500 15,700 17,100 Depreciation 2,718 2,966 3,233 3,672 12,589 3,700 3,775 4,277 4,521 16,273 4,365 4,769 5,100 5,100 18,800 18,800 Amortization of intangible assets 4,602 4,888 4,732 5,458 19,680 5,637 5,827 7,104 7,436 26,004 7,181 6,939 7,000 7,000 27,500 27,500 Restructuring and other charges 297 69 459 1,127 1,952 95 313 1,384 1,367 3,159 504 23 - - 500 500 Impairment of long-lived assets - - - - - - - - - - - - - - - - Acquisition and financing costs 553 1,114 569 153 2,389 854 1,366 1,909 799 4,928 1,043 762 700 700 3,200 3,200 Fair value adjustments from purchase accounting 2,077 870 270 462 3,679 509 84 539 860 1,992 620 - - - 600 600 Litigation and settlement expense (income), net - 100 - 17 117 - - - - - - 179 - - 200 200 Stock-based and other non-cash compensation expense 3,632 4,093 3,715 3,901 15,341 4,696 4,941 3,669 4,309 17,615 4,743 5,338 4,700 4,700 19,800 19,800 Adjusted EBITDA $ 17,489 $ 22,842 $ 24,574 $ 27,670 $ 92,575 $ 25,269 $ 26,552 $ 25,092 $ 37,654 $ 114,567 $ 31,622 $ 36,983 $ 34,800 $ 36,800 $ 138,600 $ 143,500 Notes: (1) As of July 1, 2018, the Company has revised its definition of adjusted EBITDA to incorporate other non-operating adjustments, net, which includes gains or losses on foreign currency remeasurement and fixed assets sales and disposals among other adjustments. Adjusted EBITDA for prior periods has been recast for comparative purposes. © 2019 Mercury Systems, Inc. 17
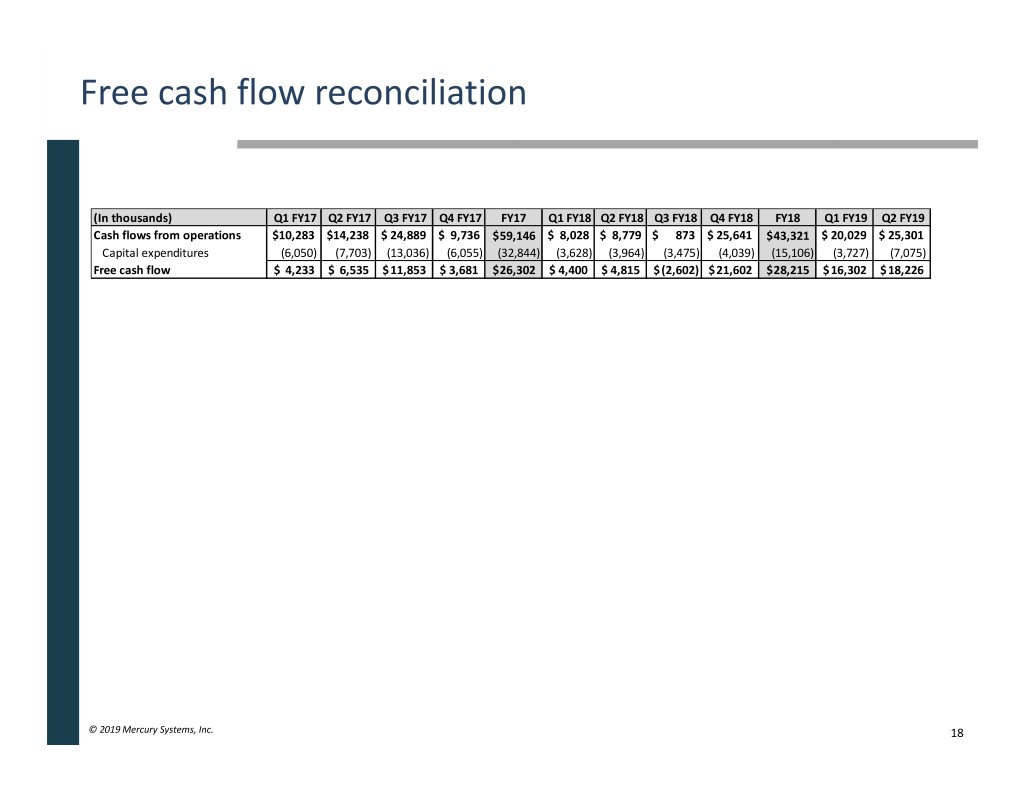
Free cash flow reconciliation (In thousands) Q1 FY17 Q2 FY17 Q3 FY17 Q4 FY17 FY17 Q1 FY18 Q2 FY18 Q3 FY18 Q4 FY18 FY18 Q1 FY19 Q2 FY19 Cash flows from operations $10,283 $14,238 $ 24,889 $ 9,736 $ 59,146 $ 8,028 $ 8,779 $ 873 $ 25,641 $ 43,321 $ 20,029 $ 25,301 Capital expenditures (6,050) (7,703) (13,036) (6,055) (32,844) (3,628) (3,964) (3,475) (4,039) (15,106) (3,727) (7,075) Free cash flow $ 4,233 $ 6,535 $ 11,853 $ 3,681 $ 26,302 $ 4,400 $ 4,815 $ (2,602) $ 21,602 $ 28,215 $ 16,302 $ 18,226 © 2019 Mercury Systems, Inc. 18
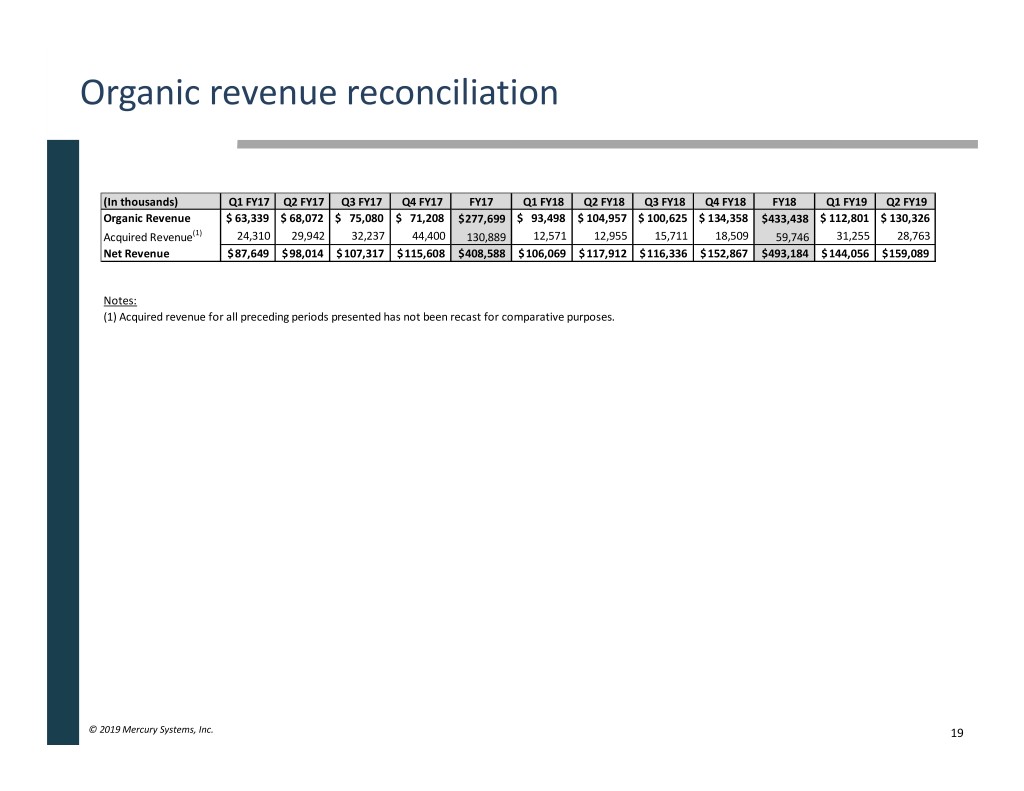
Organic revenue reconciliation (In thousands) Q1 FY17 Q2 FY17 Q3 FY17 Q4 FY17 FY17 Q1 FY18 Q2 FY18 Q3 FY18 Q4 FY18 FY18 Q1 FY19 Q2 FY19 Organic Revenue $ 63,339 $ 68,072 $ 75,080 $ 71,208 $ 277,699 $ 93,498 $ 104,957 $ 100,625 $ 134,358 $ 433,438 $ 112,801 $ 130,326 Acquired Revenue(1) 24,310 29,942 32,237 44,400 130,889 12,571 12,955 15,711 18,509 59,746 31,255 28,763 Net Revenue $ 87,649 $ 98,014 $ 107,317 $ 115,608 $ 408,588 $ 106,069 $ 117,912 $ 116,336 $ 152,867 $ 493,184 $ 144,056 $ 159,089 Notes: (1) Acquired revenue for all preceding periods presented has not been recast for comparative purposes. © 2019 Mercury Systems, Inc. 19
