Attached files
| file | filename |
|---|---|
| 8-K - CHOICEONE FORM 8-K - CHOICEONE FINANCIAL SERVICES INC | choice8k_012919.htm |
EXHIBIT 99.1

Kelly Potes, President & CEO Adom Greenland , SVP & COO Thomas Lampen , SVP & CFO
| |
Forward Looking Statements. This presentation contains forward - looking statements that are based on management’s beliefs, assumptions, current expectations, estimates and projections about the financial services industry, the economy, and ChoiceOne Financial Services, Inc. These statements are not guarantees of future performance and involve certain risks, uncertainties and assumptions (“risk factors”) that are difficult to predict with regard to timing, extent, likelihood, and degree of occurrence. Actual results and outcomes may materially differ from what may be expressed, implied or forecasted in such forward - looking statements. Disclaimer
| |
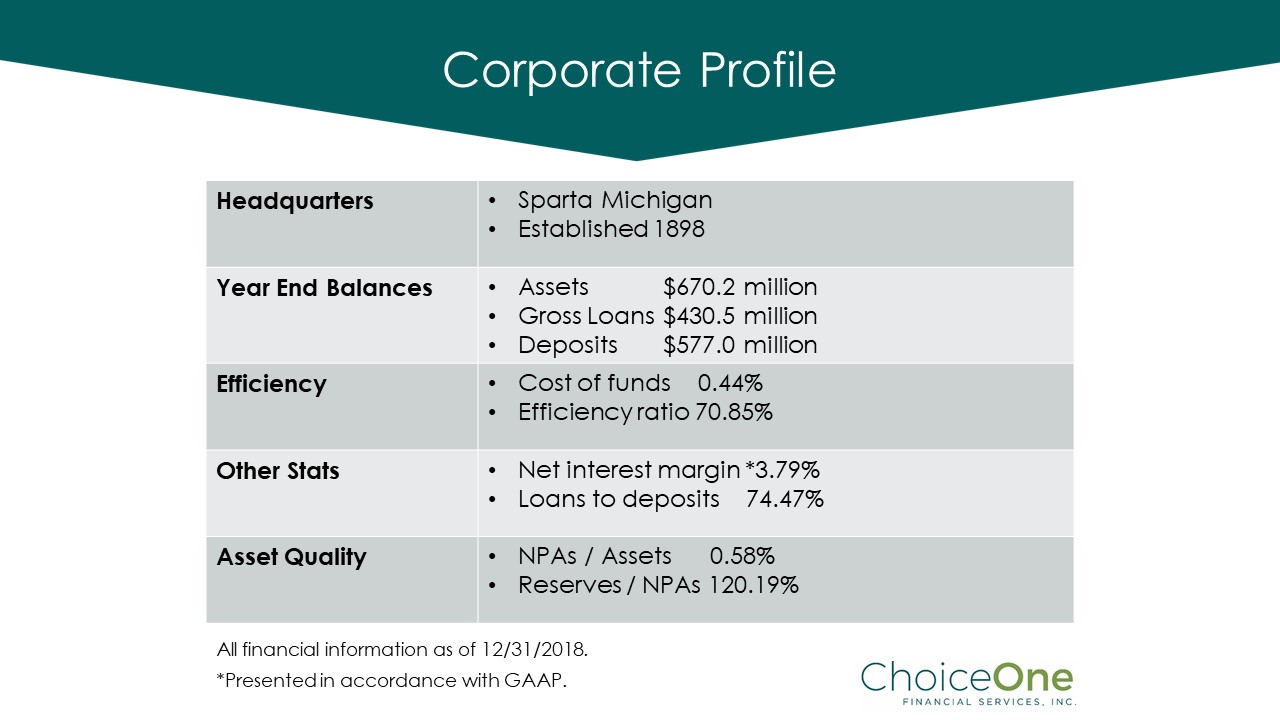
Corporate Profile All financial information as of 12/31/2018. *Presented in accordance with GAAP. Headquarters • Sparta Michigan • Established 1898 Year End Balances • Assets $670.2 million • Gross Loans $430.5 million • Deposits $577.0 million Efficiency • Cost of funds 0.44% • Efficiency ratio 70.85% Other Stats • Net interest margin *3.79% • Loans to deposits 74.47% Asset Quality • NPAs / Assets 0.58% • Reserves / NPAs 120.19%
| |
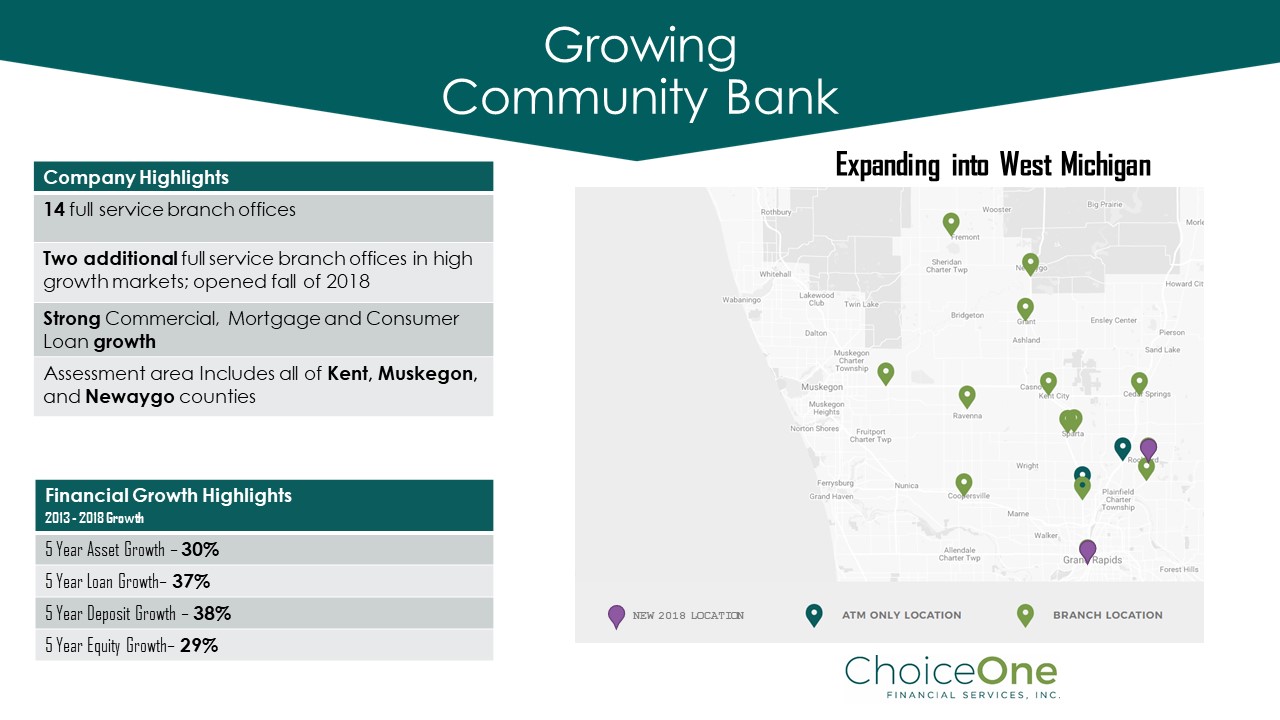
Growing Community Bank Expanding into West Michigan Company Highlights 14 full service branch offices Two additional full service branch offices in high growth markets; opened fall of 2018 Strong Commercial, Mortgage and Consumer Loan growth Assessment area Includes all of Kent, Muskegon, and Newaygo counties Financial Growth Highlights 2013 - 2018 Growth 5 Year Asset Growth – 30% 5 Year Loan Growth – 37% 5 Year Deposit Growth – 38% 5 Year Equity Growth – 29% NEW 2018 LOCATION
| |

Strong Market Conditions Grand Rapids Global Trade Magazine ranked Grand Rapids among the top 10 “Emerging Cities” in the US for global trade West Michigan's economy is the fastest - growing economy in the U.S. The Wall Street Journal recognized Grand Rapids as the 2nd best place to live in the United States Forbes named Grand Rapids the Best City for Raising a Family due to low cost of living and having a school system that ranks in the top third in the county More than 130 international companies 8th largest biopharmaceuticals cluster in the U.S. The food & agriculture industry in Michigan contributes $91.4 billion annually to the state’s economy #13 among states for individuals in science & engineering occupations as a percentage of workforce Source: rightplace.org
| |

History of Growth 120 162 Years of Service Employees 14 Full Service Offices $550,000 $568,000 $607,000 $647,000 $670,000 $400,000 $450,000 $500,000 $550,000 $600,000 $650,000 $700,000 2014 2015 2016 2017 2018 Total Assets (in thousands) Successful Growth 1898 – Sparta State Bank Incorporated 1990 – Sparta State Bank renames to ChoiceOne Bank 1990 – Kent City Bank purchases Grant State Bank and renames to Valley Ridge Bank 2006 – ChoiceOne Financial Services and Valley Ridge Financial Corp merge along with their subsidiaries, both retaining the ChoiceOne namesake 2016 – Loan Production Office opens in Downtown Grand Rapids 2018 – Grand opening of innovative full service branch in downtown Grand Rapids 2018 – Grand opening of second full service branch office in downtown Rockford
| |

Senior Management Kelly J. Potes – President, Chief Executive Officer 34 years experience serving ChoiceOne Lee A. Braford – Senior Vice President, Chief Credit Officer 33 years experience serving ChoiceOne Adom J. Greenland – Senior Vice President, Chief Operating Officer, Certified Public Accountant 16 years experience, serving ChoiceOne for 5 years Bradley A. Henion – Senior Vice President, Chief Lending Officer 26 years experience, serving ChoiceOne for 3 years Mary J. Johnson – Senior Vice President, Cashier 33 years experience serving ChoiceOne Thomas L. Lampen – Senior Vice President, Chief Financial Officer, Certified Public Accountant 39 years experience, serving ChoiceOne for 33 years
| |

Local Board Members Paul L. Johnson – Chairman of the Board, former President of Falcon Resources, Inc. Raymond A. Lanning – President New Equipment Leasing, Inc., NEL Financial, LLC Greg L. Armock – Owner and president of Armock Mechanical Contractors, Inc. Bradley F. McGinnis – Owner and President of Megawall. James A. Bosserd – Retired Chief Executive Officer of ChoiceOne Financial Services and its subsidiaries. Nels W. Nyblad – President Nyblad Orchards; Director Nyblad Orchards, Rossroy Enterprises; Nyblad Properties Grand Traverse, LLC; Nyblad Farms; Michigan Agricultural Cooperative Marketing Association. Keith D. Brophy – Managing Director, BCBSM Emerging Markets Business Lab. Roxanne M. Page – Certified Public Accountant and Partner with Beene Garter, LLP. Jack G. Hendon – Certified Public Accountant, Co - Founder, and Partner with H&S Companies, PC. Kelly J. Potes – Chief Executive Officer of ChoiceOne Financial Services and its subsidiaries.
| |
Mission & Vision Our Mission: Provide superior service , quality advice , and show utmost respect to everyone we meet. Our Vision: Become the Best Bank in Michigan.
| |

Strategic Focus Growing Franchise in West Michigan • Downtown Grand Rapids • Muskegon Full Assessment Area • 14 Full - Service Branches Investing in Employees • Hiring Talent • Advanced Education • Regular Training & Development Advancing Technology • Interactive Teller Machines (ITMs) • Online Applications & 24 Hour Hotline for Retail Loans • Online Deposit Account Opening • Mobile Deposits Partnering with Michigan Fintech Companies • Autobooks – Small Business Invoicing & Accounting • Plinqit – Fun Sized Savings for Retail
| |

Award Winning National Top 20 Most Innovative Community Bank Best of FinXTech Startup Innovation Finalist 2018 2018 2018 2018 2018 2017 Newsmaker of the year nominee in Finance BAI Global Innovation Awards Nominee National Bank Marketing Video Award Nominee National Community Bank Service Award
| |

Net Income Earnings Per Share $- $0.50 $1.00 $1.50 $2.00 $2.50 $- $1,000 $2,000 $3,000 $4,000 $5,000 $6,000 $7,000 $8,000 2014YE 2015YE 2016YE 2017YE 2018YE Net Income and Earnings per Share Net Income (in thousands) Earnings Per Share
| |

Loans by Category Diversified Loan Portfolio History of successful lending to small business and agriculture. Strong commercial and industrial portfolio. Active residential real estate lending with sold (primarily service retained) and portfolio mortgages. 34% 24% 22% 12% 6% 2% Loans by Category (as of 12/31/2018) Commercial real estate Residential real estate Commercial and industrial Agricultural Consumer Construction real estate
| |

Deposits by Category As of 12.31.2018 Diverse Deposits Continued success in growing diversified deposits. Focus on locally sourced deposits. Expansion into growing markets elevates deposit growth. Significant non - maturity deposit base. Noninterest - bearing demand deposits 27% Interest - bearing demand deposits 23% Money market deposits 15% Savings deposits 13% Local CD 16% Brokered 6%
| |

Total Shareholder Return % Dec 2013 to Dec 2018 87% 52% 0% 10% 20% 30% 40% 50% 60% 70% 80% 90% 100% Return Percentage COFS-US S&P 500 Per S&P Global Market Intelligence for stated dates Excellent Shareholder Returns 5% stock dividend paid in both 2017 and 2018. 2.88% dividend yield as of 12/31/2018. $0.71 cash dividend per share in 2018 (adjusted for stock dividend).
| |

Profitability Poised for Growth Efficiency Ratio increase primarily due to employees hired for two new branches and entrance into new market areas. Net interest margin increased in 2018. Net interest margin presented in accordance with GAAP . 61.00% 62.00% 63.00% 64.00% 65.00% 66.00% 67.00% 68.00% 69.00% 70.00% 71.00% 72.00% 3.45% 3.50% 3.55% 3.60% 3.65% 3.70% 3.75% 3.80% 3.85% 2014 2015 2016 2017 2018 Net Interest Margin & Efficiency Ratio Net Interest Margin Efficiency Ratio
| |

Market Capitalization and Price to Tangible Book Growing Enterprise Value Consistent growth in Market Capitalization. Price to tangible book at 143% as of 12/31/2018. Authorized 100,000 shares buyback program in January 2018. 120% 125% 130% 135% 140% 145% 150% $65 $70 $75 $80 $85 $90 $95 2014 2015 2016 2017 2018 Market Capitalization ($M) Price/ Tangible Book (%)
| |

Peer Comparison • National Peer – SNL Banker Peer Query > Holding Company (Publicly Traded Banks) > $300 million to $1 billion. Median balance of peer group used above. • Michigan Peer – SNL Banker Peer Query > Holding Company (Publicly Traded Banks) > $300 million to $1 billion > Operates in Michigan. Median balance of peer group used above. • Based on 9/30/2018 balances as year end data is not yet available. LTM numbers use the last twelve months from 9/30/2018. 2018 Q3 COFS National Peer Michigan Peer ROAA 1.08% .87% .82% ROAE 9.02% 8.77% 9.24% ROATE 12.81% 10.91% 11.82% Dividend Yield 2.65% 1.47% 2.09% NPLs / Loans .89% .99% 1.77% Tier 1 Capital 13.0% 14.4% 15.3% Efficiency 70.27% 68.67% 72.56%
| |
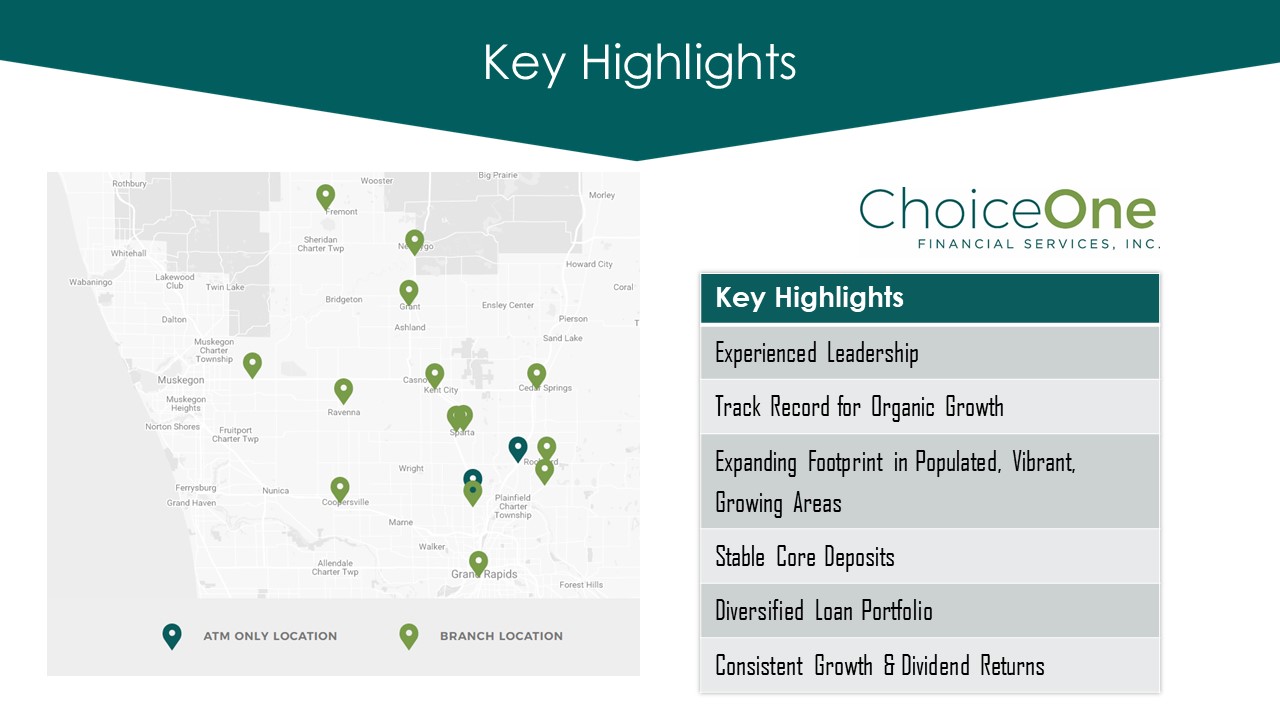
Key Highlights Key Highlights Experienced Leadership Track Record for Organic Growth Expanding Footprint in Populated, Vibrant, Growing Areas Stable Core Deposits Diversified Loan Portfolio Consistent Growth & Dividend Returns