Attached files
| file | filename |
|---|---|
| EX-99.1 - EXHIBIT 99.1 - SMARTFINANCIAL INC. | a2017123118q4earningsrelea.htm |
| 8-K - 8-K SMARTFINANCIAL 4TH QTR 2018 EARNINGS RELEASE - SMARTFINANCIAL INC. | a2018q412312018earningsrel.htm |
Fourth Quarter 2018 Earnings Release January 24, 2019

Legal Disclaimer Forward-Looking Statements Certain of the statements made in this presentation may constitute forward-looking statements within the meaning of the Private Securities Litigation Reform Act of 1995, Section 27A of the Securities Act of 1933, as amended, and Section 21E of the Securities Exchange Act of 1934, as amended. The words “expect,” “anticipate,” “intend,” “plan,” “believe,” “seek,” and “estimate,” and similar expressions, are intended to identify such forward-looking statements, but other statements not based on historical information may also be considered forward-looking, including statements about the benefits to SmartFinancial of its previously announced merger with Entegra Financial Corp. (“Entegra”), SmartFinancial’s future financial and operating results, and SmartFinancial’s plans, objectives, and intentions. All forward-looking statements are subject to risks, uncertainties, and other factors that may cause the actual results, performance, or achievements of SmartFinancial to differ materially from any results, performance, or achievements expressed or implied by such forward-looking statements. Such risks, uncertainties, and other factors include, among others, (1) the risk that the cost savings and any revenue synergies from the proposed merger with Entegra may not be realized or take longer than anticipated to be realized, (2) the risk that the cost savings and any revenue synergies from recently completed mergers may not be realized or may take longer than anticipated to realize, (3) disruption from the proposed merger with Entegra, or recently completed mergers, with customer, supplier, or employee relationships, (4) the occurrence of any event, change, or other circumstances that could give rise to the termination of the agreement and plan of merger among SmartFinancial, CT Merger Sub, Inc., and Entegra providing for the proposed merger with Entegra, (5) the failure to obtain necessary shareholder or regulatory approvals for the merger with Entegra, (6) the possibility that the amount of the costs, fees, expenses, and charges related to the merger with Entegra may be greater than anticipated, including as a result of unexpected or unknown factors, events, or liabilities, (7) the failure of the conditions to the merger with Entegra to be satisfied, (8) the risk of successful integration of the two companies’ businesses, including the risk that the integration of Entegra’s operations with those of SmartFinancial will be materially delayed or will be more costly or difficult than expected, (9) the risk of expansion into new geographic or product markets, (10) reputational risk and the reaction of SmartFinancial’s and Entegra’s customers to the merger, (11) the risk of potential litigation or regulatory action related to the merger with Entegra, (12) the dilution caused by SmartFinancial’s issuance of additional shares of its common stock in the merger with Entegra, and (13) general competitive, economic, political, and market conditions. Additional factors which could affect the forward-looking statements can be found in SmartFinancial’s annual report on Form 10-K, quarterly reports on Form 10-Q, and current reports on Form 8-K filed with the Securities and Exchange Commission (the “SEC”) and available on the SEC’s website at http://www.sec.gov. SmartFinancial disclaims any obligation to update or revise any forward-looking statements contained in this presentation, which speak only as of the date hereof, whether as a result of new information, future events, or otherwise. Non-GAAP Financial Measures Statements included in this presentation include non-GAAP financial measures and should be read along with the accompanying tables, which provide a reconciliation of non-GAAP financial measures to GAAP financial measures. The non-GAAP financial measures used in this presentation include: (i) tangible common equity, (ii) tangible book value per share, (iii) core net interest margin, (iv) operating efficiency ratio, (v) operating return on average assets, (vi) operating earnings per share, and (vii) operating return on tangible common equity. Tangible common equity excludes total preferred stock, preferred stock paid in capital, goodwill, and other intangible assets, and tangible book value per share reflects the per share value of tangible common equity. Core net interest margin adjusts net interest margin to exclude the impact of purchase accounting. The operating efficiency ratio excludes securities gains and losses and merger related expenses from the efficiency ratio. Net operating income excludes securities gains and losses and merger related expenses, and the effect of the December, 2017 tax law change on deferred tax assets, and the income tax effect of adjustments, and operating return on average assets is net operating income divided by GAAP total average assets. Operating earnings per share is net operating income divided by GAAP total average assets. Operating return on tangible common equity is net operating income divided by tangible common equity. Management believes that non-GAAP financial measures provide additional useful information that allows readers to evaluate the ongoing performance of the company and provide meaningful comparisons to its peers. Non-GAAP financial measures should not be considered as an alternative to any measure of performance or financial condition as promulgated under GAAP, and investors should consider SmartFinancial's performance and financial condition as reported under GAAP and all other relevant information when assessing the performance or financial condition of the company. Non-GAAP financial measures have limitations as analytical tools, and investors should not consider them in isolation or as a substitute for analysis of the results or financial condition as reported under GAAP. 2

Compliance Disclosures Important Information for Shareholders and Investors This presentation shall not constitute an offer to sell, the solicitation of an offer to sell, or the solicitation of an offer to buy any securities or the solicitation of any vote or approval, nor shall there be any sale of securities in any jurisdiction in which such offer, solicitation, or sale would be unlawful prior to registration or qualification under the securities laws of any such jurisdiction. In connection with SmartFinancial’s proposed merger with Entegra, SmartFinancial will file a registration statement on Form S-4 with the SEC, which will contain the joint proxy statement of SmartFinancial and Entegra and a prospectus of SmartFinancial. Shareholders are encouraged to read the registration statement, including the joint proxy statement/prospectus that will be part of the registration statement, because it will contain important information about the proposed transaction, SmartFinancial, and Entegra. After the registration statement is filed with the SEC, the joint proxy statement/prospectus and other relevant documents will be mailed to SmartFinancial and Entegra shareholders and will be available for free on the SEC’s website (www.sec.gov). The joint proxy statement/prospectus will also be made available for free by contacting Ron Gorczynski, SmartFinancial’s Chief Administrative Officer, at (865) 437-5724 or David Bright, the Chief Financial Officer and Treasurer of Entegra, at (828) 524-7000. No offer of securities shall be made except by means of a prospectus meeting the requirements of Section 10 of the Securities Act of 1933, as amended. Participants in the Solicitation SmartFinancial, Entegra, and certain of their respective directors and executive officers may be deemed to be participants in the solicitation of proxies from SmartFinancial and Entegra shareholders in connection with the previously announced proposed merger of SmartFinancial and Entegra under the rules of the SEC. Information about the directors and executive officers of SmartFinancial may be found in the definitive proxy statement for SmartFinancial’s 2018 annual meeting of shareholders, filed with the SEC by SmartFinancial on April 2, 2018, and other documents subsequently filed by SmartFinancial with the SEC. Information about the directors and executive officers of Entegra may be found in the definitive proxy statement for Entegra’s 2018 annual meeting of shareholders, filed by Entegra with the SEC on April 2, 2018. Additional information regarding the interests of these participants will also be included in the joint proxy statement/prospectus regarding the proposed transaction when it becomes available. Free copies of these documents maybe obtained as described in the paragraph above. 3

Overview of SmartFinancial ▪ SmartFinancial, Inc. (Nasdaq: SMBK) is a $2.3 billion Branch Footprint asset bank holding company headquartered in Knoxville, Tennessee Nashville Knoxville Greensboro ▪ Jonesboro Operates one subsidiary bank, SmartBank, which was founded 40 in January 2007 ARKANSAS ▪ TENNESSEE NORTH CAROLINA Located primarily in attractive, high-growthMemphismarkets Chattanooga throughout East Tennessee, Alabama and Florida ▪ 77 380 full-time employees Huntsville SOUTH ▪ ~$256 million market capitalization(1) 85 CAROLINA ▪ Balance Sheet (12/31/18) Atlanta Birmingham 20 ▪ Assets: $2.3 billion Tuscaloosa GEORGIA ▪ Gross Loans: $1.8 billion ▪ Deposits: $1.9 billion MISSISSIPPI ALABAMA Columbus ▪ Jackson 16 Tangible Common Equity: $204 million Montgomery ▪ Profitability (Q4 ’18) Savannah ▪ 65 Net Income / Operating Net Income: $6.4 million / $5.9 million 75 95 ▪ ROAA / Operating ROAA: 1.17% / 1.07% ▪ ROATCE / Operating ROATCE: 13.09% / 12.00% Mobile 10 ▪ Baton Rouge Efficiency Ratio / Operating Efficiency Ratio: 67.7% / 62.0% Tallahassee SMBK Branch New Orleans FLORIDA ▪ Asset Quality ▪ Superior asset quality and proven credit culture ▪ NPAs / Assets of 0.24% ▪ NCOs / Average Loans of 0.04% Financial data as of or for the three months ended 12/31/18 (1) Pricing data as of 01/23/19 Note: For a reconciliation of these non-GAAP financial measures to their most directly comparable GAAP measures see Appendix 4

Culture We are building a culture where Associates thrive and are empowered to be leaders. The core values that we have established as a company help us operate in unison and have become a critical part of our culture. Our Associates are key to SmartBank’s success. Core Values Act with Integrity Delivering Be Enthusiastic Exhibiting Creating Exceptional, reate Positivity over-the-top C “WOW” Professional & Enthusiasm Demonstrate Accountability Experiences Knowledgeable and Positivity Embrace Change Service Positioning Statement At SmartBank, delivering unparalleled value to our Shareholders, Associates, Clients and the Communities we serve drives every decision and action we take. Exceptional value means being there with smart solutions, fast responses and deep commitment every single time. By doing this, we will create the Southeast’s next, great community banking franchise. 5

An Emerging Southeast Acquirer ▪ SmartFinancial is transforming into an experienced and preferred Southeast acquirer, having completed six transactions that added low-cost core deposits in attractive markets across three states ▪ The pending merger of equals announced with Entegra Financial Corporation on January 15, 2019 increases both scale and scarcity value, creating one of the top 20 largest banks by total assets across an expansive six state footprint in desirable Southeast markets Core Merger Current Deposits Completion SmartBank Acquired1 Merger Target Merger Type Date Target Markets Branches ($000) GulfSouth Private Bank FDIC - Assisted Transaction 10/19/12 Panhandle Florida 2 111,900 Cornerstone Community Bank Reverse Merger of Equals 08/31/15 Chattanooga MSA 5 287,609 Cleveland, TN Branch Branch 05/19/17 Cleveland, TN 1 21,900 Capstone Bank Whole Bank 11/01/17 Alabama 8 379,911 Southern Community Bank Whole Bank 05/01/18 Middle TN/Huntsville, AL 3 203,029 Foothills Bank & Trust Whole Bank 11/01/18 Knoxville, TN 3 183,037 Entegra Bank Merger of Equals - Western NC/Upstate SC/North GA 19 1,138,561 Acquired Franchise 41 2,325,947 Pro Forma SMBK Franchise2 47 2,851,418 1 Core deposits are defined as Total Deposits less Brokered Deposits and Listing Service Deposits, as reported just prior to completion 2 Pro Forma SMBK franchise reflects reported 3Q2018 Core Deposits, adjusted to include Foothills Bank & Trust (closed 11/01/18) and Entegra Bank Source: S&P Global Market Intelligence 6

Disciplined Acquisition Strategy ▪ SmartFinancial has adhered to a disciplined set of merger criteria including: ▪ No more than 3 years of initial TBV-per-share dilution ▪ Meaningful EPS accretion in the first full year of operations ▪ Conservative loan marks ▪ Franchise additive ▪ SmartFinancial is committed to balancing organic growth with thoughtful acquisitions and will not make acquisitions simply for the sake of growth ▪ The table below shows the initial projected impacts of the four whole bank acquisitions announced within the last 8 quarters First Full Year TBV EPS Accretion P/TBV Credit Mark Target Announcement Earnback1 (Projected) (Announce) Approach Capstone Bank May 2017 ~ 3.0 years 25% 159% >ALLL Southern Community Bank December 2017 < 2.5 years 10% 149% >ALLL Foothills Bank & Trust June 2018 ~ 2.7 years 8% 168% >ALLL Entegra Bank² January 2019 < 2.5 years 20% 119% >ALLL 1 Earnback periods and EPS accretion for mergers announced before federal tax reform should be more favorable to shareholders under the lower corporate tax rate ² Pricing based on closing price of SMBK stock on 01/14/19 7

Fourth Quarter Financial Highlights

Performance Trends ▪ Net Operating Earnings (Non-GAAP) of $5.9 ROAA (%) ROATCE (%) million for the quarter, up 61% from a year 1.17 % 13.09 % 1.07 % 12.00 % 0.99 % 1.00 % 0.98 % 11.04 % 10.84 % earlier 0.89 % 9.94 % 0.85 % 9.44 % 0.80 % 0.81 % 9.04 % 8.96 % 8.10 % ▪ ROAA of 1.17% for the quarter and Net Operating ROAA (Non-GAAP) of 1.07% 0.01 % 0.10 % ▪ ROATCE of 13.09% for the quarter and Operating ROATCE (Non-GAAP) of 12.00% Reported Operating (1)(2) ▪ Efficiency Ratio of 67.7% for the quarter and Operating Efficiency Ratio (Non-GAAP) of 62.0% Net Interest Margin (%) Efficiency Ratio (%) ▪ Net Interest Margin (fully taxable equivalent 4.54 % 72.3 % 72.4 % 72.3 % “FTE”) of 4.29%, up 18 basis points from the 4.49 % 71.3 % 4.36 % 4.29 % 69.1 % 4.11 % 67.7 % prior quarter 4.04 % 67.2 % 3.94 % 64.8 % 64.8 % 3.78 % 3.85 % 3.74 % 62.0 % ▪ Nonperforming Assets were 0.24% of Total Assets ▪ Completed acquisition of Foothills Bancorp, Inc. on November 1, 2018 Reported Operating (1)(2) (1) Operating profitability (non-GAAP) figures exclude gain on sale of securities, merger-related expenses and nonrecurring items (2) Operating net interest margin (non-GAAP) excludes purchase accounting adjustments Note: For a reconciliation of these non-GAAP financial measures to their most directly comparable GAAP measures, see the Appendix 9

Balance Sheet Trends Total Assets ($mm) Net Loans ($mm) 2,500 2,000 2,274 1,769 2,062 2,051 1,568 1,578 2,000 1,600 1,721 1,760 1,317 1,368 1,500 1,200 1,062 808 1,000 800 500 400 0 0 YE 2016 YE 2017 Q1'18 Q2'18 Q3'18 Q4'18 YE 2016 YE 2017 Q1'18 Q2'18 Q3'18 Q4'18 Total Deposits ($mm) Book Value Per Share 2,400 $22.50 $20.31 2,000 1,922 $19.48 $19.74 1,717 1,707 $20.00 $18.46 $18.60 1,600 1,439 1,500 $17.50 1,200 $15.81 907 $14.69 $14.64 $15.00 $14.09 $14.09 $14.38 800 $13.90 400 $12.50 0 $10.00 YE 2016 YE 2017 Q1'18 Q2'18 Q3'18 Q4'18 YE 2016 YE 2017 Q1'18 Q2'18 Q3'18 Q4'18 Book Value Tangible Book Value(1) (1) For a reconciliation of this non-GAAP financial measure to its most directly comparable GAAP measures, see the Appendix 10

Earnings Profile – Fourth Quarter 2018 ▪ Net Operating Diluted EPS (Non- GAAP) increased 27% year over 4Q18 3Q18 4Q17 year (“YoY”) Total Interest Income $26,771 $23,068 $17,244 Total Interest Expense 5,324 4,208 1,902 ▪ Earnings Before Income Taxes increased 57% YoY Net Interest Income 21,447 18,860 15,342 Total Noninterest Income 1,680 1,831 1,581 ▪ Net Interest Income increased 40% Total Revenue 23,127 20,691 16,923 YoY primarily due to higher average Provision for Loan Losses 1,329 302 442 earning asset balances and higher Total Noninterest Expense 15,660 14,759 12,566 earning asset yields Earnings Before Income Taxes 6,137 5,630 3,913 ▪ Increases in Noninterest Expense Income Tax Expense (307) 1,305 3,875 primarily driven by higher salary Net Income Available to Common Shareholders $6,444 $4,325 $38 and occupancy expense from Net Income Per Share: completed acquisitions, as well as Diluted Net Income Per Share $0.47 $0.34 $0.00 merger expenses Net Operating Earnings Per Share (Non-GAAP): ▪ Total Revenue increased 37% YoY Diluted Operating Earnings Per Share $0.43 $0.39 $0.34 Note: For a reconciliation of non-GAAP financial measures to their most directly comparable GAAP measures, see the Appendix 11

Net Interest Income ▪ Net Interest Margin (FTE) increased quarter to quarter primarily due to higher accretion on acquired loans ▪ Compared to a year ago, Earning Asset Yields are up 16 basis points; the Average Cost of Interest-bearing Liabilities is up 63 basis points ▪ Excluding the effect of purchase accounting adjustments, the Net Interest Margin (FTE) decreased 11 basis points quarter to quarter, primarily due to the full quarter impact of recently issued subordinated debt 4Q18 3Q18 4Q17 Average Yields and Rates 4Q18 3Q18 4Q17 Net Interest Income $21,447 $18,860 $15,342 Average Earning Assets $1,995,112 $1,822,296 $1,316,281 Loans 5.81% 5.43% 5.60% Investment Securities and Interest-bearing Due from Banks 3.08% 2.33% 2.36% Net Interest Margin Federal Funds and Other Investments 1.07% 5.17% 1.79% Earning Asset Yields 5.36% 5.03% 5.20% 4.75% 4.50% Total Interest-bearing Deposits 1.21% 1.11% 0.68% 4.25% Securities Sold Under Agreement to Repurchase 0.33% 0.27% 0.29% 4.00% Subordinated Debt 5.91% 5.90% - Other Borrowings 4.97% 5.11% 3.88% 3.75% Total Interest-bearing Liabilities 1.33% 1.15% 0.70% 3.50% 4Q17 1Q18 2Q18 3Q18 4Q18 Net Interest Margin (FTE) 4.29% 4.11% 4.63% Net Interest Margin (FTE) Net Interest Margin (FTE - ex Purchase Accounting Adj.) (Non-GAAP) Cost of Funds 1.11% 0.94% 0.59% Note: For a reconciliation of non-GAAP financial measures to their most directly comparable GAAP measures, see the Appendix 12
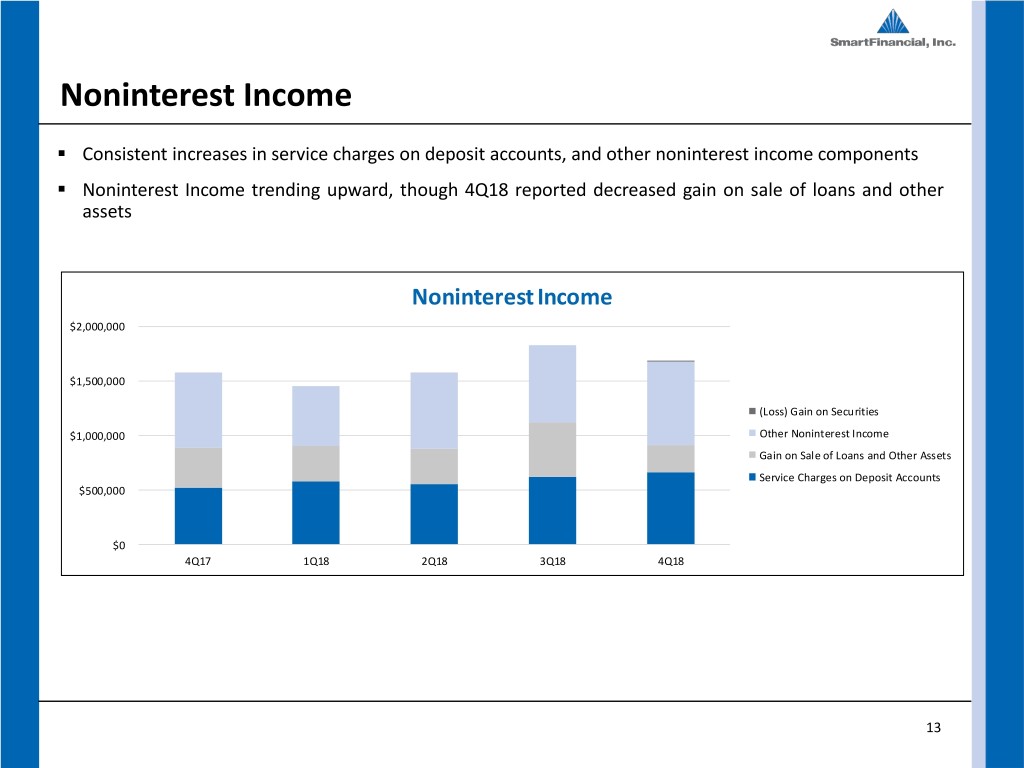
Noninterest Income ▪ Consistent increases in service charges on deposit accounts, and other noninterest income components ▪ Noninterest Income trending upward, though 4Q18 reported decreased gain on sale of loans and other assets Noninterest Income $2,000,000 $1,500,000 (Loss) Gain on Securities $1,000,000 Other Noninterest Income Gain on Sale of Loans and Other Assets Service Charges on Deposit Accounts $500,000 $0 4Q17 1Q18 2Q18 3Q18 4Q18 13

Noninterest Expense ▪ Efficiency Ratio decreased to 67.7%, the lowest of any quarter since the Cornerstone merger in 2015. Operating Efficiency Ratio (Non-GAAP) was 62.0%. ▪ Salary increases are primarily due to the addition of associates from three completed acquisitions for periods presented ▪ Merger expense of $1.3 million in the quarter. Noninterest Expense $20,000,000 72.0% 70.0% Merger expense $15,000,000 68.0% Other 66.0% Amortization of Intangibles $10,000,000 64.0% Data Processing Occupancy 62.0% $5,000,000 Salaries & Benefits 60.0% Operating Efficiency Ratio $0 58.0% 4Q17 1Q18 2Q18 3Q18 4Q18 Note: For a reconciliation of non-GAAP financial measures to their most directly comparable GAAP measures, see the Appendix 14
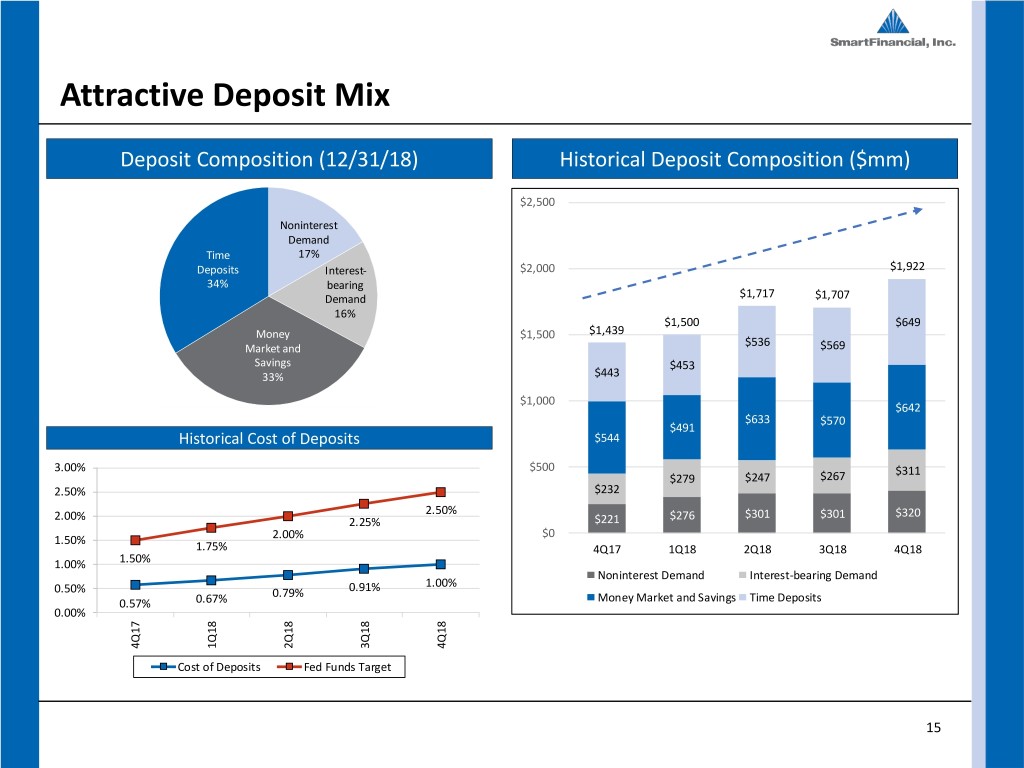
Attractive Deposit Mix Deposit Composition (12/31/18) Historical Deposit Composition ($mm) $2,500 Noninterest Demand Time 17% Deposits Interest- $2,000 $1,922 34% bearing Demand $1,717 $1,707 16% $1,500 $649 Money $1,500 $1,439 $536 Market and $569 Savings $453 33% $443 $1,000 $642 $633 $570 $491 Historical Cost of Deposits $544 3.00% $500 $311 $279 $247 $267 2.50% $232 2.00% 2.50% $276 $301 $301 $320 2.25% $221 $0 1.50% 2.00% 1.75% 4Q17 1Q18 2Q18 3Q18 4Q18 1.00% 1.50% Noninterest Demand Interest-bearing Demand 1.00% 0.50% 0.79% 0.91% 0.57% 0.67% Money Market and Savings Time Deposits 0.00% 4Q17 1Q18 2Q18 3Q18 4Q18 Cost of Deposits Fed Funds Target 15

Overview of Loan Portfolio Loan Composition (12/31/18) Historical Loan Composition ($mm) Other $2,500 1% Residential RE 23% $2,000 C&I CRE, Non $1,777 17% Owner $1,585 Occupied $1,575 $408 27% $1,500 $1,374 CRE, C&D $1,323 $356 $352 Owner 11% Occupied $293 $299 21% $488 $1,000 $386 $400 $362 $375 Historical CRE Ratios $360 $364 $372 $500 $281 $289 $188 $143 $179 $166 400% $135 $238 $256 $279 $290 $308 300% 273.5% $0 200% 4Q17 1Q18 2Q18 3Q18 4Q18 100% C&I C&D 78.1% CRE, Owner Occupied CRE, Non Owner Occupied 0% 4Q17 1Q18 2Q18 3Q18 4Q18 Residential RE Other C&D CRE 16
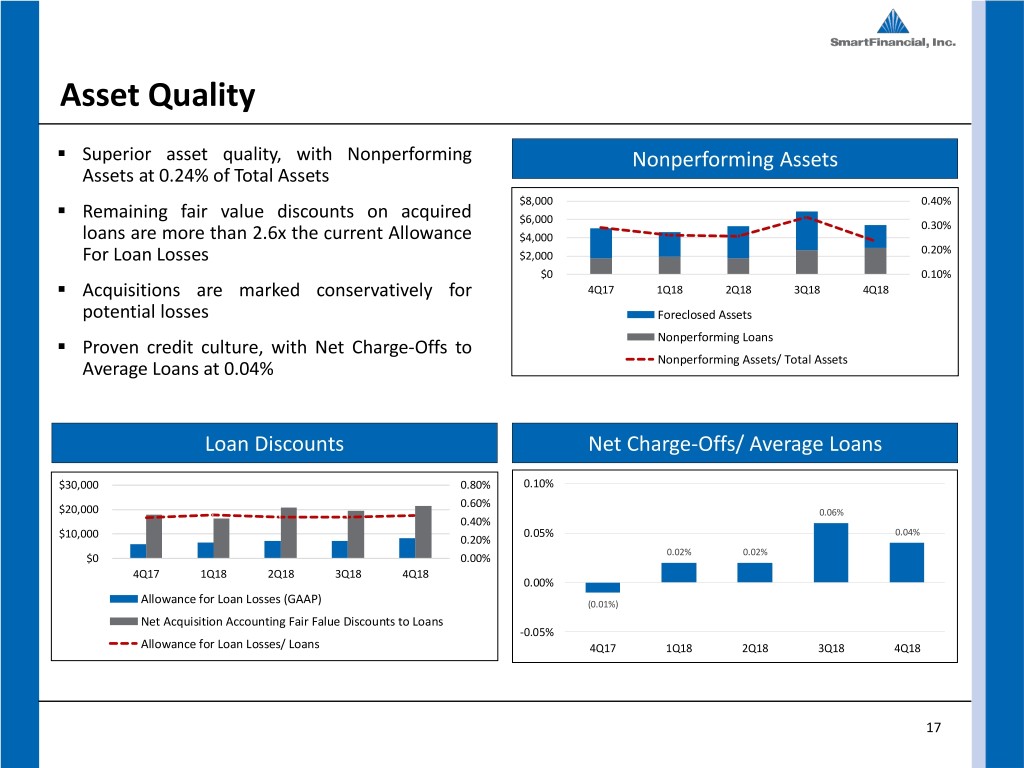
Asset Quality ▪ Superior asset quality, with Nonperforming Nonperforming Assets Assets at 0.24% of Total Assets ▪ $8,000 0.40% Remaining fair value discounts on acquired $6,000 0.30% loans are more than 2.6x the current Allowance $4,000 0.20% For Loan Losses $2,000 ▪ $0 0.10% Acquisitions are marked conservatively for 4Q17 1Q18 2Q18 3Q18 4Q18 potential losses Foreclosed Assets Nonperforming Loans ▪ Proven credit culture, with Net Charge-Offs to Average Loans at 0.04% Nonperforming Assets/ Total Assets Loan Discounts Net Charge-Offs/ Average Loans $30,000 0.80% 0.10% 0.60% $20,000 0.06% 0.40% $10,000 0.05% 0.04% 0.20% 0.02% 0.02% $0 0.00% 4Q17 1Q18 2Q18 3Q18 4Q18 0.00% Allowance for Loan Losses (GAAP) (0.01%) Net Acquisition Accounting Fair Falue Discounts to Loans -0.05% Allowance for Loan Losses/ Loans 4Q17 1Q18 2Q18 3Q18 4Q18 17

Appendix
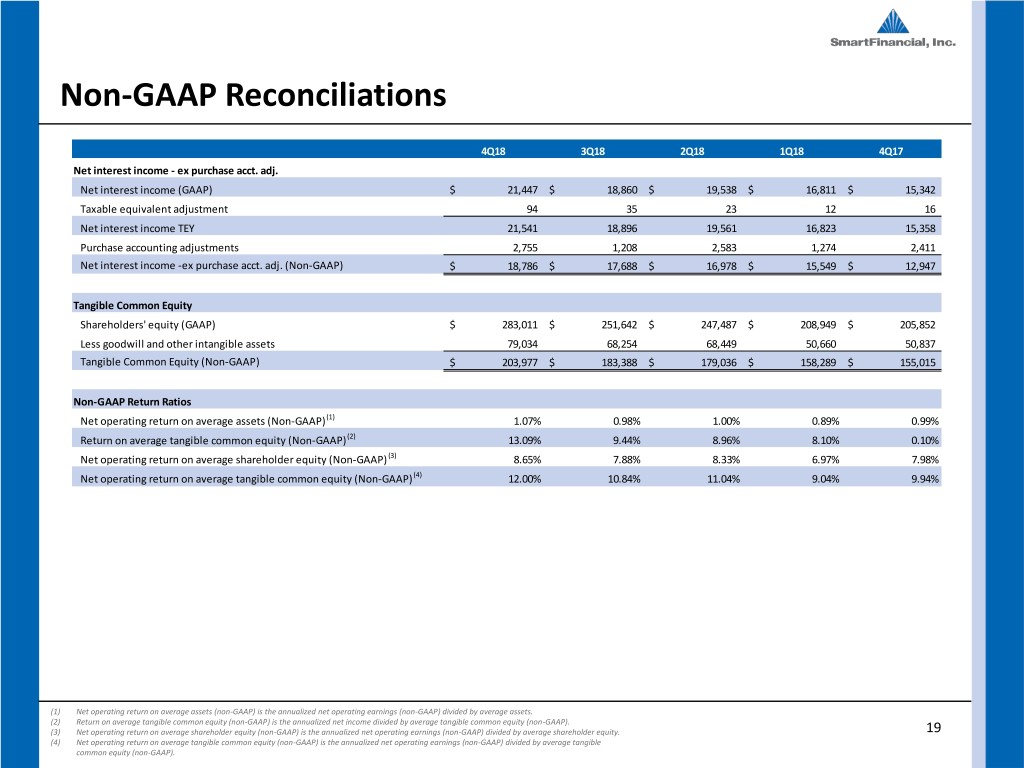
Non-GAAP Reconciliations 4Q18 3Q18 2Q18 1Q18 4Q17 Net interest income - ex purchase acct. adj. Net interest income (GAAP) $ 21,447 $ 18,860 $ 19,538 $ 16,811 $ 15,342 Taxable equivalent adjustment 94 35 23 12 16 Net interest income TEY 21,541 18,896 19,561 16,823 15,358 Purchase accounting adjustments 2,755 1,208 2,583 1,274 2,411 Net interest income -ex purchase acct. adj. (Non-GAAP) $ 18,786 $ 17,688 $ 16,978 $ 15,549 $ 12,947 Tangible Common Equity Shareholders' equity (GAAP) $ 283,011 $ 251,642 $ 247,487 $ 208,949 $ 205,852 Less goodwill and other intangible assets 79,034 68,254 68,449 50,660 50,837 Tangible Common Equity (Non-GAAP) $ 203,977 $ 183,388 $ 179,036 $ 158,289 $ 155,015 Non-GAAP Return Ratios Net operating return on average assets (Non-GAAP)(1) 1.07% 0.98% 1.00% 0.89% 0.99% Return on average tangible common equity (Non-GAAP)(2) 13.09% 9.44% 8.96% 8.10% 0.10% Net operating return on average shareholder equity (Non-GAAP)(3) 8.65% 7.88% 8.33% 6.97% 7.98% Net operating return on average tangible common equity (Non-GAAP)(4) 12.00% 10.84% 11.04% 9.04% 9.94% (1) Net operating return on average assets (non-GAAP) is the annualized net operating earnings (non-GAAP) divided by average assets. (2) Return on average tangible common equity (non-GAAP) is the annualized net income divided by average tangible common equity (non-GAAP). (3) Net operating return on average shareholder equity (non-GAAP) is the annualized net operating earnings (non-GAAP) divided by average shareholder equity. 19 (4) Net operating return on average tangible common equity (non-GAAP) is the annualized net operating earnings (non-GAAP) divided by average tangible common equity (non-GAAP).

Non-GAAP Reconciliations 4Q18 3Q18 2Q18 1Q18 4Q17 Operating Earnings Net income (GAAP) $ 6,444 $ 4,324 $ 3,931 $ 3,415 $ 38 Securities (gains) losses (2) - 1 - - Merger costs 1,322 838 1,123 498 1,694 Tax charge related to change in tax law and tax benefit (1,600) - - - 2,440 Income tax effect of adjustments (256) (196) (211) (103) (506) Net operating earnings available to common shareholders (Non-GAAP) $ 5,908 $ 4,966 $ 4,845 $ 3,810 $ 3,666 Net operating earnings per common share: Basic $0.44 $0.39 $0.40 $0.34 $0.35 Diluted $0.43 $0.39 $0.39 $0.34 $0.34 Operating Efficiency Ratio Efficiency ratio (GAAP) 67.71% 71.34% 72.31% 72.39% 74.22% Adjustment for taxable equivalent yields - (0.18%) (0.11%) (0.06%) (0.09%) Adjustment for securities gains (losses) 0.01% - (0.01%) - - Adjustment for merger expenses (5.72%) (3.99%) (5.28%) (2.71%) (9.97%) Operating efficiency ratio (Non-GAAP) 62.00% 67.17% 66.92% 69.62% 64.16% 20

Transformative Merger of Equals

Our Combined Leadership Team Miller Welborn Chairman 12 SMBK Directors 5 ENFC Directors Billy Carroll, Jr. Roger Plemens President & CEO President of the Carolinas Greg Davis David Bright Rhett Jordan Gary Petty Chief Lending Officer Chief Financial Officer Chief Credit Officer Chief Risk Officer Ryan Scaggs Ron Gorczynski Bill Yoder Diane Short Chief Operations Chief Administrative Chief Banking Officer Chief HR Officer Officer Officer Legacy SMBK 22 Legacy ENFC
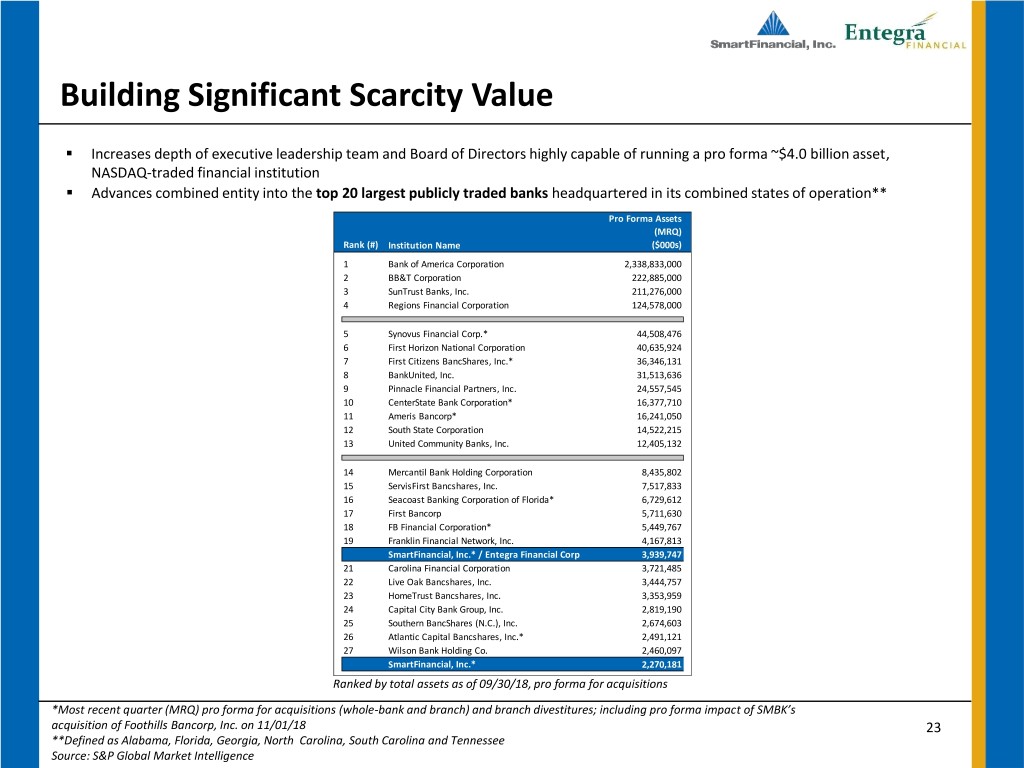
Building Significant Scarcity Value ▪ Increases depth of executive leadership team and Board of Directors highly capable of running a pro forma ~$4.0 billion asset, NASDAQ-traded financial institution ▪ Advances combined entity into the top 20 largest publicly traded banks headquartered in its combined states of operation** Pro Forma Assets (MRQ) Rank (#) Institution Name ($000s) 1 Bank of America Corporation 2,338,833,000 2 BB&T Corporation 222,885,000 3 SunTrust Banks, Inc. 211,276,000 4 Regions Financial Corporation 124,578,000 5 Synovus Financial Corp.* 44,508,476 6 First Horizon National Corporation 40,635,924 7 First Citizens BancShares, Inc.* 36,346,131 8 BankUnited, Inc. 31,513,636 9 Pinnacle Financial Partners, Inc. 24,557,545 10 CenterState Bank Corporation* 16,377,710 11 Ameris Bancorp* 16,241,050 12 South State Corporation 14,522,215 13 United Community Banks, Inc. 12,405,132 14 Mercantil Bank Holding Corporation 8,435,802 15 ServisFirst Bancshares, Inc. 7,517,833 16 Seacoast Banking Corporation of Florida* 6,729,612 17 First Bancorp 5,711,630 18 FB Financial Corporation* 5,449,767 19 Franklin Financial Network, Inc. 4,167,813 SmartFinancial, Inc.* / Entegra Financial Corp. 3,939,747 21 Carolina Financial Corporation 3,721,485 22 Live Oak Bancshares, Inc. 3,444,757 23 HomeTrust Bancshares, Inc. 3,353,959 24 Capital City Bank Group, Inc. 2,819,190 25 Southern BancShares (N.C.), Inc. 2,674,603 26 Atlantic Capital Bancshares, Inc.* 2,491,121 27 Wilson Bank Holding Co. 2,460,097 SmartFinancial, Inc.* 2,270,181 Ranked by total assets as of 09/30/18, pro forma for acquisitions *Most recent quarter (MRQ) pro forma for acquisitions (whole-bank and branch) and branch divestitures; including pro forma impact of SMBK’s acquisition of Foothills Bancorp, Inc. on 11/01/18 23 **Defined as Alabama, Florida, Georgia, North Carolina, South Carolina and Tennessee Source: S&P Global Market Intelligence

Pro Forma Footprint and Highlights Pro Forma Highlights (as of 09/30/18) Nashville North Knoxville Murfreesboro Carolina Assets ($mm) 3,940 Tennessee Asheville Loans ($mm) 2,798 Chattanooga Deposits ($mm) 3,153 Greenville (1) Huntsville TCE Ratio (%) 8.7% South Branches 47 Alabama Gainesville Carolina Loans/Deposits 89% Atlanta Birmingham Pro Forma Deposits by State (as of 06/30/18) Tuscaloosa Georgia Alabama North Montgomery Florida 15% 3% Carolina 27% Mobile Georgia Pensacola Tallahassee Tennessee 10% Panama City 42% SmartFinancial, Inc. Florida South Entegra Financial Corp. Carolina 3% (1) Tangible common equity is a Non-GAAP measure. Refer to appendix for GAAP to Non-GAAP reconciliation. Deposits by state as of 06/30/18 FDIC deposit survey, adjusted for announced acquisitions 24 Pro forma highlights includes pro forma impact of SMBK’s acquisition of Foothills Bancorp, Inc. on 11/01/18; excludes merger-related and purchase accounting adjustments Sources: S&P Global Market Intelligence, FDIC
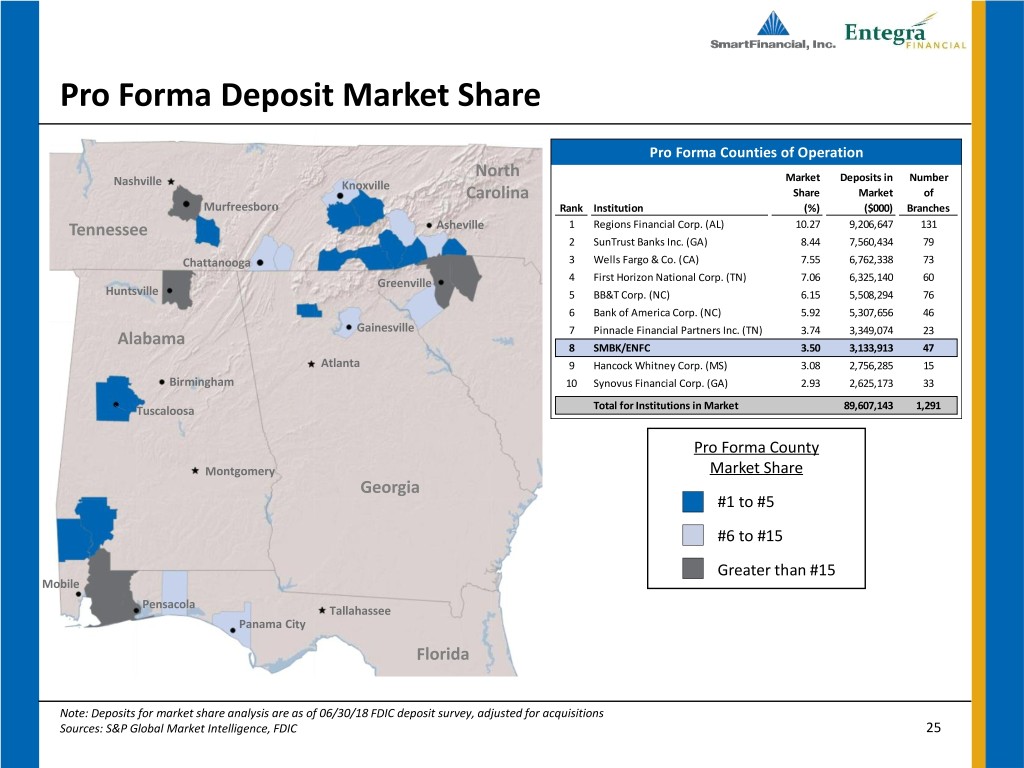
Pro Forma Deposit Market Share Pro Forma Counties of Operation North Market Deposits in Number Nashville Knoxville Carolina Share Market of Murfreesboro Rank Institution (%) ($000) Branches Tennessee Asheville 1 Regions Financial Corp. (AL) 10.27 9,206,647 131 2 SunTrust Banks Inc. (GA) 8.44 7,560,434 79 Chattanooga 3 Wells Fargo & Co. (CA) 7.55 6,762,338 73 Greenville 4 First Horizon National Corp. (TN) 7.06 6,325,140 60 Huntsville 5 BB&T Corp. (NC) 6.15 5,508,294 76 South 6 Bank of America Corp. (NC) 5.92 5,307,656 46 Gainesville Carolina 7 Pinnacle Financial Partners Inc. (TN) 3.74 3,349,074 23 Alabama 8 SMBK/ENFC 3.50 3,133,913 47 Atlanta 9 Hancock Whitney Corp. (MS) 3.08 2,756,285 15 Birmingham 10 Synovus Financial Corp. (GA) 2.93 2,625,173 33 Tuscaloosa Total for Institutions in Market 89,607,143 1,291 Pro Forma County Montgomery Market Share Georgia #1 to #5 #6 to #15 Greater than #15 Mobile Pensacola Tallahassee Panama City Florida Note: Deposits for market share analysis are as of 06/30/18 FDIC deposit survey, adjusted for acquisitions Sources: S&P Global Market Intelligence, FDIC 25

Combined Presence in Several Key Markets ▪ Creates a combined presence in five of the top 25 largest MSAs in a region covering Alabama, Florida, Georgia, North Carolina, South Carolina and Tennessee ▪ Outside of top 25 MSAs, the combined company enhances total deposit market share from existing legacy footprints and incremental growth in less competitive markets SMBK ENFC 2018 2018 2018 2018 2019 In-Market In-Market Pro Forma Total Market Total Deposit Total Population Deposits Deposits 2018 Deposits Deposits Market Share Rank MSA Name (actual) ($000) ($000) ($000) ($000) (%) 1 Miami-Fort Lauderdale-West Palm Beach, FL 6,283,790 - - - 2 Atlanta-Sandy Springs-Roswell, GA 6,017,552 - 164,061 164,061 168,492,164 0.10 3 Tampa-St. Petersburg-Clearwater, FL 3,171,289 - - - 4 Charlotte-Concord-Gastonia, NC-SC 2,591,118 - - - 5 Orlando-Kissimmee-Sanford, FL 2,589,416 - - - 6 Nashville-Davidson--Murfreesboro--Franklin, TN 1,955,604 25,551 - 25,551 61,450,649 0.04 7 Virginia Beach-Norfolk-Newport News, VA-NC 1,740,113 - - - 8 Jacksonville, FL 1,549,094 - - - 9 Raleigh, NC 1,366,959 - - - 10 Memphis, TN-MS-AR 1,351,871 - - - 11 Birmingham-Hoover, AL 1,154,278 - - - 12 Greenville-Anderson-Mauldin, SC 912,621 - 44,917 44,917 16,978,025 0.26 13 Knoxville, TN 887,454 303,487 - 303,487 17,147,660 1.77 14 Columbia, SC 837,258 - - - 15 North Port-Sarasota-Bradenton, FL 825,378 - - - 16 Charleston-North Charleston, SC 799,117 - - - 17 Greensboro-High Point, NC 769,635 - - - 18 Cape Coral-Fort Myers, FL 757,170 - - - 19 Lakeland-Winter Haven, FL 705,037 - - - 20 Winston-Salem, NC 674,337 - - - 21 Deltona-Daytona Beach-Ormond Beach, FL 663,125 - - - 22 Augusta-Richmond County, GA-SC 607,827 - - - 23 Palm Bay-Melbourne-Titusville, FL 602,191 - - - 24 Durham-Chapel Hill, NC 578,696 - - - 25 Chattanooga, TN-GA 562,664 352,609 - 352,609 9,740,525 3.62 TOTAL 39,953,594 681,647 208,978 890,625 273,809,023 0.33 Includes pro forma impact of SMBK’s acquisition of Foothills Bancorp, Inc. on 11/01/18 Ranked by 2019 total population 26 Source: S&P Global Market Intelligence

Investor Contacts Billy Carroll Miller Welborn President & CEO Chairman (865) 868-0613 (423) 385-3067 Billy.Carroll@SmartBank.com Miller.Welborn@SmartBank.com SmartFinancial, Inc. 5401 Kingston Pike, Suite 600 Knoxville, TN 37919 27

