Attached files
| file | filename |
|---|---|
| 8-K - 8-K - National Bank Holdings Corp | nbhc-20190124x8k.htm |
Exhibit 99.1

National Bank Holdings Corporation Announces Fourth Quarter and Record Full Year 2018 Financial Results
Greenwood Village, Colorado - (PR Newswire) – National Bank Holdings Corporation (NYSE: NBHC) reported:
|
|
|
For the quarter |
|
For the quarter - adjusted(1) |
|
For the year |
|
For the year - adjusted (1) |
||||||||||||||||||||||
|
|
|
4Q18 |
|
3Q18 |
|
4Q17 |
|
4Q18 |
|
3Q18 |
|
|
4Q17 |
|
2018 |
|
2017 |
|
2018 |
|
2017 |
|||||||||
|
Net income (loss) ($000's) |
|
$ |
17,235 |
|
$ |
18,240 |
|
$ |
(10,119) |
|
$ |
17,235 |
|
$ |
18,240 |
|
$ |
9,883 |
|
$ |
61,451 |
|
$ |
14,579 |
|
$ |
67,772 |
|
$ |
35,009 |
|
Earnings (loss) per share - diluted |
|
$ |
0.55 |
|
$ |
0.58 |
|
$ |
(0.37) |
|
$ |
0.55 |
|
$ |
0.58 |
|
$ |
0.36 |
|
$ |
1.95 |
|
$ |
0.53 |
|
$ |
2.16 |
|
$ |
1.26 |
|
Return on average tangible assets(2) |
|
|
1.26% |
|
|
1.35% |
|
|
(0.78)% |
|
|
1.26% |
|
|
1.35% |
|
|
0.88% |
|
|
1.15% |
|
|
0.38% |
|
|
1.26% |
|
|
0.82% |
|
Return on average tangible common equity(2) |
|
|
12.29% |
|
|
13.39% |
|
|
(7.41)% |
|
|
12.29% |
|
|
13.39% |
|
|
8.41% |
|
|
11.60% |
|
|
3.61% |
|
|
12.76% |
|
|
7.75% |
| (1) |
|
See non-GAAP reconciliations starting on page 14. |
| (2) |
|
Quarterly ratios are annualized. |
In announcing these results, Chief Executive Officer Tim Laney shared, “We delivered record results on multiple fronts during 2018 and I am pleased to announce record full-year earnings of $2.16 per share after adjusting for acquisition costs. These earnings were the result of our intense focus on developing full client relationships. Our team delivered organic loan growth of 11.7% while maintaining excellent credit quality metrics. This loan growth was fueled by record fourth quarter loan originations of $364.4 million, topping off full-year loan originations of $1.2 billion. We continue to build an attractive book of relationship-based deposits, evidenced by a 2018 deposit beta of just 8%. My teammates and I also continued to focus on expense management. Adjusted for one-time acquisition expenses, full year expenses were $181.4 million, well below our initial 2018 year guidance of $189 million to $192 million.”
Mr. Laney added, “Our recently announced expansion into the Utah marketplace demonstrates our commitment to investing in and growing our business. My teammates are committed to building high-quality client relationships that will benefit our communities and continue to translate into positive shareholder return. Since 2012, we have repurchased 51% of our Company’s stock, and since our last stock repurchase in October 2016, our stock has outperformed the KBW Regional Banking Index by 29.6% and the Russell 2000 Index by 23.8%.”
Fourth Quarter 2018 Results
(All comparisons refer to the third quarter of 2018, except as noted)
Net Interest Income
Fully taxable equivalent net interest income totaled $51.8 million and increased $0.9 million, or 7.2% annualized. Fully taxable equivalent net interest margin was 3.99%, widening 0.03% from the prior quarter, driven by 0.11% higher earning asset yields and partially offset by higher cost of funds. In addition, net interest income included $0.6 million in accelerated accretion benefit from early payoffs of 310-30 loans, a benefit of 0.04% to the fully taxable equivalent net interest margin, and compares to a third quarter accelerated accretion benefit of $0.4 million, or a 0.03% benefit to the fully taxable equivalent net interest margin.
Loans
Originated loans and acquired loans not accounted for under 310-30 (“acquired loans”) exceeded $4.0 billion for the first time in the Company’s history at December 31, 2018, increasing $191.0 million, or 19.8% annualized, led by originated and acquired commercial
1
loan growth of $204.3 million, or 33.5% annualized. Total fourth quarter loan originations were a record $364.4 million, led by commercial loan originations of $269.7 million, which increased 43.3% compared to the prior quarter. The fully taxable equivalent yield on originated loans outstanding increased 0.19% during the fourth quarter to 4.69% due to higher new loan yields and increases in short-term market rates.
Asset Quality and Provision for Loan Losses
Provision for loan losses of $2.5 million was recorded during the quarter to support originated loan growth. Annualized net charge-offs on originated and acquired loans totaled 0.06%, compared to annualized net recoveries of 0.08% in the prior quarter and net charge-offs of 0.02% for the year. Non-performing originated and acquired loans (comprised of non-accrual loans and non-accrual TDRs) were 0.61% of total originated and acquired loans, compared to 0.64% at September 30, 2018. The originated and acquired allowance for loan losses was 0.88%, consistent with the prior quarter.
Acquired problem loans accounted for under 310-30 totaled $70.9 million at December 31, 2018 and decreased $4.0 million from the third quarter. The life-to-date economic benefit of the accretable yield transfers, net of impairments, on 310-30 loans totals $292.8 million. Other real estate owned totaled $10.6 million at December 31, 2018 and decreased $24.5 million from September 30, 2018, or 69.8%. This decrease was driven by the sale of one large property that was previously an acquired 310-30 loan, which was transferred to OREO during the second quarter of 2018, as part of the asset resolution process.
Deposits
Average transaction deposits (defined as total deposits less time deposits) increased $11.4 million, or 1.3% annualized, driven by an increase in average non-interest bearing demand deposits of $7.6 million, or 2.8% annualized. Average total deposits decreased $15.8 million to $4.6 billion, or 1.4% annualized. The cost of deposits was 0.52%, an increase of 0.05% from the prior quarter and 0.08% over the fourth quarter last year.
Non-Interest Income
Non-interest income totaled $15.3 million and decreased $2.7 million primarily due to lower mortgage banking income of $2.4 million, driven by lower levels of 1-4 family mortgage loans sold in the secondary market. Service charges and bank card fees increased a combined $0.1 million and were offset by $0.4 million lower other non-interest income, driven by fair value losses on insurance policies.
Non-Interest Expense
Non-interest expense totaled $42.9 million and decreased $1.6 million from the prior quarter, primarily driven by $1.1 million lower salaries and benefits due to lower mortgage commissions directly related to the decline in mortgage loan volume and lower payroll taxes, $0.5 million lower occupancy and equipment expenses and $0.2 million lower intangible asset amortization.
Capital
Capital ratios continue to be strong and in excess of federal bank regulatory agency “well capitalized” thresholds. The leverage ratio at December 31, 2018 for the consolidated company and NBH Bank was 10.51% and 9.04%, respectively. Shareholders’ equity totaled $695.0 million at December 31, 2018 and increased $21.9 million from the prior quarter end. The increase in shareholders’ equity was due to higher retained earnings and lower accumulated other comprehensive loss, driven by the fair market value fluctuations of the available-for-sale investment securities portfolio.
Common book value per share increased $0.71 to $22.59 at December 31, 2018. The tangible common book value per share was $18.77 at December 31, 2018 and increased $0.73 due to the increase in retained earnings and decrease in accumulated other comprehensive loss, partially offset by dividends paid. Excluding accumulated other comprehensive loss, the tangible book value increased $0.43 to $19.13.
2
A common convention in the industry is to add the value of the accretable yield to the tangible book value per share. The value of the December 31, 2018 accretable yield balance on the 310-30 loans of $35.9 million would add $0.89 after-tax to the tangible book value per share. A more conservative methodology that management uses values the excess yield above 5.0% and then considers the timing of the excess accreted interest income recognition discounted at 5.0%. This would add $0.63 after-tax to our tangible book value per share as of December 31, 2018, resulting in a tangible common book value per share of $19.40.
Year-Over-Year Review
(All comparisons refer to the full year 2017, except as noted)
Fully taxable equivalent net interest income totaled $201.9 million in 2018 and increased $49.8 million, or 32.7%. Average earning assets increased $778.4 million, or 17.9%, driven by originated loan growth and the Peoples acquisition. The fully taxable equivalent net interest margin widened 0.43% to 3.93% as the yield on earning assets increased 0.49%, led by a 0.44% increase in the originated loan portfolio yields due to short-term rate increases, partially offset by an increase in the cost of deposits of 0.04% from 0.41% to 0.45%.
Loan balances at December 31, 2018 totaled $4.1 billion and increased $913.4 million, or 28.7%, while originated and acquired loans outstanding totaled $4.0 billion and increased $963.1 million, or 31.5%, driven by Peoples acquired loans and an increase in originated loans of $615.6 million, or 20.8%. New loan originations for the year totaled a record $1.2 billion, led by commercial loan originations of $909.6 million. The 310-30 loan portfolio declined $49.7 million, or 41.2%, to $70.9 million at December 31, 2018.
Total deposits averaged $4.6 billion during 2018, increasing $717.7 million, or 18.3%. The growth in deposits was primarily driven by the Peoples acquisition, which added $730 million in total deposits on January 1, 2018, and transaction deposit growth, partially offset by the sale of four banking centers in the second quarter 2017. The mix of transaction deposits to total deposits improved to 76.2% from 71.9% the prior year.
Provision for loan loss expense on originated and acquired loans was $5.0 million during 2018, compared to $13.1 million last year. Net charge-offs on originated and acquired loans totaled 0.02%, compared to 0.38% last year. Non-performing originated and acquired loans decreased to 0.61% from 0.69% the prior year. The originated and acquired allowance for loan losses totaled 0.88% of total originated and acquired loans compared to 1.02% at December 31, 2017 and decreased as the acquired loans from the Peoples acquisition were recorded at fair value.
Non-interest income was $70.8 million during 2018, representing an increase of $31.6 million, primarily due to the Peoples acquisition. Service charges and bank card interchange fees grew $5.9 million due to organic growth and the addition of the Peoples’ client base. Mortgage banking income increased $28.0 million, primarily due to increased gain on sale of mortgages from the acquisition of the Peoples mortgage business. OREO related income increased $0.5 million compared to the prior year. Other non-interest income decreased $2.8 million, primarily driven by a gain on the sale of banking centers during 2017.
Non-interest expense totaled $189.3 million during 2018, representing an increase of $52.7 million, primarily driven by the Peoples acquisition. Included in non-interest expense is $8.0 million of acquisition costs, or $6.3 million after-tax.
Income tax expense totaled $12.2 million during 2018 compared to $21.3 million during 2017, a decrease of $9.1 million. Included in income tax expense was $1.3 million and $4.2 million of tax benefits from stock compensation activity during 2018 and 2017, respectively. In addition, income tax expense during 2017 included an $18.5 million non-cash, one-time charge related to the deferred tax asset re-measurement, due to the Tax Cuts and Jobs Act (the “Act”). Adjusting for the above mentioned stock compensation activity and deferred tax assets re-measurement, the effective tax rate for 2018 would be 18.3% compared to an adjusted 2017 rate of 19.7%. The effective tax rate is lower compared to the prior year primarily due to the Act, which, among other items, reduced the federal corporate tax rate to 21% effective January 1, 2018.
3
Conference Call
Management will host a conference call to review the results at 11:00 a.m. Eastern Time on Friday, January 25, 2019. Interested parties may listen to this call by dialing (877) 272-6762 / (615) 800-6832 (International) using the Conference ID of 1148965 and asking for the NBHC Fourth Quarter Earnings conference call. A telephonic replay of the call will be available beginning approximately four hours after the call’s completion through February 8, 2019, by dialing (855) 859-2056 (United States) / (404) 537-3406 (International) using the Conference ID of 1148965. The earnings release and an on-line replay of the call will also be available on the Company’s website at www.nationalbankholdings.com by visiting the investor relations area.
About Non-GAAP Financial Measures
Certain of the financial measures and ratios we present, including “tangible assets,” “return on average tangible assets,” “return on average tangible common equity,” “tangible common book value,” “tangible common book value per share,” “tangible common equity,” “tangible common equity to tangible assets,” “adjusted efficiency ratio,” “adjusted non-interest expense,” “adjusted non-interest expense to average assets,” “adjusted net income,” “adjusted earnings per share - diluted,” “adjusted return on average tangible assets,” “adjusted return on average tangible common equity,” and “fully taxable equivalent” metrics, are supplemental measures that are not required by, or are not presented in accordance with, U.S. generally accepted accounting principles (GAAP). We refer to these financial measures and ratios as “non-GAAP financial measures.” We consider the use of select non-GAAP financial measures and ratios to be useful for financial and operational decision making and useful in evaluating period-to-period comparisons. We believe that these non-GAAP financial measures provide meaningful supplemental information regarding our performance by excluding certain expenditures or assets that we believe are not indicative of our primary business operating results or by presenting certain metrics on a fully taxable equivalent basis. We believe that management and investors benefit from referring to these non-GAAP financial measures in assessing our performance and when planning, forecasting, analyzing and comparing past, present and future periods.
These non-GAAP financial measures should not be considered a substitute for financial information presented in accordance with GAAP and you should not rely on non-GAAP financial measures alone as measures of our performance. The non-GAAP financial measures we present may differ from non-GAAP financial measures used by our peers or other companies. We compensate for these limitations by providing the equivalent GAAP measures whenever we present the non-GAAP financial measures and by including a reconciliation of the impact of the components adjusted for in the non-GAAP financial measure so that both measures and the individual components may be considered when analyzing our performance.
A reconciliation of non-GAAP financial measures to the comparable GAAP financial measures is included at the end of the financial statement tables.
About National Bank Holdings Corporation
National Bank Holdings Corporation is a bank holding company created to build a leading community bank franchise delivering high quality client service and committed to shareholder results. Through its bank subsidiary, NBH Bank, National Bank Holdings Corporation operates a network of 104 banking centers, serving individual consumers, small, medium and large businesses, and government and non-profit entities. The bank’s core geographic footprint consists of Colorado, the greater Kansas City region, New Mexico, Texas and Utah. NBH Bank operates under the following brand names: Bank Midwest in Kansas and Missouri, Community Banks of Colorado in Colorado and Hillcrest Bank in New Mexico, Texas and Utah. It also operates as Community Banks Mortgage, a division of NBH Bank, in Arizona, Colorado and Utah. Additional information about National Bank Holdings Corporation can be found at www.nationalbankholdings.com.
4
For more information visit: bankmw.com, cobnks.com, hillcrestbank.com or nbhbank.com. Or, follow us on any of our social media sites:
Bank Midwest: facebook.com/bankmw, twitter.com/bank_mw, instagram.com/bankmw;
Community Banks of Colorado: facebook.com/cobnks, twitter.com/cobnks, instagram.com/cobnks;
Hillcrest Bank: facebook.com/hillcrestbank, twitter.com/hillcrest_bank;
NBH Bank: twitter.com/nbhbank;
or connect with any of our brands on LinkedIn.
Forward-Looking Statements
This press release contains “forward-looking statements” within the meaning of the Private Securities Litigation Reform Act of 1995. Forward-looking statements contain words such as “anticipate,” “believe,” “can,” “would,” “should,” “could,” “may,” “predict,” “seek,” “potential,” “will,” “estimate,” “target,” “plan,” “project,” “continuing,” “ongoing,” “expect,” “intend” or similar expressions that relate to the Company’s strategy, plans or intentions. Forward-looking statements involve certain important risks, uncertainties and other factors, any of which could cause actual results to differ materially from those in such statements. Such factors include, without limitation, the “Risk Factors” referenced in our most recent Form 10-K filed with the Securities and Exchange Commission (SEC), other risks and uncertainties listed from time to time in our reports and documents filed with the SEC, and the following factors: ability to execute our business strategy; business and economic conditions; effects of a prolonged government shutdown; economic, market, operational, liquidity, credit and interest rate risks associated with the Company’s business; effects of any changes in trade, monetary and fiscal policies and laws; changes imposed by regulatory agencies to increase capital standards; effects of inflation, as well as, interest rate, securities market and monetary supply fluctuations; changes in the economy or supply-demand imbalances affecting local real estate values; changes in consumer spending, borrowings and savings habits; the Company’s ability to identify potential candidates for, consummate, integrate and realize operating efficiencies from, acquisitions, consolidations and other expansion opportunities; the Company's ability to realize anticipated benefits from enhancements or updates to its core operating systems from time to time without significant change in client service or risk to the Company's control environment; the Company's dependence on information technology and telecommunications systems of third party service providers and the risk of systems failures, interruptions or breaches of security; the Company’s ability to achieve organic loan and deposit growth and the composition of such growth; changes in sources and uses of funds; increased competition in the financial services industry; the effect of changes in accounting policies and practices; the share price of the Company’s stock; the Company's ability to realize deferred tax assets or the need for a valuation allowance; continued consolidation in the financial services industry; ability to maintain or increase market share and control expenses; costs and effects of changes in laws and regulations and of other legal and regulatory developments; technological changes; the timely development and acceptance of new products and services; the Company’s continued ability to attract, hire and maintain qualified personnel; ability to implement and/or improve operational management and other internal risk controls and processes and reporting system and procedures; regulatory limitations on dividends from the Company's bank subsidiary; changes in estimates of future loan reserve requirements based upon the periodic review thereof under relevant regulatory and accounting requirements; widespread natural and other disasters, dislocations, political instability, acts of war or terrorist activities, cyberattacks or international hostilities; impact of reputational risk; and success at managing the risks involved in the foregoing items. The Company can give no assurance that any goal or plan or expectation set forth in forward-looking statements can be achieved and readers are cautioned not to place undue reliance on such statements. The forward-looking statements are made as of the date of this press release, and the Company does not intend, and assumes no obligation, to update any forward-looking statement to reflect events or circumstances after the date on which the statement is made or to reflect the occurrence of unanticipated events or circumstances, except as required by applicable law.
Contact:
Analysts/Institutional Investors: Aldis Birkans, Chief Financial Officer, Treasurer, (720) 529-3314, ir@nationalbankholdings.com
Media: Whitney Bartelli, Chief Marketing Officer, (816) 298-2203, media@nbhbank.com
5
NATIONAL BANK HOLDINGS CORPORATION
FINANCIAL SUMMARY
Consolidated Statements of Operations (Unaudited)
(Dollars in thousands, except share and per share data)
|
|
For the three months ended |
|
For the year ended |
|||||||||||
|
|
December 31, |
|
September 30, |
|
December 31, |
|
December 31, |
|
December 31, |
|||||
|
|
2018 |
|
2018 |
|
2017 |
|
2018 |
|
2017 |
|||||
|
Total interest and dividend income |
$ |
57,780 |
|
$ |
55,909 |
|
$ |
41,889 |
|
$ |
221,391 |
|
$ |
164,421 |
|
Total interest expense |
|
7,148 |
|
|
6,137 |
|
|
4,976 |
|
|
23,954 |
|
|
18,115 |
|
Net interest income |
|
50,632 |
|
|
49,772 |
|
|
36,913 |
|
|
197,437 |
|
|
146,306 |
|
Taxable equivalent adjustment |
|
1,195 |
|
|
1,126 |
|
|
1,676 |
|
|
4,482 |
|
|
5,852 |
|
Net interest income FTE(1) |
|
51,827 |
|
|
50,898 |
|
|
38,589 |
|
|
201,919 |
|
|
152,158 |
|
Provision for loan losses |
|
2,476 |
|
|
807 |
|
|
3,272 |
|
|
5,197 |
|
|
12,972 |
|
Net interest income after provision for loan losses FTE(1) |
|
49,351 |
|
|
50,091 |
|
|
35,317 |
|
|
196,722 |
|
|
139,186 |
|
Non-interest income: |
|
|
|
|
|
|
|
|
|
|
|
|
|
|
|
Service charges |
|
4,619 |
|
|
4,592 |
|
|
4,058 |
|
|
18,092 |
|
|
14,634 |
|
Bank card fees |
|
3,769 |
|
|
3,686 |
|
|
3,012 |
|
|
14,489 |
|
|
12,026 |
|
Mortgage banking income |
|
5,406 |
|
|
7,819 |
|
|
438 |
|
|
30,107 |
|
|
2,154 |
|
Other non-interest income |
|
1,519 |
|
|
1,892 |
|
|
1,387 |
|
|
7,170 |
|
|
9,953 |
|
OREO related income (expense) |
|
4 |
|
|
72 |
|
|
(12) |
|
|
917 |
|
|
438 |
|
Total non-interest income |
|
15,317 |
|
|
18,061 |
|
|
8,883 |
|
|
70,775 |
|
|
39,205 |
|
Non-interest expense: |
|
|
|
|
|
|
|
|
|
|
|
|
|
|
|
Salaries and benefits |
|
27,029 |
|
|
28,127 |
|
|
20,526 |
|
|
114,939 |
|
|
80,188 |
|
Occupancy and equipment |
|
6,423 |
|
|
6,925 |
|
|
5,107 |
|
|
28,493 |
|
|
20,994 |
|
Professional fees |
|
1,373 |
|
|
1,117 |
|
|
890 |
|
|
6,059 |
|
|
3,330 |
|
Other non-interest expense |
|
7,453 |
|
|
7,537 |
|
|
7,564 |
|
|
35,612 |
|
|
26,979 |
|
Problem asset workout |
|
328 |
|
|
665 |
|
|
606 |
|
|
2,549 |
|
|
3,994 |
|
Gain on sale of OREO, net |
|
(102) |
|
|
(450) |
|
|
(1,897) |
|
|
(488) |
|
|
(4,150) |
|
Core deposit intangible asset amortization |
|
353 |
|
|
511 |
|
|
1,232 |
|
|
2,170 |
|
|
5,342 |
|
Total non-interest expense |
|
42,857 |
|
|
44,432 |
|
|
34,028 |
|
|
189,334 |
|
|
136,677 |
|
|
|
|
|
|
|
|
|
|
|
|
|
|
|
|
|
Income before income taxes FTE(1) |
|
21,811 |
|
|
23,720 |
|
|
10,172 |
|
|
78,163 |
|
|
41,714 |
|
Taxable equivalent adjustment |
|
1,195 |
|
|
1,126 |
|
|
1,676 |
|
|
4,482 |
|
|
5,852 |
|
Income before income taxes |
|
20,616 |
|
|
22,594 |
|
|
8,496 |
|
|
73,681 |
|
|
35,862 |
|
Income tax expense |
|
3,381 |
|
|
4,354 |
|
|
18,615 |
|
|
12,230 |
|
|
21,283 |
|
Net income |
$ |
17,235 |
|
$ |
18,240 |
|
$ |
(10,119) |
|
$ |
61,451 |
|
$ |
14,579 |
|
Earnings (loss) per share - basic |
$ |
0.56 |
|
$ |
0.59 |
|
$ |
(0.37) |
|
$ |
2.00 |
|
$ |
0.54 |
|
Earnings (loss) per share - diluted |
$ |
0.55 |
|
$ |
0.58 |
|
$ |
(0.37) |
|
$ |
1.95 |
|
$ |
0.53 |
| (1) |
|
Net interest income is presented on a GAAP basis and fully taxable equivalent (FTE) basis, as the Company believes this non-GAAP measure is the preferred industry measurement for this item. The FTE adjustment is for the tax benefit on certain tax exempt loans using the federal tax rate of 21%, 21% and 35% for the three months ended December 31, 2018, September 30, 2018, and December 31, 2017, respectively, and federal tax rate of 21% and 35% for the years ended December 31, 2018 and December 31, 2017, respectively. See non-GAAP reconciliations starting on page 14. |
6
NATIONAL BANK HOLDINGS CORPORATION
Consolidated Statements of Financial Condition (Unaudited)
(Dollars in thousands, except share and per share data)
|
|
December 31, 2018 |
|
September 30, 2018 |
|
December 31, 2017 |
|||
|
ASSETS |
|
|
|
|
|
|
|
|
|
Cash and cash equivalents |
$ |
109,556 |
|
$ |
111,459 |
|
$ |
257,364 |
|
Investment securities available-for-sale |
|
791,102 |
|
|
796,549 |
|
|
855,345 |
|
Investment securities held-to-maturity |
|
235,398 |
|
|
249,464 |
|
|
258,730 |
|
Non-marketable securities |
|
27,555 |
|
|
16,975 |
|
|
15,030 |
|
Loans |
|
4,092,308 |
|
|
3,905,311 |
|
|
3,178,947 |
|
Allowance for loan losses |
|
(35,692) |
|
|
(33,813) |
|
|
(31,264) |
|
Loans, net |
|
4,056,616 |
|
|
3,871,498 |
|
|
3,147,683 |
|
Loans held for sale |
|
48,120 |
|
|
80,506 |
|
|
4,629 |
|
Other real estate owned |
|
10,596 |
|
|
35,135 |
|
|
10,491 |
|
Premises and equipment, net |
|
109,986 |
|
|
110,824 |
|
|
93,708 |
|
Goodwill |
|
115,027 |
|
|
115,027 |
|
|
59,630 |
|
Intangible assets, net |
|
13,470 |
|
|
13,937 |
|
|
1,607 |
|
Other assets |
|
159,240 |
|
|
183,730 |
|
|
139,248 |
|
Total assets |
$ |
5,676,666 |
|
$ |
5,585,104 |
|
$ |
4,843,465 |
|
LIABILITIES AND SHAREHOLDERS' EQUITY |
|
|
|
|
|
|
|
|
|
Liabilities: |
|
|
|
|
|
|
|
|
|
Non-interest bearing demand deposits |
$ |
1,072,029 |
|
$ |
1,089,631 |
|
$ |
902,439 |
|
Interest bearing demand deposits |
|
688,255 |
|
|
675,213 |
|
|
474,607 |
|
Savings and money market |
|
1,694,808 |
|
|
1,729,563 |
|
|
1,484,463 |
|
Total transaction deposits |
|
3,455,092 |
|
|
3,494,407 |
|
|
2,861,509 |
|
Time deposits |
|
1,080,529 |
|
|
1,119,625 |
|
|
1,118,050 |
|
Total deposits |
|
4,535,621 |
|
|
4,614,032 |
|
|
3,979,559 |
|
Securities sold under agreements to repurchase |
|
66,047 |
|
|
55,695 |
|
|
130,463 |
|
Federal Home Loan Bank advances |
|
301,660 |
|
|
144,540 |
|
|
129,115 |
|
Other liabilities |
|
78,332 |
|
|
97,772 |
|
|
71,921 |
|
Total liabilities |
|
4,981,660 |
|
|
4,912,039 |
|
|
4,311,058 |
|
Shareholders' equity: |
|
|
|
|
|
|
|
|
|
Common stock |
|
515 |
|
|
515 |
|
|
515 |
|
Additional paid in capital |
|
1,014,399 |
|
|
1,013,314 |
|
|
970,668 |
|
Retained earnings |
|
106,990 |
|
|
95,055 |
|
|
60,795 |
|
Treasury stock |
|
(415,623) |
|
|
(415,605) |
|
|
(493,329) |
|
Accumulated other comprehensive loss, net of tax |
|
(11,275) |
|
|
(20,214) |
|
|
(6,242) |
|
Total shareholders' equity |
|
695,006 |
|
|
673,065 |
|
|
532,407 |
|
Total liabilities and shareholders' equity |
$ |
5,676,666 |
|
$ |
5,585,104 |
|
$ |
4,843,465 |
|
SHARE DATA |
|
|
|
|
|
|
|
|
|
Average basic shares outstanding |
|
30,888,238 |
|
|
30,869,683 |
|
|
27,007,799 |
|
Average diluted shares outstanding |
|
31,492,342 |
|
|
31,540,716 |
|
|
27,007,799 |
|
Ending shares outstanding |
|
30,769,063 |
|
|
30,759,595 |
|
|
26,875,585 |
|
Common book value per share |
$ |
22.59 |
|
$ |
21.88 |
|
$ |
19.81 |
|
Tangible common book value per share(1) |
$ |
18.77 |
|
$ |
18.04 |
|
$ |
17.94 |
|
Tangible common book value per share, excluding accumulated other comprehensive loss(1) |
$ |
19.13 |
|
$ |
18.70 |
|
$ |
18.17 |
|
CAPITAL RATIOS |
|
|
|
|
|
|
|
|
|
Average equity to average assets |
|
12.15% |
|
|
12.02% |
|
|
11.41% |
|
Tangible common equity to tangible assets(1) |
|
10.39% |
|
|
10.15% |
|
|
10.06% |
|
Leverage ratio |
|
10.51% |
|
|
10.31% |
|
|
9.83% |
|
Tier 1 risk-based capital ratio |
|
12.91% |
|
|
12.87% |
|
|
12.94% |
|
Total risk-based capital ratio |
|
13.79% |
|
|
13.75% |
|
|
13.82% |
| (1) |
|
Represents a non-GAAP financial measure. See non-GAAP reconciliations starting on page 14. |
7
NATIONAL BANK HOLDINGS CORPORATION
Loan Portfolio
(Dollars in thousands)
Period End Loan Balances by Type
|
|
|
|
|
|
|
|
December 31, 2018 |
|
|
|
|
December 31, 2018 |
|
|
|
|
|
|
vs. September 30, 2018 |
|
|
|
vs. December 31, 2017 |
|||
|
|
December 31, 2018 |
|
September 30, 2018 |
|
% Change |
|
December 31, 2017 |
|
% Change |
|||
|
Originated: |
|
|
|
|
|
|
|
|
|
|
|
|
|
Commercial: |
|
|
|
|
|
|
|
|
|
|
|
|
|
Commercial and industrial |
$ |
1,877,221 |
|
$ |
1,693,456 |
|
10.9% |
|
$ |
1,375,028 |
|
36.5% |
|
Owner-occupied commercial real estate |
|
337,258 |
|
|
313,711 |
|
7.5% |
|
|
264,357 |
|
27.6% |
|
Agriculture |
|
217,294 |
|
|
207,990 |
|
4.5% |
|
|
135,397 |
|
60.5% |
|
Energy |
|
49,204 |
|
|
42,620 |
|
15.4% |
|
|
57,460 |
|
(14.4)% |
|
Total commercial |
|
2,480,977 |
|
|
2,257,777 |
|
9.9% |
|
|
1,832,242 |
|
35.4% |
|
Commercial real estate non-owner occupied |
|
407,431 |
|
|
407,786 |
|
(0.1)% |
|
|
464,121 |
|
(12.2)% |
|
Residential real estate |
|
657,633 |
|
|
635,360 |
|
3.5% |
|
|
633,578 |
|
3.8% |
|
Consumer |
|
22,895 |
|
|
24,246 |
|
(5.6)% |
|
|
23,398 |
|
(2.1)% |
|
Total originated |
|
3,568,936 |
|
|
3,325,169 |
|
7.3% |
|
|
2,953,339 |
|
20.8% |
|
|
|
|
|
|
|
|
|
|
|
|
|
|
|
Acquired: |
|
|
|
|
|
|
|
|
|
|
|
|
|
Commercial: |
|
|
|
|
|
|
|
|
|
|
|
|
|
Commercial and industrial |
|
53,926 |
|
|
61,150 |
|
(11.8)% |
|
|
994 |
|
5,325.2% |
|
Owner-occupied commercial real estate |
|
84,408 |
|
|
94,990 |
|
(11.1)% |
|
|
8,396 |
|
905.3% |
|
Agriculture |
|
4,862 |
|
|
5,916 |
|
(17.8)% |
|
|
3,498 |
|
39.0% |
|
Total commercial |
|
143,196 |
|
|
162,056 |
|
(11.6)% |
|
|
12,888 |
|
1,011.1% |
|
Commercial real estate non-owner occupied |
|
144,388 |
|
|
161,615 |
|
(10.7)% |
|
|
21,020 |
|
586.9% |
|
Residential real estate |
|
163,187 |
|
|
179,146 |
|
(8.9)% |
|
|
69,900 |
|
133.5% |
|
Consumer |
|
1,722 |
|
|
2,404 |
|
(28.4)% |
|
|
1,177 |
|
46.3% |
|
Total acquired |
|
452,493 |
|
|
505,221 |
|
(10.4)% |
|
|
104,985 |
|
331.0% |
|
|
|
|
|
|
|
|
|
|
|
|
|
|
|
ASC 310-30 loans |
|
70,879 |
|
|
74,921 |
|
(5.4)% |
|
|
120,623 |
|
(41.2)% |
|
Total loans |
$ |
4,092,308 |
|
$ |
3,905,311 |
|
4.8% |
|
$ |
3,178,947 |
|
28.7% |
Originated and Acquired Loan Balances by Loan Segment
|
|
|
|
|
|
|
|
December 31, 2018 |
|
|
|
|
December 31, 2018 |
|
|
|
|
|
|
vs. September 30, 2018 |
|
|
|
|
vs. December 31, 2017 |
||
|
|
December 31, 2018 |
|
September 30, 2018 |
|
% Change |
|
December 31, 2017 |
|
% Change |
|||
|
Commercial |
$ |
2,624,173 |
|
$ |
2,419,833 |
|
8.4% |
|
$ |
1,845,130 |
|
42.2% |
|
Commercial real estate non-owner occupied |
|
551,819 |
|
|
569,401 |
|
(3.1)% |
|
|
485,141 |
|
13.7% |
|
Residential real estate |
|
820,820 |
|
|
814,506 |
|
0.8% |
|
|
703,478 |
|
16.7% |
|
Consumer |
|
24,617 |
|
|
26,650 |
|
(7.6)% |
|
|
24,575 |
|
0.2% |
|
Total originated and acquired loans |
$ |
4,021,429 |
|
$ |
3,830,390 |
|
5.0% |
|
$ |
3,058,324 |
|
31.5% |
Originations(1)
|
|
Fourth quarter |
|
Third quarter |
|
Second quarter |
|
First quarter |
|
Fourth quarter |
|||||
|
|
2018 |
|
2018 |
|
2018 |
|
2018 |
|
2017 |
|||||
|
Commercial: |
|
|
|
|
|
|
|
|
|
|
|
|
|
|
|
Commercial and industrial |
$ |
213,335 |
|
$ |
123,440 |
|
$ |
232,643 |
|
$ |
123,984 |
|
$ |
167,699 |
|
Owner occupied commercial real estate |
|
34,727 |
|
|
35,549 |
|
|
19,009 |
|
|
23,576 |
|
|
8,937 |
|
Agriculture |
|
14,046 |
|
|
23,833 |
|
|
38,220 |
|
|
25,873 |
|
|
14,050 |
|
Energy |
|
7,640 |
|
|
5,412 |
|
|
(929) |
|
|
(10,778) |
|
|
(8,121) |
|
Total commercial |
|
269,748 |
|
|
188,234 |
|
|
288,943 |
|
|
162,655 |
|
|
182,565 |
|
Commercial real estate non-owner occupied |
|
41,031 |
|
|
42,300 |
|
|
28,316 |
|
|
20,694 |
|
|
21,323 |
|
Residential real estate |
|
51,017 |
|
|
40,293 |
|
|
30,259 |
|
|
21,698 |
|
|
25,995 |
|
Consumer |
|
2,592 |
|
|
3,797 |
|
|
3,588 |
|
|
3,238 |
|
|
1,815 |
|
Total |
$ |
364,388 |
|
$ |
274,624 |
|
$ |
351,106 |
|
$ |
208,285 |
|
$ |
231,698 |
| (1) |
|
Originations are defined as closed end funded loans and net fundings under revolving lines of credit. Net funding under revolving lines of credit were $6,263, $34,070, $151,888, $59,236, and $65,686 as of the fourth quarter 2018, third quarter 2018, second quarter 2018, first quarter 2018 and fourth quarter 2017, respectively. |
8
NATIONAL BANK HOLDINGS CORPORATION
Summary of Net Interest Margin
(Dollars in thousands)
|
|
For the three months ended |
|
For the three months ended |
|
For the three months ended |
|||||||||||||||||||||
|
|
December 31, 2018 |
|
September 30, 2018 |
|
December 31, 2017 |
|||||||||||||||||||||
|
|
Average |
|
|
|
|
Average |
|
Average |
|
|
|
|
Average |
|
Average |
|
|
|
|
Average |
||||||
|
|
balance |
|
Interest |
|
rate |
|
balance |
|
Interest |
|
rate |
|
balance |
|
Interest |
|
rate |
|||||||||
|
Interest earning assets: |
|
|
|
|
|
|
|
|
|
|
|
|
|
|
|
|
|
|
|
|
|
|
|
|
|
|
|
Originated loans FTE(1)(2) |
$ |
3,409,996 |
|
$ |
40,347 |
|
|
4.69% |
|
$ |
3,215,369 |
|
$ |
36,496 |
|
|
4.50% |
|
$ |
2,905,810 |
|
$ |
30,205 |
|
|
4.12% |
|
Acquired loans |
|
482,774 |
|
|
7,102 |
|
|
5.84% |
|
|
533,261 |
|
|
7,891 |
|
|
5.87% |
|
|
109,420 |
|
|
1,698 |
|
|
6.16% |
|
ASC 310-30 loans |
|
72,634 |
|
|
4,146 |
|
|
22.83% |
|
|
80,629 |
|
|
4,785 |
|
|
23.74% |
|
|
122,175 |
|
|
4,787 |
|
|
15.67% |
|
Loans held for sale |
|
56,714 |
|
|
730 |
|
|
5.11% |
|
|
99,933 |
|
|
1,134 |
|
|
4.50% |
|
|
6,935 |
|
|
117 |
|
|
6.69% |
|
Investment securities available-for-sale |
|
826,462 |
|
|
4,396 |
|
|
2.13% |
|
|
858,469 |
|
|
4,482 |
|
|
2.09% |
|
|
817,024 |
|
|
3,885 |
|
|
1.90% |
|
Investment securities held-to-maturity |
|
243,421 |
|
|
1,724 |
|
|
2.83% |
|
|
259,169 |
|
|
1,807 |
|
|
2.79% |
|
|
268,353 |
|
|
1,848 |
|
|
2.75% |
|
Other securities |
|
21,457 |
|
|
335 |
|
|
6.25% |
|
|
18,048 |
|
|
269 |
|
|
5.96% |
|
|
15,075 |
|
|
220 |
|
|
5.84% |
|
Interest earning deposits and securities purchased under agreements to resell |
|
39,476 |
|
|
195 |
|
|
1.96% |
|
|
39,259 |
|
|
171 |
|
|
1.73% |
|
|
250,859 |
|
|
805 |
|
|
1.27% |
|
Total interest earning assets FTE(2) |
$ |
5,152,934 |
|
$ |
58,975 |
|
|
4.54% |
|
$ |
5,104,137 |
|
$ |
57,035 |
|
|
4.43% |
|
$ |
4,495,651 |
|
$ |
43,565 |
|
|
3.84% |
|
Cash and due from banks |
$ |
79,747 |
|
|
|
|
|
|
|
$ |
80,334 |
|
|
|
|
|
|
|
$ |
70,804 |
|
|
|
|
|
|
|
Other assets |
|
422,136 |
|
|
|
|
|
|
|
|
424,873 |
|
|
|
|
|
|
|
|
309,604 |
|
|
|
|
|
|
|
Allowance for loan losses |
|
(34,366) |
|
|
|
|
|
|
|
|
(33,024) |
|
|
|
|
|
|
|
|
(30,321) |
|
|
|
|
|
|
|
Total assets |
$ |
5,620,451 |
|
|
|
|
|
|
|
$ |
5,576,320 |
|
|
|
|
|
|
|
$ |
4,845,738 |
|
|
|
|
|
|
|
Interest bearing liabilities: |
|
|
|
|
|
|
|
|
|
|
|
|
|
|
|
|
|
|
|
|
|
|
|
|
|
|
|
Interest bearing demand, savings and money market deposits |
$ |
2,415,627 |
|
$ |
2,716 |
|
|
0.45% |
|
$ |
2,411,875 |
|
$ |
2,269 |
|
|
0.37% |
|
$ |
1,957,306 |
|
$ |
1,709 |
|
|
0.35% |
|
Time deposits |
|
1,099,205 |
|
|
3,375 |
|
|
1.22% |
|
|
1,126,377 |
|
|
3,183 |
|
|
1.12% |
|
|
1,128,069 |
|
|
2,704 |
|
|
0.95% |
|
Securities sold under agreements to repurchase |
|
63,837 |
|
|
158 |
|
|
0.98% |
|
|
59,214 |
|
|
51 |
|
|
0.34% |
|
|
98,218 |
|
|
45 |
|
|
0.18% |
|
Federal Home Loan Bank advances |
|
160,575 |
|
|
899 |
|
|
2.22% |
|
|
129,542 |
|
|
634 |
|
|
1.94% |
|
|
129,115 |
|
|
518 |
|
|
1.59% |
|
Total interest bearing liabilities |
$ |
3,739,244 |
|
$ |
7,148 |
|
|
0.76% |
|
$ |
3,727,008 |
|
$ |
6,137 |
|
|
0.65% |
|
$ |
3,312,708 |
|
$ |
4,976 |
|
|
0.60% |
|
Demand deposits |
$ |
1,104,411 |
|
|
|
|
|
|
|
$ |
1,096,780 |
|
|
|
|
|
|
|
$ |
933,657 |
|
|
|
|
|
|
|
Other liabilities |
|
94,070 |
|
|
|
|
|
|
|
|
82,017 |
|
|
|
|
|
|
|
|
46,563 |
|
|
|
|
|
|
|
Total liabilities |
|
4,937,725 |
|
|
|
|
|
|
|
|
4,905,805 |
|
|
|
|
|
|
|
|
4,292,928 |
|
|
|
|
|
|
|
Shareholders' equity |
|
682,726 |
|
|
|
|
|
|
|
|
670,515 |
|
|
|
|
|
|
|
|
552,810 |
|
|
|
|
|
|
|
Total liabilities and shareholders' equity |
$ |
5,620,451 |
|
|
|
|
|
|
|
$ |
5,576,320 |
|
|
|
|
|
|
|
$ |
4,845,738 |
|
|
|
|
|
|
|
Net interest income FTE(2) |
|
|
|
$ |
51,827 |
|
|
|
|
|
|
|
$ |
50,898 |
|
|
|
|
|
|
|
$ |
38,589 |
|
|
|
|
Interest rate spread FTE(2) |
|
|
|
|
|
|
|
3.78% |
|
|
|
|
|
|
|
|
3.78% |
|
|
|
|
|
|
|
|
3.24% |
|
Net interest earning assets |
$ |
1,413,690 |
|
|
|
|
|
|
|
$ |
1,377,129 |
|
|
|
|
|
|
|
$ |
1,182,943 |
|
|
|
|
|
|
|
Net interest margin FTE(2) |
|
|
|
|
|
|
|
3.99% |
|
|
|
|
|
|
|
|
3.96% |
|
|
|
|
|
|
|
|
3.41% |
|
Average transaction deposits |
$ |
3,520,038 |
|
|
|
|
|
|
|
$ |
3,508,655 |
|
|
|
|
|
|
|
$ |
2,890,963 |
|
|
|
|
|
|
|
Average total deposits |
$ |
4,619,243 |
|
|
|
|
|
|
|
$ |
4,635,032 |
|
|
|
|
|
|
|
$ |
4,019,032 |
|
|
|
|
|
|
|
Ratio of average interest earning assets to average interest bearing liabilities |
|
137.81% |
|
|
|
|
|
|
|
|
136.95% |
|
|
|
|
|
|
|
|
135.71% |
|
|
|
|
|
|
| (1) |
|
Originated loans are net of deferred loan fees, less costs, which are included in interest income over the life of the loan. |
| (2) |
|
Presented on a fully taxable equivalent basis using the statutory tax rate of 21%, 21% and 35% for the three months ended December 31, 2018, September 30, 2018 and December 31, 2017, respectively. The tax equivalent adjustments included above are $1,195, $1,126 and $1,676 for the three months ended December 31, 2018, September 30, 2018 and December 31 2017, respectively. |
9
NATIONAL BANK HOLDINGS CORPORATION
Summary of Net Interest Margin
(Dollars in thousands)
|
|
For the year ended December 31, 2018 |
|
For the year ended December 31, 2017 |
||||||||||||
|
|
Average |
|
|
|
|
Average |
|
Average |
|
|
|
|
Average |
||
|
|
balance |
|
Interest |
|
rate |
|
balance |
|
Interest |
|
rate |
||||
|
Interest earning assets: |
|
|
|
|
|
|
|
|
|
|
|
|
|
|
|
|
Originated loans FTE(1)(2) |
$ |
3,166,374 |
|
$ |
142,461 |
|
4.50% |
|
$ |
2,779,344 |
|
$ |
112,817 |
|
4.06% |
|
Acquired loans |
|
562,443 |
|
|
32,610 |
|
5.80% |
|
|
117,972 |
|
|
7,256 |
|
6.15% |
|
ASC 310-30 loans |
|
90,786 |
|
|
19,155 |
|
21.10% |
|
|
132,130 |
|
|
22,505 |
|
17.03% |
|
Loans held for sale |
|
73,644 |
|
|
3,380 |
|
4.59% |
|
|
8,231 |
|
|
523 |
|
6.35% |
|
Investment securities available-for-sale |
|
883,737 |
|
|
18,493 |
|
2.09% |
|
|
875,430 |
|
|
16,615 |
|
1.90% |
|
Investment securities held-to-maturity |
|
258,809 |
|
|
7,252 |
|
2.80% |
|
|
296,093 |
|
|
8,226 |
|
2.78% |
|
Other securities |
|
18,093 |
|
|
1,096 |
|
6.06% |
|
|
15,249 |
|
|
839 |
|
5.50% |
|
Interest earning deposits and securities purchased under agreements to resell |
|
77,808 |
|
|
1,426 |
|
1.83% |
|
|
128,871 |
|
|
1,492 |
|
1.16% |
|
Total interest earning assets FTE(2) |
$ |
5,131,694 |
|
$ |
225,873 |
|
4.40% |
|
$ |
4,353,320 |
|
$ |
170,273 |
|
3.91% |
|
Cash and due from banks |
$ |
88,847 |
|
|
|
|
|
|
$ |
67,993 |
|
|
|
|
|
|
Other assets |
|
419,607 |
|
|
|
|
|
|
|
315,660 |
|
|
|
|
|
|
Allowance for loan losses |
|
(32,616) |
|
|
|
|
|
|
|
(31,732) |
|
|
|
|
|
|
Total assets |
$ |
5,607,532 |
|
|
|
|
|
|
$ |
4,705,241 |
|
|
|
|
|
|
Interest bearing liabilities: |
|
|
|
|
|
|
|
|
|
|
|
|
|
|
|
|
Interest bearing demand, savings and money market deposits |
$ |
2,418,326 |
|
$ |
8,758 |
|
0.36% |
|
$ |
1,895,852 |
|
$ |
6,003 |
|
0.32% |
|
Time deposits |
|
1,132,748 |
|
|
12,283 |
|
1.08% |
|
|
1,146,380 |
|
|
10,169 |
|
0.89% |
|
Securities sold under agreements to repurchase |
|
87,691 |
|
|
295 |
|
0.34% |
|
|
88,390 |
|
|
164 |
|
0.19% |
|
Federal Home Loan Bank advances |
|
133,932 |
|
|
2,618 |
|
1.95% |
|
|
113,433 |
|
|
1,779 |
|
1.57% |
|
Total interest bearing liabilities |
$ |
3,772,697 |
|
$ |
23,954 |
|
0.63% |
|
$ |
3,244,055 |
|
$ |
18,115 |
|
0.56% |
|
Demand deposits |
$ |
1,082,158 |
|
|
|
|
|
|
$ |
873,265 |
|
|
|
|
|
|
Other liabilities |
|
90,257 |
|
|
|
|
|
|
|
41,205 |
|
|
|
|
|
|
Total liabilities |
|
4,945,112 |
|
|
|
|
|
|
|
4,158,525 |
|
|
|
|
|
|
Shareholders' equity |
|
662,420 |
|
|
|
|
|
|
|
546,716 |
|
|
|
|
|
|
Total liabilities and shareholders' equity |
$ |
5,607,532 |
|
|
|
|
|
|
$ |
4,705,241 |
|
|
|
|
|
|
Net interest income FTE(2) |
|
|
|
$ |
201,919 |
|
|
|
|
|
|
$ |
152,158 |
|
|
|
Interest rate spread FTE(2) |
|
|
|
|
|
|
3.77% |
|
|
|
|
|
|
|
3.35% |
|
Net interest earning assets |
$ |
1,358,997 |
|
|
|
|
|
|
$ |
1,109,265 |
|
|
|
|
|
|
Net interest margin FTE(2) |
|
|
|
|
|
|
3.93% |
|
|
|
|
|
|
|
3.50% |
|
Average transaction deposits |
$ |
3,500,484 |
|
|
|
|
|
|
$ |
2,769,117 |
|
|
|
|
|
|
Average total deposits |
$ |
4,633,232 |
|
|
|
|
|
|
$ |
3,915,497 |
|
|
|
|
|
|
Ratio of average interest earning assets to average interest bearing liabilities |
|
136.02% |
|
|
|
|
|
|
|
134.19% |
|
|
|
|
|
| (1) |
|
Originated loans are net of deferred loan fees, less costs, which are included in interest income over the life of the loan. |
| (2) |
|
Presented on a fully taxable equivalent basis using the statutory tax rate of 21% and 35% for the years ended December 31, 2018 and December 31, 2017, respectively. The tax equivalent adjustments included above are $4,482 and $5,852 for the years ended December 31, 2018 and December 31, 2017, respectively. |
10
NATIONAL BANK HOLDINGS CORPORATION
Allowance for Loan Losses and Asset Quality
(Dollars in thousands)
Allowance for Loan Losses Analysis
|
|
As of and for the three months ended |
|||||||||||||||||||||||||
|
|
December 31, 2018 |
|
September 30, 2018 |
|
December 31, 2017 |
|||||||||||||||||||||
|
|
ASC |
|
Originated |
|
|
|
|
ASC |
|
Originated |
|
|
|
|
ASC |
|
Originated |
|
|
|
||||||
|
|
310-30 |
|
and acquired |
|
|
|
|
310-30 |
|
and acquired |
|
|
|
|
310-30 |
|
and acquired |
|
|
|
||||||
|
|
loans |
|
loans |
|
Total |
|
loans |
|
loans |
|
Total |
|
loans |
|
loans |
|
Total |
|||||||||
|
Beginning allowance for loan losses |
$ |
207 |
|
$ |
33,606 |
|
$ |
33,813 |
|
$ |
201 |
|
$ |
32,029 |
|
$ |
32,230 |
|
$ |
— |
|
$ |
30,047 |
|
$ |
30,047 |
|
Charge-offs |
|
— |
|
|
(652) |
|
|
(652) |
|
|
— |
|
|
(394) |
|
|
(394) |
|
|
— |
|
|
(2,139) |
|
|
(2,139) |
|
Recoveries |
|
— |
|
|
55 |
|
|
55 |
|
|
— |
|
|
1,170 |
|
|
1,170 |
|
|
— |
|
|
84 |
|
|
84 |
|
Provision |
|
24 |
|
|
2,452 |
|
|
2,476 |
|
|
6 |
|
|
801 |
|
|
807 |
|
|
71 |
|
|
3,201 |
|
|
3,272 |
|
Ending ALL |
$ |
231 |
|
$ |
35,461 |
|
$ |
35,692 |
|
$ |
207 |
|
$ |
33,606 |
|
$ |
33,813 |
|
$ |
71 |
|
$ |
31,193 |
|
$ |
31,264 |
|
Ratio of annualized net charge-offs (recoveries) to average total loans during the period, respectively |
|
0.00% |
|
|
0.06% |
|
|
0.06% |
|
|
0.00% |
|
|
(0.08)% |
|
|
(0.08)% |
|
|
0.00% |
|
|
0.27% |
|
|
0.26% |
|
Ratio of ALL to total loans outstanding at period end, respectively |
|
0.33% |
|
|
0.88% |
|
|
0.87% |
|
|
0.28% |
|
|
0.88% |
|
|
0.87% |
|
|
0.06% |
|
|
1.02% |
|
|
0.98% |
|
Ratio of ALL to total non-performing loans at period end, respectively(1) |
|
0.00% |
|
|
145.00% |
|
|
145.94% |
|
|
0.00% |
|
|
137.40% |
|
|
138.25% |
|
|
0.00% |
|
|
148.54% |
|
|
148.88% |
|
Total loans |
$ |
70,879 |
|
$ |
4,021,429 |
|
$ |
4,092,308 |
|
$ |
74,921 |
|
$ |
3,830,390 |
|
$ |
3,905,311 |
|
$ |
120,623 |
|
$ |
3,058,324 |
|
$ |
3,178,947 |
|
Average total loans during the period |
$ |
72,634 |
|
$ |
3,892,770 |
|
$ |
3,965,404 |
|
$ |
80,629 |
|
$ |
3,748,630 |
|
$ |
3,829,258 |
|
$ |
122,175 |
|
$ |
3,015,230 |
|
$ |
3,137,405 |
|
Total non-performing loans(1) |
$ |
— |
|
$ |
24,456 |
|
$ |
24,456 |
|
$ |
— |
|
$ |
24,458 |
|
$ |
24,458 |
|
$ |
— |
|
$ |
21,000 |
|
$ |
21,000 |
| (1) |
|
Loans accounted for under ASC 310-30 may be considered performing, regardless of past due status, if the timing and expected cash flows on these loans can be reasonably estimated and if collection of the new carrying value is expected. |
|
Originated and Acquired Loans
|
|
December 31, 2018 |
|
September 30, 2018 |
|
December 31, 2017 |
|||
|
Loans 30-89 days past due and still accruing interest |
$ |
4,610 |
|
$ |
7,915 |
|
$ |
3,681 |
|
Loans 90 days past due and still accruing interest |
|
895 |
|
|
560 |
|
|
150 |
|
Non-accrual loans |
|
24,456 |
|
|
24,458 |
|
|
21,000 |
|
Total past due and non-accrual loans |
$ |
29,961 |
|
$ |
32,933 |
|
$ |
24,831 |
|
Total 90 days past due and still accruing interest and non-accrual loans to total originated and acquired loans |
|
0.63% |
|
|
0.65% |
|
|
0.69% |
|
Total non-accrual loans to total originated and acquired loans |
|
0.61% |
|
|
0.64% |
|
|
0.69% |
11
NATIONAL BANK HOLDINGS CORPORATION
Asset Quality
(Dollars in thousands)
|
|
December 31, 2018 |
|
September 30, 2018 |
|
December 31, 2017 |
|||
|
Non-performing loans |
$ |
24,456 |
|
$ |
24,458 |
|
$ |
21,000 |
|
OREO: |
|
|
|
|
|
|
|
|
|
Originated and acquired |
|
4,992 |
|
|
5,293 |
|
|
4,668 |
|
Transferred from 310-30 loans |
|
5,604 |
|
|
29,842 |
|
|
5,823 |
|
Total OREO |
|
10,596 |
|
|
35,135 |
|
|
10,491 |
|
Total non-performing assets |
$ |
35,052 |
|
$ |
59,593 |
|
$ |
31,491 |
|
Accruing restructured loans |
$ |
5,944 |
|
$ |
7,770 |
|
$ |
8,461 |
|
Total non-performing loans to total loans |
|
0.60% |
|
|
0.63% |
|
|
0.66% |
|
Total non-performing assets to total loans and OREO |
|
0.85% |
|
|
1.51% |
|
|
0.99% |
|
Total non-performing assets (excluding OREO transferred from 310-30 loans) to total loans and OREO (excluding OREO transferred from 310-30) |
|
0.72% |
|
|
0.76% |
|
|
0.81% |
Changes in Accretable Yield
|
|
For the three months ended |
|
Life-to-date |
||||||||
|
|
December 31, 2018 |
|
September 30, 2018 |
|
December 31, 2017 |
|
December 31, 2018 |
||||
|
Accretable yield at beginning of period |
$ |
39,700 |
|
$ |
42,702 |
|
$ |
51,548 |
|
$ |
— |
|
Additions through acquisitions |
|
— |
|
|
— |
|
|
— |
|
|
214,996 |
|
Reclassification from non-accretable difference to accretable yield |
|
681 |
|
|
2,017 |
|
|
1,702 |
|
|
292,796 |
|
Reclassification to non-accretable difference from accretable yield |
|
(334) |
|
|
(234) |
|
|
(1,895) |
|
|
(37,831) |
|
Accretion |
|
(4,146) |
|
|
(4,785) |
|
|
(4,787) |
|
|
(434,060) |
|
Accretable yield at end of period |
$ |
35,901 |
|
$ |
39,700 |
|
$ |
46,568 |
|
$ |
35,901 |
12
NATIONAL BANK HOLDINGS CORPORATION
Key Ratios
|
|
As of and for the three months ended |
|
As of and for the year ended |
||||||
|
|
December 31, |
|
September 30, |
|
December 31, |
|
December 31, |
|
December 31, |
|
|
2018 |
|
2018 |
|
2017 |
|
2018 |
|
2017 |
|
Key Ratios(1) |
|
|
|
|
|
|
|
|
|
|
Return on average assets |
1.22% |
|
1.30% |
|
(0.83)% |
|
1.10% |
|
0.31% |
|
Return on average tangible assets(2) |
1.26% |
|
1.35% |
|
(0.78)% |
|
1.15% |
|
0.38% |
|
Return on average tangible assets, adjusted(2) |
1.26% |
|
1.35% |
|
0.88% |
|
1.26% |
|
0.82% |
|
Return on average equity |
10.02% |
|
10.79% |
|
(7.26)% |
|
9.28% |
|
2.67% |
|
Return on average tangible common equity(2) |
12.29% |
|
13.39% |
|
(7.41)% |
|
11.60% |
|
3.61% |
|
Return on average tangible common equity, adjusted(2) |
12.29% |
|
13.39% |
|
8.41% |
|
12.76% |
|
7.75% |
|
Loans to deposits ratio (end of period) |
90.23% |
|
84.64% |
|
80.00% |
|
90.23% |
|
80.00% |
|
Non-interest bearing deposits to total deposits (end of period) |
23.64% |
|
23.62% |
|
22.68% |
|
23.64% |
|
22.68% |
|
Net interest margin(4) |
3.90% |
|
3.87% |
|
3.26% |
|
3.85% |
|
3.36% |
|
Net interest margin FTE(2)(4) |
3.99% |
|
3.96% |
|
3.41% |
|
3.93% |
|
3.50% |
|
Interest rate spread FTE(5) |
3.78% |
|
3.78% |
|
3.24% |
|
3.77% |
|
3.35% |
|
Yield on earning assets(3) |
4.45% |
|
4.35% |
|
3.70% |
|
4.31% |
|
3.78% |
|
Yield on earning assets FTE(2)(3) |
4.54% |
|
4.43% |
|
3.84% |
|
4.40% |
|
3.91% |
|
Cost of interest bearing liabilities(3) |
0.76% |
|
0.65% |
|
0.60% |
|
0.63% |
|
0.56% |
|
Cost of deposits |
0.52% |
|
0.47% |
|
0.44% |
|
0.45% |
|
0.41% |
|
Non-interest income to total revenue FTE |
22.81% |
|
26.19% |
|
18.71% |
|
25.95% |
|
20.49% |
|
Non-interest expense to average assets |
3.03% |
|
3.16% |
|
2.79% |
|
3.38% |
|
2.90% |
|
Non-interest expense to average assets, adjusted(2) |
3.03% |
|
3.16% |
|
2.58% |
|
3.23% |
|
2.84% |
|
Efficiency ratio |
64.45% |
|
64.75% |
|
71.61% |
|
69.78% |
|
70.80% |
|
Efficiency ratio FTE(2) |
63.30% |
|
63.69% |
|
69.08% |
|
68.64% |
|
68.63% |
|
Efficiency ratio FTE, adjusted for acquisition-related costs(2) |
63.30% |
|
63.69% |
|
63.84% |
|
65.72% |
|
66.97% |
|
|
|
|
|
|
|
|
|
|
|
|
Originated and Acquired Loans Asset Quality Data(6)(7)(8) |
|
|
|
|
|
|
|
|
|
|
Non-performing loans to total originated and acquired loans |
0.61% |
|
0.64% |
|
0.69% |
|
0.61% |
|
0.69% |
|
Allowance for loan losses to total originated and acquired loans |
0.88% |
|
0.88% |
|
1.02% |
|
0.88% |
|
1.02% |
|
Allowance for loan losses to non-performing loans |
145.00% |
|
137.40% |
|
148.54% |
|
145.00% |
|
148.54% |
|
Net charge-offs (recoveries) to average loans(1) |
0.06% |
|
(0.08)% |
|
0.27% |
|
0.02% |
|
0.38% |
|
|
|
|
|
|
|
|
|
|
|
|
Total Loans Asset Quality Data(6)(7)(8) |
|
|
|
|
|
|
|
|
|
|
Non-performing loans to total loans |
0.60% |
|
0.63% |
|
0.66% |
|
0.60% |
|
0.66% |
|
Non-performing assets to total loans and OREO |
0.85% |
|
1.51% |
|
0.99% |
|
0.85% |
|
0.99% |
|
Allowance for loan losses to total loans |
0.87% |
|
0.87% |
|
0.98% |
|
0.87% |
|
0.98% |
|
Allowance for loan losses to non-performing loans |
145.94% |
|
138.25% |
|
148.88% |
|
145.94% |
|
148.88% |
|
Net charge-offs (recoveries) to average loans(1) |
0.06% |
|
(0.08)% |
|
0.26% |
|
0.02% |
|
0.36% |
| (1) |
|
Quarterly ratios are annualized. |
| (2) |
|
Ratio represents non-GAAP financial measure. See non-GAAP reconciliations below. |
| (3) |
|
Interest earning assets include assets that earn interest/accretion or dividends. Any market value adjustments on investment securities are excluded from interest earning assets. Interest bearing liabilities include liabilities that must be paid interest. |
| (4) |
|
Net interest margin represents net interest income, including accretion income on interest earning assets, as a percentage of average interest earning assets. |
| (5) |
|
Interest rate spread represents the difference between the weighted average yield on interest earning assets and the weighted average cost of interest bearing liabilities. |
| (6) |
|
Non-performing loans consist of non-accruing loans and restructured loans on non-accrual, but exclude any loans accounted for under ASC 310-30 in which the pool is still performing. These ratios may, therefore, not be comparable to similar ratios of our peers. |
| (7) |
|
Non-performing assets include non-performing loans, other real estate owned and other repossessed assets. |
| (8) |
|
Total loans are net of unearned discounts and fees. |
13
NATIONAL BANK HOLDINGS CORPORATION
NON-GAAP FINANCIAL MEASURES AND RECONCILIATIONS
(Dollars in thousands, except share and per share data)
Tangible Common Book Value Ratios
|
|
December 31, 2018 |
|
September 30, 2018 |
|
December 31, 2017 |
|||
|
Total shareholders' equity |
$ |
695,006 |
|
$ |
673,065 |
|
$ |
532,407 |
|
Less: goodwill and core deposit intangible assets, net |
|
(124,941) |
|
|
(125,294) |
|
|
(61,237) |
|
Add: deferred tax liability related to goodwill |
|
7,327 |
|
|
7,098 |
|
|
10,873 |
|
Tangible common equity (non-GAAP) |
$ |
577,392 |
|
$ |
554,869 |
|
$ |
482,043 |
|
|
|
|
|
|
|
|
|
|
|
Total assets |
$ |
5,676,666 |
|
$ |
5,585,104 |
|
$ |
4,843,465 |
|
Less: goodwill and core deposit intangible assets, net |
|
(124,941) |
|
|
(125,294) |
|
|
(61,237) |
|
Add: deferred tax liability related to goodwill |
|
7,327 |
|
|
7,098 |
|
|
10,873 |
|
Tangible assets (non-GAAP) |
$ |
5,559,052 |
|
$ |
5,466,908 |
|
$ |
4,793,101 |
|
|
|
|
|
|
|
|
|
|
|
Tangible common equity to tangible assets calculations: |
|
|
|
|
|
|
|
|
|
Total shareholders' equity to total assets |
|
12.24% |
|
|
12.05% |
|
|
10.99% |
|
Less: impact of goodwill and core deposit intangible assets, net |
|
(1.85)% |
|
|
(1.90)% |
|
|
(0.93)% |
|
Tangible common equity to tangible assets (non-GAAP) |
|
10.39% |
|
|
10.15% |
|
|
10.06% |
|
|
|
|
|
|
|
|
|
|
|
Tangible common book value per share calculations: |
|
|
|
|
|
|
|
|
|
Tangible common equity (non-GAAP) |
$ |
577,392 |
|
$ |
554,869 |
|
$ |
482,043 |
|
Divided by: ending shares outstanding |
|
30,769,063 |
|
|
30,759,595 |
|
|
26,875,585 |
|
Tangible common book value per share (non-GAAP) |
$ |
18.77 |
|
$ |
18.04 |
|
$ |
17.94 |
|
|
|
|
|
|
|
|
|
|
|
Tangible common book value per share, excluding accumulated other comprehensive loss calculations: |
|
|
|
|
|
|
|
|
|
Tangible common equity (non-GAAP) |
$ |
577,392 |
|
$ |
554,869 |
|
$ |
482,043 |
|
Accumulated other comprehensive loss, net of tax |
|
11,275 |
|
|
20,214 |
|
|
6,242 |
|
Tangible common book value, excluding accumulated other comprehensive loss, net of tax (non-GAAP) |
|
588,667 |
|
|
575,083 |
|
|
488,285 |
|
Divided by: ending shares outstanding |
|
30,769,063 |
|
|
30,759,595 |
|
|
26,875,585 |
|
Tangible common book value per share, excluding accumulated other comprehensive loss, net of tax (non-GAAP) |
$ |
19.13 |
|
$ |
18.70 |
|
$ |
18.17 |
14
NATIONAL BANK HOLDINGS CORPORATION
(Dollars in thousands, except share and per share data)
Return on Average Tangible Assets and Return on Average Tangible Equity
|
|
As of and for the three months ended |
|
As of and for the year ended |
|||||||||||
|
|
December 31, 2018 |
|
September 30, 2018 |
|
December 31, 2017 |
|
December 31, 2018 |
|
December 31, 2017 |
|||||
|
Net income |
$ |
17,235 |
|
$ |
18,240 |
|
$ |
(10,119) |
|
$ |
61,451 |
|
$ |
14,579 |
|
Add: impact of core deposit intangible amortization expense, after tax |
|
268 |
|
|
388 |
|
|
752 |
|
|
1,649 |
|
|
3,259 |
|
Net income adjusted for impact of core deposit intangible amortization expense, after tax |
$ |
17,503 |
|
$ |
18,628 |
|
$ |
(9,367) |
|
$ |
63,100 |
|
$ |
17,838 |
|
|
|
|
|
|
|
|
|
|
|
|
|
|
|
|
|
Average assets |
$ |
5,620,451 |
|
$ |
5,576,320 |
|
$ |
4,845,738 |
|
$ |
5,607,532 |
|
$ |
4,705,241 |
|
Less: average goodwill and core deposit intangible asset, net of deferred tax liability related to goodwill |
|
(117,760) |
|
|
(118,435) |
|
|
(50,945) |
|
|
(118,546) |
|
|
(52,958) |
|
Average tangible assets (non-GAAP) |
$ |
5,502,691 |
|
$ |
5,457,885 |
|
$ |
4,794,793 |
|
$ |
5,488,986 |
|
$ |
4,652,283 |
|
|
|
|
|
|
|
|
|
|
|
|
|
|
|
|
|
Average shareholders' equity |
$ |
682,726 |
|
$ |
670,515 |
|
$ |
552,810 |
|
$ |
662,420 |
|
$ |
546,716 |
|
Less: average goodwill and core deposit intangible assets, net of deferred tax liability related to goodwill |
|
(117,760) |
|
|
(118,435) |
|
|
(50,945) |
|
|
(118,546) |
|
|
(52,958) |
|
Average tangible common equity (non-GAAP) |
$ |
564,966 |
|
$ |
552,080 |
|
$ |
501,865 |
|
$ |
543,874 |
|
$ |
493,758 |
|
|
|
|
|
|
|
|
|
|
|
|
|
|
|
|
|
Return on average assets |
|
1.22% |
|
|
1.30% |
|
|
(0.83)% |
|
|
1.10% |
|
|
0.31% |
|
Return on average tangible assets (non-GAAP) |
|
1.26% |
|
|
1.35% |
|
|
(0.78)% |
|
|
1.15% |
|
|
0.38% |
|
Return on average equity |
|
10.02% |
|
|
10.79% |
|
|
(7.26)% |
|
|
9.28% |
|
|
2.67% |
|
Return on average tangible common equity (non-GAAP) |
|
12.29% |
|
|
13.39% |
|
|
(7.41)% |
|
|
11.60% |
|
|
3.61% |
Fully Taxable Equivalent Yield on Earning Assets and Net Interest Margin
|
|
As of and for the three months ended |
|
As of and for the year ended |
|||||||||||
|
|
December 31, 2018 |
|
September 30, 2018 |
|
December 31, 2017 |
|
December 31, 2018 |
|
December 31, 2017 |
|||||
|
Interest income |
$ |
57,780 |
|
$ |
55,909 |
|
$ |
41,889 |
|
$ |
221,391 |
|
$ |
164,421 |
|
Add: impact of taxable equivalent adjustment |
|
1,195 |
|
|
1,126 |
|
|
1,676 |
|
|
4,482 |
|
|
5,852 |
|
Interest income FTE (non-GAAP) |
$ |
58,975 |
|
$ |
57,035 |
|
$ |
43,565 |
|
$ |
225,873 |
|
$ |
170,273 |
|
|
|
|
|
|
|
|
|
|
|
|
|
|
|
|
|
Net interest income |
$ |
50,632 |
|
$ |
49,772 |
|
$ |
36,913 |
|
$ |
197,437 |
|
$ |
146,306 |
|
Add: impact of taxable equivalent adjustment |
|
1,195 |
|
|
1,126 |
|
|
1,676 |
|
|
4,482 |
|
|
5,852 |
|
Net interest income FTE (non-GAAP) |
$ |
51,827 |
|
$ |
50,898 |
|
$ |
38,589 |
|
$ |
201,919 |
|
$ |
152,158 |
|
|
|
|
|
|
|
|
|
|
|
|
|
|
|
|
|
Average earning assets |
$ |
5,152,934 |
|
$ |
5,104,137 |
|
$ |
4,495,651 |
|
$ |
5,131,694 |
|
$ |
4,353,320 |
|
Yield on earning assets |
|
4.45% |
|
|
4.35% |
|
|
3.70% |
|
|
4.31% |
|
|
3.78% |
|
Yield on earning assets FTE (non-GAAP) |
|
4.54% |
|
|
4.43% |
|
|
3.84% |
|
|
4.40% |
|
|
3.91% |
|
Net interest margin |
|
3.90% |
|
|
3.87% |
|
|
3.26% |
|
|
3.85% |
|
|
3.36% |
|
Net interest margin FTE (non-GAAP) |
|
3.99% |
|
|
3.96% |
|
|
3.41% |
|
|
3.93% |
|
|
3.50% |
15
Efficiency Ratio
|
|
|
As of and for the three months ended |
|
As of and for the year ended |
|
|||||||||||
|
|
|
December 31, 2018 |
|
September 30, 2018 |
|
December 31, 2017 |
|
December 31, 2018 |
|
December 31, 2017 |
|
|||||
|
Net interest income |
|
$ |
50,632 |
|
$ |
49,772 |
|
$ |
36,913 |
|
$ |
197,437 |
|
$ |
146,306 |
|
|
Add: impact of taxable equivalent adjustment |
|
|
1,195 |
|
|
1,126 |
|
|
1,676 |
|
|
4,482 |
|
|
5,852 |
|
|
Net interest income, FTE (non-GAAP) |
|
$ |
51,827 |
|
$ |
50,898 |
|
$ |
38,589 |
|
$ |
201,919 |
|
$ |
152,158 |
|
|
|
|
|
|
|
|
|
|
|
|
|
|
|
|
|
|
|
|
Non-interest income |
|
$ |
15,317 |
|
$ |
18,061 |
|
$ |
8,883 |
|
$ |
70,775 |
|
$ |
39,205 |
|
|
|
|
|
|
|
|
|
|
|
|
|
|
|
|
|
|
|
|
Non-interest expense |
|
$ |
42,857 |
|
$ |
44,432 |
|
$ |
34,028 |
|
$ |
189,334 |
|
$ |
136,677 |
|
|
Less: core deposit intangible asset amortization |
|
|
(353) |
|
|
(511) |
|
|
(1,232) |
|
|
(2,170) |
|
|
(5,342) |
|
|
Non-interest expense, adjusted for core deposit intangible asset amortization |
|
$ |
42,504 |
|
$ |
43,921 |
|
$ |
32,796 |
|
$ |
187,164 |
|
$ |
131,335 |
|
|
|
|
|
|
|
|
|
|
|
|
|
|
|
|
|
|
|
|
Non-interest expense, adjusted for core deposit intangible asset amortization |
|
$ |
42,504 |
|
$ |
43,921 |
|
$ |
32,796 |
|
$ |
187,164 |
|
$ |
131,335 |
|
|
Acquisition related expenses (1) |
|
|
— |
|
|
— |
|
|
(2,001) |
|
|
(7,957) |
|
|
(2,691) |
|
|
Tax reform bonuses(2) |
|
|
— |
|
|
— |
|
|
(491) |
|
|
— |
|
|
(491) |
|
|
Adjusted non-interest expense (non-GAAP) |
|
$ |
42,504 |
|
$ |
43,921 |
|
$ |
30,304 |
|
$ |
179,207 |
|
$ |
128,153 |
|
|
|
|
|
|
|
|
|
|
|
|
|
|
|
|
|
|
|
|
Efficiency ratio |
|
|
64.45% |
|
|
64.75% |
|
|
71.61% |
|
|
69.78% |
|
|
70.80% |
|
|
Efficiency ratio FTE (non-GAAP) |
|
|
63.30% |
|
|
63.69% |
|
|
69.08% |
|
|
68.64% |
|
|
68.63% |
|
|
Adjusted efficiency ratio FTE (non-GAAP) |
|
|
63.30% |
|
|
63.69% |
|
|
63.84% |
|
|
65.72% |
|
|
66.97% |
|
(1) Represents non-recurring acquisition expense related to the Peoples acquisition.
(2) Represents a special $1,000 bonus payment to 491 associates made in connection with the Tax Cuts and Jobs Act enacted in 2017.
16
Adjusted Financial Results
|
|
|
As of and for the three months ended |
|
As of and for the year ended |
|||||||||||
|
|
|
December 31, 2018 |
|
September 30, 2018 |
|
December 31, 2017 |
|
December 31, 2018 |
|
December 31, 2017 |
|||||
|
Adjustments to net income (loss): |
|
|
|
|
|
|
|
|
|
|
|
|
|
|
|
|
Net income (loss) |
|
$ |
17,235 |
|
$ |
18,240 |
|
$ |
(10,119) |
|
$ |
61,451 |
|
$ |
14,579 |
|
Adjustments(1) |
|
|
— |
|
|
— |
|
|
20,002 |
|
|
6,321 |
|
|
20,430 |
|
Adjusted net income (non-GAAP) |
|
$ |
17,235 |
|
$ |
18,240 |
|
$ |
9,883 |
|
$ |
67,772 |
|
$ |
35,009 |
|
|
|
|
|
|
|
|
|
|
|
|
|
|
|
|
|
|
Adjustments to income (loss) per share: |
|
|
|
|
|
|
|
|
|
|
|
|
|
|
|
|
Earnings (loss) per share - diluted |
|
$ |
0.55 |
|
$ |
0.58 |
|
$ |
(0.37) |
|
$ |
1.95 |
|
$ |
0.53 |
|
Adjustments(1) |
|
|
— |
|
|
— |
|
|
0.73 |
|
|
0.21 |
|
|
0.73 |
|
Adjusted earnings per share - diluted (non-GAAP) |
|
$ |
0.55 |
|
$ |
0.58 |
|
$ |
0.36 |
|
$ |
2.16 |
|
$ |
1.26 |
|
|
|
|
|
|
|
|
|
|
|
|
|
|
|
|
|
|
Adjustments to return on average tangible assets: |
|
|
|
|
|
|
|
|
|
|
|
|
|
|
|
|
Adjusted net income (non-GAAP) |
|
$ |
17,235 |
|
$ |
18,240 |
|
$ |
9,883 |
|
$ |
67,772 |
|
$ |
35,009 |
|
Add: impact of core deposit intangible amortization expense, after tax |
|
|
268 |
|
|
388 |
|
|
752 |
|
|
1,649 |
|
|
3,259 |
|
Net income adjusted for impact of core deposit intangible amortization expense, after tax |
|
|
17,503 |
|
|
18,628 |
|
|
10,635 |
|
|
69,421 |
|
|
38,268 |
|
Average tangible assets (non-GAAP) |
|
|
5,502,691 |
|
|
5,457,885 |
|
|
4,794,793 |
|
|
5,488,986 |
|
|
4,652,283 |
|
Adjusted return on average tangible assets (non-GAAP) |
|
|
1.26% |
|
|
1.35% |
|
|
0.88% |
|
|
1.26% |
|
|
0.82% |
|
|
|
|
|
|
|
|
|
|
|
|
|
|
|
|
|
|
Adjustments to return on average tangible common equity: |
|
|
|
|
|
|
|
|
|
|
|
|
|
|
|
|
Net income adjusted for impact of core deposit intangible amortization expense, after tax |
|
$ |
17,503 |
|
$ |
18,628 |
|
$ |
10,635 |
|
$ |
69,421 |
|
$ |
38,268 |
|
Average tangible common equity (non-GAAP) |
|
|
564,966 |
|
|
552,080 |
|
|
501,865 |
|
|
543,874 |
|
|
493,758 |
|
Adjusted return on average tangible common equity (non-GAAP) |
|
|
12.29% |
|
|
13.39% |
|
|
8.41% |
|
|
12.76% |
|
|
7.75% |
|
|
|
|
|
|
|
|
|
|
|
|
|
|
|
|
|
|
Adjustments to non-interest expense: |
|
|
|
|
|
|
|
|
|
|
|
|
|
|
|
|
Non-interest expense |
|
$ |
42,857 |
|
$ |
44,432 |
|
$ |
34,028 |
|
$ |
189,334 |
|
$ |
136,677 |
|
Adjustments(1) |
|
|
— |
|
|
— |
|
|
2,492 |
|
|
7,957 |
|
|
3,182 |
|
Adjusted non-interest expense (non-GAAP) |
|
|
42,857 |
|
|
44,432 |
|
|
31,536 |
|
|
181,377 |
|
|
133,495 |
|
Non-interest expense to average assets, adjusted (non-GAAP) |
|
|
3.03% |
|
|
3.16% |
|
|
2.58% |
|
|
3.23% |
|
|
2.84% |
|
|
|
|
|
|
|
|
|
|
|
|
|
|
|
|
|
|
(1) Adjustments: |
|
|
|
|
|
|
|
|
|
|
|
|
|
|
|
|
Non-interest expense adjustments: |
|
|
|
|
|
|
|
|
|
|
|
|
|
|
|
|
Acquisition-related(2) |
|
$ |
— |
|
$ |
— |
|
$ |
2,001 |
|
$ |
7,957 |
|
$ |
2,691 |
|
Tax reform bonuses(3) |
|
|
— |
|
|
— |
|
|
491 |
|
|
— |
|
|
491 |
|
Total pre-tax adjustments (non-GAAP) |
|
|
— |
|
|
— |
|
|
2,492 |
|
|
7,957 |
|
|
3,182 |
|
Collective tax expense impact |
|
|
— |
|
|
— |
|
|
(947) |
|
|
(1,636) |
|
|
(1,209) |
|
Deferred tax asset re-measurement |
|
|
— |
|
|
— |
|
|
18,457 |
|
|
— |
|
|
18,457 |
|
Adjustments (non-GAAP) |
|
$ |
— |
|
$ |
— |
|
$ |
20,002 |
|
$ |
6,321 |
|
$ |
20,430 |
(2) Represents non-recurring acquisition expense related to the Peoples acquisition.
(3) Represents a special $1,000 bonus payment to 491 associates made in connection with the Tax Cuts and Jobs Act enacted in 2017.
17
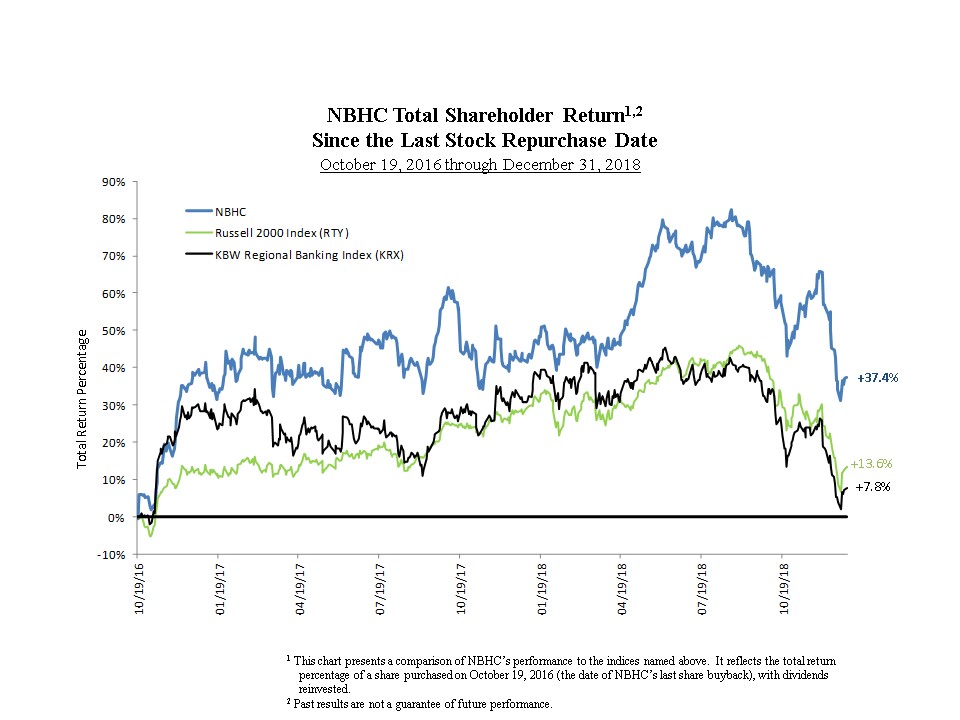
18