Attached files
| file | filename |
|---|---|
| 8-K - 8-K - Hilltop Holdings Inc. | f8-k.htm |
Exhibit 99.1
| Hilltop Holdings Inc. Q4 2018 Earnings Presentation January 2019 |

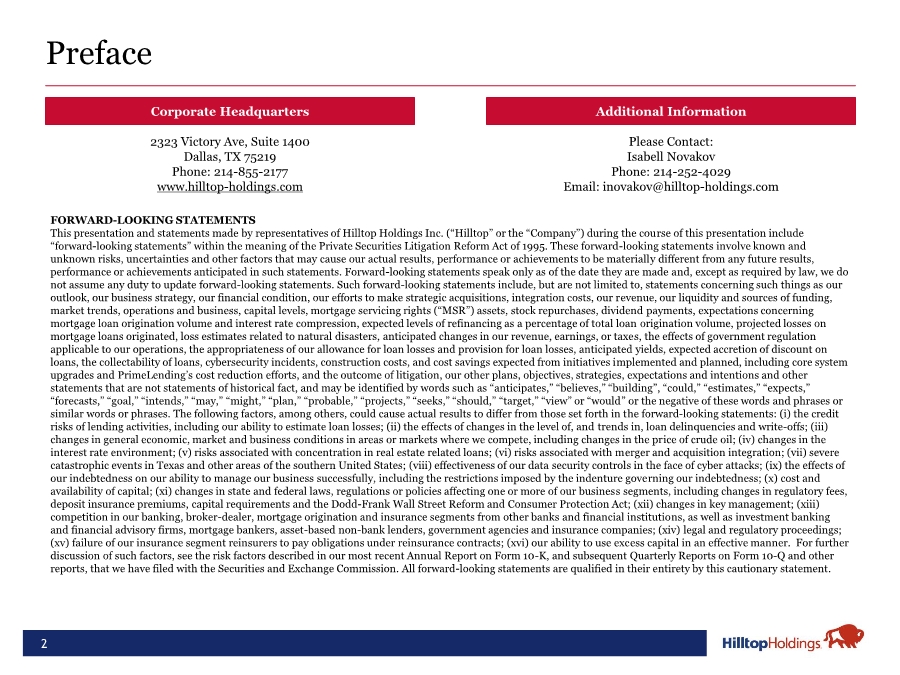
| Preface 2 Additional InformationCorporate Headquarters 2323 Victory Ave, Suite 1400 Dallas, TX 75219 Phone: 214-855-2177 www.hilltop-holdings.com Please Contact: Isabell Novakov Phone: 214-252-4029 Email: inovakov@hilltop-holdings.com FORWARD-LOOKING STATEMENTS This presentation and statements made by representatives of Hilltop Holdings Inc. (“Hilltop” or the “Company”) during the course of this presentation include “forward-looking statements” within the meaning of the Private Securities Litigation Reform Act of 1995. These forward-looking statements involve known and unknown risks, uncertainties and other factors that may cause our actual results, performance or achievements to be materially different from any future results, performance or achievements anticipated in such statements. Forward-looking statements speak only as of the date they are made and, except as required by law, we do not assume any duty to update forward-looking statements. Such forward-looking statements include, but are not limited to, statements concerning such things as our outlook, our business strategy, our financial condition, our efforts to make strategic acquisitions, integration costs, our revenue, our liquidity and sources of funding, market trends, operations and business, capital levels, mortgage servicing rights (“MSR”) assets, stock repurchases, dividend payments, expectations concerning mortgage loan origination volume and interest rate compression, expected levels of refinancing as a percentage of total loan origination volume, projected losses on mortgage loans originated, loss estimates related to natural disasters, anticipated changes in our revenue, earnings, or taxes, the effects of government regulation applicable to our operations, the appropriateness of our allowance for loan losses and provision for loan losses, anticipated yields, expected accretion of discount on loans, the collectability of loans, cybersecurity incidents, construction costs, and cost savings expected from initiatives implemented and planned, including core system upgrades and PrimeLending’s cost reduction efforts, and the outcome of litigation, our other plans, objectives, strategies, expectations and intentions and other statements that are not statements of historical fact, and may be identified by words such as “anticipates,” “believes,” “building”, “could,” “estimates,” “expects,” “forecasts,” “goal,” “intends,” “may,” “might,” “plan,” “probable,” “projects,” “seeks,” “should,” “target,” “view” or “would” or the negative of these words and phrases or similar words or phrases. The following factors, among others, could cause actual results to differ from those set forth in the forward-looking statements: (i) the credit risks of lending activities, including our ability to estimate loan losses; (ii) the effects of changes in the level of, and trends in, loan delinquencies and write-offs; (iii) changes in general economic, market and business conditions in areas or markets where we compete, including changes in the price of crude oil; (iv) changes in the interest rate environment; (v) risks associated with concentration in real estate related loans; (vi) risks associated with merger and acquisition integration; (vii) severe catastrophic events in Texas and other areas of the southern United States; (viii) effectiveness of our data security controls in the face of cyber attacks; (ix) the effects of our indebtedness on our ability to manage our business successfully, including the restrictions imposed by the indenture governing our indebtedness; (x) cost and availability of capital; (xi) changes in state and federal laws, regulations or policies affecting one or more of our business segments, including changes in regulatory fees, deposit insurance premiums, capital requirements and the Dodd-Frank Wall Street Reform and Consumer Protection Act; (xii) changes in key management; (xiii) competition in our banking, broker-dealer, mortgage origination and insurance segments from other banks and financial institutions, as well as investment banking and financial advisory firms, mortgage bankers, asset-based non-bank lenders, government agencies and insurance companies; (xiv) legal and regulatory proceedings; (xv) failure of our insurance segment reinsurers to pay obligations under reinsurance contracts; (xvi) our ability to use excess capital in an effective manner. For further discussion of such factors, see the risk factors described in our most recent Annual Report on Form 10-K, and subsequent Quarterly Reports on Form 10-Q and other reports, that we have filed with the Securities and Exchange Commission. All forward-looking statements are qualified in their entirety by this cautionary statement. |
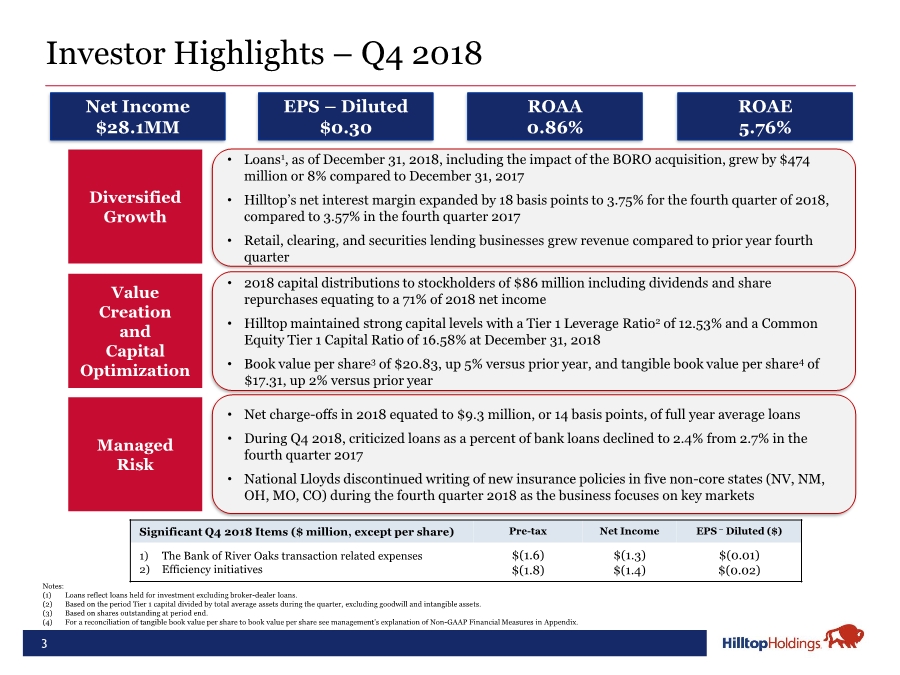
| 3 Investor Highlights – Q4 2018 Value Creation and Capital Optimization • Net charge-offs in 2018 equated to $9.3 million, or 14 basis points, of full year average loans • During Q4 2018, criticized loans as a percent of bank loans declined to 2.4% from 2.7% in the fourth quarter 2017 • National Lloyds discontinued writing of new insurance policies in five non-core states (NV, NM, OH, MO, CO) during the fourth quarter 2018 as the business focuses on key markets Diversified Growth Managed Risk • Loans1, as of December 31, 2018, including the impact of the BORO acquisition, grew by $474 million or 8% compared to December 31, 2017 • Hilltop’s net interest margin expanded by 18 basis points to 3.75% for the fourth quarter of 2018, compared to 3.57% in the fourth quarter 2017 • Retail, clearing, and securities lending businesses grew revenue compared to prior year fourth quarter • 2018 capital distributions to stockholders of $86 million including dividends and share repurchases equating to a 71% of 2018 net income • Hilltop maintained strong capital levels with a Tier 1 Leverage Ratio2 of 12.53% and a Common Equity Tier 1 Capital Ratio of 16.58% at December 31, 2018 • Book value per share3 of $20.83, up 5% versus prior year, and tangible book value per share4 of $17.31, up 2% versus prior year Net Income $28.1MM ROAA 0.86% EPS – Diluted $0.30 ROAE 5.76% Notes: (1) Loans reflect loans held for investment excluding broker-dealer loans. (2) Based on the period Tier 1 capital divided by total average assets during the quarter, excluding goodwill and intangible assets. (3) Based on shares outstanding at period end. (4) For a reconciliation of tangible book value per share to book value per share see management’s explanation of Non-GAAP Financial Measures in Appendix. Significant Q4 2018 Items ($ million, except per share) Pre-tax Net Income EPS – Diluted ($) 1) The Bank of River Oaks transaction related expenses 2) Efficiency initiatives $(1.6) $(1.8) $(1.3) $(1.4) $(0.01) $(0.02) |
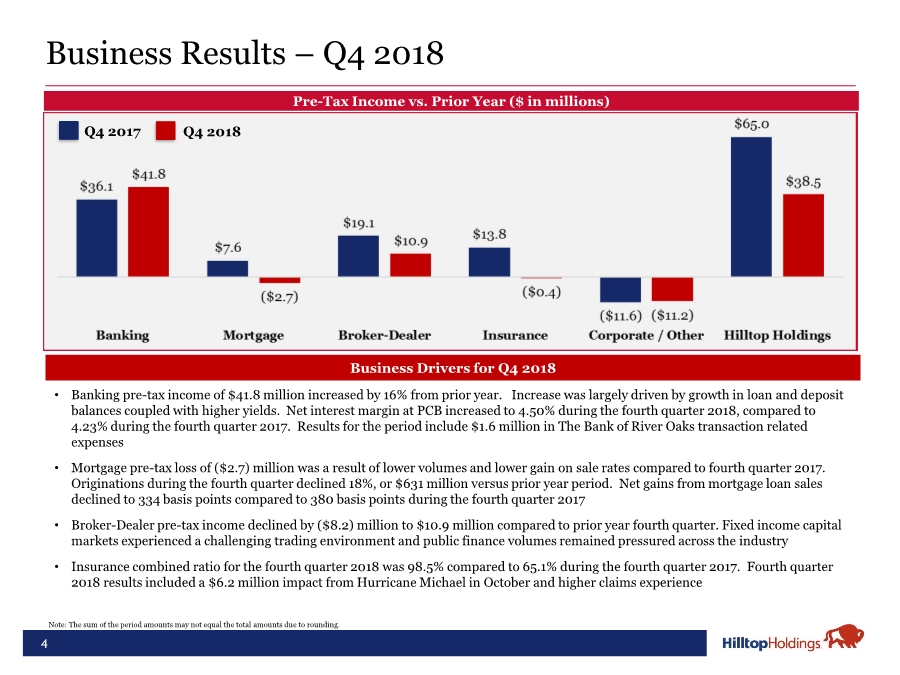
| 4 Business Results – Q4 2018 Pre-Tax Income vs. Prior Year ($ in millions) • Banking pre-tax income of $41.8 million increased by 16% from prior year. Increase was largely driven by growth in loan and deposit balances coupled with higher yields. Net interest margin at PCB increased to 4.50% during the fourth quarter 2018, compared to 4.23% during the fourth quarter 2017. Results for the period include $1.6 million in The Bank of River Oaks transaction related expenses • Mortgage pre-tax loss of ($2.7) million was a result of lower volumes and lower gain on sale rates compared to fourth quarter 2017. Originations during the fourth quarter declined 18%, or $631 million versus prior year period. Net gains from mortgage loan sales declined to 334 basis points compared to 380 basis points during the fourth quarter 2017 • Broker-Dealer pre-tax income declined by ($8.2) million to $10.9 million compared to prior year fourth quarter. Fixed income capital markets experienced a challenging trading environment and public finance volumes remained pressured across the industry • Insurance combined ratio for the fourth quarter 2018 was 98.5% compared to 65.1% during the fourth quarter 2017. Fourth quarter 2018 results included a $6.2 million impact from Hurricane Michael in October and higher claims experience Business Drivers for Q4 2018 Q4 2017 Q4 2018 Note: The sum of the period amounts may not equal the total amounts due to rounding. |
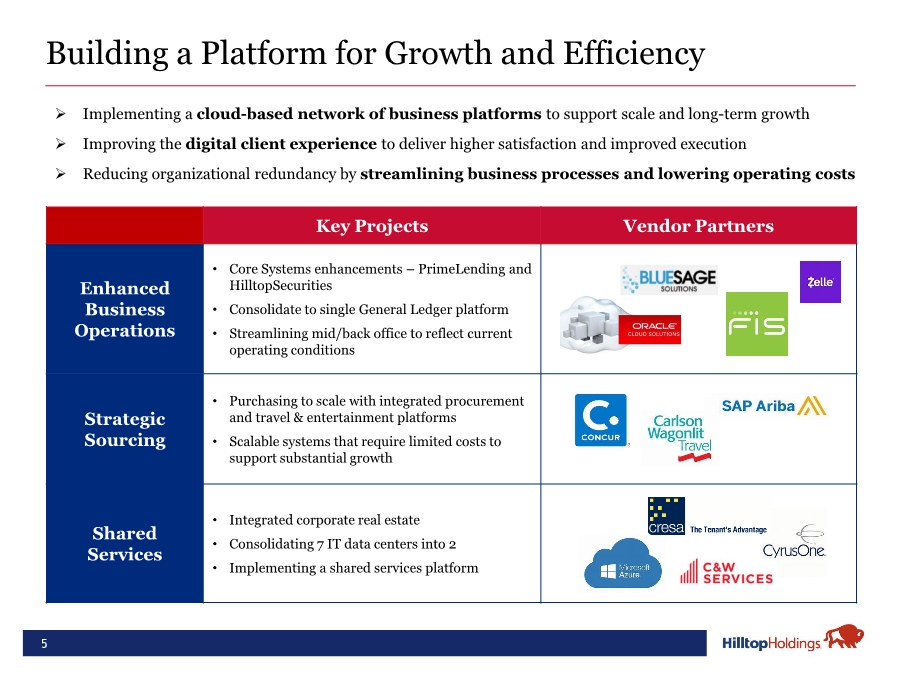
| Building a Platform for Growth and Efficiency 5 Key Projects Vendor Partners Enhanced Business Operations • Core Systems enhancements – PrimeLending and HilltopSecurities • Consolidate to single General Ledger platform • Streamlining mid/back office to reflect current operating conditions Strategic Sourcing • Purchasing to scale with integrated procurement and travel & entertainment platforms • Scalable systems that require limited costs to support substantial growth Shared Services • Integrated corporate real estate • Consolidating 7 IT data centers into 2 • Implementing a shared services platform Implementing a cloud-based network of business platforms to support scale and long-term growth Improving the digital client experience to deliver higher satisfaction and improved execution Reducing organizational redundancy by streamlining business processes and lowering operating costs |
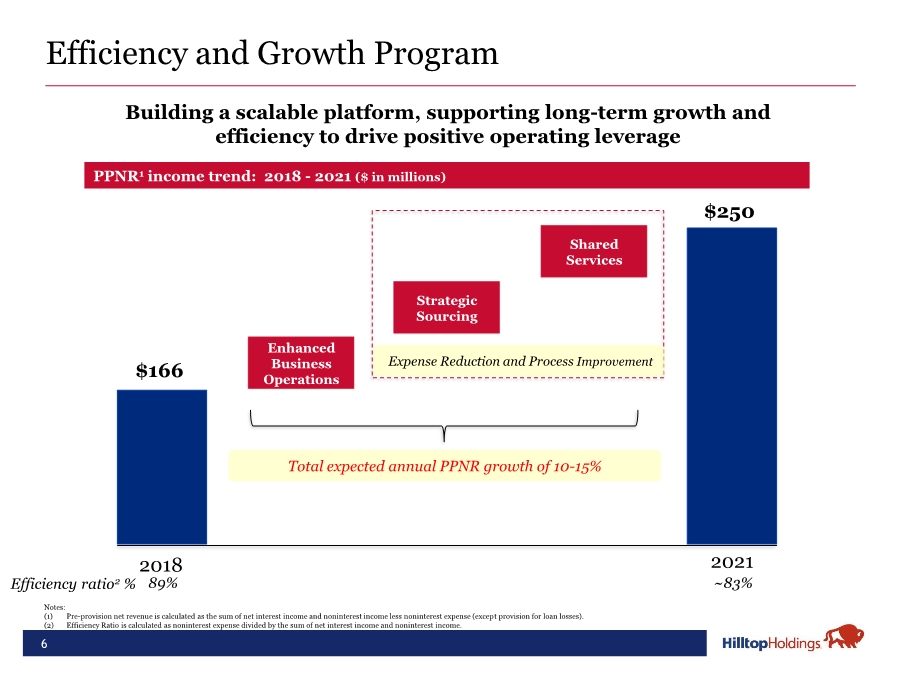
| Efficiency and Growth Program 6 PPNR1 income trend: 2018 - 2021 ($ in millions) $166 $250 2018 2021 Shared Services Strategic Sourcing Enhanced Business Operations Total expected annual PPNR growth of 10-15% Building a scalable platform, supporting long-term growth and efficiency to drive positive operating leverage Expense Reduction and Process Improvement 89%Efficiency ratio2 % ~83% Notes: (1) Pre-provision net revenue is calculated as the sum of net interest income and noninterest income less noninterest expense (except provision for loan losses). (2) Efficiency Ratio is calculated as noninterest expense divided by the sum of net interest income and noninterest income. |
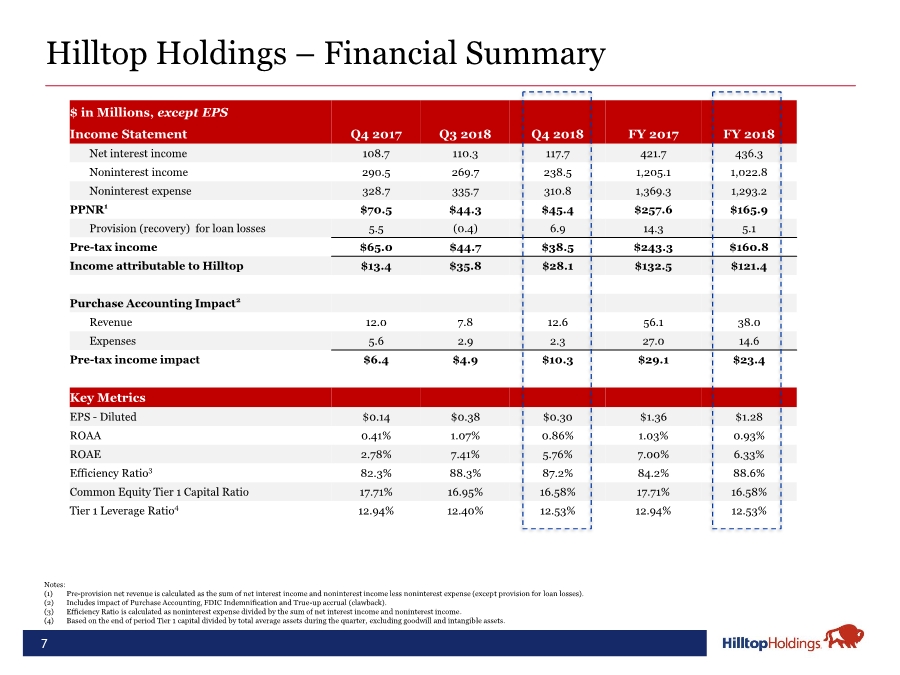
| $ in Millions, except EPS Income Statement Q4 2017 Q3 2018 Q4 2018 FY 2017 FY 2018 Net interest income 108.7 110.3 117.7 421.7 436.3 Noninterest income 290.5 269.7 238.5 1,205.1 1,022.8 Noninterest expense 328.7 335.7 310.8 1,369.3 1,293.2 PPNR1 $70.5 $44.3 $45.4 $257.6 $165.9 Provision (recovery) for loan losses 5.5 (0.4) 6.9 14.3 5.1 Pre-tax income $65.0 $44.7 $38.5 $243.3 $160.8 Income attributable to Hilltop $13.4 $35.8 $28.1 $132.5 $121.4 Purchase Accounting Impact2 Revenue 12.0 7.8 12.6 56.1 38.0 Expenses 5.6 2.9 2.3 27.0 14.6 Pre-tax income impact $6.4 $4.9 $10.3 $29.1 $23.4 Key Metrics EPS - Diluted $0.14 $0.38 $0.30 $1.36 $1.28 ROAA 0.41% 1.07% 0.86% 1.03% 0.93% ROAE 2.78% 7.41% 5.76% 7.00% 6.33% Efficiency Ratio3 82.3% 88.3% 87.2% 84.2% 88.6% Common Equity Tier 1 Capital Ratio 17.71% 16.95% 16.58% 17.71% 16.58% Tier 1 Leverage Ratio4 12.94% 12.40% 12.53% 12.94% 12.53% 7 Notes: (1) Pre-provision net revenue is calculated as the sum of net interest income and noninterest income less noninterest expense (except provision for loan losses). (2) Includes impact of Purchase Accounting, FDIC Indemnification and True-up accrual (clawback). (3) Efficiency Ratio is calculated as noninterest expense divided by the sum of net interest income and noninterest income. (4) Based on the end of period Tier 1 capital divided by total average assets during the quarter, excluding goodwill and intangible assets. Hilltop Holdings – Financial Summary |
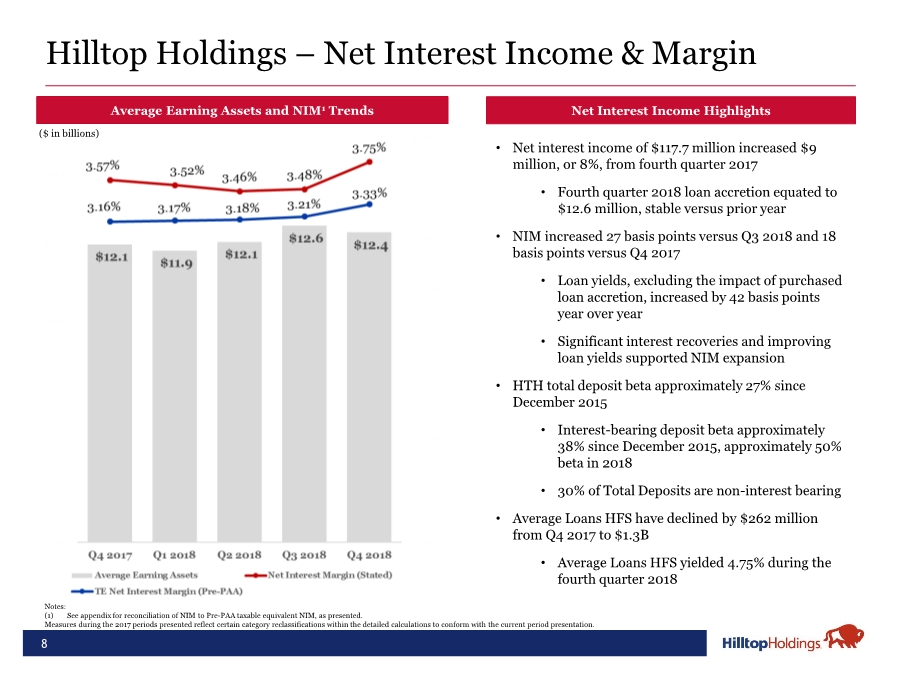
| 8 Hilltop Holdings – Net Interest Income & Margin • Net interest income of $117.7 million increased $9 million, or 8%, from fourth quarter 2017 • Fourth quarter 2018 loan accretion equated to $12.6 million, stable versus prior year • NIM increased 27 basis points versus Q3 2018 and 18 basis points versus Q4 2017 • Loan yields, excluding the impact of purchased loan accretion, increased by 42 basis points year over year • Significant interest recoveries and improving loan yields supported NIM expansion • HTH total deposit beta approximately 27% since December 2015 • Interest-bearing deposit beta approximately 38% since December 2015, approximately 50% beta in 2018 • 30% of Total Deposits are non-interest bearing • Average Loans HFS have declined by $262 million from Q4 2017 to $1.3B • Average Loans HFS yielded 4.75% during the fourth quarter 2018 Average Earning Assets and NIM1 Trends 2 Net Interest Income Highlights ($ in billions) Notes: (1) See appendix for reconciliation of NIM to Pre-PAA taxable equivalent NIM, as presented. Measures during the 2017 periods presented reflect certain category reclassifications within the detailed calculations to conform with the current period presentation. |
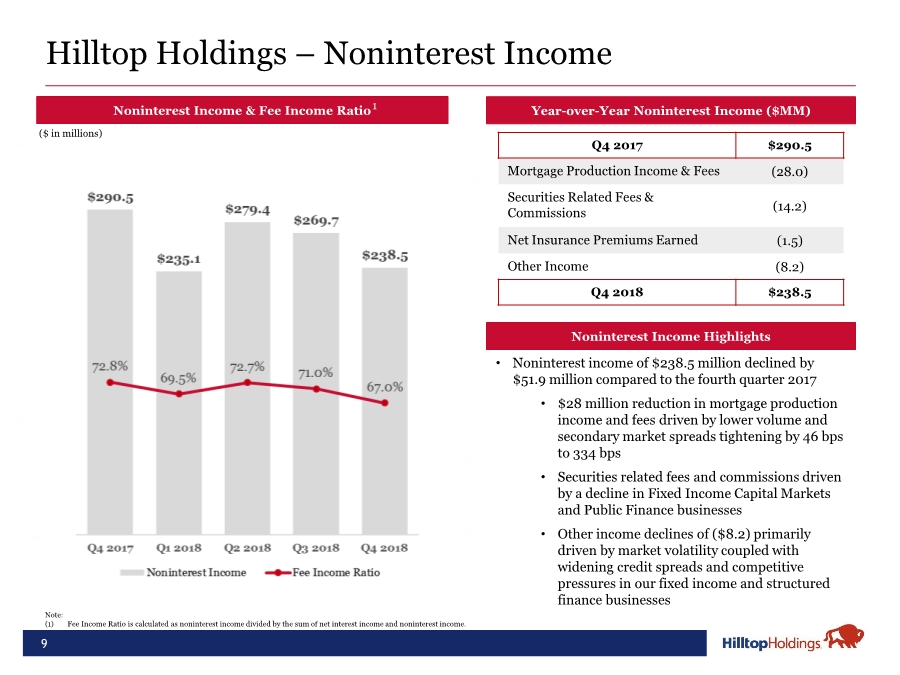
| 9 Hilltop Holdings – Noninterest Income • Noninterest income of $238.5 million declined by $51.9 million compared to the fourth quarter 2017 • $28 million reduction in mortgage production income and fees driven by lower volume and secondary market spreads tightening by 46 bps to 334 bps • Securities related fees and commissions driven by a decline in Fixed Income Capital Markets and Public Finance businesses • Other income declines of ($8.2) primarily driven by market volatility coupled with widening credit spreads and competitive pressures in our fixed income and structured finance businesses Year-over-Year Noninterest Income ($MM)Noninterest Income & Fee Income Ratio Noninterest Income Highlights 1 Note: (1) Fee Income Ratio is calculated as noninterest income divided by the sum of net interest income and noninterest income. ($ in millions) Q4 2017 $290.5 Mortgage Production Income & Fees (28.0) Securities Related Fees & Commissions (14.2) Net Insurance Premiums Earned (1.5) Other Income (8.2) Q4 2018 $238.5 |
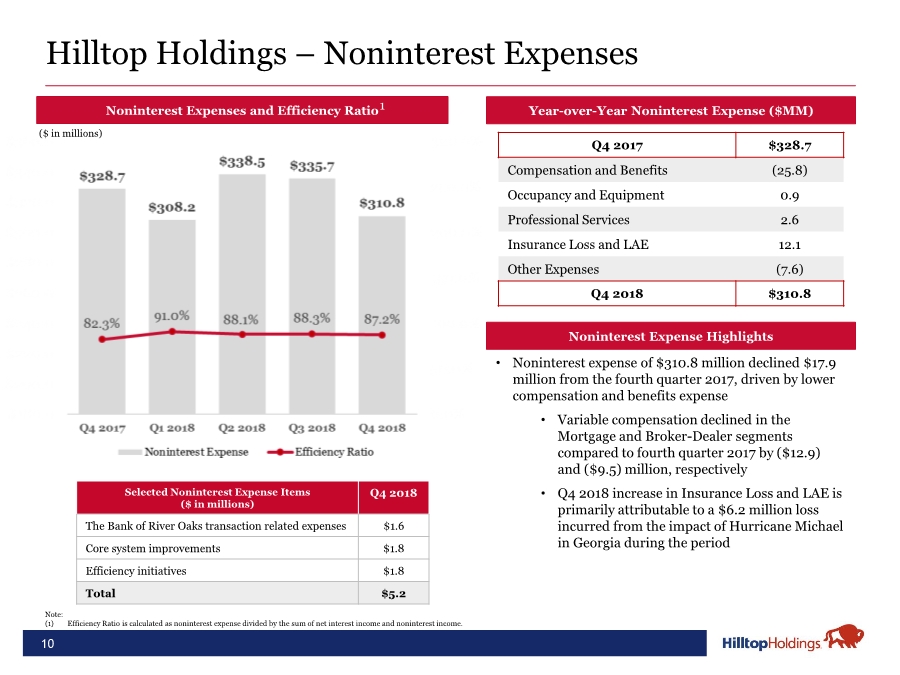
| 10 Hilltop Holdings – Noninterest Expenses Year-over-Year Noninterest Expense ($MM)Noninterest Expenses and Efficiency Ratio Noninterest Expense Highlights •Noninterest expense of $310.8 million declined $17.9 million from the fourth quarter 2017, driven by lower compensation and benefits expense • Variable compensation declined in the Mortgage and Broker-Dealer segments compared to fourth quarter 2017 by ($12.9) and ($9.5) million, respectively • Q4 2018 increase in Insurance Loss and LAE is primarily attributable to a $6.2 million loss incurred from the impact of Hurricane Michael in Georgia during the period Note: (1) Efficiency Ratio is calculated as noninterest expense divided by the sum of net interest income and noninterest income. 1 ($ in millions) Q4 2017 $328.7 Compensation and Benefits (25.8) Occupancy and Equipment 0.9 Professional Services 2.6 Insurance Loss and LAE 12.1 Other Expenses (7.6) Q4 2018 $310.8 Selected Noninterest Expense Items ($ in millions) Q4 2018 The Bank of River Oaks transaction related expenses $1.6 Core system improvements $1.8 Efficiency initiatives $1.8 Total $5.2 |
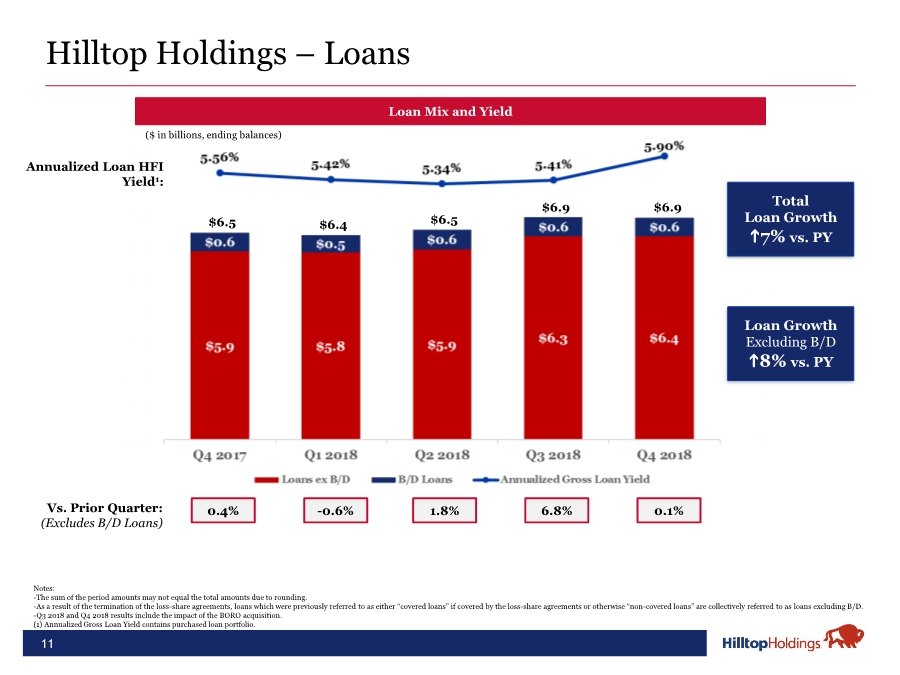
| 11 Notes: -The sum of the period amounts may not equal the total amounts due to rounding. -As a result of the termination of the loss-share agreements, loans which were previously referred to as either “covered loans” if covered by the loss-share agreements or otherwise “non-covered loans” are collectively referred to as loans excluding B/D. -Q3 2018 and Q4 2018 results include the impact of the BORO acquisition. (1) Annualized Gross Loan Yield contains purchased loan portfolio. Vs. Prior Quarter: (Excludes B/D Loans) Loan Mix and Yield 0.1%6.8% Total Loan Growth h7% vs. PY $6.9 0.4% $6.5 ($ in billions, ending balances) Hilltop Holdings – Loans Annualized Loan HFI Yield1: $6.4 -0.6% $6.9 1.8% $6.5 Loan Growth Excluding B/D h8% vs. PY |
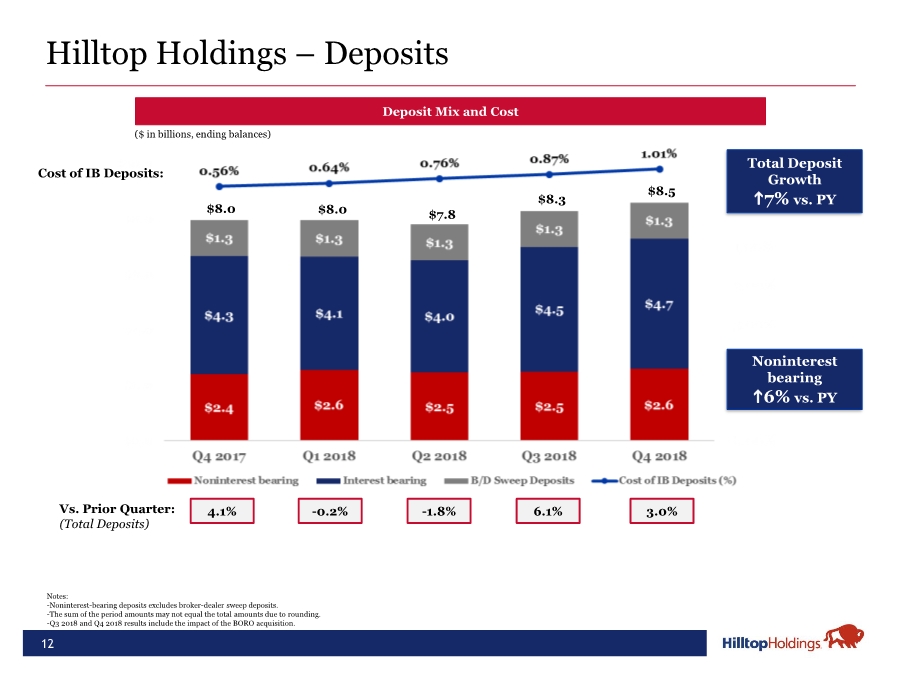
| 12 Vs. Prior Quarter: (Total Deposits) Deposit Mix and Cost 3.0% $8.0 4.1% ($ in billions, ending balances) Notes: -Noninterest-bearing deposits excludes broker-dealer sweep deposits. -The sum of the period amounts may not equal the total amounts due to rounding. -Q3 2018 and Q4 2018 results include the impact of the BORO acquisition. Total Deposit Growth h7% vs. PY Hilltop Holdings – Deposits Cost of IB Deposits: $8.0 -0.2% Noninterest bearing h6% vs. PY $7.8 -1.8% $8.3 6.1% $8.5 |
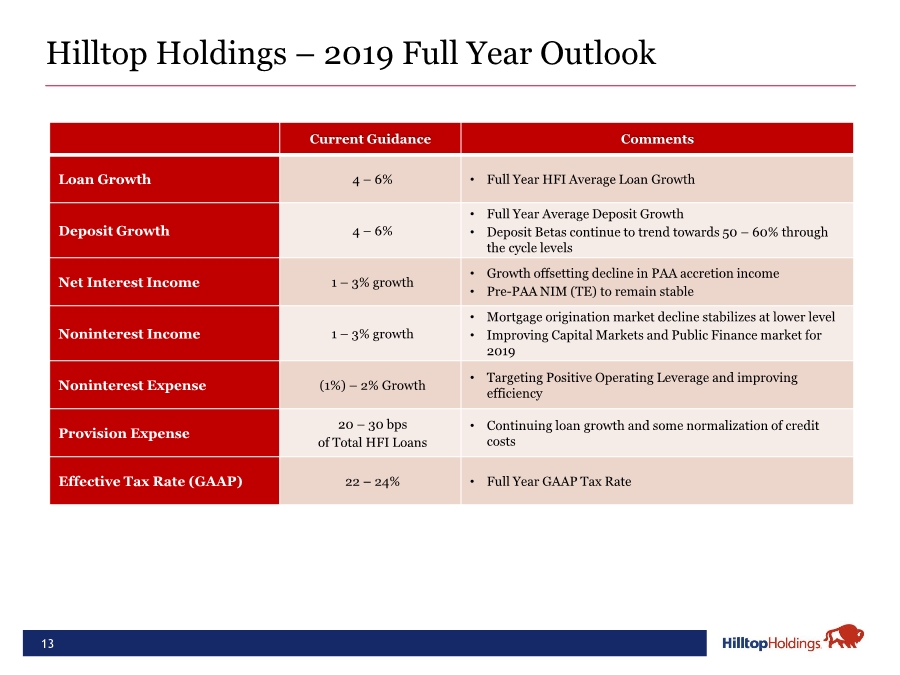
| 13 Hilltop Holdings – 2019 Full Year Outlook Current Guidance Comments Loan Growth 4 – 6% • Full Year HFI Average Loan Growth Deposit Growth 4 – 6% • Full Year Average Deposit Growth • Deposit Betas continue to trend towards 50 – 60% through the cycle levels Net Interest Income 1 – 3% growth • Growth offsetting decline in PAA accretion income • Pre-PAA NIM (TE) to remain stable Noninterest Income 1 – 3% growth • Mortgage origination market decline stabilizes at lower level • Improving Capital Markets and Public Finance market for 2019 Noninterest Expense (1%) – 2% Growth • Targeting Positive Operating Leverage and improving efficiency Provision Expense 20 – 30 bps of Total HFI Loans • Continuing loan growth and some normalization of credit costs Effective Tax Rate (GAAP) 22 – 24% • Full Year GAAP Tax Rate |
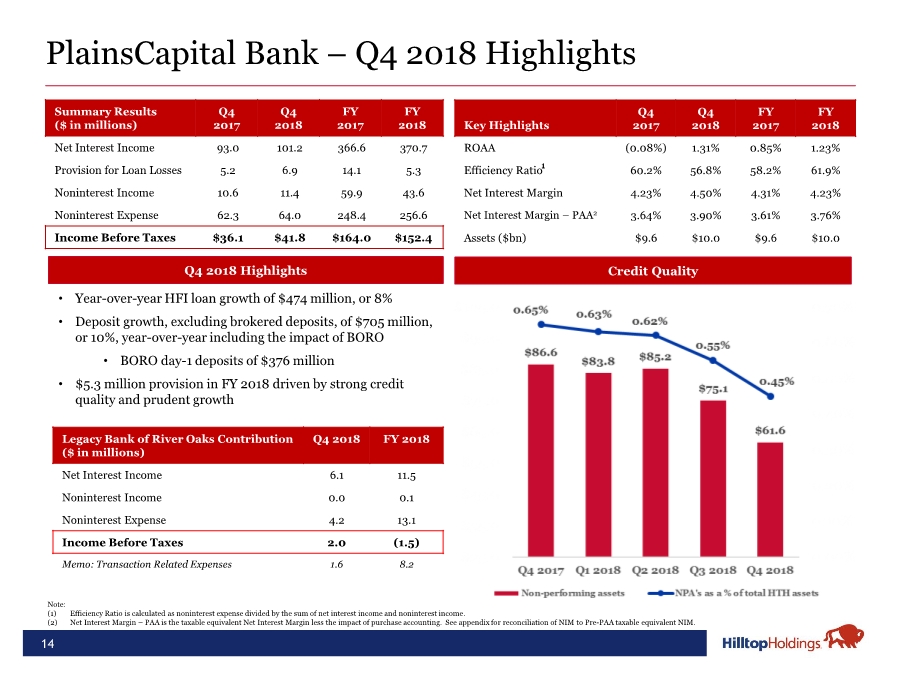
| 14 PlainsCapital Bank – Q4 2018 Highlights Credit QualityQ4 2018 Highlights Note: (1) Efficiency Ratio is calculated as noninterest expense divided by the sum of net interest income and noninterest income. (2) Net Interest Margin – PAA is the taxable equivalent Net Interest Margin less the impact of purchase accounting. See appendix for reconciliation of NIM to Pre-PAA taxable equivalent NIM. 1 • Year-over-year HFI loan growth of $474 million, or 8% •Deposit growth, excluding brokered deposits, of $705 million, or 10%, year-over-year including the impact of BORO • BORO day-1 deposits of $376 million • $5.3 million provision in FY 2018 driven by strong credit quality and prudent growth 1 Summary Results ($ in millions) Q4 2017 Q4 2018 FY 2017 FY 2018 Net Interest Income 93.0 101.2 366.6 370.7 Provision for Loan Losses 5.2 6.9 14.1 5.3 Noninterest Income 10.6 11.4 59.9 43.6 Noninterest Expense 62.3 64.0 248.4 256.6 Income Before Taxes $36.1 $41.8 $164.0 $152.4 Key Highlights Q4 2017 Q4 2018 FY 2017 FY 2018 ROAA (0.08%) 1.31% 0.85% 1.23% Efficiency Ratio 60.2% 56.8% 58.2% 61.9% Net Interest Margin 4.23% 4.50% 4.31% 4.23% Net Interest Margin – PAA2 3.64% 3.90% 3.61% 3.76% Assets ($bn) $9.6 $10.0 $9.6 $10.0 Legacy Bank of River Oaks Contribution ($ in millions) Q4 2018 FY 2018 Net Interest Income 6.1 11.5 Noninterest Income 0.0 0.1 Noninterest Expense 4.2 13.1 Income Before Taxes 2.0 (1.5) Memo: Transaction Related Expenses 1.6 8.2 |
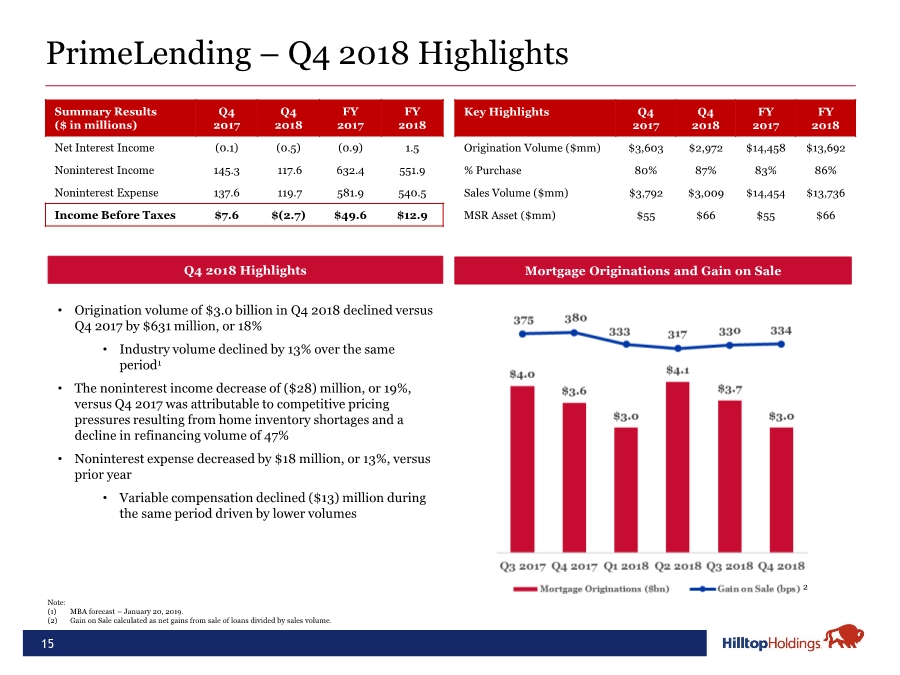
| 15 PrimeLending – Q4 2018 Highlights Mortgage Originations and Gain on SaleQ4 2018 Highlights • Origination volume of $3.0 billion in Q4 2018 declined versus Q4 2017 by $631 million, or 18% • Industry volume declined by 13% over the same period1 • The noninterest income decrease of ($28) million, or 19%, versus Q4 2017 was attributable to competitive pricing pressures resulting from home inventory shortages and a decline in refinancing volume of 47% • Noninterest expense decreased by $18 million, or 13%, versus prior year • Variable compensation declined ($13) million during the same period driven by lower volumes 2 Note: (1) MBA forecast – January 20, 2019. (2) Gain on Sale calculated as net gains from sale of loans divided by sales volume. Summary Results ($ in millions) Q4 2017 Q4 2018 FY 2017 FY 2018 Net Interest Income (0.1) (0.5) (0.9) 1.5 Noninterest Income 145.3 117.6 632.4 551.9 Noninterest Expense 137.6 119.7 581.9 540.5 Income Before Taxes $7.6 $(2.7) $49.6 $12.9 Key Highlights Q4 2017 Q4 2018 FY 2017 FY 2018 Origination Volume ($mm) $3,603 $2,972 $14,458 $13,692 % Purchase 80% 87% 83% 86% Sales Volume ($mm) $3,792 $3,009 $14,454 $13,736 MSR Asset ($mm) $55 $66 $55 $66 |
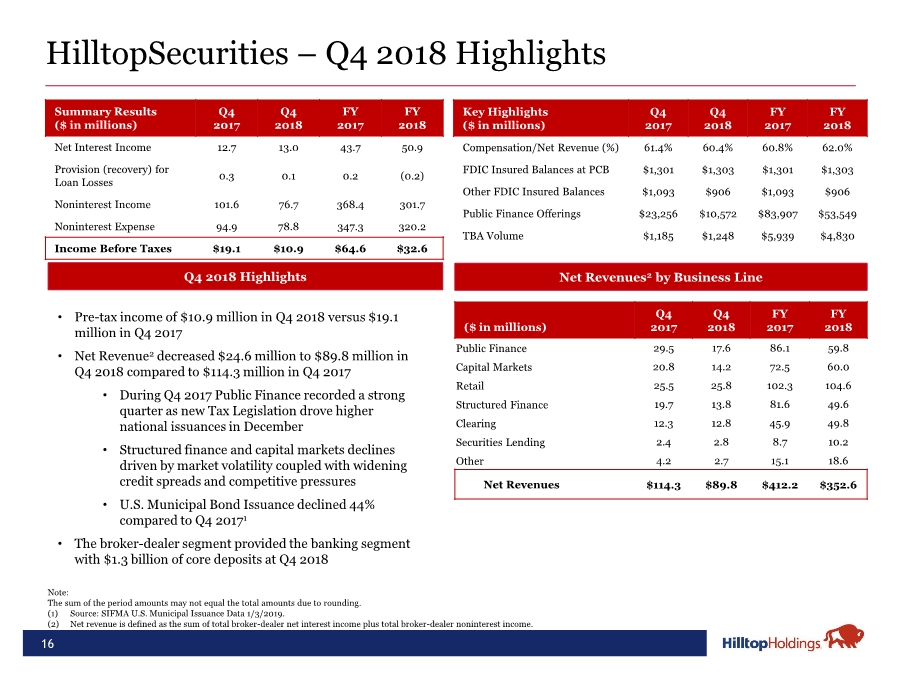
| 16 HilltopSecurities – Q4 2018 Highlights • Pre-tax income of $10.9 million in Q4 2018 versus $19.1 million in Q4 2017 • Net Revenue2 decreased $24.6 million to $89.8 million in Q4 2018 compared to $114.3 million in Q4 2017 • During Q4 2017 Public Finance recorded a strong quarter as new Tax Legislation drove higher national issuances in December • Structured finance and capital markets declines driven by market volatility coupled with widening credit spreads and competitive pressures • U.S. Municipal Bond Issuance declined 44% compared to Q4 20171 • The broker-dealer segment provided the banking segment with $1.3 billion of core deposits at Q4 2018 Note: The sum of the period amounts may not equal the total amounts due to rounding. (1) Source: SIFMA U.S. Municipal Issuance Data 1/3/2019. (2) Net revenue is defined as the sum of total broker-dealer net interest income plus total broker-dealer noninterest income. Q4 2018 Highlights Net Revenues2 by Business Line Summary Results ($ in millions) Q4 2017 Q4 2018 FY 2017 FY 2018 Net Interest Income 12.7 13.0 43.7 50.9 Provision (recovery) for Loan Losses 0.3 0.1 0.2 (0.2) Noninterest Income 101.6 76.7 368.4 301.7 Noninterest Expense 94.9 78.8 347.3 320.2 Income Before Taxes $19.1 $10.9 $64.6 $32.6 Key Highlights ($ in millions) Q4 2017 Q4 2018 FY 2017 FY 2018 Compensation/Net Revenue (%) 61.4% 60.4% 60.8% 62.0% FDIC Insured Balances at PCB $1,301 $1,303 $1,301 $1,303 Other FDIC Insured Balances $1,093 $906 $1,093 $906 Public Finance Offerings $23,256 $10,572 $83,907 $53,549 TBA Volume $1,185 $1,248 $5,939 $4,830 ($ in millions) Q4 2017 Q4 2018 FY 2017 FY 2018 Public Finance 29.5 17.6 86.1 59.8 Capital Markets 20.8 14.2 72.5 60.0 Retail 25.5 25.8 102.3 104.6 Structured Finance 19.7 13.8 81.6 49.6 Clearing 12.3 12.8 45.9 49.8 Securities Lending 2.4 2.8 8.7 10.2 Other 4.2 2.7 15.1 18.6 Net Revenues $114.3 $89.8 $412.2 $352.6 |
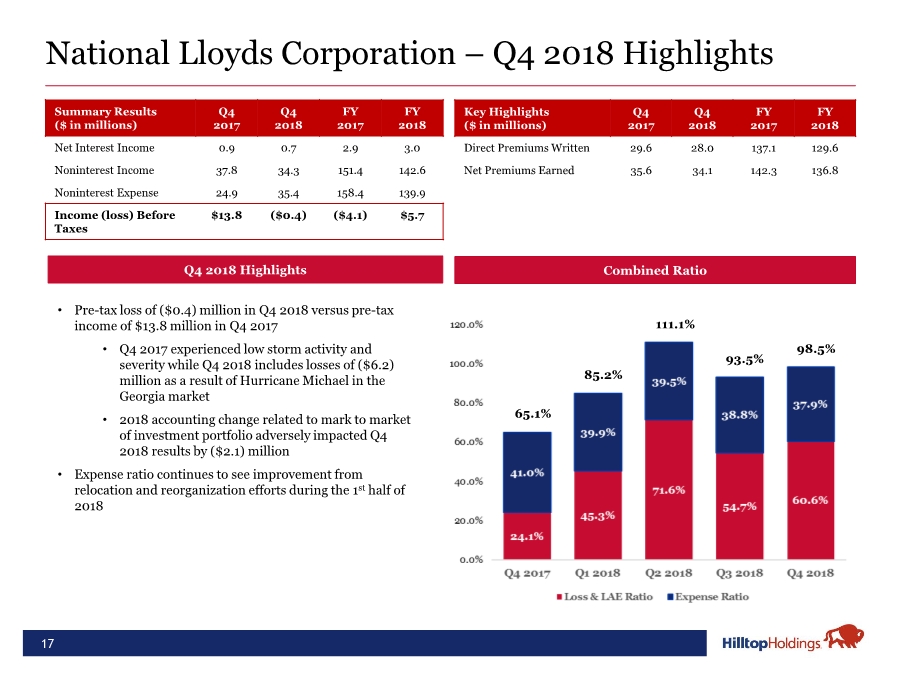
| 17 National Lloyds Corporation – Q4 2018 Highlights • Pre-tax loss of ($0.4) million in Q4 2018 versus pre-tax income of $13.8 million in Q4 2017 • Q4 2017 experienced low storm activity and severity while Q4 2018 includes losses of ($6.2) million as a result of Hurricane Michael in the Georgia market • 2018 accounting change related to mark to market of investment portfolio adversely impacted Q4 2018 results by ($2.1) million • Expense ratio continues to see improvement from relocation and reorganization efforts during the 1st half of 2018 Q4 2018 Highlights Combined Ratio 85.2% 111.1% 98.5% 65.1% 93.5% Summary Results ($ in millions) Q4 2017 Q4 2018 FY 2017 FY 2018 Net Interest Income 0.9 0.7 2.9 3.0 Noninterest Income 37.8 34.3 151.4 142.6 Noninterest Expense 24.9 35.4 158.4 139.9 Income (loss) Before Taxes $13.8 ($0.4) ($4.1) $5.7 Key Highlights ($ in millions) Q4 2017 Q4 2018 FY 2017 FY 2018 Direct Premiums Written 29.6 28.0 137.1 129.6 Net Premiums Earned 35.6 34.1 142.3 136.8 |
| Q&A 18 |

| Appendix 19 |

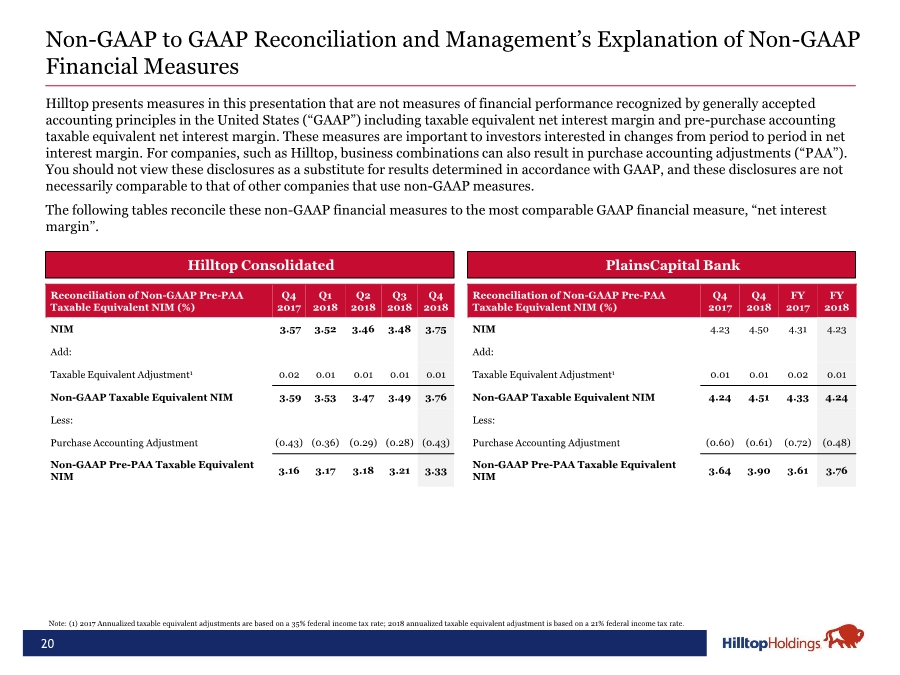
| 20 Non-GAAP to GAAP Reconciliation and Management’s Explanation of Non-GAAP Financial Measures • Hilltop Consolidated Hilltop presents measures in this presentation that are not measures of financial performance recognized by generally accepted accounting principles in the United States (“GAAP”) including taxable equivalent net interest margin and pre-purchase accounting taxable equivalent net interest margin. These measures are important to investors interested in changes from period to period in net interest margin. For companies, such as Hilltop, business combinations can also result in purchase accounting adjustments (“PAA”). You should not view these disclosures as a substitute for results determined in accordance with GAAP, and these disclosures are not necessarily comparable to that of other companies that use non-GAAP measures. The following tables reconcile these non-GAAP financial measures to the most comparable GAAP financial measure, “net interest margin”. Reconciliation of Non-GAAP Pre-PAA Taxable Equivalent NIM (%) Q4 2017 Q1 2018 Q2 2018 Q3 2018 Q4 2018 NIM 3.57 3.52 3.46 3.48 3.75 Add: Taxable Equivalent Adjustment1 0.02 0.01 0.01 0.01 0.01 Non-GAAP Taxable Equivalent NIM 3.59 3.53 3.47 3.49 3.76 Less: Purchase Accounting Adjustment (0.43) (0.36) (0.29) (0.28) (0.43) Non-GAAP Pre-PAA Taxable Equivalent NIM 3.16 3.17 3.18 3.21 3.33 Note: (1) 2017 Annualized taxable equivalent adjustments are based on a 35% federal income tax rate; 2018 annualized taxable equivalent adjustment is based on a 21% federal income tax rate. • PlainsCapital Bank Reconciliation of Non-GAAP Pre-PAA Taxable Equivalent NIM (%) Q4 2017 Q4 2018 FY 2017 FY 2018 NIM 4.23 4.50 4.31 4.23 Add: Taxable Equivalent Adjustment1 0.01 0.01 0.02 0.01 Non-GAAP Taxable Equivalent NIM 4.24 4.51 4.33 4.24 Less: Purchase Accounting Adjustment (0.60) (0.61) (0.72) (0.48) Non-GAAP Pre-PAA Taxable Equivalent NIM 3.64 3.90 3.61 3.76 |
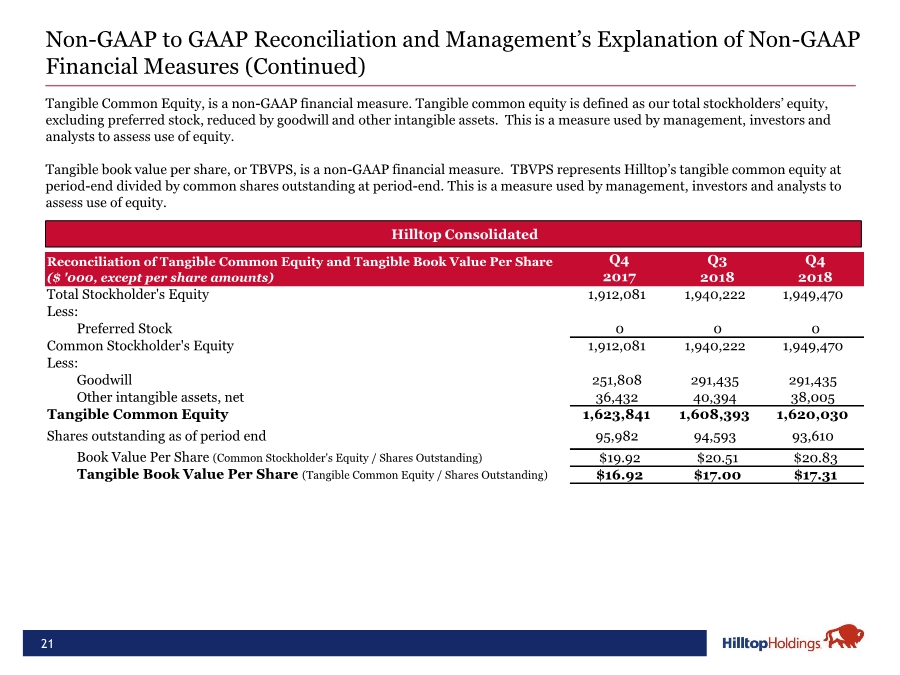
| 21 Non-GAAP to GAAP Reconciliation and Management’s Explanation of Non-GAAP Financial Measures (Continued) • Hilltop Consolidated Tangible Common Equity, is a non-GAAP financial measure. Tangible common equity is defined as our total stockholders’ equity, excluding preferred stock, reduced by goodwill and other intangible assets. This is a measure used by management, investors and analysts to assess use of equity. Tangible book value per share, or TBVPS, is a non-GAAP financial measure. TBVPS represents Hilltop’s tangible common equity at period-end divided by common shares outstanding at period-end. This is a measure used by management, investors and analysts to assess use of equity. Q4 2017 Total Stockholder's Equity 1,912,081 1,940,222 1,949,470 Less: Preferred Stock 0 0 0 Common Stockholder's Equity 1,912,081 1,940,222 1,949,470 Less: Goodwill 251,808 291,435 291,435 Other intangible assets, net 36,432 40,394 38,005 Tangible Common Equity 1,623,841 1,608,393 1,620,030 Shares outstanding as of period end 95,982 94,593 93,610 Book Value Per Share (Common Stockholder's Equity / Shares Outstanding) $19.92 $20.51 $20.83 Tangible Book Value Per Share (Tangible Common Equity / Shares Outstanding) $16.92 $17.00 $17.31 Q3 2018 Reconciliation of Tangible Common Equity and Tangible Book Value Per Share ($ '000, except per share amounts) Q4 2018 |