Attached files
| file | filename |
|---|---|
| 8-K - CHINA FUND INC | fp0038815_8k.htm |
Manager's Commentary
Market Review
The Greater China equity markets were among the weakest performers in Asia during December 2018, despite some signs of easing trade tensions between China and the United States. Concerns over a slowdown in domestic economic growth were reinforced by disappointing macro-economic data. The official purchasing managers' index of manufacturing activity fell below 50 in December, marking the lowest reading since February 2016. Industrial output also recorded its slowest pace of growth in 15 years in November 2018, adding to fears of a deepening slowdown. Compared to the weakness of China equities, Hong Kong and Taiwan stocks remained relatively more resilient.
On the sector level, Chinese healthcare names saw the worst performance, which was driven by worse than expected price cuts under the new national drug buying policy. Industrials and materials stocks, on the other hand, outperformed.
Fund Review
The China Fund Inc. (the “Fund”) slightly outperformed the benchmark in December 2018. Overall stock selection was positive which helped offset a negative sector allocation effect. In particular stock selection within consumer discretionary and industrials contributed.
At a stock level, the Fund's top contributor was its holding in Qingdao Port International Co., Ltd., which is a leading port operator in China. We expect the company to deliver strong recurring net-profit growth. Its upcoming initial public offering in the China A-Share market should help improve the balance sheet. A positive catalyst for the stock came from the expected dividend payout in 2019 which is anticipated to be around 10%. Another contributor was China Everbright International Ltd., the leading waste and water treatment company in China. As the industry leader, the company has been able to secure new project pipelines. Its fast project construction progress, healthy balance sheet and strong cash positions means that the company is well positioned to benefit from the rising demand to meet the increasingly stringent environmental requirements in China.
In contrast our overweight position in CSPC Pharmaceutical Group Ltd. hurt relative performance. As one of the major pharmaceutical providers in China, the company was not immune from the negative impact of the new group purchasing organization (GPO) under the new national policy, which aims to cut drug prices. While the key product of CSPC is still not included yet, cautious sentiment on the entire pharmaceutical sector could put continuous pressure on the share price.
Outlook
Looking forward, we are cautiously optimistic for the next financial year. Although the China equity markets have experienced a period of weakness, we expect that the country's long term growth drivers to remain in place. As a result of the market decline this year, the valuations of China equities are very reasonable compared to their historical levels. There are, however, a number of uncertain factors which cloud the short term outlook. These include the potential for a further slowdown in the Chinese economy, partly as a result of the trade dispute with the United States. We believe that a trade war is a ‘lose-lose' situation for both the United States and China, and therefore there will be a resolution. In the meantime, the impact may be to create some economic uncertainty. Our expectation is that we will see an increase in fiscal spending in the year ahead, combined with some monetary easing, which will help to mitigate the economic slowdown in China. In turn, this should lead to a recovery in corporate profits as we move through the year.
The portfolio strategy is to invest in a focused portfolio of stocks which we believe are undervalued relative to their growth prospects. As a result of the trade dispute, we are generally avoiding companies that rely on exports to the United States, and favor domestically-focused industries. The direction of government policy plays a more important role in determining growth prospects in China compared to most other Western economies. Accordingly, we aim to align the portfolio positioning with key areas which will benefit from the likely direction of policy. Another important theme is to invest in companies that can benefit from the growing consumption power of the increasingly affluent Chinese population.
| In Brief | |
| Fund Data | |
| Description | Seeks to achieve long-term capital appreciation through investments in China companies. |
| Listing Date (NYSE) | July 10, 1992 |
| Total Fund Assets (millions) | $294.5 |
| Median Market Cap (in billions) | $11.6 |
| Distribution Frequency | Annual |
| Management Firm | Allianz Global Investors U.S. LLC |
| Portfolio Management | Christina Chung, CFA, CMA Lead Portfolio Manager |
| Performance (US$ Returns) (as of 12/31/2018) | ||
| Fund | Benchmark1 | |
| One Month | -3.59% | -3.91% |
| Three Month | -10.48% | -10.28% |
| One Year | -17.62% | -14.56% |
| Three Year | 4.56% | 9.22% |
| Net Asset Value / Market Price | |
| Net Asset Value (NAV) /Market Price at Inception | $13.15 / $14.26 |
| NAV / Market Price (as of 12/31/2018) | $18.73 / $16.89 |
| High / Low Ranges (52-Week) | |
| High / Low NAV | $26.38 / $18.45 |
| High / Low Market Price | $24.70 / $16.45 |
|
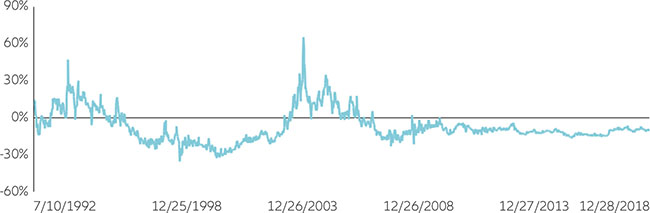
Premium/Discount to NAV (as of 12/31/2018) |
-9.82% |
| Fund Data (Common Shares) | |
| Shares Outstanding | 15,722,675 |
| Average Daily Volume | 26,200 |
| Expense Ratio | 1.91% |
Fund Manager

Christina Chung,
CFA, CMA
Lead Portfolio Manager
| 1. | MSCI Golden Dragon Index. |
Investment Products: NOT FDIC INSURED | MAY LOSE VALUE | NOT BANK GUARANTEED
1
Monthly Insights | As of 12/31/2018 | The China Fund, Inc.
New Investment Manager
Effective January 1, 2019, Matthews International Capital Management, LLC. became the Fund's Investment Manager.
Investment Objective
The investment objective of The China Fund, Inc. (the "Fund") is to achieve long-term capital appreciation. The Fund seeks to achieve its objective through investment in the equity securities of companies and other entities with significant assets, investments, production activities, trading or other business interests in China or which derive a significant part of their revenue from China.
The Fund has an operating policy that the Fund will invest at least 80% of its assets in China companies. For this purpose, ‘China companies' are (i) companies for which the principal securities trading market is in China; (ii) companies for which the principal securities trading market is outside of China or in companies organized outside of China, that in both cases derive at least 50% of their revenues from goods or services sold or produced, or have at least 50% of their assets in China; or (iii) companies organized in China. Under the policy, China means the People's Republic of China, including Hong Kong, and Taiwan. The Fund will provide its stockholders with at least 60 days' prior notice of any change to this policy.
Returns For Periods Ended December 31, 2018*
| 1 Month | 3 Month | YTD | 1 Year | 3 Year | 5 Year | 10 Year | Inception | |
| NAV | -3.59% | -10.48% | -17.62% | -17.62% | 4.56% | 3.09% | 9.90% | 9.54% |
| Market Price | -3.63% | -11.20% | -19.61% | -19.61% | 5.66% | 3.06% | 9.31% | 8.77% |
|
MSCI Golden Dragon Index |
-3.91% | -10.28% | -14.56% | -14.56% | 9.22% | 5.51% | 10.30% | — |
Calendar Year Returns
| 2011 | 2012 | 2013 | 2014 | 2015 | 2016 | 2017 | 2018 | |
| NAV | -24.37% | 12.12% | 18.31% | 7.82% | -5.51% | 0.60% | 37.92% | -17.62% |
| Market Price | -27.51% | 20.52% | 12.70% | 5.29% | -6.38% | -0.47% | 47.41% | -19.61% |
|
MSCI Golden Dragon Index |
-18.35% | 22.65% | 7.25% | 8.06% | -7.12% | 5.75% | 44.19% | -14.56% |
Past performance is not a guide to future returns.
* Annualized for periods greater than one year.
Source: State Street Bank and Trust Company. Source for index data: MSCI as at December 31, 2018. Investment returns are historical and do not guarantee future results. Investment returns reflect changes in net asset value and market price per share during each period and assumes that dividends and capital gains distributions, if any, were reinvested. The net asset value (NAV) percentages are not an indication of the performance of a shareholder's investment in the Fund, which is based on market price. NAV performance includes the deduction of management fees and other expenses. Market price performance does not include the deduction of brokerage commissions and other expenses of trading shares and would be lower had such commissions and expenses been deducted. It is not possible to invest directly in an index.
Premium/Discount
| Sector Allocation | ||
| Fund | Benchmark1 | |
| Financials | 24.48% | 24.26% |
| Consumer Discretionary | 14.09% | 14.41% |
| Information Technology | 12.85% | 14.34% |
| Communication Services | 12.14% | 17.29% |
| Real Estate | 7.47% | 8.52% |
| Industrials | 6.27% | 6.00% |
| Energy | 5.38% | 3.22% |
| Consumer Staples | 4.92% | 2.59% |
| Utilities | 4.07% | 4.00% |
| Materials | 1.44% | 3.50% |
| Health Care | 0.89% | 1.87% |
| Other assets & liabilities | 6.02% | 0.00% |
Source: IDS GmbH - Analysis and Reporting Services, a subsidiary of Allianz SE.
| Country Allocation | ||
| Fund | Benchmark1 | |
| China | 80.31% | 78.09% |
|
Hong Kong Red Chips |
16.41% | 8.95% |
| Hong Kong 'H' shares | 22.09% | 19.15% |
| Equity linked securities ('A' shares) | 0.00% | 0.00% |
| China 'A' & 'B' shares | 1.27% | 1.47% |
| Other Hong Kong securities | 40.54% | 33.54% |
| Others | 0.00% | 14.98% |
| Taiwan | 13.67% | 21.93% |
| Other assets & liabilities | 6.02% | 0.00% |
| Top 10 Holdings | |
| TAIWAN SEMIC CO LTD (Taiwan) | 8.81% |
| TENCENT HOLDINGS LTD (China) | 8.41% |
| ALIBABA GROUP HOLDING LTD (China) | 6.72% |
| CHINA CONSTRUCTION BANK CORP (China) | 6.14% |
| AIA GROUP LTD (H.K.) | 4.54% |
| PING AN INSURANCE (China) | 3.70% |
| CHINA EVERBRIGHT INTL (China) | 3.59% |
| HK EXCHANGES & CLEARING LTD (H.K.) | 3.40% |
| SUN HUNG KAI PROPERTIES LTD (H.K.) | 2.79% |
| PETROCHINA CO LTD (China) | 2.61% |
| Portfolio Characteristics | ||
| Fund | Benchmark1 | |
| P/E Ratio | 12.25 | 12.13 |
| P/B Ratio | 1.34 | 1.41 |
| Issues in Portfolio | 44 | 592 |
| Foreign Holdings (%) | 93.98 | 100.00 |
| Other assets & liabilities (%) | 6.02 | 0.00 |
| Yield (%) | 2.67 | 3.05 |
Source: IDS GmbH - Analysis and Reporting Services, a subsidiary of Allianz SE.
| 1. | MSCI Golden Dragon Index. |
Investment Products: NOT FDIC INSURED | MAY LOSE VALUE | NOT BANK GUARANTEED
2
Monthly Insights | As of 12/31/2018 | The China Fund, Inc.
Distribution History (10 Year)
| Declaration Date | Ex-dividend Date | Record Date | Payable Date | Distribution/ Share |
Income | Long-term Capital Gain |
Short-term Capital Gain |
| 12/8/2008 | 12/22/2008 | 12/24/2008 | 1/23/2009 | $5.81740 | $0.48130 | $5.33610 | — |
| 12/9/2009 | 12/22/2009 | 12/24/2009 | 12/29/2009 | $0.25570 | $0.25570 | — | — |
| 12/8/2010 | 12/21/2010 | 12/24/2010 | 12/29/2010 | $2.27420 | $0.37460 | $1.89960 | — |
| 12/8/2011 | 12/21/2011 | 12/23/2011 | 12/29/2011 | $2.99640 | $0.17420 | $2.82220 | — |
| 12/10/2012 | 12/20/2012 | 12/24/2012 | 12/28/2012 | $3.25170 | $0.34730 | $2.90440 | — |
| 12/13/2013 | 12/19/2013 | 12/23/2013 | 12/27/2013 | $3.31400 | $0.43870 | $2.87530 | — |
| 12/8/2014 | 12/18/2014 | 12/22/2014 | 1/5/2015 | $3.76510 | $0.29820 | $3.46690 | — |
| 12/16/2015 | 12/23/2015 | 12/28/2015 | 1/6/2016 | $1.49580 | $0.21330 | $0.84620 | $0.43630 |
| 12/9/2016 | 12/19/2016 | 12/21/2016 | 1/5/2017 | $0.46780 | $0.46780 | — | — |
| 12/8/2017 | 12/18/2017 | 12/19/2017 | 1/4/2018 | $0.54930 | $0.54930 | — | — |
| 12/10/2018 | 12/20/2018 | 12/21/2018 | 1/11/2019 | $0.54010 | $0.16890 | $0.37120 | — |
Distribution/Share includes Income, Long-term Capital gains and Short-term Capital gains.
The China Fund NAV Performance of $10,000 since inception
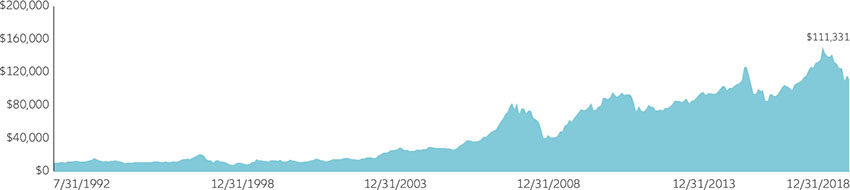
Past performance is not a guide to future returns.
Index Description
MSCI Golden Dragon Index
The MSCI Golden Dragon Index captures the equity market performance of large and mid cap China securities (H shares, B shares, Red-Chips and P-Chips) and non-domestic China securities listed in Hong Kong and Taiwan.
It is not possible to invest directly in an index.
Investment Products: NOT FDIC INSURED | MAY LOSE VALUE | NOT BANK GUARANTEED
3
Monthly Insights | As of 12/31/2018 | The China Fund, Inc.
| Portfolio in Full | |||||
| Sector | Company (exchange ticker) |
Market Price | Holding | Value US$ |
% of net assets |
| Financials | 24.48 | ||||
| CHINA CONSTRUCTION BANK CORP | 939 | 6.46 | 21,935,000 | 18,095,920 | 6.14 |
| AIA GROUP LTD | 1299 | 65.00 | 1,611,400 | 13,376,030 | 4.54 |
| PING AN INSURANCE GROUP CO OF CHINA LTD | 2318 | 69.15 | 1,235,000 | 10,906,104 | 3.70 |
| HONG KONG EXCHANGES & CLEARING LTD | 388 | 226.60 | 346,200 | 10,018,379 | 3.40 |
| CHINA MERCHANTS BANK CO LTD | 3968 | 28.70 | 1,870,500 | 6,855,673 | 2.33 |
| BOC HONG KONG HOLDINGS LTD | 2388 | 29.10 | 1,471,500 | 5,468,444 | 1.86 |
| FUBON FINANCIAL HOLDING CO LTD | 2881 | 47.05 | 2,805,000 | 4,293,693 | 1.46 |
| CATHAY FINANCIAL HOLDING CO LTD | 2882 | 47.00 | 2,030,000 | 3,104,077 | 1.05 |
| Consumer Discretionary | 14.07 | ||||
| ALIBABA GROUP HOLDING LTD | BABA | 137.07 | 144,501 | 19,806,752 | 6.72 |
| GALAXY ENTERTAINMENT GROUP LTD | 27 | 49.80 | 1,024,000 | 6,512,381 | 2.21 |
| SHANGRI-LA ASIA LTD | 69 | 11.60 | 3,110,000 | 4,607,113 | 1.56 |
| MGM CHINA HOLDINGS LTD | 2282 | 13.14 | 2,305,200 | 3,868,250 | 1.31 |
| QINGLING MOTORS CO LTD | 1122 | 2.01 | 14,816,000 | 3,803,098 | 1.29 |
| NEW ORIENTAL EDUCATION & TECHNOLOGY GROUP | EDU | 54.81 | 26,949 | 1,477,075 | 0.50 |
| BRILLIANCE CHINA AUTOMOTIVE HOLDINGS LTD | 1114 | 5.83 | 1,884,000 | 1,402,684 | 0.48 |
| Information Technology | 12.85 | ||||
| TAIWAN SEMICONDUCTOR MANUFACTURING CO LTD | 2330 | 225.50 | 3,536,000 | 25,941,634 | 8.81 |
| MEDIATEK INC | 2454 | 229.50 | 669,000 | 4,995,136 | 1.70 |
| DIGITAL CHINA HOLDINGS LTD | 861 | 3.62 | 9,305,000 | 4,301,654 | 1.46 |
| ASM PACIFIC TECHNOLOGY LTD | 522 | 75.45 | 144,200 | 1,389,425 | 0.47 |
| GOLDPAC GROUP LTD | 3315 | 1.91 | 4,970,000 | 1,212,273 | 0.41 |
| Communication Services | 12.14 | ||||
| TENCENT HOLDINGS LTD | 700 | 314.00 | 618,000 | 24,781,559 | 8.41 |
| CHINA MOBILE LTD | 941 | 75.35 | 510,000 | 4,907,541 | 1.67 |
| CHINA UNICOM HONG KONG LTD | 762 | 8.36 | 3,660,000 | 3,907,490 | 1.33 |
| BAIDU INC | BIDU | 158.60 | 13,605 | 2,157,753 | 0.73 |
| Real Estate | 7.46 | ||||
| SUN HUNG KAI PROPERTIES LTD | 16 | 111.60 | 576,000 | 8,209,131 | 2.79 |
| CHINA OVERSEAS LAND & INVESTMENT LTD | 688 | 26.90 | 1,622,000 | 5,572,032 | 1.89 |
| SWIRE PACIFIC LTD | 19 | 82.70 | 523,000 | 5,523,543 | 1.87 |
| COUNTRY GARDEN HOLDINGS CO LTD | 2007 | 9.53 | 2,208,000 | 2,687,215 | 0.91 |
| Industrials | 6.26 | ||||
| CHINA EVERBRIGHT INTERNATIONAL LTD | 257 | 7.02 | 11,811,221 | 10,588,694 | 3.59 |
| QINGDAO PORT INTERNATIONAL CO LTD | 6198 | 5.26 | 6,077,000 | 4,082,117 | 1.39 |
| KING SLIDE WORKS CO LTD | 2059 | 320.00 | 185,000 | 1,926,018 | 0.65 |
| CN STATE CONSTRUCTION INTERNATIONAL HOLDINGS LTD | 3311 | 6.22 | 2,340,000 | 1,858,732 | 0.63 |
| Energy | 5.38 | ||||
| PETROCHINA CO LTD | 857 | 4.88 | 12,336,000 | 7,687,846 | 2.61 |
| CHINA OILFIELD SERVICES LTD | 2883 | 6.73 | 4,770,000 | 4,099,623 | 1.39 |
| CHINA PETROLEUM & CHEMICAL CORP | 386 | 5.59 | 3,666,000 | 2,617,067 | 0.89 |
| CHINA SHENHUA ENERGY CO LTD | 1088 | 17.16 | 656,500 | 1,438,674 | 0.49 |
| Consumer Staples | 4.91 | ||||
| WH GROUP LTD | 288 | 6.03 | 5,331,500 | 4,105,606 | 1.39 |
| ANGEL YEAST CO LTD A | 600298 | 25.23 | 1,019,300 | 3,745,713 | 1.27 |
| CHINA MENGNIU DAIRY CO LTD | 2319 | 24.40 | 1,125,000 | 3,505,523 | 1.19 |
| VINDA INTERNATIONAL HOLDINGS LTD | 3331 | 12.32 | 1,984,000 | 3,121,497 | 1.06 |
| Utilities | 4.06 | ||||
| BEIJING ENTERPRISES HOLDINGS LTD | 392 | 41.50 | 1,229,000 | 6,513,441 | 2.21 |
| CHINA LONGYUAN POWER GROUP CORP LTD | 916 | 5.33 | 8,023,000 | 5,461,029 | 1.85 |
| Materials | 1.43 | ||||
| TIANGONG INTERNATIONAL CO LTD | 826 | 1.84 | 17,970,000 | 4,222,566 | 1.43 |
| Health Care | 0.89 | ||||
| CSPC PHARMACEUTICAL GROUP LTD | 1093 | 11.30 | 1,818,000 | 2,623,511 | 0.89 |
Investment Products: NOT FDIC INSURED | MAY LOSE VALUE | NOT BANK GUARANTEED
4
Monthly Insights | As of 12/31/2018 | The China Fund, Inc.
| Sector | Company (exchange ticker) |
Market Price | Holding | Value US$ |
% of net assets |
Source: State Street Bank and Trust Company, IDS GmbH - Analysis and Reporting Services, a subsidiary of Allianz SE.
Important Information:
Holdings are subject to change daily. The Fund seeks to achieve its objective through investment in the equity securities of companies and other entities with significant assets, investments, production activities, trading or other business interests in China or which derive a significant part of their revenue from China. Investing in non-U.S. securities entails additional risks, including political and economic risk and the risk of currency fluctuations, as well as lower liquidity. These risks, which can result in greater price volatility, will generally be enhanced in less diversified funds that concentrate investments in a particular geographic region.
The information contained herein has been obtained from sources believed to be reliable but Allianz Global Investors U.S. LLC and its affiliates do not warrant the information to be accurate, complete or reliable. The opinions expressed herein are subject to change at any time and without notice. Past performance is not indicative of future results. This material is not intended as an offer or solicitation for the purchase or sale of any financial instrument. Investors should consider the investment objectives, risks, charges and expenses of any mutual fund carefully before investing. This and other information is contained in the Fund's annual and semiannual reports, proxy statement and other Fund information, which may be obtained by contacting your financial advisor or visiting the Fund's website at Investment Products: NOT FDIC INSURED | MAY LOSE VALUE | NOT BANK GUARANTEED. This information is unaudited and is intended for informational purposes only. It is presented only to provide information on the Fund's holdings, performance and strategies. The Fund is a closed-end exchange traded management investment company. This material is presented only to provide information and is not intended for trading purposes. Closed-end funds, unlike open-end funds, are not continuously offered. After the initial public offering by a closed-end fund, its shares can be purchased and sold on the open market through a stock exchange, where shares may trade at a premium or a discount. The market price of holdings is subject to change daily.
P/E is a ratio of security price to earnings per share. Typically, an undervalued security is characterized by a low P/E ratio, while an overvalued security is characterized by a high P/E ratio. P/B is a ratio of the current stock price to the book value. This is used to identify undervalued stocks. Dividend yield is the annual percentage of return earned by an investor on a common or preferred stock. The average dividend yield is the dividend rate divided by current share price.
| ©2019 Allianz Global Investors Distributors LLC, 1633 Broadway, New York, NY | FS-CHN-1218 |
Investment Products: NOT FDIC INSURED | MAY LOSE VALUE | NOT BANK GUARANTEED