Attached files
| file | filename |
|---|---|
| EX-99.1 - EX-99.1 - PACWEST BANCORP | a19-3069_1ex99d1.htm |
| 8-K - 8-K - PACWEST BANCORP | a19-3069_18k.htm |
This communication contains certain forward-looking information about PacWest that is intended to be covered by the safe harbor for “forward-looking statements” provided by the Private Securities Litigation Reform Act of 1995. Such statements include future financial and operating results, expectations, intentions and other statements that are not historical facts. Such statements are based on information available at the time of the communication and are based on current beliefs and expectations of the Company’s management and are subject to significant risks, uncertainties and contingencies, many of which are beyond our control. Actual results may differ materially from those set forth or implied in the forward-looking statements due to a variety of factors, including the risk factors described in documents filed by the Company with the U.S. Securities and Exchange Commission. We are under no obligation (and expressly disclaim any such obligation) to update or alter our forward-looking statements, whether as a result of new information, future events or otherwise, except as required by law. Forward-Looking Statements
Fourth Quarter Highlights 4 Investment Securities 10 Loans and Leases 12 Credit Quality 17 Deposits 22 Controlled Expenses 25 Non-GAAP Measurements 28 Presentation Index
Fourth Quarter Highlights
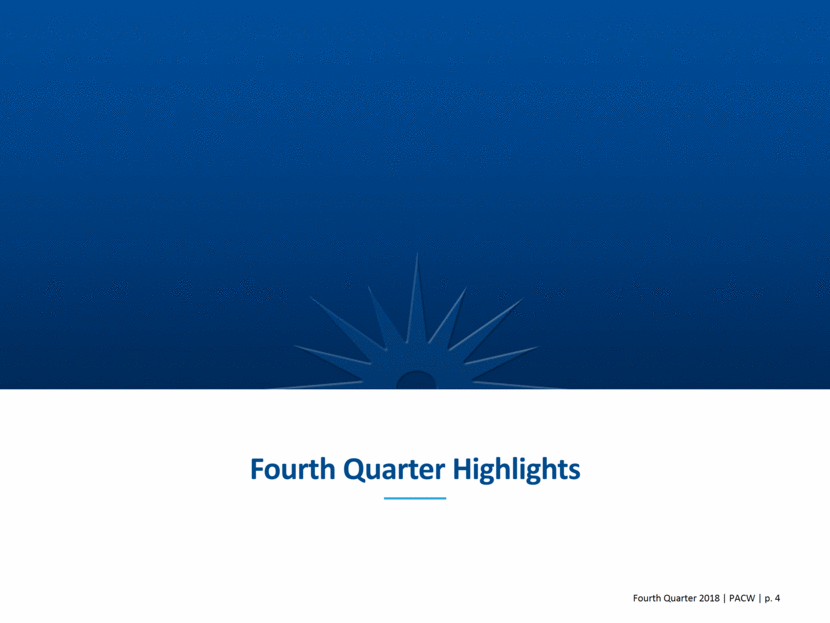
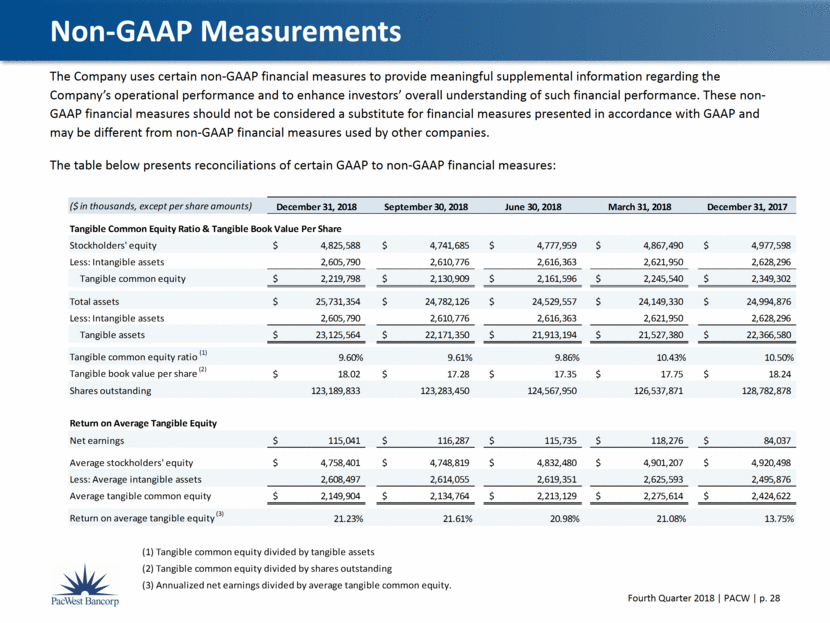
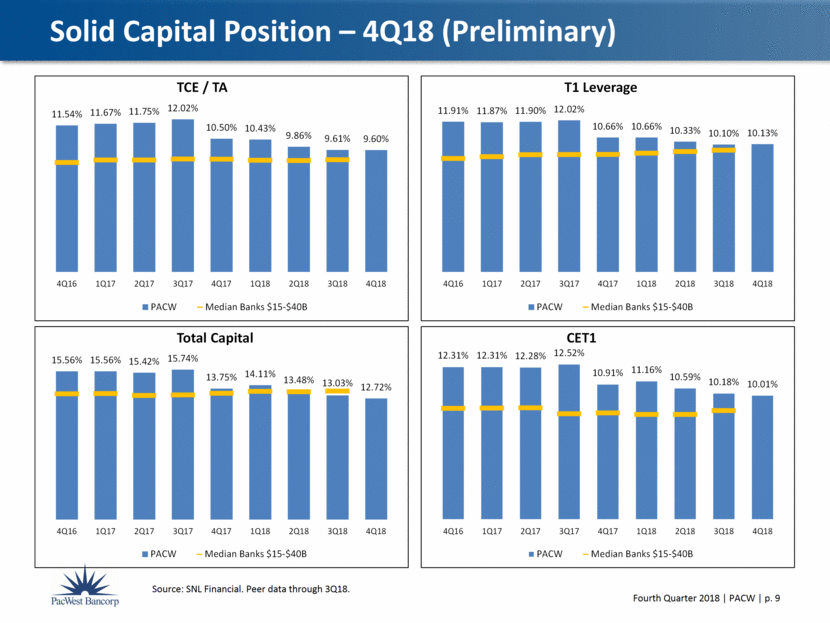
Fourth Quarter Highlights Robust Earnings Net earnings of $115.0 million EPS of $0.93 ROAA and ROATE of 1.84% and 21.23% (1) Industry Leading Net Interest Margin Tax equivalent NIM of 4.91%; 5.05% for full year 2018 Tax equivalent yield on average loans and leases of 6.27% Low Efficiency Ratio Efficiency ratio of 41.7% Average branch size of $252 million in deposits Noninterest expense to average assets of 2.07% Profitable Deposit Base Cost of average total deposits of 62bps Core deposits steady at 87% of total deposits $834 million of net core deposit growth Loan and Lease Production and Credit Quality Loan and lease production of $1.57 billion Net loan and lease growth of $728 million; full year loan growth of 5.8% NPAs to total loans and leases and foreclosed assets of 0.47%; 0.68% in Q3 Net charge-offs to average loans and leases of 0.46%; 0.26% for full year 2018 Net charge-offs 36% lower for full year 2018 compared to full year 2017 Strong Capital Levels Tangible common equity ratio of 9.60% (1) CET1 and total capital ratios of 10.01% and 12.72% See “Non-GAAP Measurements” slide on page 28.
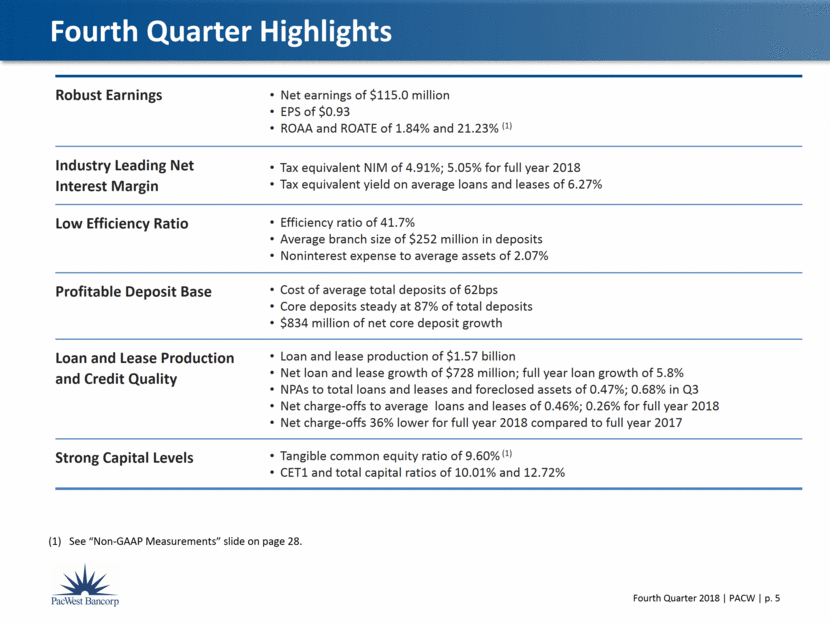
Quarterly Financial Highlights See “Non-GAAP Measurements” slide on page 28. ? ($ in millions, except per share amounts) 4Q18 3Q18 Q / Q Total Assets 25,731 $ 24,782 $ 4% Loans and Leases Held for Investment, net of deferred fees 17,958 $ 17,230 $ 4% Total Deposits 18,871 $ 17,880 $ 6% Core Deposits 16,347 $ 15,513 $ 5% Net Earnings 115.0 $ 116.3 $ -1% Earnings Per Share 0.93 $ 0.94 $ -1% Return on Average Assets ("ROAA") 1.84% 1.89% -0.05 Return on Average Tangible Equity ("ROATE") (1) 21.23% 21.61% -0.38 Tangible Common Equity Ratio (1) 9.60% 9.61% -0.01 Tangible Book Value Per Share (1) 18.02 $ 17.28 $ 4% Tax Equivalent Net Interest Margin 4.91% 4.99% -0.08 Efficiency Ratio 41.7% 40.9% 0.8
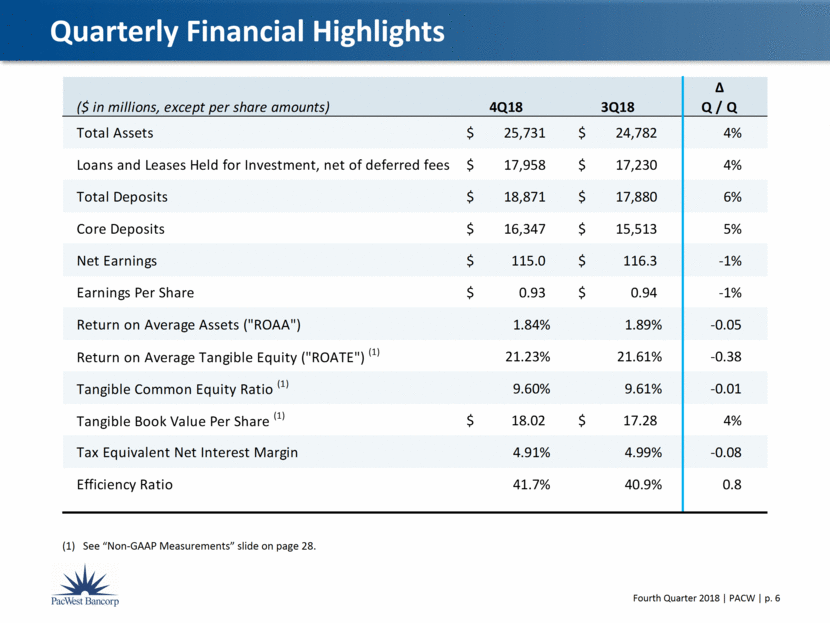
Year-Over-Year Financial Highlights See “Non-GAAP Measurements” slide on page 28. ? ($ in millions, except per share amounts) 2018 2017 Y / Y Total Assets 25,731 $ 24,995 $ 3% Loans and Leases Held for Investment, net of deferred fees 17,958 $ 16,973 $ 6% Total Deposits 18,871 $ 18,866 $ 0% Core Deposits 16,347 $ 15,937 $ 3% Net Earnings 465.3 $ 357.8 $ 30% Earnings Per Share 3.72 $ 2.91 $ 28% Return on Average Assets ("ROAA") 1.91% 1.58% 0.33 Return on Average Tangible Equity ("ROATE") (1) 21.22% 15.15% 6.07 Tangible Common Equity Ratio (1) 9.60% 10.50% -0.90 Tangible Book Value Per Share (1) 18.02 $ 18.24 $ -1% Tax Equivalent Net Interest Margin 5.05% 5.10% -0.05 Efficiency Ratio 41.0% 40.8% 0.2
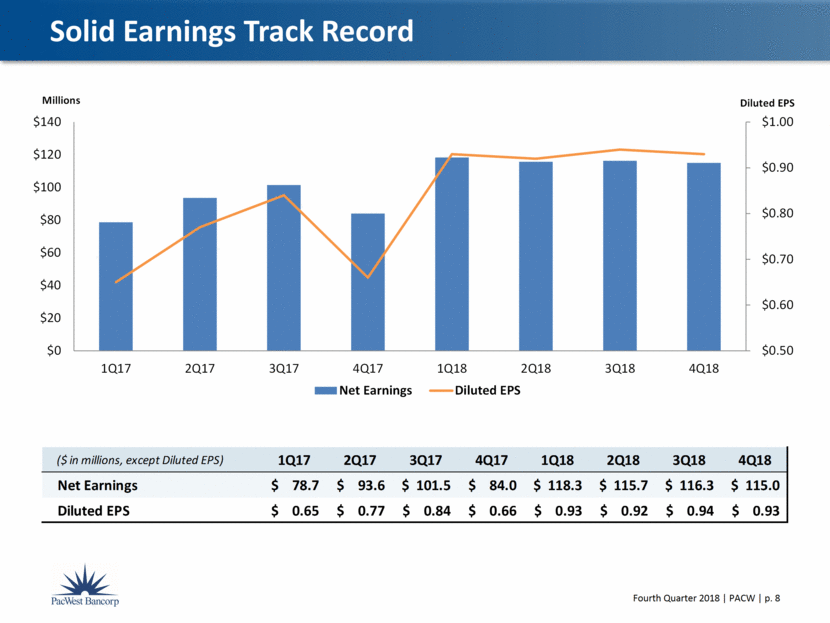
Solid Earnings Track Record ($ in millions, except Diluted EPS) 1Q17 2Q17 3Q17 4Q17 1Q18 2Q18 3Q18 4Q18 Net Earnings 78.7 $ 93.6 $ 101.5 $ 84.0 $ 118.3 $ 115.7 $ 116.3 $ 115.0 $ Diluted EPS 0.65 $ 0.77 $ 0.84 $ 0.66 $ 0.93 $ 0.92 $ 0.94 $ 0.93 $ $0.50 $0.60 $0.70 $0.80 $0.90 $1.00 $0 $20 $40 $60 $80 $100 $120 $140 1Q17 2Q17 3Q17 4Q17 1Q18 2Q18 3Q18 4Q18 Diluted EPS Millions Net Earnings Diluted EPS
Source: SNL Financial. Peer data through 3Q18. Solid Capital Position – 4Q18 (Preliminary) 11.54% 11.67% 11.75% 12.02% 10.50% 10.43% 9.86% 9.61% 9.60% 4Q16 1Q17 2Q17 3Q17 4Q17 1Q18 2Q18 3Q18 4Q18 TCE / TA PACW Median Banks $15-$40B 11.91% 11.87% 11.90% 12.02% 10.66% 10.66% 10.33% 10.10% 10.13% 4Q16 1Q17 2Q17 3Q17 4Q17 1Q18 2Q18 3Q18 4Q18 T1 Leverage PACW Median Banks $15-$40B 15.56% 15.56% 15.42% 15.74% 13.75% 14.11% 13.48% 13.03% 12.72% 4Q16 1Q17 2Q17 3Q17 4Q17 1Q18 2Q18 3Q18 4Q18 Total Capital PACW Median Banks $15-$40B 12.31% 12.31% 12.28% 12.52% 10.91% 11.16% 10.59% 10.18% 10.01% 4Q16 1Q17 2Q17 3Q17 4Q17 1Q18 2Q18 3Q18 4Q18 CET1 PACW Median Banks $15-$40B
Investment Securities

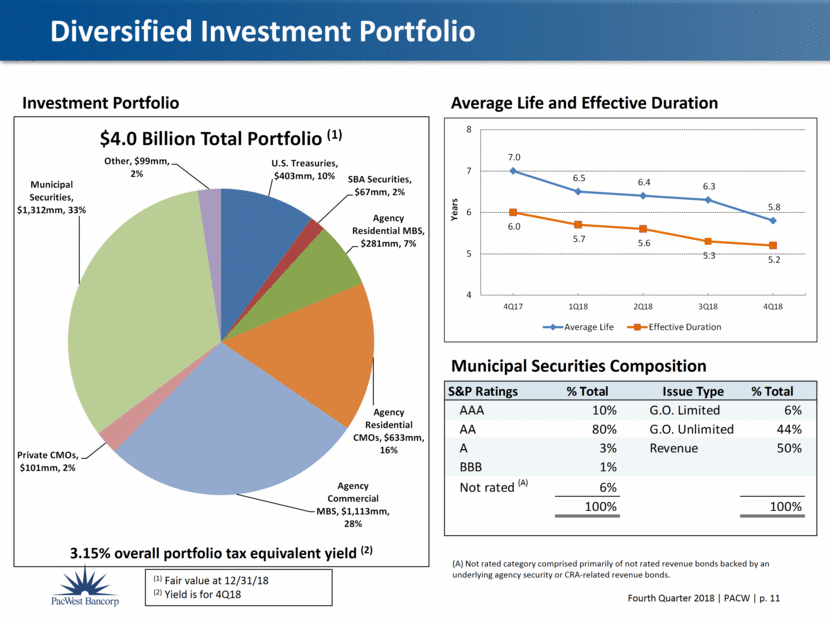
3.15% overall portfolio tax equivalent yield (2) (1) Fair value at 12/31/18 (2) Yield is for 4Q18 Investment Portfolio Average Life and Effective Duration Municipal Securities Composition Diversified Investment Portfolio (A) Not rated category comprised primarily of not rated revenue bonds backed by an underlying agency security or CRA-related revenue bonds. 7.0 6.5 6.4 6.3 5.8 6.0 5.7 5.6 5.3 5.2 4 5 6 7 8 4Q17 1Q18 2Q18 3Q18 4Q18 Years Average Life Effective Duration U.S. Treasuries, $403mm, 10% SBA Securities, $67mm, 2% Agency Residential MBS, $281mm, 7% Agency Residential CMOs, $633mm, 16% Agency Commercial MBS, $1,113mm, 28% Private CMOs, $101mm, 2% Municipal Securities, $1,312mm, 33% Other, $99mm, 2% $4.0 Billion Total Portfolio (1) S&P Ratings % Total Issue Type % Total AAA 10% G.O. Limited 6% AA 80% G.O. Unlimited 44% A 3% Revenue 50% BBB 1% Not rated (A) 6% 100% 100%
Loans and Leases
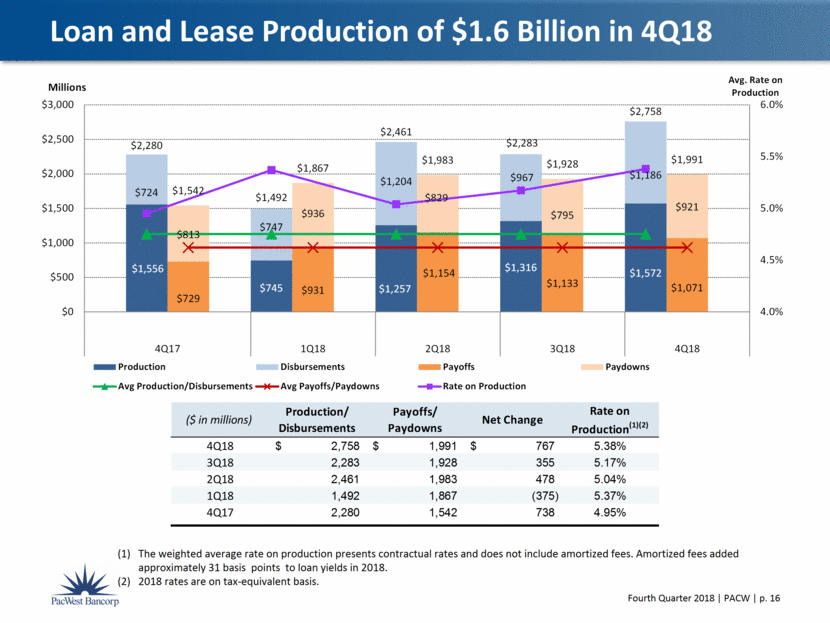
Diversified Loan and Lease Portfolio ($ in millions) $ Mix $ Mix Real Estate Mortgage: Commercial 4,824 $ 27% 5,386 $ 32% Residential 3,094 17% 2,467 14% Total Real Estate Mortgage 7,918 44% 7,853 46% RE Construction & Land: Commercial 913 5% 769 5% Residential 1,321 8% 822 5% Total RE Construction & Land 2,234 13% 1,591 10% Total Real Estate 10,152 57% 9,444 56% Commercial: Asset-based 3,305 18% 2,925 17% Venture capital 2,039 11% 2,123 13% Other commercial 2,061 12% 2,071 12% Total Commercial 7,405 41% 7,119 42% Consumer 401 2% 410 2% Total Loans HFI (1) 17,958 $ 100% 16,973 $ 100% Unfunded commitments 7,528 $ 6,234 $ (1) Net of deferred fees and costs 12/31/2018 12/31/2017 Commercial Mortgage Residential Mortgage Commercial Construction Residential Construction Asset - based Venture capital Other commercial Consumer As of December 31, 2018
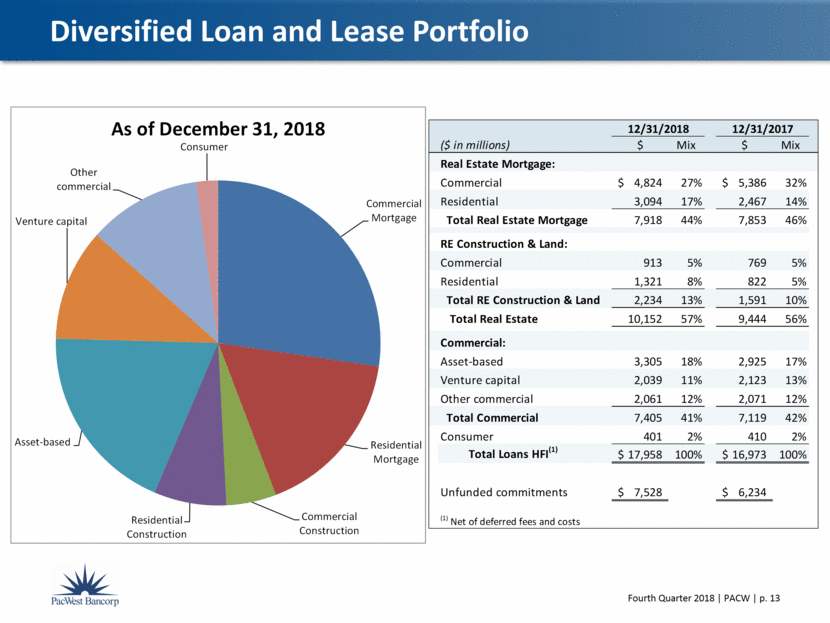
Diversified Loan and Lease Portfolio Other Commercial, $3,238mm, 32% Hospitality, $575mm, 6% SBA, $559mm, 6% Income Producing Residential, $2,971mm, 29% Healthcare, $452mm, 4% Other Residential, $123mm, 1% Construction & Land, $2,234mm, 22% Real Estate ($10.2B) Lender Finance & Timeshare, $1,781mm, 54% Equipment Finance, $734mm, 22% Premium Finance, $356mm, 11% Other, $434mm, 13% Asset - Based ($3.3B) ($ in millions) $ Mix $ Mix Asset-Based: Lender Finance & Timeshare 1,781 $ 54% 1,610 $ 55% Equipment Finance 734 22% 657 22% Premium Finance 356 11% 233 8% Other 434 13% 425 15% Total Asset-Based 3,305 $ 100% 2,925 $ 100% 12/31/2018 12/31/2017 ($ in millions) $ Mix $ Mix Real Estate: Other Commercial 3,238 $ 32% 3,295 $ 35% Income Producing Residential 2,971 29% 2,245 25% Construction & Land 2,234 22% 1,591 17% Hospitality 575 6% 695 7% SBA 559 6% 485 5% Healthcare 452 4% 844 9% Other Residential 123 $ 1% 222 $ 2% Total Real Estate 10,152 $ 100% 9,444 $ 100% 12/31/2018 12/31/2017
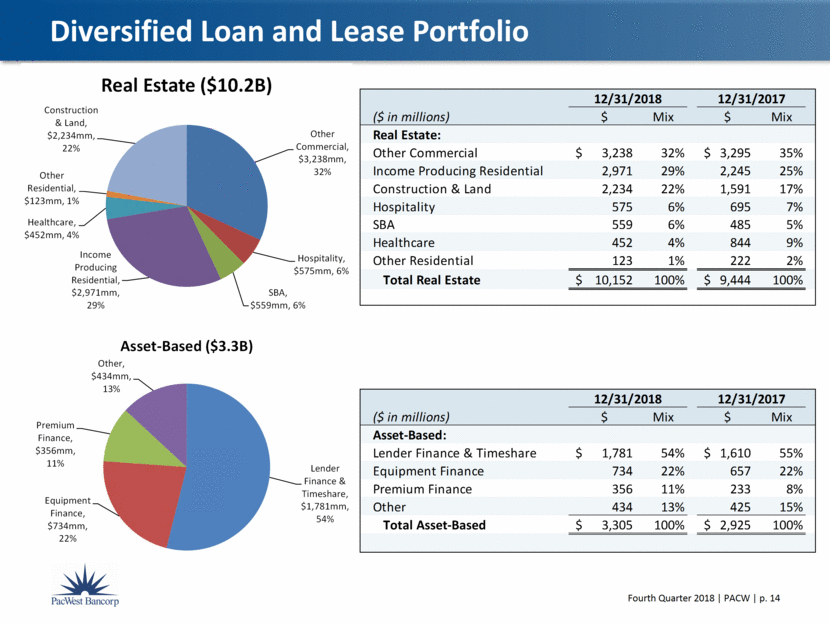
Diversified Loan and Lease Portfolio Secured Business Loans, $788mm, 38% Municipal, $121mm, 6% Cash Flow, $114mm, 6% SBA, $84mm, 4% Security Monitoring, $643mm, 31% HOA Loans, $68mm, 3% Unsecured Business Loans, $243mm, 12% Other Commercial ($2.1B) Expansion Stage, $908mm, 45% Equity Fund Loans, $798mm, 39% Early Stage, $225mm, 11% Late Stage, $108mm, 5% Venture Capital ($2.0B) ($ in millions) $ Mix $ Mix Other Commercial: Secured Business Loans 788 $ 38% 744 $ 36% Security Monitoring 643 31% 573 28% Unsecured Business Loans 243 12% 249 12% Municipal 121 6% 67 3% Cash Flow 114 6% 279 13% SBA 84 4% 95 5% HOA Loans 68 3% 64 3% Total Other Commercial 2,061 $ 100% 2,071 $ 100% 12/31/2018 12/31/2017 ($ in millions) $ Mix $ Mix Venture Capital: Expansion Stage 908 $ 45% 953 $ 45% Equity Fund Loans 798 39% 471 22% Early Stage 225 11% 444 21% Late Stage 108 5% 255 12% Total Venture Capital 2,039 $ 100% 2,123 $ 100% 12/31/2018 12/31/2017
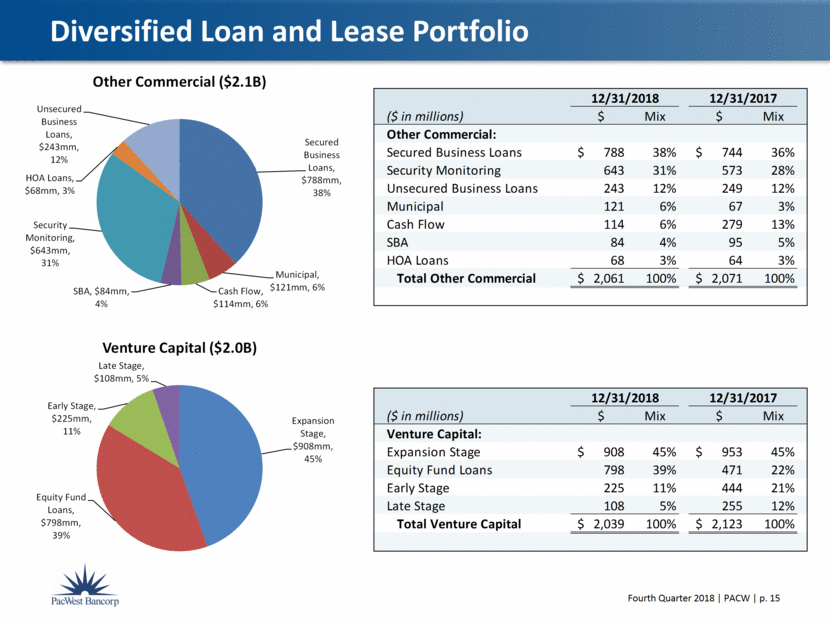
Loan and Lease Production of $1.6 Billion in 4Q18 The weighted average rate on production presents contractual rates and does not include amortized fees. Amortized fees added approximately 31 basis points to loan yields in 2018. 2018 rates are on tax-equivalent basis. $1,556 $745 $1,257 $1,316 $1,572 $724 $747 $1,204 $967 $1,186 $729 $931 $1,154 $1,133 $1,071 $813 $936 $829 $795 $921 $2,280 $1,492 $2,461 $2,283 $2,758 $1,542 $1,867 $1,983 $1,928 $1,991 4.0% 4.5% 5.0% 5.5% 6.0% $0 $500 $1,000 $1,500 $2,000 $2,500 $3,000 4Q17 1Q18 2Q18 3Q18 4Q18 Avg. Rate on Production Millions Production Disbursements Payoffs Paydowns Avg Production/Disbursements Avg Payoffs/Paydowns Rate on Production ($ in millions) Production/ Disbursements Payoffs/ Paydowns Net Change Rate on Production (1)(2) 4Q18 2,758 $ 1,991 $ 767 $ 5.38% 3Q18 2,283 1,928 355 5.17% 2Q18 2,461 1,983 478 5.04% 1Q18 1,492 1,867 (375) 5.37% 4Q17 2,280 1,542 738 4.95%
Credit Quality
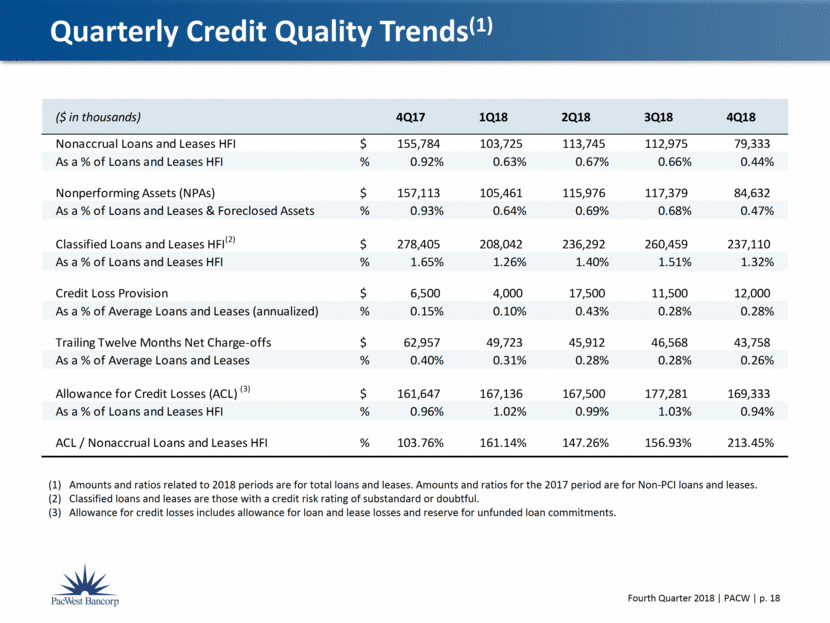
Amounts and ratios related to 2018 periods are for total loans and leases. Amounts and ratios for the 2017 period are for Non-PCI loans and leases. Classified loans and leases are those with a credit risk rating of substandard or doubtful. Allowance for credit losses includes allowance for loan and lease losses and reserve for unfunded loan commitments. Quarterly Credit Quality Trends(1) ($ in thousands) 4Q17 1Q18 2Q18 3Q18 4Q18 Nonaccrual Loans and Leases HFI $ 155,784 103,725 113,745 112,975 79,333 As a % of Loans and Leases HFI % 0.92% 0.63% 0.67% 0.66% 0.44% Nonperforming Assets (NPAs) $ 157,113 105,461 115,976 117,379 84,632 As a % of Loans and Leases & Foreclosed Assets % 0.93% 0.64% 0.69% 0.68% 0.47% Classified Loans and Leases HFI (2) $ 278,405 208,042 236,292 260,459 237,110 As a % of Loans and Leases HFI % 1.65% 1.26% 1.40% 1.51% 1.32% Credit Loss Provision $ 6,500 4,000 17,500 11,500 12,000 As a % of Average Loans and Leases (annualized) % 0.15% 0.10% 0.43% 0.28% 0.28% Trailing Twelve Months Net Charge-offs $ 62,957 49,723 45,912 46,568 43,758 As a % of Average Loans and Leases % 0.40% 0.31% 0.28% 0.28% 0.26% Allowance for Credit Losses (ACL) (3) $ 161,647 167,136 167,500 177,281 169,333 As a % of Loans and Leases HFI % 0.96% 1.02% 0.99% 1.03% 0.94% ACL / Nonaccrual Loans and Leases HFI % 103.76% 161.14% 147.26% 156.93% 213.45%
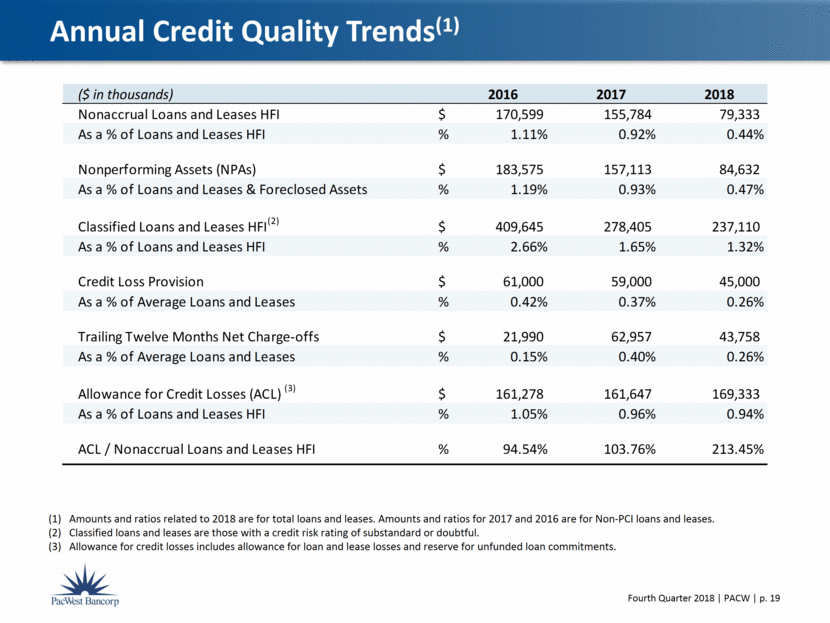
Amounts and ratios related to 2018 are for total loans and leases. Amounts and ratios for 2017 and 2016 are for Non-PCI loans and leases. Classified loans and leases are those with a credit risk rating of substandard or doubtful. Allowance for credit losses includes allowance for loan and lease losses and reserve for unfunded loan commitments. Annual Credit Quality Trends(1) ($ in thousands) 2016 2017 2018 Nonaccrual Loans and Leases HFI $ 170,599 155,784 79,333 As a % of Loans and Leases HFI % 1.11% 0.92% 0.44% Nonperforming Assets (NPAs) $ 183,575 157,113 84,632 As a % of Loans and Leases & Foreclosed Assets % 1.19% 0.93% 0.47% Classified Loans and Leases HFI (2) $ 409,645 278,405 237,110 As a % of Loans and Leases HFI % 2.66% 1.65% 1.32% Credit Loss Provision $ 61,000 59,000 45,000 As a % of Average Loans and Leases % 0.42% 0.37% 0.26% Trailing Twelve Months Net Charge-offs $ 21,990 62,957 43,758 As a % of Average Loans and Leases % 0.15% 0.40% 0.26% Allowance for Credit Losses (ACL) (3) $ 161,278 161,647 169,333 As a % of Loans and Leases HFI % 1.05% 0.96% 0.94% ACL / Nonaccrual Loans and Leases HFI % 94.54% 103.76% 213.45%
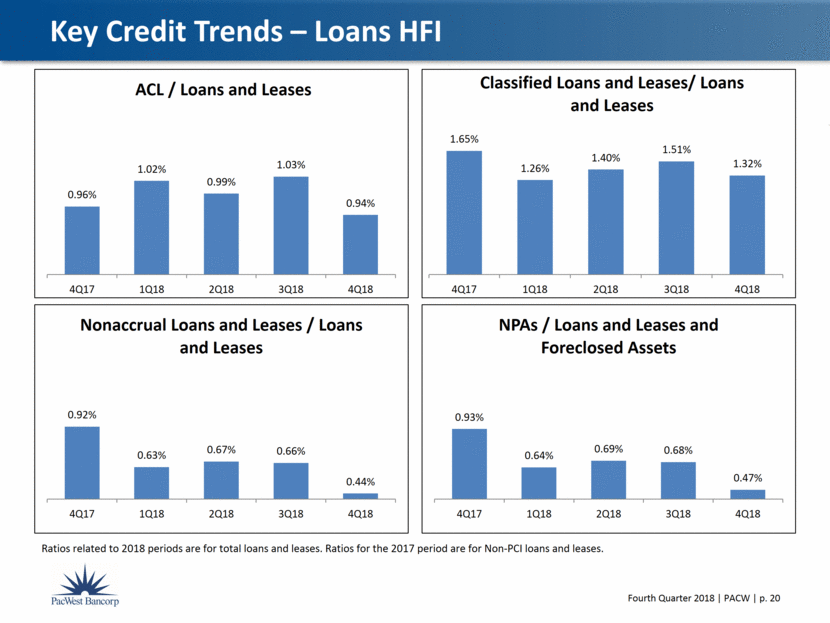
Key Credit Trends – Loans HFI Ratios related to 2018 periods are for total loans and leases. Ratios for the 2017 period are for Non-PCI loans and leases. 0.96% 1.02% 0.99% 1.03% 0.94% 4Q17 1Q18 2Q18 3Q18 4Q18 ACL / Loans and Leases 1.65% 1.26% 1.40% 1.51% 1.32% 4Q17 1Q18 2Q18 3Q18 4Q18 Classified Loans and Leases/ Loans and Leases 0.92% 0.63% 0.67% 0.66% 0.44% 4Q17 1Q18 2Q18 3Q18 4Q18 Nonaccrual Loans and Leases / Loans and Leases 0.93% 0.64% 0.69% 0.68% 0.47% 4Q17 1Q18 2Q18 3Q18 4Q18 NPAs / Loans and Leases and Foreclosed Assets
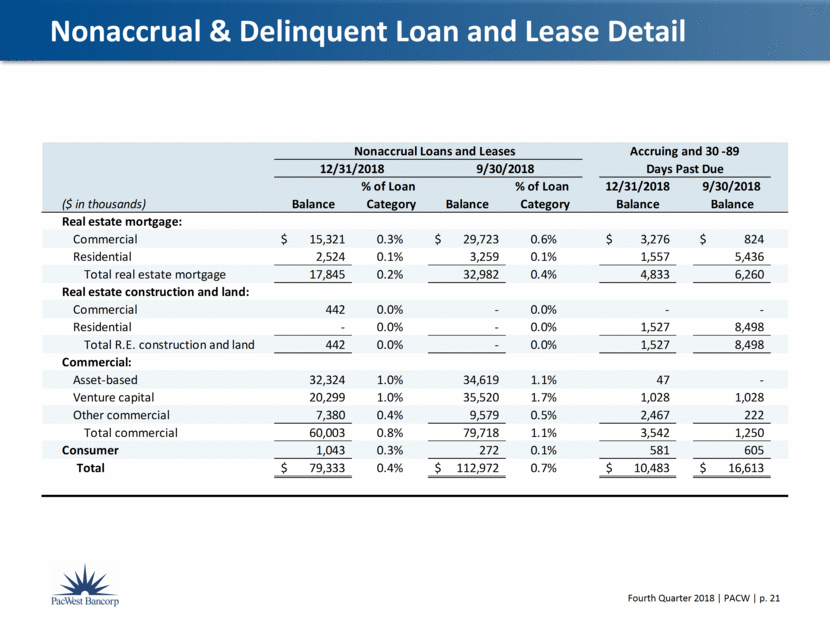
Nonaccrual & Delinquent Loan and Lease Detail % of Loan % of Loan 12/31/2018 9/30/2018 ($ in thousands) Balance Category Balance Category Balance Balance Real estate mortgage: Commercial 15,321 $ 0.3% 29,723 $ 0.6% 3,276 $ 824 $ Residential 2,524 0.1% 3,259 0.1% 1,557 5,436 Total real estate mortgage 17,845 0.2% 32,982 0.4% 4,833 6,260 Real estate construction and land: Commercial 442 0.0% - 0.0% - - Residential - 0.0% - 0.0% 1,527 8,498 Total R.E. construction and land 442 0.0% - 0.0% 1,527 8,498 Commercial: Asset-based 32,324 1.0% 34,619 1.1% 47 - Venture capital 20,299 1.0% 35,520 1.7% 1,028 1,028 Other commercial 7,380 0.4% 9,579 0.5% 2,467 222 Total commercial 60,003 0.8% 79,718 1.1% 3,542 1,250 Consumer 1,043 0.3% 272 0.1% 581 605 Total 79,333 $ 0.4% 112,972 $ 0.7% 10,483 $ 16,613 $ 12/31/2018 Nonaccrual Loans and Leases 9/30/2018 Accruing and 30 -89 Days Past Due
Deposits

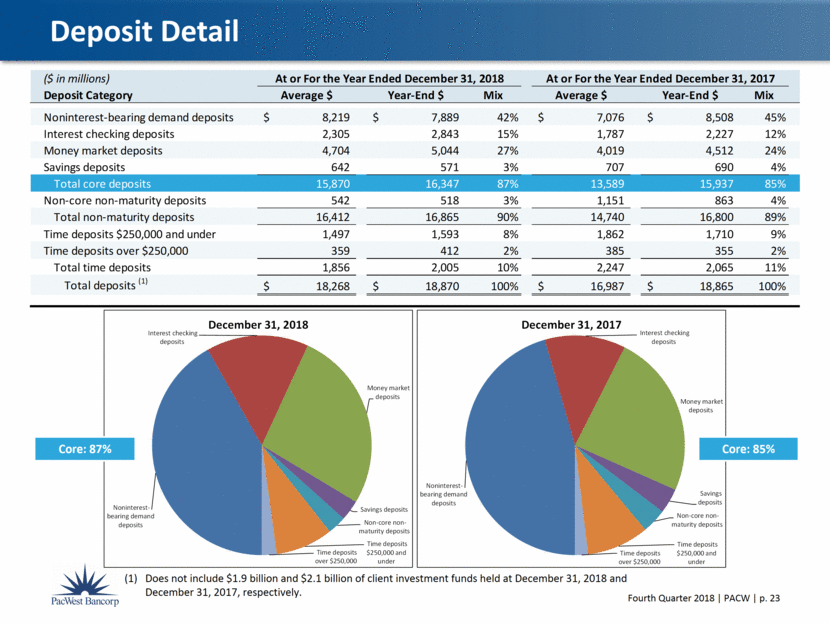
Does not include $1.9 billion and $2.1 billion of client investment funds held at December 31, 2018 and December 31, 2017, respectively. Deposit Detail Core: 87% Core: 85% Noninterest - bearing demand deposits Interest checking deposits Money market deposits Savings deposits Non - core non - maturity deposits Time deposits $250,000 and under Time deposits over $250,000 December 31, 2018 Noninterest - bearing demand deposits Interest checking deposits Money market deposits Savings deposits Non - core non - maturity deposits Time deposits $250,000 and under Time deposits over $250,000 December 31, 2017 ($ in millions) Deposit Category Average $ Year-End $ Mix Average $ Year-End $ Mix Noninterest-bearing demand deposits 8,219 $ 7,889 $ 42% 7,076 $ 8,508 $ 45% Interest checking deposits 2,305 2,843 15% 1,787 2,227 12% Money market deposits 4,704 5,044 27% 4,019 4,512 24% Savings deposits 642 571 3% 707 690 4% Total core deposits 15,870 16,347 87% 13,589 15,937 85% Non-core non-maturity deposits 542 518 3% 1,151 863 4% Total non-maturity deposits 16,412 16,865 90% 14,740 16,800 89% Time deposits $250,000 and under 1,497 1,593 8% 1,862 1,710 9% Time deposits over $250,000 359 412 2% 385 355 2% Total time deposits 1,856 2,005 10% 2,247 2,065 11% Total deposits (1) 18,268 $ 18,870 $ 100% 16,987 $ 18,865 $ 100% At or For the Year Ended December 31, 2018 At or For the Year Ended December 31, 2017
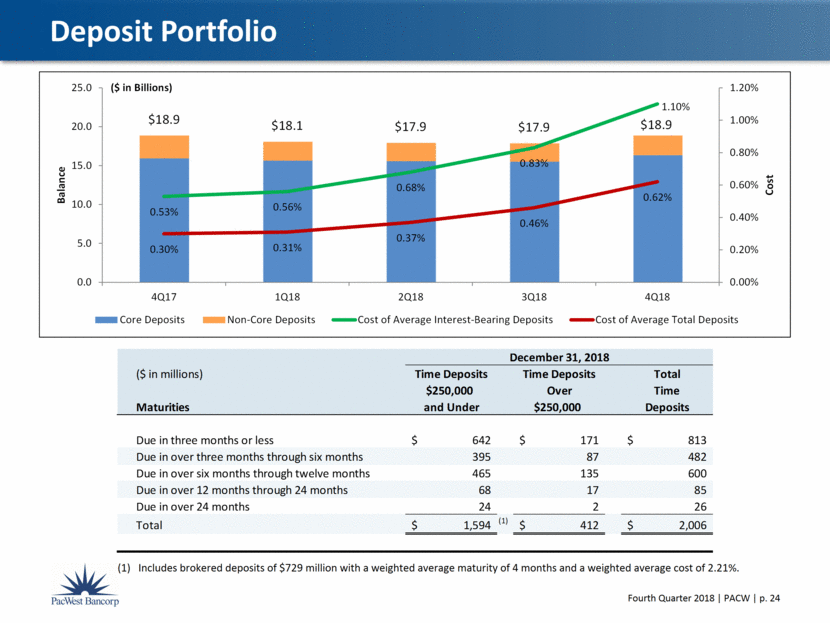
Deposit Portfolio Includes brokered deposits of $729 million with a weighted average maturity of 4 months and a weighted average cost of 2.21%. $18.9 $18.1 $17.9 $17.9 $18.9 0.53% 0.56% 0.68% 0.83% 1.10% 0.30% 0.31% 0.37% 0.46% 0.62% 0.00% 0.20% 0.40% 0.60% 0.80% 1.00% 1.20% 0.0 5.0 10.0 15.0 20.0 25.0 4Q17 1Q18 2Q18 3Q18 4Q18 Cost Balance ($ in Billions) Core Deposits Non-Core Deposits Cost of Average Interest-Bearing Deposits Cost of Average Total Deposits ($ in millions) Time Deposits Time Deposits Total $250,000 Over Time Maturities and Under $250,000 Deposits Due in three months or less 642 $ 171 $ 813 $ Due in over three months through six months 395 87 482 Due in over six months through twelve months 465 135 600 Due in over 12 months through 24 months 68 17 85 Due in over 24 months 24 2 26 Total 1,594 $ (1) 412 $ 2,006 $ December 31, 2018
Controlled Expenses
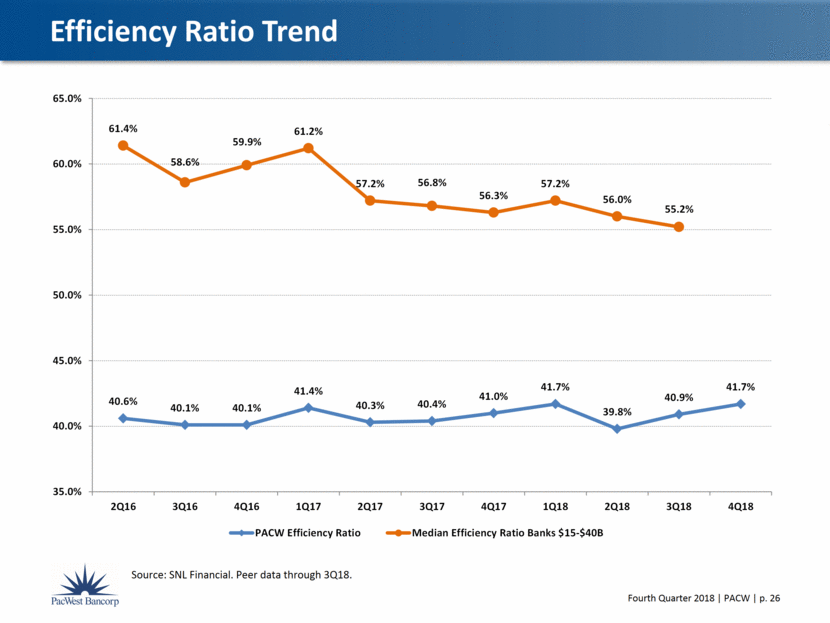
Source: SNL Financial. Peer data through 3Q18. Efficiency Ratio Trend 40.6% 40.1% 40.1% 41.4% 40.3% 40.4% 41.0% 41.7% 39.8% 40.9% 41.7% 61.4% 58.6% 59.9% 61.2% 57.2% 56.8% 56.3% 57.2% 56.0% 55.2% 35.0% 40.0% 45.0% 50.0% 55.0% 60.0% 65.0% 2Q16 3Q16 4Q16 1Q17 2Q17 3Q17 4Q17 1Q18 2Q18 3Q18 4Q18 PACW Efficiency Ratio Median Efficiency Ratio Banks $15-$40B
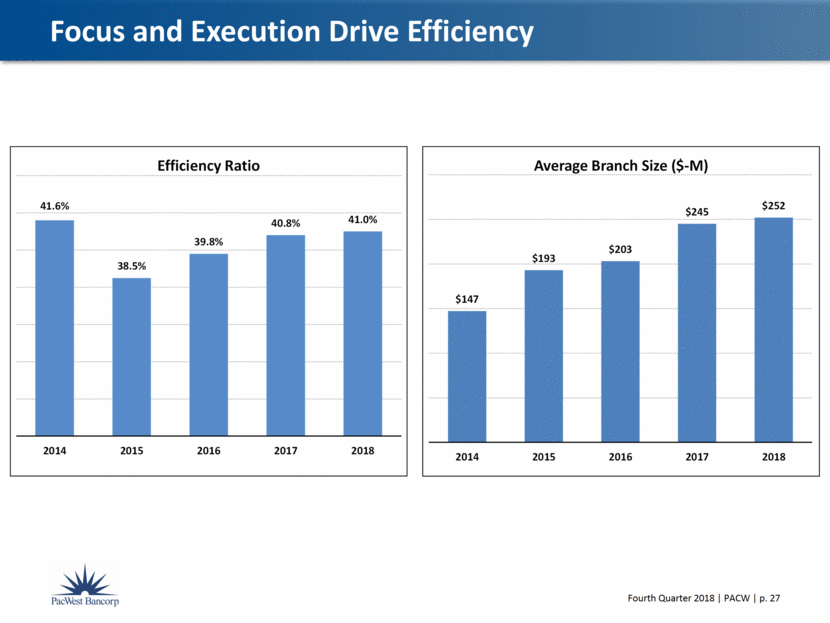
Focus and Execution Drive Efficiency 41.6% 38.5% 39.8% 40.8% 41.0% 2014 2015 2016 2017 2018 Efficiency Ratio $147 $193 $203 $245 $252 2014 2015 2016 2017 2018 Average Branch Size ($ - M)
The Company uses certain non-GAAP financial measures to provide meaningful supplemental information regarding the Company’s operational performance and to enhance investors’ overall understanding of such financial performance. These non-GAAP financial measures should not be considered a substitute for financial measures presented in accordance with GAAP and may be different from non-GAAP financial measures used by other companies. The table below presents reconciliations of certain GAAP to non-GAAP financial measures: Non-GAAP Measurements ($ in thousands, except per share amounts) December 31, 2018 September 30, 2018 June 30, 2018 March 31, 2018 December 31, 2017 Tangible Common Equity Ratio & Tangible Book Value Per Share Stockholders' equity 4,825,588 $ 4,741,685 $ 4,777,959 $ 4,867,490 $ 4,977,598 $ Less: Intangible assets 2,605,790 2,610,776 2,616,363 2,621,950 2,628,296 Tangible common equity 2,219,798 $ 2,130,909 $ 2,161,596 $ 2,245,540 $ 2,349,302 $ Total assets 25,731,354 $ 24,782,126 $ 24,529,557 $ 24,149,330 $ 24,994,876 $ Less: Intangible assets 2,605,790 2,610,776 2,616,363 2,621,950 2,628,296 Tangible assets 23,125,564 $ 22,171,350 $ 21,913,194 $ 21,527,380 $ 22,366,580 $ Tangible common equity ratio (1) 9.60% 9.61% 9.86% 10.43% 10.50% Tangible book value per share (2) 18.02 $ 17.28 $ 17.35 $ 17.75 $ 18.24 $ Shares outstanding 123,189,833 123,283,450 124,567,950 126,537,871 128,782,878 Return on Average Tangible Equity Net earnings 115,041 $ 116,287 $ 115,735 $ 118,276 $ 84,037 $ Average stockholders' equity 4,758,401 $ 4,748,819 $ 4,832,480 $ 4,901,207 $ 4,920,498 $ Less: Average intangible assets 2,608,497 2,614,055 2,619,351 2,625,593 2,495,876 Average tangible common equity 2,149,904 $ 2,134,764 $ 2,213,129 $ 2,275,614 $ 2,424,622 $ Return on average tangible equity (3) 21.23% 21.61% 20.98% 21.08% 13.75% (1) Tangible common equity divided by tangible assets (2) Tangible common equity divided by shares outstanding (3) Annualized net earnings divided by average tangible common equity.
