Attached files
| file | filename |
|---|---|
| EX-99.1 - EX-99.1 - GOLDMAN SACHS GROUP INC | d683103dex991.htm |
| 8-K - FORM 8-K - GOLDMAN SACHS GROUP INC | d683103d8k.htm |
Exhibit 99.2
Full Year and Fourth Quarter 2018 Earnings Results Presentation January 16, 2019
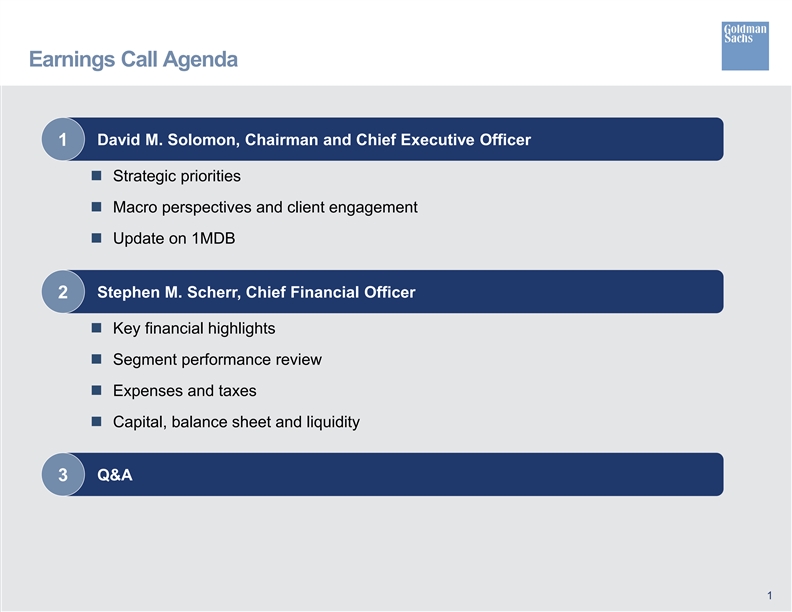
Earnings Call Agenda Strategic priorities Macro perspectives and client engagement Update on 1MDB David M. Solomon, Chairman and Chief Executive Officer 1 Stephen M. Scherr, Chief Financial Officer 2 Q&A 3 Key financial highlights Segment performance review Expenses and taxes Capital, balance sheet and liquidity 1
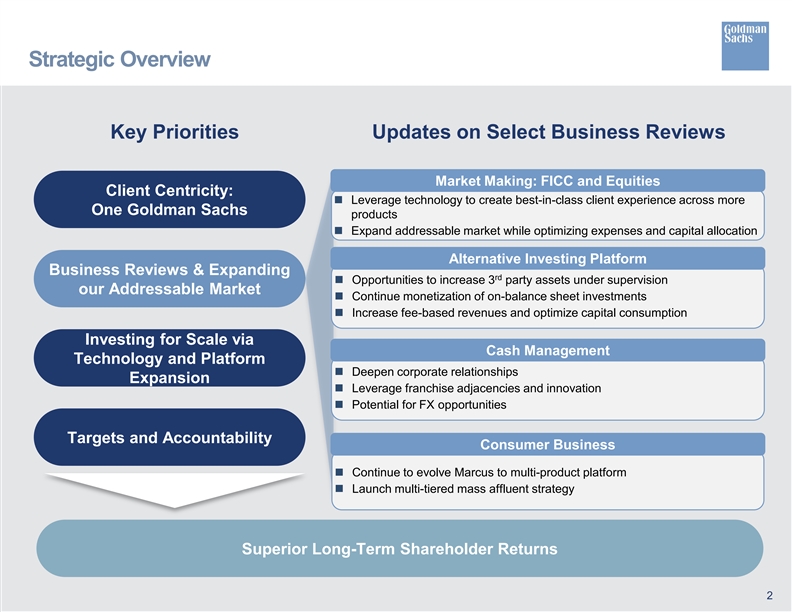
Client Centricity: One Goldman Sachs Business Reviews & Expanding our Addressable Market Investing for Scale via Technology and Platform Expansion Targets and Accountability Strategic Overview 2 Superior Long-Term Shareholder Returns Key Priorities Updates on Select Business Reviews Leverage technology to create best-in-class client experience across more products Expand addressable market while optimizing expenses and capital allocation Market Making: FICC and Equities Opportunities to increase 3rd party assets under supervision Continue monetization of on-balance sheet investments Increase fee-based revenues and optimize capital consumption Alternative Investing Platform Deepen corporate relationships Leverage franchise adjacencies and innovation Potential for FX opportunities Cash Management Continue to evolve Marcus to multi-product platform Launch multi-tiered mass affluent strategy Consumer Business
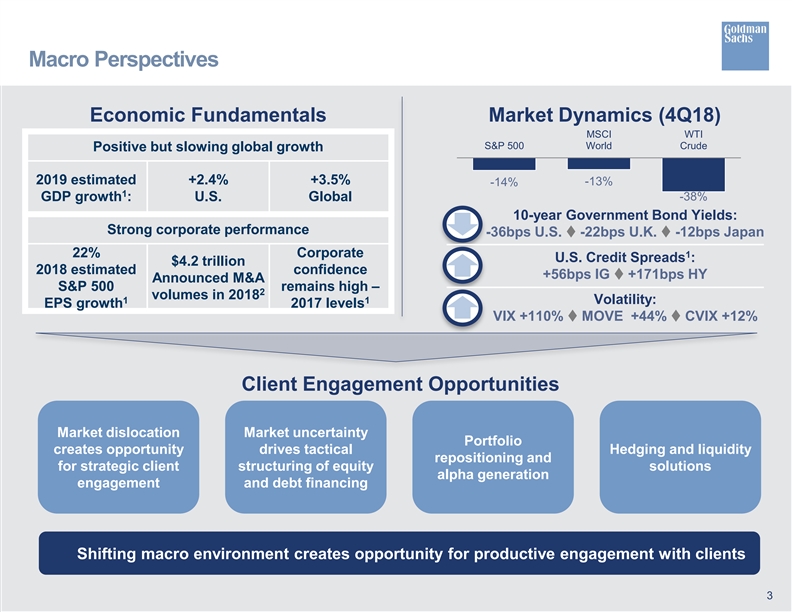
Macro Perspectives 3 Economic Fundamentals Market Dynamics (4Q18) Positive but slowing global growth 2019 estimated GDP growth1: +2.4% U.S. +3.5% Global Strong corporate performance 22% 2018 estimated S&P 500 EPS growth1 $4.2 trillion Announced M&A volumes in 20182 Corporate confidence remains high – 2017 levels1 Market dislocation creates opportunity for strategic client engagement Market uncertainty drives tactical structuring of equity and debt financing Portfolio repositioning and alpha generation Hedging and liquidity solutions Shifting macro environment creates opportunity for productive engagement with clients 10-year Government Bond Yields: -36bps U.S. ï´ -22bps U.K. ï´ -12bps Japan Client Engagement Opportunities -14% -13% -38% S&P 500 MSCI World WTI Crude Volatility: VIX +110% ï´ MOVE +44% ï´ CVIX +12% U.S. Credit Spreads1: +56bps IG ï´ +171bps HY
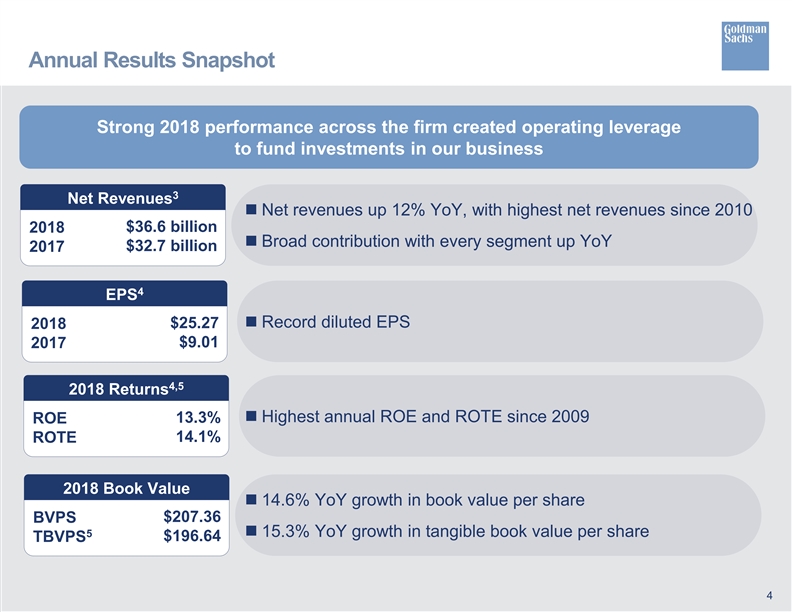
Annual Results Snapshot Net revenues up 12% YoY, with highest net revenues since 2010 Broad contribution with every segment up YoY Net Revenues3 $36.6 billion $32.7 billion 2018 2017 EPS4 $25.27 $9.01 2018 2017 2018 Returns4,5 13.3% 14.1% ROE ROTE 2018 Book Value $207.36 $196.64 BVPS TBVPS5 Strong 2018 performance across the firm created operating leverage to fund investments in our business Record diluted EPS Highest annual ROE and ROTE since 2009 14.6% YoY growth in book value per share 15.3% YoY growth in tangible book value per share 4
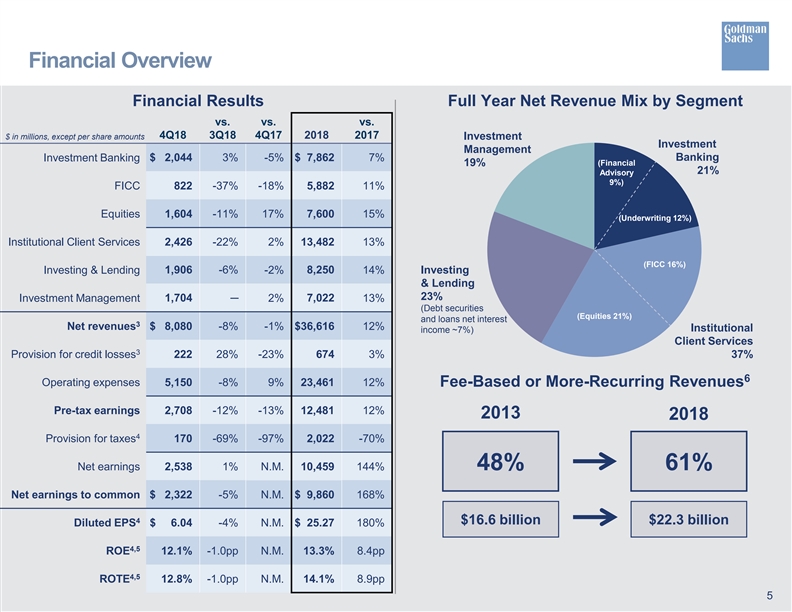
Financial Overview Full Year Net Revenue Mix by Segment 5 Financial Results Fee-Based or More-Recurring Revenues6 2018 61% 48% $22.3 billion $16.6 billion 2013 Investment Management 19% Institutional Client Services 37% (Financial Advisory 9%) (Underwriting 12%) (FICC 16%) (Equities 21%) Investment Banking 21% Investing & Lending 23% (Debt securities and loans net interest income ~7%) $ in millions, except per share amounts 4Q18 vs. 3Q18 vs. 4Q17 2018 vs. 2017 Investment Banking $ 2,044 3% -5% $ 7,862 7% FICC 822 -37% -18% 5,882 11% Equities 1,604 -11% 17% 7,600 15% Institutional Client Services 2,426 -22% 2% 13,482 13% Investing & Lending 1,906 -6% -2% 8,250 14% Investment Management 1,704 — 2% 7,022 13% Net revenues3 $ 8,080 -8% -1% $36,616 12% Provision for credit losses3 222 28% -23% 674 3% Operating expenses 5,150 -8% 9% 23,461 12% Pre-tax earnings 2,708 -12% -13% 12,481 12% Provision for taxes4 170 -69% -97% 2,022 -70% Net earnings 2,538 1% N.M. 10,459 144% Net earnings to common $ 2,322 -5% N.M. $ 9,860 168% Diluted EPS4 $ 6.04 -4% N.M. $ 25.27 180% ROE4,5 12.1% -1.0pp N.M. 13.3% 8.4pp ROTE4,5 12.8% -1.0pp N.M. 14.1% 8.9pp
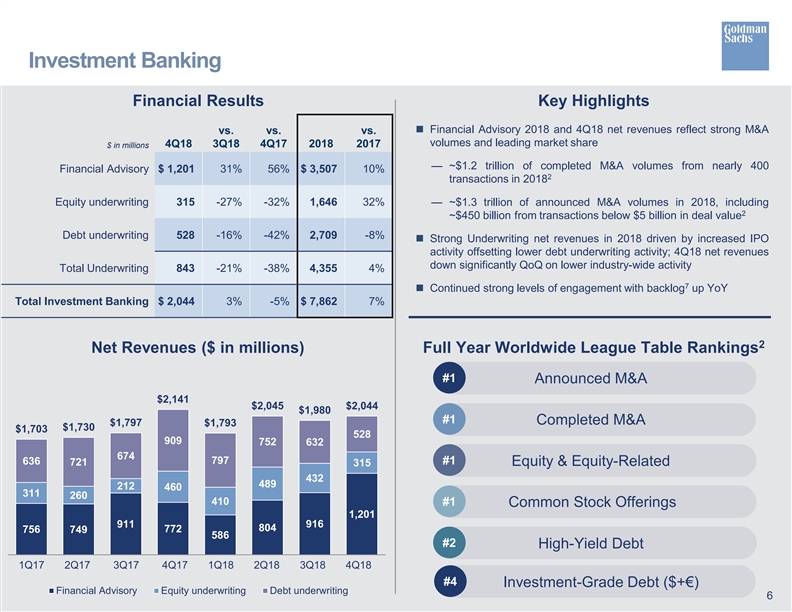
Investment Banking Financial Results $ in millions 4Q18 vs. 3Q18 vs. 4Q17 2018 vs. 2017 Financial Advisory $ 1,201 31% 56% $ 3,507 10% Equity underwriting 315 -27% -32% 1,646 32% Debt underwriting 528 -16% -42% 2,709 -8% Total Underwriting 843 -21% -38% 4,355 4% Total Investment Banking $ 2,044 3% -5% $ 7,862 7% Full Year Worldwide League Table Rankings2 Net Revenues ($ in millions) Key Highlights Financial Advisory 2018 and 4Q18 net revenues reflect strong M&A volumes and leading market share — ~$1.2 trillion of completed M&A volumes from nearly 400 transactions in 20182 — ~$1.3 trillion of announced M&A volumes in 2018, including ~$450 billion from transactions below $5 billion in deal value2 Strong Underwriting net revenues in 2018 driven by increased IPO activity offsetting lower debt underwriting activity; 4Q18 net revenues down significantly QoQ on lower industry-wide activity Continued strong levels of engagement with backlog7 up YoY #1 Announced M&A #2 #1 #1 #1 Completed M&A Equity & Equity-Related High-Yield Debt 6 1Q17 2Q17 3Q17 4Q17 1Q18 2Q18 3Q18 4Q18 756 749 911 772 586 804 916 1,201 311 260 212 460 410 489 432 315 636 721 674 909 797 752 632 528 $1,703 $1,730 $1,797 $2,141 $1,793 $2,045 $1,980 $2,044 Financial Advisory Equity underwriting Debt underwriting Common Stock Offerings Investment-Grade Debt ($+€) #4
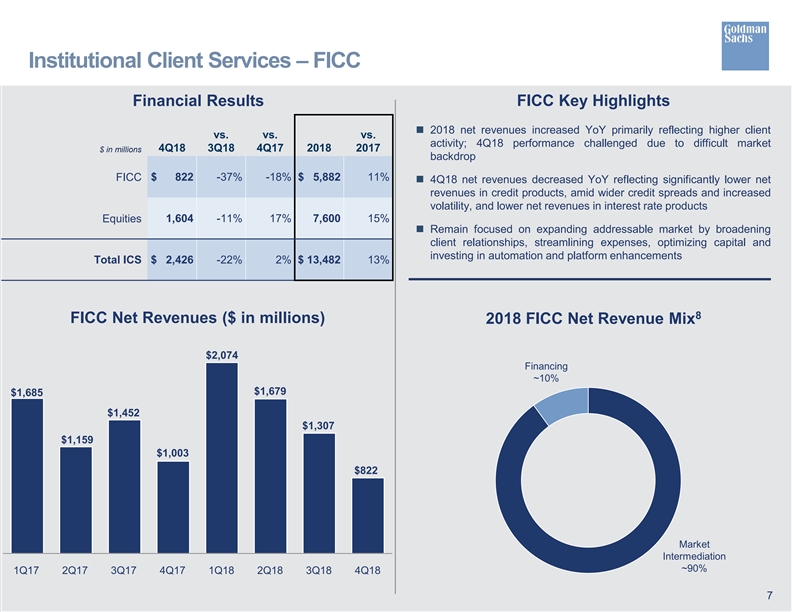
Institutional Client Services – FICC FICC Net Revenues ($ in millions) 2018 net revenues increased YoY primarily reflecting higher client activity; 4Q18 performance challenged due to difficult market backdrop 4Q18 net revenues decreased YoY reflecting significantly lower net revenues in credit products, amid wider credit spreads and increased volatility, and lower net revenues in interest rate products Remain focused on expanding addressable market by broadening client relationships, streamlining expenses, optimizing capital and investing in automation and platform enhancements 7 FICC Key Highlights 2018 FICC Net Revenue Mix8 Financing ~10% Market Intermediation~90% 1Q17 2Q17 3Q17 4Q17 1Q18 2Q18 3Q18 4Q18 $1,685 $1,159 $1,452 $1,003 $2,074 $1,679 $1,307 $822 $ in millions 4Q18 vs. 3Q18 vs. 4Q17 2018 vs. 2017 FICC $ 822 -37% -18% $ 5,882 11% Equities 1,604 -11% 17% 7,600 15% Total ICS $ 2,426 -22% 2% $ 13,482 13% Financial Results
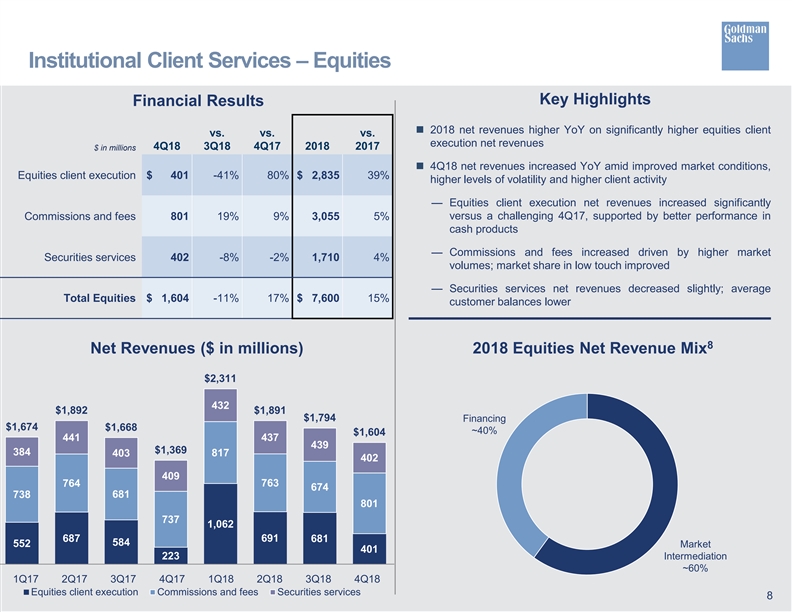
$ in millions 4Q18 vs. 3Q18 vs. 4Q17 2018 vs. 2017 Equities client execution $ 401 -41% 80% $ 2,835 39% Commissions and fees 801 19% 9% 3,055 5% Securities services 402 -8% -2% 1,710 4% Total Equities $ 1,604 -11% 17% $ 7,600 15% Institutional Client Services – Equities 2018 net revenues higher YoY on significantly higher equities client execution net revenues 4Q18 net revenues increased YoY amid improved market conditions, higher levels of volatility and higher client activity — Equities client execution net revenues increased significantly versus a challenging 4Q17, supported by better performance in cash products — Commissions and fees increased driven by higher market volumes; market share in low touch improved — Securities services net revenues decreased slightly; average customer balances lower Net Revenues ($ in millions) 8 Key Highlights Financial Results 2018 Equities Net Revenue Mix8 Financing ~40% Market Intermediation ~60% 1Q17 2Q17 3Q17 4Q17 1Q18 2Q18 3Q18 4Q18 552 687 584 223 1,062 691 681 401 738 764 681 737 817 763 674 801 384 441 403 409 432 437 439 402 $1,674 $1,892 $1,668 $1,369 $2,311 $1,891 $1,794 $1,604 Equities client execution Commissions and fees Securities services
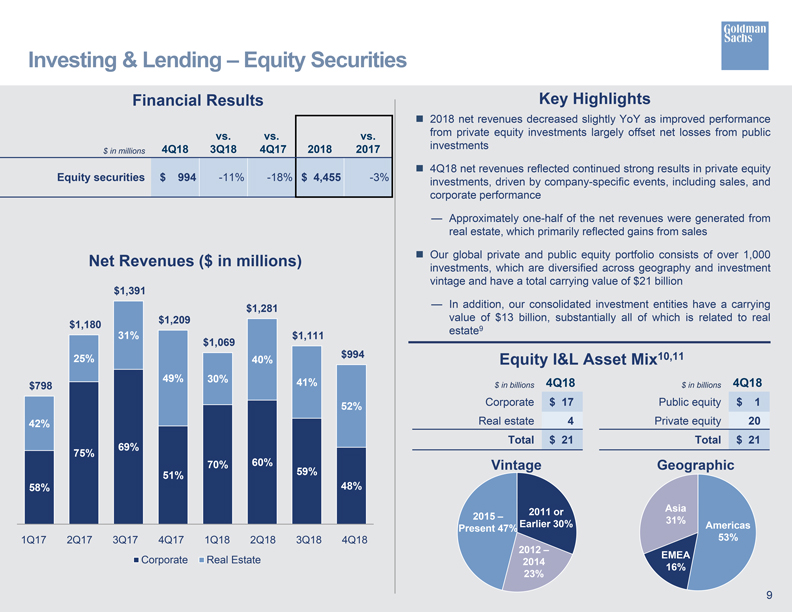
Investing & Lending – Equity Securities Financial Results Key Highlights 2018 net revenues decreased slightly YoY as improved performance vs. vs. vs. from private equity investments largely offset net losses from public $ in millions 4Q18 3Q18 4Q17 2018 2017 investments 4Q18 net revenues reflected continued strong results in private equity Equity securities $ 994 -11% -18% $ 4,455 -3% investments, driven by company-specific events, including sales, and corporate performance — Approximately one-half of the net revenues were generated from real estate, which primarily reflected gains from sales Net Revenues ($ in millions) investments, Our global private which and are public diversified equity across portfolio geography consists and of over investment 1,000 vintage and have a total carrying value of $21 billion $1,391 $1,281 — In addition, our consolidated investment entities have a carrying $1,180 $1,209 value of $13 billion, substantially all of which is related to real 31% $1,111 estate 9 $1,069 25% 40% $994 Equity I&L Asset Mix10,11 $798 49% 30% 41% $ in billions 4Q18 $ in billions 4Q18 52% Corporate $ 17 Public equity $ 1 42% Real estate 4 Private equity 20 Total $ 21 Total $ 21 75% 69% 70% 60% 59% Vintage Geographic 51% 58% 48% 2011 or Asia 2015 – 31% Present 47% Earlier 30% Americas 1Q17 2Q17 3Q17 4Q17 1Q18 2Q18 3Q18 4Q18 53% 2012 – Corporate Real Estate 2014 EMEA 23% 16% 9
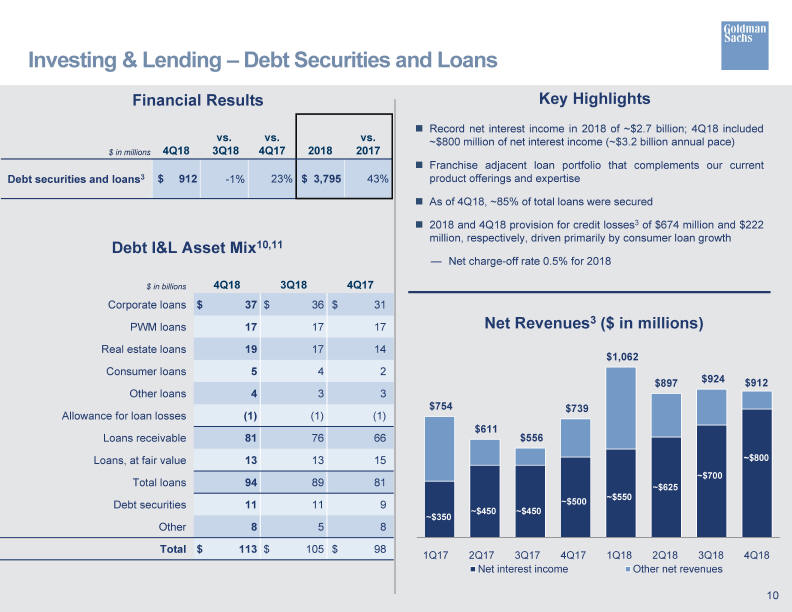
Record net interest income in 2018 of ~$2.7 billion; 4Q18 included ~$800 million of net interest income (~$3.2 billion annual pace) Franchise adjacent loan portfolio that complements our current product offerings and expertise As of 4Q18, ~85% of total loans were secured 2018 and 4Q18 provision for credit losses3 of $674 million and $222 million, respectively, driven primarily by consumer loan growth Net charge-off rate 0.5% for 2018 Investing & Lending – Debt Securities and Loans Net Revenues3 ($ in millions) $ in millions 4Q18 vs. 3Q18 vs. 4Q17 2018 vs. 2017 Debt securities and loans3 $ 912 -1% 23% $ 3,795 43%
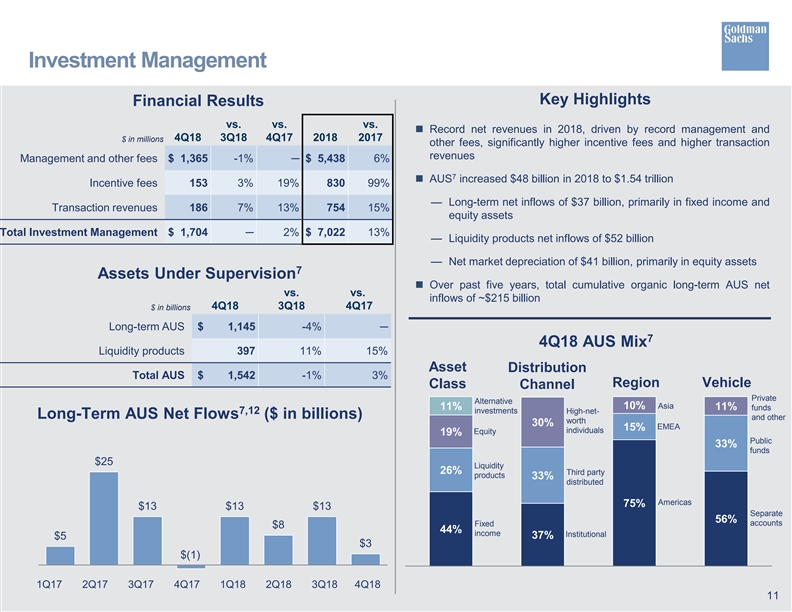
44% 37% 75% 56% 26% 33% 15% 33% 19% 30% 10% 11% 11% $ in millions 4Q18 vs. 3Q18 vs. 4Q17 2018 vs. 2017 Management and other fees $ 1,365 -1% — $ 5,438 6% Incentive fees 153 3% 19% 830 99% Transaction revenues 186 7% 13% 754 15% Total Investment Management $ 1,704 — 2% $ 7,022 13% Investment Management Financial Results 4Q18 AUS Mix7 Assets Under Supervision7 $ in billions 4Q18 vs. 3Q18 vs. 4Q17 Long-term AUS $ 1,145 -4% — Liquidity products 397 11% 15% Total AUS $ 1,542 -1% 3% Long-Term AUS Net Flows7,12 ($ in billions) Record net revenues in 2018, driven by record management and other fees, significantly higher incentive fees and higher transaction revenues AUS7 increased $48 billion in 2018 to $1.54 trillion — Long-term net inflows of $37 billion, primarily in fixed income and equity assets — Liquidity products net inflows of $52 billion — Net market depreciation of $41 billion, primarily in equity assets Over past five years, total cumulative organic long-term AUS net inflows of ~$215 billion Alternative investments Equity Liquidity products Fixed income Third party distributed High-net- worth individuals Institutional EMEA Americas Asia Public funds Separate accounts Private funds and other 11 Asset Class Distribution Channel Region Vehicle 1Q17 2Q17 3Q17 4Q17 1Q18 2Q18 3Q18 4Q18 $5 $25 $13 $(1) $13 $8 $13 $3 Key Highlights
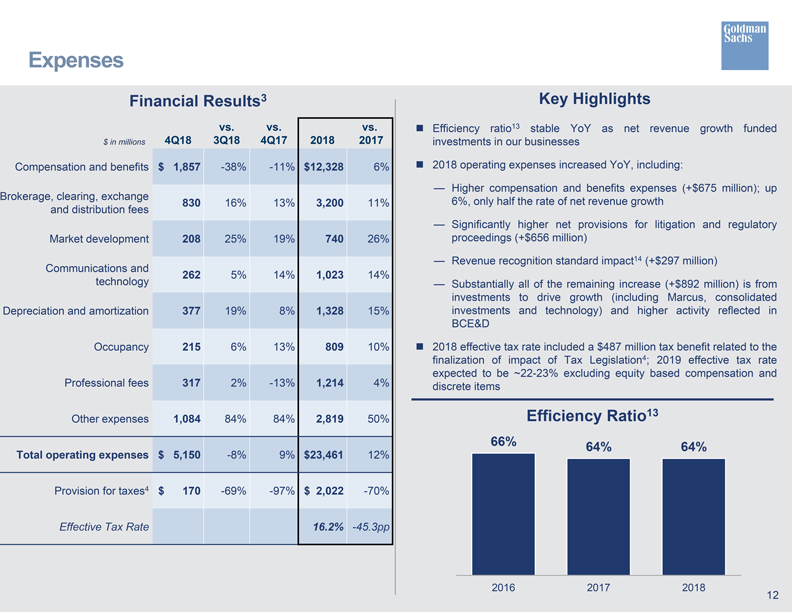
Expenses Financial Results3 Key Highlights vs. vs. vs. Efficiency ratio13 stable YoY as net revenue growth funded $ in millions 4Q18 3Q18 4Q17 2018 2017 investments in our businesses Compensation and benefits $ 1,857 -38% -11% $12,328 6% 2018 operating expenses increased YoY, including: — Higher compensation and benefits expenses (+$675 million); up Brokerage, clearing, exchange 830 16% 13% 3,200 11% 6%, only half the rate of net revenue growth and distribution fees — Significantly higher net provisions for litigation and regulatory Market development 208 25% 19% 740 26% proceedings (+$656 million) — Revenue recognition standard impact14 (+$297 million) Communications and 262 5% 14% 1,023 14% technology — Substantially all of the remaining increase (+$892 million) is from investments to drive growth (including Marcus, consolidated Depreciation and amortization 377 19% 8% 1,328 15% investments and technology) and higher activity reflected in BCE&D Occupancy 215 6% 13% 809 10% 2018 effective tax rate included a $487 million tax benefit related to the finalization of impact of Tax Legislation4; 2019 effective tax rate expected to be ~22-23% excluding equity based compensation and Professional fees 317 2% -13% 1,214 4% discrete items Other expenses 1,084 84% 84% 2,819 50% Efficiency Ratio13 66% 64% 64% Total operating expenses $ 5,150 -8% 9% $23,461 12% Provision for taxes4 $ 170 -69% -97% $ 2,022 -70% Effective Tax Rate 16.2% -45.3pp 2016 2017 2018 12
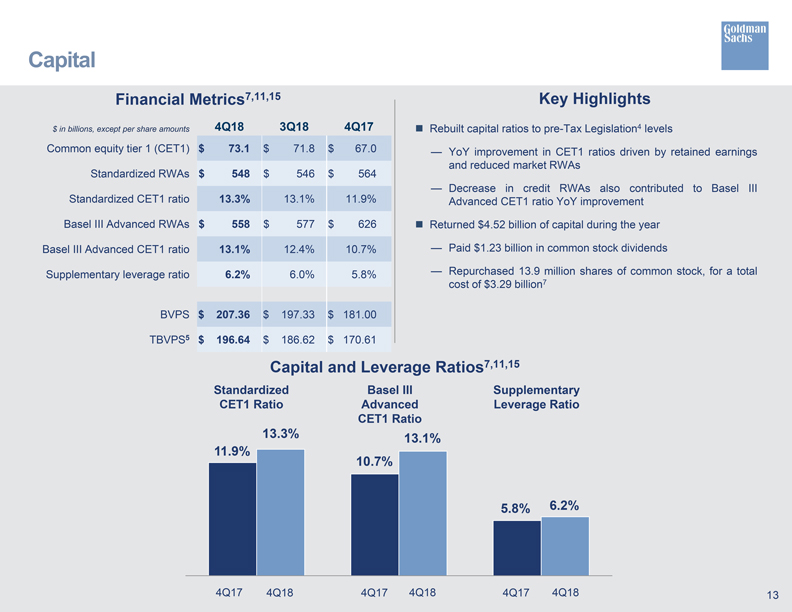
Capital Financial Metrics7,11,15 Key Highlights $ in billions, except per share amounts 4Q18 3Q18 4Q17 Rebuilt capital ratios to pre-Tax Legislation4 levels Common equity tier 1 (CET1) $ 73.1 $ 71.8 $ 67.0 — YoY improvement in CET1 ratios driven by retained earnings and reduced market RWAs Standardized RWAs $ 548 $ 546 $ 564 — Decrease in credit RWAs also contributed to Basel III Standardized CET1 ratio 13.3% 13.1% 11.9% Advanced CET1 ratio YoY improvement Basel III Advanced RWAs $ 558 $ 577 $ 626 Returned $4.52 billion of capital during the year Basel III Advanced CET1 ratio 13.1% 12.4% 10.7% — Paid $1.23 billion in common stock dividends Supplementary leverage ratio 6.2% 6.0% 5.8% — Repurchased 13.9 million shares of common stock, for a total cost of $3.29 billion7 BVPS $ 207.36 $ 197.33 $ 181.00 TBVPS5 $ 196.64 $ 186.62 $ 170.61 Capital and Leverage Ratios7,11,15 Standardized Basel III Supplementary CET1 Ratio Advanced Leverage Ratio CET1 Ratio 13.3% 13.1% 11.9% 10.7% 5.8% 6.2% 4Q17 4Q18 4Q17 4Q18 4Q17 4Q18 13
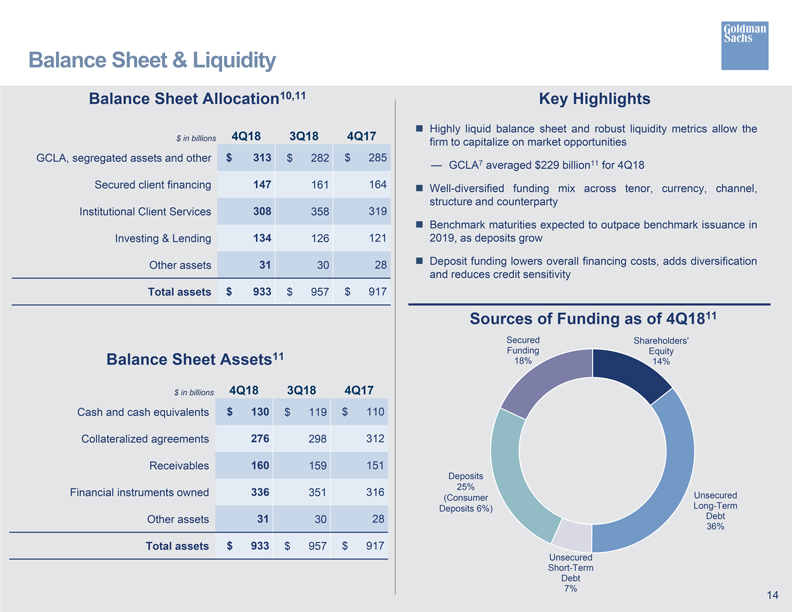
Balance Sheet & Liquidity Balance Sheet Allocation10,11 Key Highlights 4Q18 3Q18 4Q17 Highly liquid balance sheet and robust liquidity metrics allow the $ in billions firm to capitalize on market opportunities GCLA, segregated assets and other $ 313 $ 282 $ 285 — GCLA7 averaged $229 billion11 for 4Q18 Secured client financing 147 161 164 Well-diversified funding mix across tenor, currency, channel, structure and counterparty Institutional Client Services 308 358 319 Benchmark maturities expected to outpace benchmark issuance in Investing & Lending 134 126 121 2019, as deposits grow Other assets 31 30 28 Deposit funding lowers overall financing costs, adds diversification and reduces credit sensitivity Total assets $ 933 $ 957 $ 917 Sources of Funding as of 4Q1811 Secured Shareholders’ Balance Sheet Assets11 Funding 18% Equity 14% $ in billions 4Q18 3Q18 4Q17 Cash and cash equivalents $ 130 $ 119 $ 110 Collateralized agreements 276 298 312 Receivables 160 159 151 Deposits 25% Financial instruments owned 336 351 316 (Consumer Unsecured Deposits 6%) Long-Term Other assets 31 30 28 Debt 36% Total assets $ 933 $ 957 $ 917 Unsecured Short-Term Debt 7% 14
Cautionary Note on Forward-Looking Statements This presentation contains “forward-looking statements” within the meaning of the safe harbor provisions of the U.S. Private Securities Litigation Reform Act of 1995. Forward-looking statements are not historical facts, but instead represent only the firm’s beliefs regarding future events, many of which, by their nature, are inherently uncertain and outside of the firm’s control. It is possible that the firm’s actual results and financial condition may differ, possibly materially, from the anticipated results and financial condition indicated in these forward-looking statements. For a discussion of some of the risks and important factors that could affect the firm’s future results and financial condition, see “Risk Factors” in Part I, Item 1A of the firm’s Annual Report on Form 10-K for the year ended December 31, 2017. Information regarding the firm’s capital ratios, risk-weighted assets, supplementary leverage ratio, total assets and balance sheet data, global core liquid assets, and planned 2019 benchmark issuances consists of preliminary estimates. These estimates are forward-looking statements and are subject to change, possibly materially, including as the firm completes its financial statements. Statements about the firm’s expected 2019 effective income tax rate constitute forward-looking statements. These statements are subject to the risk that the firm’s 2019 effective income tax rate may differ from the anticipated rate indicated in these forward-looking statements, possibly materially, due to, among other things, changes in the firm’s earnings mix, the firm’s profitability and the entities in which the firm generates profits, the assumptions the firm has made in forecasting its expected tax rate, as well as guidance that may be issued by the U.S. Internal Revenue Service. Statements about the firm’s investment banking transaction backlog also may constitute forward-looking statements. Such statements are subject to the risk that the terms of these transactions may be modified or that they may not be completed at all; therefore, the net revenues, if any, that the firm actually earns from these transactions may differ, possibly materially, from those currently expected. Important factors that could result in a modification of the terms of a transaction or a transaction not being completed include, in the case of underwriting transactions, a decline or continued weakness in general economic conditions, outbreak of hostilities, volatility in the securities markets generally or an adverse development with respect to the issuer of the securities and, in the case of financial advisory transactions, a decline in the securities markets, an inability to obtain adequate financing, an adverse development with respect to a party to the transaction or a failure to obtain a required regulatory approval. For a discussion of other important factors that could adversely affect the firm’s investment banking transactions, see “Risk Factors” in Part I, Item 1A of the firm’s Annual Report on Form 10-K for the year ended December 31, 2017. 15
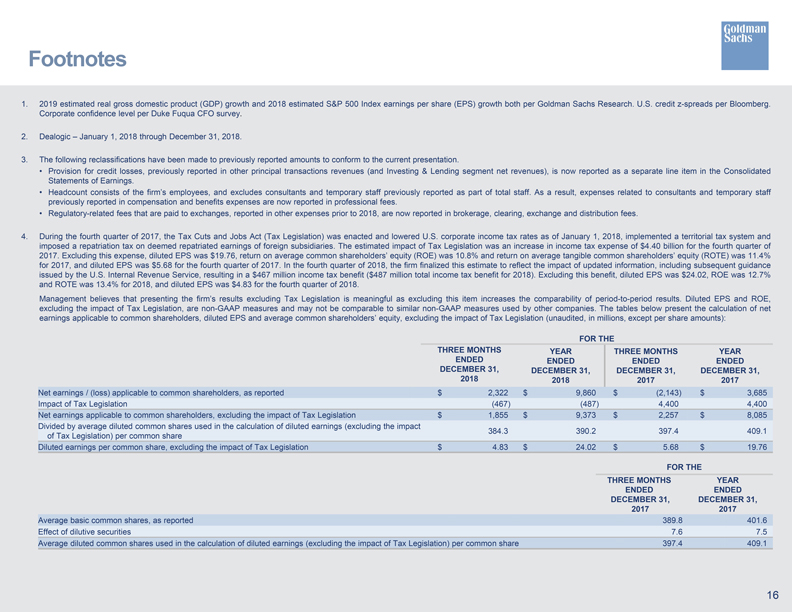
Footnotes 1. 2019 estimated real gross domestic product (GDP) growth and 2018 estimated S&P 500 Index earnings per share (EPS) growth both per Goldman Sachs Research. U.S. credit z-spreads per Bloomberg. Corporate confidence level per Duke Fuqua CFO survey. 2. Dealogic – January 1, 2018 through December 31, 2018. 3. The following reclassifications have been made to previously reported amounts to conform to the current presentation. Provision for credit losses, previously reported in other principal transactions revenues (and Investing & Lending segment net revenues), is now reported as a separate line item in the Consolidated Statements of Earnings. Headcount consists of the firm’s employees, and excludes consultants and temporary staff previously reported as part of total staff. As a result, expenses related to consultants and temporary staff previously reported in compensation and benefits expenses are now reported in professional fees. Regulatory-related fees that are paid to exchanges, reported in other expenses prior to 2018, are now reported in brokerage, clearing, exchange and distribution fees. 4. During the fourth quarter of 2017, the Tax Cuts and Jobs Act (Tax Legislation) was enacted and lowered U.S. corporate income tax rates as of January 1, 2018, implemented a territorial tax system and imposed a repatriation tax on deemed repatriated earnings of foreign subsidiaries. The estimated impact of Tax Legislation was an increase in income tax expense of $4.40 billion for the fourth quarter of 2017. Excluding this expense, diluted EPS was $19.76, return on average common shareholders’ equity (ROE) was 10.8% and return on average tangible common shareholders’ equity (ROTE) was 11.4% for 2017, and diluted EPS was $5.68 for the fourth quarter of 2017. In the fourth quarter of 2018, the firm finalized this estimate to reflect the impact of updated information, including subsequent guidance issued by the U.S. Internal Revenue Service, resulting in a $467 million income tax benefit ($487 million total income tax benefit for 2018). Excluding this benefit, diluted EPS was $24.02, ROE was 12.7% and ROTE was 13.4% for 2018, and diluted EPS was $4.83 for the fourth quarter of 2018. Management believes that presenting the firm’s results excluding Tax Legislation is meaningful as excluding this item increases the comparability of period-to-period results. Diluted EPS and ROE, excluding the impact of Tax Legislation, are non-GAAP measures and may not be comparable to similar non-GAAP measures used by other companies. The tables below present the calculation of net earnings applicable to common shareholders, diluted EPS and average common shareholders’ equity, excluding the impact of Tax Legislation (unaudited, in millions, except per share amounts): FOR THE THREE MONTHS YEAR THREE MONTHS YEAR ENDED ENDED ENDED ENDED DECEMBER 31, DECEMBER 31, DECEMBER 31, DECEMBER 31, 2018 2018 2017 2017 Net earnings / (loss) applicable to common shareholders, as reported $ 2,322 $ 9,860 $ (2,143) $ 3,685 Impact of Tax Legislation (467) (487) 4,400 4,400 Net earnings applicable to common shareholders, excluding the impact of Tax Legislation $ 1,855 $ 9,373 $ 2,257 $ 8,085 Divided by average diluted common shares used in the calculation of diluted earnings (excluding the impact of Tax Legislation) per common share 384.3 390.2 397.4 409.1 Diluted earnings per common share, excluding the impact of Tax Legislation $ 4.83 $ 24.02 $ 5.68 $ 19.76 FOR THE THREE MONTHS YEAR ENDED ENDED DECEMBER 31, DECEMBER 31, 2017 2017 Average basic common shares, as reported 389.8 401.6 Effect of dilutive securities 7.6 7.5 Average diluted common shares used in the calculation of diluted earnings (excluding the impact of Tax Legislation) per common share 397.4 409.1 16
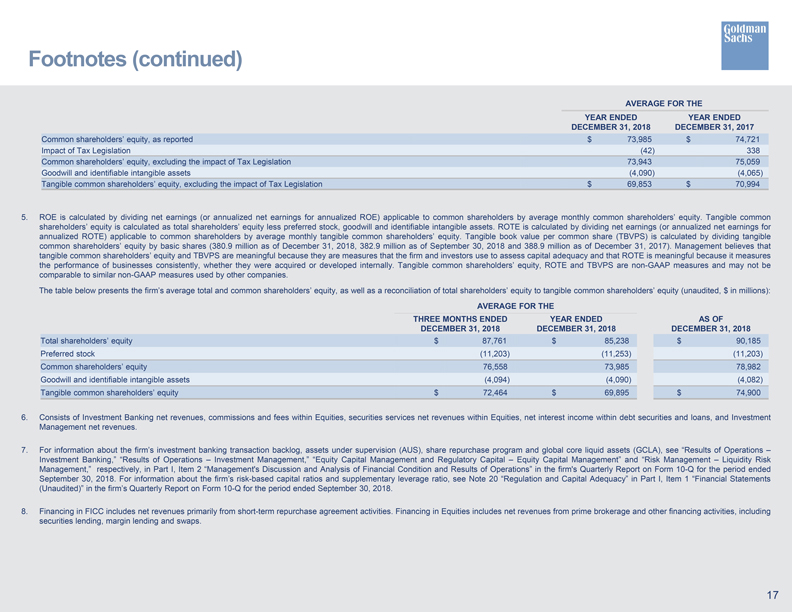
Footnotes (continued) AVERAGE FOR THE YEAR ENDED YEAR ENDED DECEMBER 31, 2018 DECEMBER 31, 2017 Common shareholders’ equity, as reported $ 73,985 $ 74,721 Impact of Tax Legislation (42) 338 Common shareholders’ equity, excluding the impact of Tax Legislation 73,943 75,059 Goodwill and identifiable intangible assets (4,090) (4,065) Tangible common shareholders’ equity, excluding the impact of Tax Legislation $ 69,853 $ 70,994 5. ROE is calculated by dividing net earnings (or annualized net earnings for annualized ROE) applicable to common shareholders by average monthly common shareholders’ equity. Tangible common shareholders’ equity is calculated as total shareholders’ equity less preferred stock, goodwill and identifiable intangible assets. ROTE is calculated by dividing net earnings (or annualized net earnings for annualized ROTE) applicable to common shareholders by average monthly tangible common shareholders’ equity. Tangible book value per common share (TBVPS) is calculated by dividing tangible common shareholders’ equity by basic shares (380.9 million as of December 31, 2018, 382.9 million as of September 30, 2018 and 388.9 million as of December 31, 2017). Management believes that tangible common shareholders’ equity and TBVPS are meaningful because they are measures that the firm and investors use to assess capital adequacy and that ROTE is meaningful because it measures the performance of businesses consistently, whether they were acquired or developed internally. Tangible common shareholders’ equity, ROTE and TBVPS are non-GAAP measures and may not be comparable to similar non-GAAP measures used by other companies. The table below presents the firm’s average total and common shareholders’ equity, as well as a reconciliation of total shareholders’ equity to tangible common shareholders’ equity (unaudited, $ in millions): AVERAGE FOR THE THREE MONTHS ENDED YEAR ENDED AS OF DECEMBER 31, 2018 DECEMBER 31, 2018 DECEMBER 31, 2018 Total shareholders’ equity $ 87,761 $ 85,238 $ 90,185 Preferred stock (11,203) (11,253) (11,203) Common shareholders’ equity 76,558 73,985 78,982 Goodwill and identifiable intangible assets (4,094) (4,090) (4,082) Tangible common shareholders’ equity $ 72,464 $ 69,895 $ 74,900 6. Consists of Investment Banking net revenues, commissions and fees within Equities, securities services net revenues within Equities, net interest income within debt securities and loans, and Investment Management net revenues. 7. For information about the firm’s investment banking transaction backlog, assets under supervision (AUS), share repurchase program and global core liquid assets (GCLA), see “Results of Operations – Investment Banking,” “Results of Operations – Investment Management,” “Equity Capital Management and Regulatory Capital – Equity Capital Management” and “Risk Management – Liquidity Risk Management,” respectively, in Part I, Item 2 “Management’s Discussion and Analysis of Financial Condition and Results of Operations” in the firm’s Quarterly Report on Form 10-Q for the period ended September 30, 2018. For information about the firm’s risk-based capital ratios and supplementary leverage ratio, see Note 20 “Regulation and Capital Adequacy” in Part I, Item 1 “Financial Statements (Unaudited)” in the firm’s Quarterly Report on Form 10-Q for the period ended September 30, 2018. 8. Financing in FICC includes net revenues primarily from short-term repurchase agreement activities. Financing in Equities includes net revenues from prime brokerage and other financing activities, including securities lending, margin lending and swaps. 17
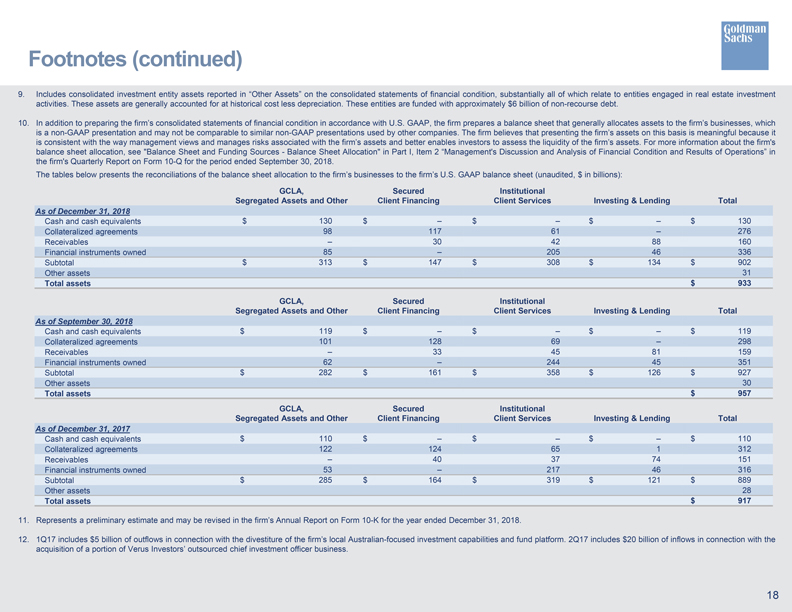
Footnotes (continued) 9. Includes consolidated investment entity assets reported in “Other Assets” on the consolidated statements of financial condition, substantially all of which relate to entities engaged in real estate investment activities. These assets are generally accounted for at historical cost less depreciation. These entities are funded with approximately $ 6 billion of non-recourse debt. 10. In addition to preparing the firm’s consolidated statements of financial condition in accordance with U.S. GAAP, the firm prepares a balance sheet that generally allocates assets to the firm’s businesses, which is a non-GAAP presentation and may not be comparable to similar non-GAAP presentations used by other companies. The firm believes that presenting the firm’s assets on this basis is meaningful because it is consistent with the way management views and manages risks associated with the firm’s assets and better enables investors to assess the liquidity of the firm’s assets. For more information about the firm’s balance sheet allocation, see “Balance Sheet and Funding Sources—Balance Sheet Allocation” in Part I, Item 2 “Management’s Discussion and Analysis of Financial Condition and Results of Operations” in the firm’s Quarterly Report on Form 10-Q for the period ended September 30, 2018. The tables below presents the reconciliations of the balance sheet allocation to the firm’s businesses to the firm’s U.S. GAAP balance sheet (unaudited, $ in billions): GCLA, Secured Institutional Segregated Assets and Other Client Financing Client Services Investing & Lending Total As of December 31, 2018 Cash and cash equivalents $ 130 $ – $ – $ – $ 130 Collateralized agreements 98 117 61 – 276 Receivables – 30 42 88 160 Financial instruments owned 85 – 205 46 336 Subtotal $ 313 $ 147 $ 308 $ 134 $ 902 Other assets 31 Total assets $ 933 GCLA, Secured Institutional Segregated Assets and Other Client Financing Client Services Investing & Lending Total As of September 30, 2018 Cash and cash equivalents $ 119 $ – $ – $ – $ 119 Collateralized agreements 101 128 69 – 298 Receivables – 33 45 81 159 Financial instruments owned 62 – 244 45 351 Subtotal $ 282 $ 161 $ 358 $ 126 $ 927 Other assets 30 Total assets $ 957 GCLA, Secured Institutional Segregated Assets and Other Client Financing Client Services Investing & Lending Total As of December 31, 2017 Cash and cash equivalents $ 110 $ – $ – $ – $ 110 Collateralized agreements 122 124 65 1 312 Receivables – 40 37 74 151 Financial instruments owned 53 – 217 46 316 Subtotal $ 285 $ 164 $ 319 $ 121 $ 889 Other assets 28 Total assets $ 917 11. Represents a preliminary estimate and may be revised in the firm’s Annual Report on Form 10-K for the year ended December 31, 2018. 12. 1Q17 includes $5 billion of outflows in connection with the divestiture of the firm’s local Australian-focused investment capabilities and fund platform. 2Q17 includes $ 20 billion of inflows in connection with the acquisition of a portion of Verus Investors’ outsourced chief investment officer business. 18
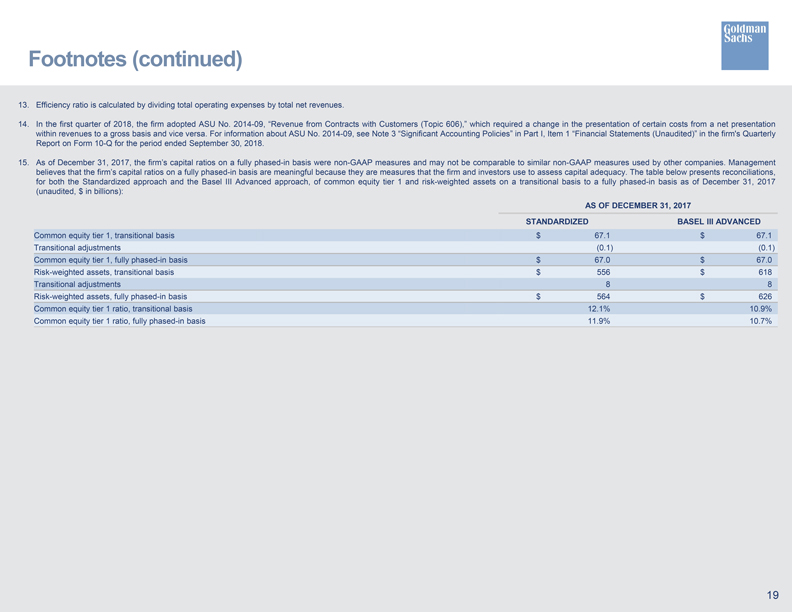
Footnotes (continued) 13. Efficiency ratio is calculated by dividing total operating expenses by total net revenues. 14. In the first quarter of 2018, the firm adopted ASU No. 2014-09, “Revenue from Contracts with Customers (Topic 606),” which required a change in the presentation of certain costs from a net presentation within revenues to a gross basis and vice versa. For information about ASU No. 2014-09, see Note 3 “Significant Accounting Policies” in Part I, Item 1 “Financial Statements (Unaudited)” in the firm’s Quarterly Report on Form 10-Q for the period ended September 30, 2018. 15. As of December 31, 2017, the firm’s capital ratios on a fully phased-in basis were non-GAAP measures and may not be comparable to similar non-GAAP measures used by other companies. Management believes that the firm’s capital ratios on a fully phased-in basis are meaningful because they are measures that the firm and investors use to assess capital adequacy. The table below presents reconciliations, for both the Standardized approach and the Basel III Advanced approach, of common equity tier 1 and risk-weighted assets on a transitional basis to a fully phased-in basis as of December 31, 2017 (unaudited, $ in billions): AS OF DECEMBER 31, 2017 STANDARDIZED BASEL III ADVANCED Common equity tier 1, transitional basis $ 67.1 $ 67.1 Transitional adjustments (0.1) (0.1) Common equity tier 1, fully phased-in basis $ 67.0 $ 67.0 Risk-weighted assets, transitional basis $ 556 $ 618 Transitional adjustments 8 8 Risk-weighted assets, fully phased-in basis $ 564 $ 626 Common equity tier 1 ratio, transitional basis 12.1% 10.9% Common equity tier 1 ratio, fully phased-in basis 11.9% 10.7% 19