Attached files
UNITED STATES
SECURITIES AND EXCHANGE COMMISSION
Washington, D.C. 20549
FORM 10-Q
(Mark One)
| x | QUARTERLY REPORT PURSUANT TO SECTION 13 OR 15(D) OF THE SECURITIES EXCHANGE ACT OF 1934 |
For the quarterly period ended September 30, 2018
or
| ¨ | TRANSITION REPORT PURSUANT TO SECTION 13 OR 15(D) OF THE SECURITIES EXCHANGE ACT OF 1934 |
For the transition period from to
Commission File Number: 333-223073
CROSSCODE, INC.
(Exact name of registrant as specified in its charter)
| Delaware | 47-5409980 | |
|
(State or other jurisdiction of incorporation or organization) |
(I.R.S. employer Identification No.) | |
|
17285 74th Avenue North, Maple Grove, MN |
55311 | |
| (Address of principal executive offices) | (Zip Code) |
(408) 813-4601
(Registrant’s telephone number, including area code)
Indicate by check mark whether the registrant (1) has filed all reports required to be filed by Section 13 or 15(d) of the Exchange Act during the preceding 12 months (or for such shorter period that the registrant was required to file such reports), and (2) has been subject to such filing requirements for the past 90 days. Yes x No ¨
Indicate by check mark whether the registrant has submitted electronically every Interactive Data File required to be submitted pursuant to Rule 405 of Regulation S-T during the preceding 12 months (or for such shorter period that the registrant was required to submit such files). Yes x No ¨
Indicate by check mark whether the registrant is a large accelerated filer, an accelerated filer, a non-accelerated filer, a smaller reporting company or an emerging growth company. See the definitions of “large accelerated filer,” “accelerated filer,” “smaller reporting company,” and "emerging growth company" in Rule 12b-2 of the Exchange Act.
| Large accelerated filer | ¨ | Accelerated filer | ¨ | |||
| Non-accelerated filer | x | Smaller reporting company | x | |||
| Emerging growth company | x |
If an emerging growth company, indicate by check mark if the registrant has elected not to use the extended transition period for complying with any new or revised financial accounting standards provided pursuant to Section 13(a) of the Exchange Act. ¨
Indicate by check mark whether the registrant is a shell company (as defined by Rule 12b-2 of the Exchange Act). Yes ¨ No x
As of January 16, 2019, registrant had outstanding 59,909,996 shares of common stock.
CROSSCODE, INC. FORM 10-Q
TABLE OF CONTENTS
| Page No. | ||
| PART I. FINANCIAL INFORMATION | ||
| Item 1. | Unaudited Condensed Financial Statements: | |
| Condensed Balance Sheets at September 30, 2018 and December 31, 2017 | 3 | |
| Condensed Statements of Operations for the three and nine months ended September 30, 2018 and 2017 | 4 | |
| Condensed Statements of Cash Flows for the nine months ended September 30, 2018 and 2017 | 5 | |
| Notes to Condensed Financial Statements | 6 | |
| Item 2. | Management’s Discussion and Analysis of Financial Condition and Results of Operations | 13 |
| Item 3. | Quantitative and Qualitative Disclosures About Market Risk | 23 |
| Item 4. | Controls and Procedures | 23 |
| PART II. OTHER INFORMATION | ||
| Item 1. | Legal Proceedings | 24 |
| Item 1A. | Risk Factors | 24 |
| Item 2. | Unregistered Sales of Equity Securities and Use of Proceeds | 24 |
| Item 3. | Defaults Upon Senior Securities | 24 |
| Item 4. | Mine Safety Disclosures | 24 |
| Item 5. | Other Information | 24 |
| Item 6. | Exhibits | 24 |
| Signatures | 25 |
PART I. FINANCIAL INFORMATION
| ITEM 1. | FINANCIAL STATEMENTS |
Crosscode, Inc.
Condensed Balance Sheets
(Unaudited)
|
September 30, 2018 |
December 31, 2017 | |||||||
| ASSETS | ||||||||
| Current assets: | ||||||||
| Cash and cash equivalents | $ | 76,434 | $ | 316,596 | ||||
| Other receivables | — | 3,885 | ||||||
| Prepaid expenses | 6,229 | — | ||||||
| Total current assets | 82,663 | 320,481 | ||||||
| Property and equipment, net | 12,144 | 16,843 | ||||||
| Capitalized software development costs, net | 237,266 | 326,235 | ||||||
| Intangible assets, net | 6,970 | 7,380 | ||||||
| Total assets | $ | 339,043 | $ | 670,939 | ||||
| LIABILITIES AND STOCKHOLDERS’ DEFICIT | ||||||||
| Current liabilities: | ||||||||
| Accounts payable and accrued expenses | $ | 211,395 | $ | 217,637 | ||||
| Accounts payable and accrued expenses – related parties | 3,850 | 3,264 | ||||||
| Deferred revenue | 21,506 | — | ||||||
| Current portion of notes payable | 77,494 | 68,705 | ||||||
| Current portion of notes payable – related parties | 171,473 | 72,249 | ||||||
| Line of credit | 1,200,000 | 250,000 | ||||||
| Total current liabilities | 1,685,718 | 611,855 | ||||||
| Notes payable, net of current portion and unamortized debt issuance cost of $1,800 and $0, respectively | 163,015 | 187,721 | ||||||
| Notes payable – related parties, net of current portion | 197,163 | 227,399 | ||||||
| Total liabilities | 2,045,896 | 1,026,975 | ||||||
| Commitments and contingencies | ||||||||
| Stockholders’ deficit | ||||||||
| Common stock, $0.001 par value, 100,000,000 shares authorized, 59,909,996 shares issued and outstanding | 59,910 | 59,910 | ||||||
| Additional paid-in capital | 327,498 | 327,498 | ||||||
| Accumulated deficit | (2,094,261 | ) | (743,444 | ) | ||||
| Total stockholders’ deficit | (1,706,853 | ) | (356,036 | ) | ||||
| Total liabilities and stockholders’ deficit | $ | 339,043 | $ | 670,939 | ||||
See accompanying notes to the condensed financial statements.
3
Crosscode, Inc.
Condensed Statements of Operations
(Unaudited)
Three Months Ended September 30, |
Nine Months Ended September 30, | |||||||||||||||
| 2018 | 2017 | 2018 | 2017 | |||||||||||||
| Revenues | $ | 3,495 | $ | — | $ | 3,495 | $ | — | ||||||||
| Operating expenses: | ||||||||||||||||
| General and administrative expenses | 285,643 | 60,062 | 794,702 | 144,309 | ||||||||||||
| Research and development | 203,373 | — | 404,040 | — | ||||||||||||
| Depreciation and amortization expense | 31,359 | 2,189 | 94,077 | 6,454 | ||||||||||||
| Total operating expenses | 520,375 | 62,251 | 1,292,819 | 150,763 | ||||||||||||
| Loss from operations | (516,880 | ) | (62,251 | ) | (1,289,324 | ) | (150,763 | ) | ||||||||
| Other income (expenses): | ||||||||||||||||
| Interest income / (expense) | (28,198 | ) | (9,758 | ) | (61,493 | ) | (29,445 | ) | ||||||||
| Total other income (expenses) | (28,198 | ) | (9,758 | ) | (61,493 | ) | (29,445 | ) | ||||||||
| Net loss | $ | (545,078 | ) | $ | (72,009 | ) | (1,350,817 | ) | (180,208 | ) | ||||||
| Loss per common share – basic and diluted | $ | (0.01 | ) | $ | (0.00 | ) | $ | (0.02 | ) | $ | (0.00 | ) | ||||
| Weighted average number of common shares outstanding – basic and diluted | 59,909,996 | 58,922,228 | 59,909,996 | 58,784,028 | ||||||||||||
See accompanying notes to the condensed financial statements.
4
Crosscode, Inc.
Condensed Statements of Cash Flows
(Unaudited)
Nine Months Ended September 30, | ||||||||
| 2018 | 2017 | |||||||
| Cash flows from operating activities: | ||||||||
| Net loss | $ | (1,350,817 | ) | $ | (180,208 | ) | ||
| Adjustments to reconcile net loss to net cash used in operating activities: | ||||||||
| Stock-based compensation | — | 43,320 | ||||||
| Depreciation and amortization | 94,077 | 6,454 | ||||||
| Amortization of debt issuance cost | 200 | — | ||||||
| Changes in operating assets and liabilities: | ||||||||
| Prepaid expenses and other current assets | (2,343 | ) | (3,685 | ) | ||||
| Deferred revenue | 21,506 | — | ||||||
| Accounts payable and accrued expenses | (6,240 | ) | (3,587 | ) | ||||
| Accounts payable and accrued expenses – related party | 584 | 1,535 | ||||||
| Net cash used in operating activities | (1,243,033 | ) | (136,171 | ) | ||||
| Cash flows from investing activities: | ||||||||
| Purchase of property and equipment | — | (1,332 | ) | |||||
| Capitalized software development costs | — | (294,790 | ) | |||||
| Net cash used in investing activities | — | (296,122 | ) | |||||
| Cash flows from financing activities: | ||||||||
| Proceeds from credit card advances | — | 124,040 | ||||||
| Proceeds from revolving line of credit | 950,000 | — | ||||||
| Proceeds from notes payable | 38,000 | — | ||||||
| Principal repayments on notes payable | (54,117 | ) | (49,680 | ) | ||||
| Proceeds from notes payable – related parties | 100,266 | 2,744 | ||||||
| Principal repayments on notes payable - related parties | (31,278 | ) | (24,895 | ) | ||||
| Proceeds from common stock and warrant issuances | — | 63,500 | ||||||
| Net cash provided by financing activities | 1,002,871 | 115,709 | ||||||
| Net decrease in cash and cash equivalents | (240,162 | ) | (316,584 | ) | ||||
| Cash and cash equivalents, beginning of period | 316,596 | 525,181 | ||||||
| Cash and cash equivalents, end of period | $ | 76,434 | $ | 208,597 | ||||
| Supplemental cash flow disclosures: | ||||||||
| Cash paid for interest | $ | 60,983 | $ | 29,591 | ||||
| Cash paid for income taxes | $ | — | $ | — | ||||
| Non-cash investing and financing activities: | ||||||||
| Common stock issued for subscription receivables | $ | — | $ | 4,950 | ||||
| See accompanying notes to the condensed financial statements. | ||||||||
5
Crosscode, Inc.
Notes to Condensed Financial Statements
(Unaudited)
NOTE 1 – ACCOUNTING POLICIES
THE COMPANY
Crosscode, Inc. (the “Company”) was incorporated in Delaware on October 20, 2015. The Company has developed a proprietary system to provide detailed reports on the information technology (“IT”) impact of business process changes across a set of heterogeneous IT systems across the entire enterprise. The Company has created a new generation and genre of IT management solution tools.
BASIS OF PRESENTATION
The accompanying unaudited financial statements for periods ended September 30, 2018 and 2017 have been prepared in accordance with accounting principles generally accepted in the United States of America (“GAAP”) for interim financial information, the instructions to Form 10Q and Article 8 of Regulation S-X. The financial statements do not include all of the information and notes required by GAAP for complete financial statements. In the opinion of management, all adjustments (consisting of normal accruals) considered for a fair presentation have been included. These unaudited condensed financial statements should be read in conjunction with the audited financial statements of the Company for the year ended December 31, 2017 and notes thereto contained in the Company’s Annual Report on Form S-1 filed to the SEC on November 1, 2018.
USE OF ESTIMATES
Management uses estimates and assumptions in preparing financial statements in conformity with GAAP. Those estimates and assumptions affect the reported amounts of assets and liabilities, the disclosure of contingent assets and liabilities, and the reported revenues and expenses. Actual results and outcomes may differ from management’s estimates and assumptions.
REVENUE RECOGNITION
Revenue is recognized when control for the services or products is transferred to the Company’s customers, in an amount that reflects the consideration the Company expects to be entitled to in exchange for products and services.
The Company generates subscription revenues from fees that provide the customers access to the software-as-a-service product and services. The Company recognizes the revenue from these products and services on a ratable basis over the contract term beginning on the date the software-as-a-service product is made available to the customer. Our Master Software-as-a-Service Agreement generally range from one to three years, are billed annually in advance, and are non-cancellable. As a result, we record deferred revenue (contract liability) and accounts receivable for any amounts for which we have a right to invoice but for which product has not been made available to the customers, or services have not been provided.
Accounts receivable from our subscription customers are typically due upon invoicing. An allowance for doubtful accounts is provided based on a periodic analysis of individual account balances, including an evaluation of days outstanding, payment history, recent payment trends, and our assessment of our customers’ creditworthiness. The Company mitigates our exposure to credit losses from our subscriptions customers by discontinuing services in the event of non-payment; accordingly, the related allowance for doubtful accounts and associated bad debt expense has not been significant.
CASH AND CASH EQUIVALENTS
The Company considers all highly liquid short-term investments purchased with an original maturity of three months or less to be cash equivalents. These investments are carried at cost, which approximates fair value due to the short term nature of the financial instruments.
The Company maintains cash balances in insured financial institutions. From time to time, balances may exceed amounts insured by the Federal Deposit Insurance Corporation. At September 30, 2018 and December 31, 2017, the Company’s cash in excess of the federally insured limit was $0 and $66,596, respectively. Historically, the Company has not incurred any losses related to cash balances.
RECEIVABLES
Trade accounts receivable are stated at the amount management expects to collect from outstanding balances. Management provides for probable uncollectable amounts through a charge to earnings and a credit to the allowance for doubtful account based on its assessment of the current status of individual accounts. Balances that remain outstanding after management has used reasonable collection efforts are written off through a charge to the allowance for doubtful account and a credit to trade accounts receivable.
6
The other receivables are amounts due from a state agency for an excess tax payment made.
ADVERTISING
The Company expenses advertising costs as they are incurred.
PROPERTY AND EQUIPMENT
Property and equipment are recorded at cost and depreciated using the straight-line basis method over the estimated economic useful life of the related assets. Maintenance and repair are charged to operations as incurred, major renewals and betterments are capitalized. When items of property and equipment are sold or retired, the related costs and accumulated depreciation are removed from the accounts and any gain or loss is included in the results of operations.
Property and equipment are depreciated by major classification of assets according to the following useful lives:
| Computer Equipment | 5 Years |
| Computer Software | 3 Years |
| Furniture and Equipment | 7 Years |
INTANGIBLE ASSETS
Intangible assets are amortized using the straight-line method over their estimated period of benefit, ranging from one to fifteen years. We evaluate the recoverability of intangible assets periodically and take into account events or circumstances that warrant revised estimates of useful lives or that indicate that impairment exists. All of our intangible assets are subject to amortization. No impairment of intangible assets has been identified during any of the periods presented. Intangible assets are amortized according to the following useful lives:
| Domain Crosscode.com | 15 Years |
SOFTWARE DEVELOPMENT COSTS
Software development costs are expensed as incurred until technological feasibility has been established, at which time such costs are capitalized until the product is available for general release to customers. Capitalized software development costs are amortized over a 36-month period once the product becomes available for general release.
DEBT ISSUANCE COSTS
The Company capitalizes debt issuance costs and presents as an offset to the loan principal liability account, which is amortized as interest expense over the term of the loan.
INCOME TAXES
An asset and liability approach is used for financial accounting and reporting for income taxes. Deferred income taxes arise from temporary differences between income tax and financial reporting and principally relate to recognition of revenue and expenses in different periods for financial and tax accounting purposes and are measured using currently enacted tax rates and laws. In addition, a deferred tax asset can be generated by net operating loss carryforwards (“NOLs”). If it is more likely than not that some portion or all of a deferred tax asset will not be realized, a valuation allowance is recognized.
In the event the Company is charged interest or penalties related to income tax matters, the Company would record such interest as interest expense and would record such penalties as other expense in the statement of operations. No such charges have been incurred by the Company. As of September 30, 2018 and December 31, 2017, the Company has no accrued interest related to uncertain tax positions.
EARNINGS PER SHARE
Basic earnings (loss) per common share are computed by dividing net income (loss) available to common shareholders by the weighted-average number of common shares outstanding during the period. Diluted earnings (loss) per common share is determined using the weighted-average number of common shares outstanding during the period, adjusted for the dilutive effect of common stock equivalents. In periods when losses are reported, the weighted-average number of common shares outstanding excludes common stock equivalents, because their inclusion would be anti-dilutive. As of September 30, 2018, there were no common stock equivalents At December 31, 2017 there were warrants to purchase 2,000,000 shares of the Company’s common stock which expired without being exercised.
SUBSEQUENT EVENTS
The Company has evaluated all transactions from September 30, 2018 through the date that the financial statements were issued for subsequent event disclosure consideration.
7
NEW ACCOUNTING PRONOUNCEMENTS
The Company plans to adopt the new lease accounting standard, Leases (ASC 842) effective for the Company beginning January 1, 2019. The Company has no lease obligations as of September 30, 2018.
There were various accounting standards and interpretations issued recently, none of which are expected to a have a material impact as a whole on our consolidated financial position, operations or cash flows.
NOTE 2 – GOING CONCERN
The accompanying financial statements have been prepared assuming that the Company will continue as a going concern, which contemplates the realization of assets and the satisfaction of liabilities in the normal course of business for the twelve-month period following the issuance of these financial statements. As shown in the accompanying financial statements, the Company incurred accumulated losses of $2,049,261 from inception through September 30, 2018, and had a net working capital deficiency of $1,603,055. These conditions raise substantial doubt as to the Company’s ability to continue as a going concern. These financial statements do not include any adjustments that might be necessary if the Company is unable to continue as a going concern. Management plans to raise additional funds through public or private sales of equity or debt securities or from bank or other loans.
NOTE 3 – REVENUE
In August 2018, the Company entered into a software service agreement for $25,000 that met all revenue recognition requirements. The agreement is for a one-year service period. During the three months ended September 30, 2018 the Company recognized $3,495 of revenue , and recorded deferred revenue of $21,505 at September 30, 2018.
8
NOTE 4 – PROPERTY AND EQUIPMENT
The Company’s property and equipment at September 30, 2018 and December 31, 2017 consisted of the following:
| September 30, 2018 |
December 31, 2017 | |||||||
| Furniture and equipment | $ | 8,400 | $ | 8,400 | ||||
| Computer equipment and software | 30,811 | 30,811 | ||||||
| Property and equipment, at cost | 39,211 | 39,211 | ||||||
| Accumulated depreciation | (27,067 | ) | (22,368 | ) | ||||
| Property and equipment, net | $ | 12,144 | $ | 16,843 | ||||
For the three and nine months ended September 30, 2018 and 2017, depreciation expense was $1,566 and $2,052, and $4,699 and $6,044, respectively.
NOTE 5 – CAPITALIZED SOFTWARE DEVELOPMENT COSTS
The Company’s capitalized development costs at September 30, 2018 and December 31, 2017 consisted of the following:
| September 30, 2018 |
December 31, 2017 | |||||||
| Capitalized software development costs | $ | 355,891 | $ | 355,891 | ||||
| Accumulated amortization | (118,625 | ) | (29,656 | ) | ||||
| Capitalized software development costs, net | $ | 237,266 | $ | 326,235 | ||||
For the three and nine months ended September 30, 2018 and 2017, amortization expense was $29,656 and $0, and $88,968 and $0, respectively.
NOTE 6 – INTANGIBLES
The Company’s intangible assets at September 30, 2018 and December 31, 2017 consisted of the following:
| September 30, 2018 |
December 31, 2017 | |||||||
| Intangible assets | $ | 8,200 | $ | 8,200 | ||||
| Accumulated amortization | (1,230 | ) | (820 | ) | ||||
| Intangibles, net | $ | 6,970 | $ | 7,380 | ||||
For the three and nine months ended September 30, 2018 and 2017, amortization of the intangible assets was $137 and $137, and $410 and $410, respectively.
9
NOTE 7 – LINE OF CREDIT
On November 6, 2017, the Company entered into a line of credit agreement with Wells Fargo for up to $500,000. The interest rate is equal to 0.25% above the prime rate in effect, accrued and payable monthly. The prime rate at September 30, 2018 and December 31, 2017 was 5% and 4.5%, respectively. Accrued interest as of September 30, 2018 and December 31, 2017 was $911 and $839, respectively. The agreement includes a maturity date of November 5, 2020. The outstanding balance on September 30, 2018 and December 31, 2017 was $250,000. The line of credit is secured by a personal guarantee by the Company’s CEO, Aditya Sharma.
On April 13, 2018, the Company entered into a business line of credit loan agreement for $950,000 from Charter Bank. Interest accrues at a fixed rate of 4.816% per annum. Maturity date is April 30, 2020. On September 30, 2018, the outstanding balance was $950,000. The agreement includes certain covenants including providing the bank with quarterly financial statements within 30 days of quarter end. The Company has not provided these financials timely and are in violation of this covenant. The line of credit is secured by a personal guarantee by the Company’s CEO, Aditya Sharma.
NOTE 8 – NOTES PAYABLE
Total notes payable at September 30, 2018 and December 31, 2017 consisted of the following:
| September 30, 2018 | December 31, 2017 | |||||||
| Third parties | ||||||||
| Notes payable – bank (a) | $ | 205,106 | $ | 256,426 | ||||
| Notes payable – bank (e), net of unamortized issuance cost of $1,900 and $0 | 35,403 | — | ||||||
| Subtotal | 240,509 | 256,426 | ||||||
| Less current portion of notes payable | (77,494 | ) | (68,705 | ) | ||||
| Notes payable, net of current portion | $ | 163,015 | $ | 187,721 | ||||
| Related parties | ||||||||
| Due to officer (b) | $ | 31,626 | $ | 35,244 | ||||
| Note payable – related parties (d) | 50,000 | — | ||||||
| Notes payable – related parties (c) | 237,010 | 264,404 | ||||||
| Note payable – related parties (f) | 50,000 | — | ||||||
| Subtotal | 368,636 | 299,648 | ||||||
| Less current of notes payable – related parties | (171,473 | ) | (72,249 | ) | ||||
| Notes payable – related parties, net of current portion | $ | 197,163 | $ | 227,399 | ||||
| (a) | The Company borrowed $350,000 from a bank on July 21, 2016. Interest accrues at 3.25% per annum. Monthly principal and interest payments are in the amount of $6,336. Maturity date is July 21, 2021. The note is secured by a personal guarantee by the CEO, Aditya Sharma, by way of a secured personal CD for $350,000 maintained by the bank. |
| (b) | During 2016, the Company’s CEO, Aditya Sharma, loaned the Company $32,500 to cover short-term operating cash requirements. Interest accrues at 2.49% per annum. The amount increased to $35,244 during 2017, and to $35,511 at March 30, and decreased to $31,626, which is the balance at September 30, 2018. Accrued interest at September 30, 2018 and December 31, 2017 was $1,947 and $1,286 respectively. Maturity date is December 31, 2018. |
| (c) | During 2016, the Company issued a note payable in the principal amount of $309,745 to a related party, which is a family member of the CEO. Interest accrues at 9.90% per annum. Monthly principal, interest, and insurance payments are in the amount of $5,290. The long-term note payable balance includes a contra offset amount of $6,750, which represents a reimbursable service fee. This reimbursable service fee represents an amount that was withheld upon the issuance and will be refunded when the note is paid in full, and was recorded as a contra liability. Maturity date is November 1, 2023. The note is secured by a personal guarantee by the Company’s CEO. |
| (d) | On March 20, 2018, the Company issued a note payable in the principal amount of $50,000 to a related party, which is a family member of the CEO. Interest accrues at 6.0% per annum. The loan will mature in one-year from issuance date and may be repaid anytime over a one-year period with no monthly installments necessary. |
10
| (e) | On April 4, 2018, the Company borrowed $40,000 from a bank. Interest accrues at 7.25% per annum. Monthly principal and interest payments are in the amount of $798. Maturity date is April 4, 2023. |
| (f) | On September 28, 2018, the Company issued a note payable in the principal amount of $50,000 to a related party, which is a family member of the CEO. Interest accrues at 6.0% per annum. The loan will mature in one-year from issuance date and may be repaid anytime over a one-year period with no monthly installments necessary. |
Future maturities of notes payable were as follows as of September 30, 2018:
| For the year ending December 31, | Third Parties | Related Parties | Total | |||||||||||
| Remaining 2018 | 19,117 | 9,611 | 28,728 | |||||||||||
| 2019 | 78,197 | 172,465 | 250,662 | |||||||||||
| 2020 | 81,071 | 45,016 | 126,087 | |||||||||||
| 2021 | 51,778 | 49,735 | 101,513 | |||||||||||
| 2022 and thereafter | 10,346 | 91,809 | 102,155 | |||||||||||
| Total | $ | 240,509 | $ | 368,636 | $ | 609,145 | ||||||||
NOTE 9 – INCOME TAXES
At September 30, 2018 and December 31, 2017, the Company’s deferred tax assets consisted of principally net operating loss carry forwards. The material reconciling items between the tax benefit computed at the statutory rate and the actual benefit recognized in the financial statements consisted of a temporary difference related to capitalized development costs and the change in the valuation allowance during the applicable period. The Company has recorded a 100% valuation allowance as management is uncertain that the Company will realize the deferred tax assets.
As of September 30, 2018, the Company had net operating loss carry forward of approximately $2,000,000, which will expire beginning in 2036.
The tax years 2015 through 2017 remain open to examination by the major taxing jurisdictions to which the Company is subject.
On December 22, 2017, new federal tax reform legislation was enacted in the United States (the “2017 Tax Act”), resulting in significant changes from previous tax law. The 2017 Tax Act reduces the federal corporate income tax rate to a flat rate of 21%, from a graduated rate structure with a top rate of 35%, effective January 1, 2018. The reduction of the corporate tax rate caused the Company to reduce its deferred tax assets to the lower federal base rate and adjust the allowance against the deferred tax asset by the same amount. The Company has a full allowance against the deferred tax asset and as a result there was no impact to income tax expense for the periods ended September 30, 2018.
NOTE 10 – EQUITY
Changes to Stockholder’s Deficit
| Additional | ||||||||||||||||||||
| Common Stock | Paid-In | Accumulated | ||||||||||||||||||
| Shares | Par | Capital | Deficit | Total | ||||||||||||||||
| Balance at January 1, 2018 | 59,909,996 | $ | 59,910 | $ | 327,498 | $ | (743,444 | ) | $ | (356,036 | ) | |||||||||
| Net loss | (1,350,817 | ) | (1,350,817 | ) | ||||||||||||||||
| Balance at September 30, 2018 | 59,909,996 | $ | 59,910 | $ | 327,498 | $ | (2,094,261 | ) | $ | (1,706,853 | ) | |||||||||
Common Stock
At September 30, 2018, the Company was authorized to issue 100,000,000 shares of its common stock with a par value of $0.001 per share.
As of September 30, 2018, there were 59,909,996 shares of common stock outstanding.
Warrants
On April 11, 2018, warrants to purchase 2,000,000 shares of the Company’s common stock expired without being exercised.
11
NOTE 11 – COMMITMENTS AND CONTINGENCIES
On December 7, 2016, the Company entered into a financing arrangement with Merchant Credit and Guarantee Corporation Ltd. (“MCGC”), where MCGC would seek to arrange financing for the Company in the amount of $3,000,000. As part of the arrangement, the Company incurred origination/earnest fees in the amount of $40,000.
In April 2017, the Company filed a lawsuit against MCGC for breach of contract. On August 29, 2017, the Fourth Judicial District Court issued a Notice of Entry and Docketing of Judgment in favor of the Company, where the Company was awarded $35,699 . This amount includes costs and interest incurred. As of the financial statement issuance date, this amount has not yet been collected.
In April 2018, the Board authorized the Chairman, Mr. Aditya Sharma, to use his personal funds to secure a personal loan under his credit for an amount of $300,000 to be used as part of the collateral for the Charter Bank loan (see Note 6). The board agreed to have the Company pay principal and interest and other cost for the personal loan on behalf of Mr. Sharma, and record these amounts as compensation expense to Mr. Sharma. Compensation for the three and nine months ended September 30, 2018 was $24,515 and $32,707, respectively.
From time to time, the Company is involved in routine litigation that arises in the ordinary course of business. There are no pending significant legal proceedings to which the Company is a party for which management believes the ultimate outcome would have a material adverse effect on the Company’s financial position.
NOTE 12 – SUBSEQUENT EVENTS
On October 5, 2018, the Company issued a note payable in the principal amount of $200,000 to a related party, which is a family member of the CEO. Interest accrues at 6% per annum. The Company borrowed an initial amount of the note of $50,000 on October 9, 2018. The loan will mature in one-year from issuance date and may be repaid anytime over a one-year period with no monthly installments necessary.
On October 29, 2018, the Company borrowed an additional amount of 50,000 of the $200,000 note payable dated October 5, 2018, to a related party, which is a family member of the CEO. Interest accrues at 6.0% per annum. The loan will mature in one-year from issuance date and may be repaid anytime over a one-year period with no monthly installments necessary.
On November 1, 2018, the Company borrowed $25,000 from Celtic Bank. Interest accrues at 1.2% with payment terms of 26 weekly installments. Terms also include a 1.2% draw fee.
On November 5, 2018, the Company issued a promissory note in the principal amount of $25,000 to Prosper. Interest accrues at 16.84% with payment terms of 59 monthly installments.
On November 13, 2018, the Company borrowed an additional $35,000 from Celtic Bank. Interest accrues at 1.2% with payment terms of 26 weekly installments. Terms also include a 2.4% draw fee.
On November 23, 2018, the Company borrowed $33.900 from Kabbage . Maturity date is November 23, 2019. Interest accrues at 21%, with payments of $3,673 for the first six months $3,164 for the second six months.
On December 5, 2018, the Company borrowed an additional amount of 50,000 of the $200,000 note payable dated October 5, 2018, to a related party, which is a family member of the CEO.. Interest accrues at 6.0% per annum. The loan will mature in one-year from issuance date and may be repaid anytime over a one-year period with no monthly installments necessary.On December17, 2018, the Company borrowed an additional amount of 50,000 of the $200,000 note payable dated October 5, 2018, to a related party, which is a family member of the CEO. Interest accrues at 6.0% per annum. The loan will mature in one-year from issuance date and may be repaid anytime over a one-year period with no monthly installments necessary.
On January 4, 2019, the Company issued a note payable in the principal amount of $25,000 to a related party, which is a family member of the CEO. Interest accrues at 6% per annum. The loan will mature in one-year from issuance date and may be repaid anytime over a one-year period with no monthly installments necessary.
On January 11, 2019, the Company issued a note payable in the principal amount of $25,000 to a related party, which is a family member of the CEO. Interest accrues at 6% per annum. The loan will mature in one-year from issuance date and may be repaid anytime over a one-year period with no monthly installments necessary.
12
| ITEM 2. | MANAGEMENT’S DISCUSSION AND ANALYSIS OF FINANCIAL CONDITION AND RESULTS OF OPERATIONS |
The discussion in our MD&A and elsewhere in this Form 10-Q contains trend analyses and other forward-looking statements within the meaning of Section 27A of the Securities Act of 1933 and Section 21E of the Securities Exchange Act of 1934. Forward-looking statements are any statements that look to future events and consist of, among other things, our business strategies, including those discussed in “Strategy” and “Overview of the Three and Nine months ended September 30, 2018 and 2017” below, future net revenue, operating expenses, recurring revenue, annualized recurring revenue, annualized revenue per subscription, other future financial results (by product type and geography) and subscriptions, the effectiveness of our restructuring efforts, the effectiveness of our efforts to successfully manage transitions to new business models and markets, our expectations regarding the continued transition of our business model, expectations for our maintenance plan and subscription plan subscriptions, our ability to increase our subscription base, expected market trends, including the growth of cloud and mobile computing, the effect of unemployment, the availability of credit, our expectations for our restructuring, the effects of global economic conditions, the effects of revenue recognition, the effects of recently issued accounting standards, expected trends in certain financial metrics, including expenses, the impact of acquisitions and investment activities, expectations regarding our cash needs, the effects of fluctuations in exchange rates and our hedging activities on our financial results, our ability to successfully expand adoption of our products, our ability to gain market acceptance of new business and sales initiatives, the impact of acquisitions, the impact of economic volatility and geopolitical activities in certain countries, particularly emerging economy countries, the timing and amount of purchases under our stock buy-back plan, and the effects of potential non-cash charges on our financial results and the resulting effect on our financial results. In addition, forward-looking statements also consist of statements involving expectations regarding product capability and acceptance, remediation to our controls environment, statements regarding our liquidity and short-term and long-term cash requirements, as well as statements involving trend analyses and statements including such words as “may,” “believe,” “could,” “anticipate,” “would,” “might,” “plan,” “expect,” and similar expressions or the negative of these terms or other comparable terminology. These forward-looking statements speak only as of the date of this Quarterly Report on Form 10-Q and are subject to business and economic risks. As such, our actual results could differ materially from those set forth in the forward-looking statements as a result of a number of factors, including those set forth below in Part II, Item 1A, “Risk Factors,” and in our other reports filed with the U.S. Securities and Exchange Commission. We assume no obligation to update the forward-looking statements to reflect events that occur or circumstances that exist after the date on which they were made, except as required by law.
MANAGEMENT’S DISCUSSION AND ANALYSIS OF FINANCIAL CONDITION AND RESULTS OF OPERATIONS
Cautionary Statement Regarding Forward-Looking Information
The statements in this report that are not reported financial results or other historical information are “forward-looking statements” within the meaning of the Private Securities Litigation Reform Act of 1995, as amended. These statements appear in a number of different places in this report and can be identified by words such as “estimates”, “projects”, “expects”, “intends”, “believes”, “plans”, or their negatives or other comparable words. Also look for discussions of strategy that involve risks and uncertainties. Forward-looking statements include, among others, statements regarding our business plans and availability of financing for our business.
You are cautioned that any such forward-looking statements are not guarantees and may involve risks and uncertainties. Our actual results may differ materially from those in the forward-looking statements due to risks facing us or due to actual facts differing from the assumptions underlying our estimates. Some of these risks and assumptions include those set forth in reports and other documents we have filed with or furnished to the United States Securities and Exchange Commission (“SEC”). We advise you that these cautionary remarks expressly qualify in their entirety all forward-looking statements attributable to us or persons acting on our behalf. Unless required by law, we do not assume any obligation to update forward-looking statements based on unanticipated events or changed expectations. However, you should carefully review the reports and other documents we file from time to time with the SEC.
13
Presentation of Information
As used in this quarterly report, the terms "we", "us", "our" and the “Company” mean Crosscode, Inc., unless the context requires otherwise.
All dollar amounts in this quarterly report refer to US dollars unless otherwise indicated.
| Business |
Crosscode, Inc. was incorporated in the State of Delaware on October 20, 2015.
| Overview |
The Company has developed a proprietary system to provide detailed reports on the information technology (“IT”) impact of business process changes across a set of heterogeneous IT systems across the entire enterprise. The Company has created a new generation and genre of IT management solution tools.
Large organizations typically have a defined number of business (or capability) domains that are decomposed into many business processes implemented by people and thousands of IT assets – applications, data and infrastructure. Large reengineering efforts, or even small changes in business processes require touching hundreds or thousands of lines of code. And changing these lines of code potentially affect other processes and business services in the organization. There is no single panoptic map of what depends on what.
The impact of this situation is that analysis of what must be changed and what impact the change will have in itself takes as much as 50% and up to 70% of any enterprise business transformation project. After this analysis is complete, the coding and testing itself is very straightforward. Crosscode’s Enterprise technology creates such a map and uses it to be able to perform such analysis as the touch of a button. Beyond the dramatic cost savings that this will provide, it opens up a vista of being able to do instant detailed “what if” scenarios for IT and enterprise planning. We call, this “single pane of glass” view the panoptic view.
Enterprise IT Tool Landscape
A comprehensive “enterprise platform” would work to enable and manage business and technology change. The “holy grail” is to be able to flexibly and rapidly design, build, implement and execute new business strategies, capabilities and processes and to drive innovation throughout the organization by combining existing systems, while maintaining a sustainable cost structure.
And, this is no small ideal – organizations that effectively align technology with business goals and capabilities achieve competitive advantage. Everyone is racing to achieve faster time-to-value by driving compatibility across the application infrastructure by spending vast sums of money on ‘silver bullets’ such as open standards and various techniques and technologies such as service-oriented architecture “SOA”, modernizing monolithic business applications into more nimble “microservices” based architectures, migrating to the cloud, business process management systems “BPMS”, application integration with enterprise service busses “ESB” and delivering insight with business intelligence “BI” tools.
A Better Way
Almost all enterprise architects considering their road map in terms of modeling the business based on its processes. Business processes describe how an organization performs, or implements its capabilities. The thinking is that the development of a business-process model would facilitate the alignment of IT with the business, which would be achieved by describing the business specifications for processes synchronized with the corresponding technical framework.
But, more recently, a new approach has emerged to challenge that thinking. Business-capability mapping is the process of modeling what a business does to reach its objectives (its capabilities), instead of how it does it (its business processes). The goal of this approach is to model the business on its most stable elements.
While the way in which a business implements its processes is likely to change frequently, the basic capabilities of a business tend to remain more or less constant. For example, "Provision Service," "Activate Service," and "Generate Bill" are capabilities that a Phone Company, for example, would maintain over many years. The Hows of those capabilities, however, change dramatically over time. The "Activate Service" may once have required a truck dispatched to a customer's home. But, for a new VoIP service, activation could occur completely online with the customers installing their own equipment. The Whats remained the same; the How continuously changes, as new technologies and offerings are introduced.
14
The advantage of a model that is based on the most stable elements of the business is its longevity. Changes to how capabilities are implemented do not change the base model. A stable business model means good things for the IT infrastructure that supports it. Therefore, business-capability mapping promotes a strong relationship between the business model and the technical infrastructure that supports the business requirements, resulting in a view of the business model that can be understood by both the business and IT. Capabilities are defined and tied to business strategy. Architecture is aligned with those capabilities and thus, to the business strategy.
Beyond the immediate benefit of this new way of viewing Business Architectures, Crosscode’s tools bring a supplemental significant benefit. Today, whenever any of the Hows are changed, determining the impact is an extensive process consuming time and money to manually work through. With Crosscode, this is easily done automatically in minutes. A series of activities must take place to reach this Holy Grail of a flexible, adaptable architecture that can respond quickly to changes in the business. While there are variations in approach to business-capability mapping, the high-level view of these activities looks like the following:
| 1) | Determine the business architecture. |
| a) | Document the top-level capabilities of the business. |
| b) | Add next-level capabilities, and refine. |
| c) | Develop common semantics for operational terms across the business. |
| d) | Document the relationships between the capabilities. |
| 2) | Align the technical architecture to the business architecture by mapping the business capabilities and processes to the IT assets (applications and data). |
After a stable business architecture is modeled, its implementation in terms of a technical architecture can begin. Aligning IT with stable business requirements provides an opportunity to maximize the architecture's adaptability and longevity. To an architect, a model that describes the business's capabilities in detail provides a good understanding of what the business expects in terms of service-level agreements “SLAs” for those capabilities. The architect can use that model to determine the best implementation to deliver those capabilities in each of their contexts.
The lack of an appropriate enterprise architecture management methodology and supporting tools manifest themselves in several ways:
| ■ | No map: Business owners are forced to react daily to changing business and competitive conditions. Yet, IT cannot quickly tell them what it will take to make a desired change, or to even brainstorm meaningfully about time-money trade-offs by providing a set of what-if scenarios. Enterprise adaptability suffers. Further, when the change is approved, the detailed manual exploration then takes well over half of the project implementation time because IT does not have either a tool or an automated framework that can quickly highlight the impact of a business change to the thousands of assets within the enterprise |
| ■ | Viewed with the wrong lens: By focusing on processes instead of capabilities, the result is systems that seem as if they are designed to break with the slightest change of requirements. |
| ■ | Aimed at the wrong thing: Technical tools are, by nature, designed to solve technical problems such as making Application A talk to Application B. An ESB or SOA may solve some technical problems, but they do not help achieve business alignment. |
15
Market Size

We have relied on data and information published by Gartner via their Global IT spend reports available for purchase and available for free as abstracts on the global spend on IT and the projected growth for subsequent years.
Source: Gartner Market Data Book. [1]
Crosscode’s ultimate goal is to collapse the 50% manual analysis component of the $1.45 trillion
IT services spend by 90%. To the industry this would represent an IT service spend savings of up to $650 billion annually, globally.[2],[3]
However, there are no assurances that the Company will be able to successfully execute and achieve its objectives in the
aforementioned timeline if ever. As previously discussed, there remain significant obstacles for companies of our scale and scope
to effectively compete and gain market share.

| 2016 | 2017 | 2018 | 2019 | 2020 | |
| Growing, Pent-up, Global Market Need | $725B | $761B | $800B | $840B | $1,100B |
Crosscode has determined that nearly every company that has over $5 million in annual IT spend, which is many or most companies with an annual revenue of over $100 million, is likely to have IT projects of a size that they would benefit greatly from Crosscode’s product. The Company’s initial focus will be on companies of greater than $2 billion in annual revenue (the Fortune 1000), initially attempting to attain dominance in the healthcare, banking/finance, manufacturing, telecommunications, retail and government sectors.
16
| ■ | United States – Large Enterprise Offering: There are over 22,000 companies above $100 million in annual revenue in the United States. About 2,000 of them are above $1 billion in annual revenue. The average early large enterprise engagement yields Crosscode between $500,000 and about $1 million in top line revenue from licensing and services, making the top-tier total available US market for Crosscode’s offering worth just over US$1 billion to the Company and the lower layer of that top tier worth up to an incremental US$10 billion to the Company. Crosscode’s list price for these customers at $350,000 per customer, per year fixed licensing pricing point as well as a SaaS based subscription model per server is designed to facilitate rapid market adoption by streamlining the negotiating process and by making a compelling value proposition for the Fortune 2000. Crosscode Panoptics is already available for the enterprise customers and the Company has signed its first enterprise customer for this offering. |
| ■ | United States – Self-service SaaS Offering: Crosscode’s goal is to create market awareness and demand in mid-tier companies by removing dependency of new customers on Crosscode’s direct implementation involvement. To that end, the Company aims to offer a lower-priced, conveniently packaged, per server per month SaaS offering delivered over the cloud. Priced at between $100 and $200 per server per month, If successfully delivered, Crosscode estimates this market to be a significant contributor to the Company’s revenues. Crosscode Panoptics is already available via this offering as well and the Company has signed its first customers for this offering also. | |
| ■ | Europe & Asia: Crosscode needs to expand its operations in Europe and several countries throughout Asia. Early research indicates that each of these regions represent market opportunity slightly larger than that in the United States alone. The Company is currently engaged in negotiating its first international contracts in both Europe and Asia and although the Company is currently planning on international presence in these markets, we cannot state with any degree of certainty that we will be successful in such endeavors. |
Summary
| Market Size According to “Percentage of Value” | |
| Global Market Need | Market growing from US$750 billion to US$1,110 billion in 5 years |
| North America Enterprise | $35 billion |
| North American Self-service | |
| South America | $8.75 billion |
| Europe | $43.75 billion |
| Asia | $35 billion |
| Total | $122.5 billion |
The Crosscode Panoptic Suite
| Overview |
Having no detailed business capabilities and enterprise dependency map leads to conversations like these:
■ Why does this button cost a million dollars to build?
■ We need to go to market in two quarters. Why does a small feature take so long to deliver?
■ How much detail do you need to build something?
17
■ We’ve already provided volumes of documents!
■ I can’t wait for other groups in the firm to agree to a path forward. Why not build for us and then add on stuff for others?
■ Each BU wants different changes to the same thing at different times.
■ All business needs are urgent – we are drowning in unnecessary technical debt
■ Business is incapable of thinking through the implications of their “small tweaks”
■ 80% of what we do is rework because business keeps shifting requirements on us
IT appears non-responsive to business owners and the average IT project routinely exceeds its schedule and budget – or fails. Over 50%, and up to 70% of project time is spent on creating a map that is only good for that project and good for only a brief time. All of these problems exist because of the lack of the right mapping methodology and right supporting tools.
Crosscode’s Panoptic Suite solves these problems.
Crosscode has introduced an enterprise grade technology with the goal to enable large organizations to make business changes and understand the impact and analysis at the code level to the multiple applications in the enterprise. Crosscode aims to empower large enterprises to change their technical architecture in “real time” and understand the impact to the IT Assets (applications, databases) at the code level, thereby reducing the time and cost on identifying and analyzing the impact of business change by 50% to 70%.
We believe that Crosscode is the industry’s first enterprise grade software solution that maps all the applications and databases in an enterprise at the code levels and creates a powerful dependency map.
The technology has powerful architectural analytical capabilities which analyzes the impact from an architectural standpoint and instantly provides architectural insights:
■ The list of applications and databases impacted by making changes anywhere in the enterprise
■ Application code and database field level impact within each impacted application and database
■ Lines of code and data fields impacted by the business change
■ Governance at the code levels to ensure vulnerabilities are not created in systems during the time of development
How it Works
The current version of Crosscode Panoptic Suite includes the following modules:
| ■ | Enterprise Dependency Maps. Creates a detailed map of all applications and databases with their dependencies mapped down to the application code and database field levels. |
| ■ | Enterprise Decomposition Modeler. Decompose each application to the code levels and see which piece of application or database “talks” to which code and field across the enterprise. |
| ■ | Enterprise Impact Assessment Analyzer. Supports both creating “what if” scenarios during planning sessions, as well as creating a detailed project “punch list” for making any approved changes. Submitting a change via this module, will generate analysis at the code level across the enterprise. | |
| ■ | Governance Operating System: Allows users to define governance frameworks and rules to block vulnerabilities in the systems during the development process, and also to ensure the developers follow the defined frameworks and rules defined by the organizations. |
We have entered into sales agreements with several US corporations and are also negotiating contracts with non-US based corporations. Starting in calendar year 2019, we aim to expand to international markets as conditions warrant with formal presence and staff. There are however no guarantees we will be able to scale our business beyond domestic markets during such time period if ever.
18
Our value proposition is to empower mid to large size corporations achieve significant cost reductions and better prepare IT changes. Our success however depends on our ability to introduce and continually innovate our product offering to effectively compete and offer compelling products to our customers as well as create effective barriers to entry for potential new competitors.
Comparison to the State of the Art in Today’s Enterprise IT Toolkit
Crosscode’s Solution is based on a new over-arching paradigm. It doesn’t replace any enterprise tools, but it envelopes those tools into an umbrella context – a more transparent, manageable and holistic context.
Crosscode Panoptic Suite vs. State-of-Enterprise Tooling
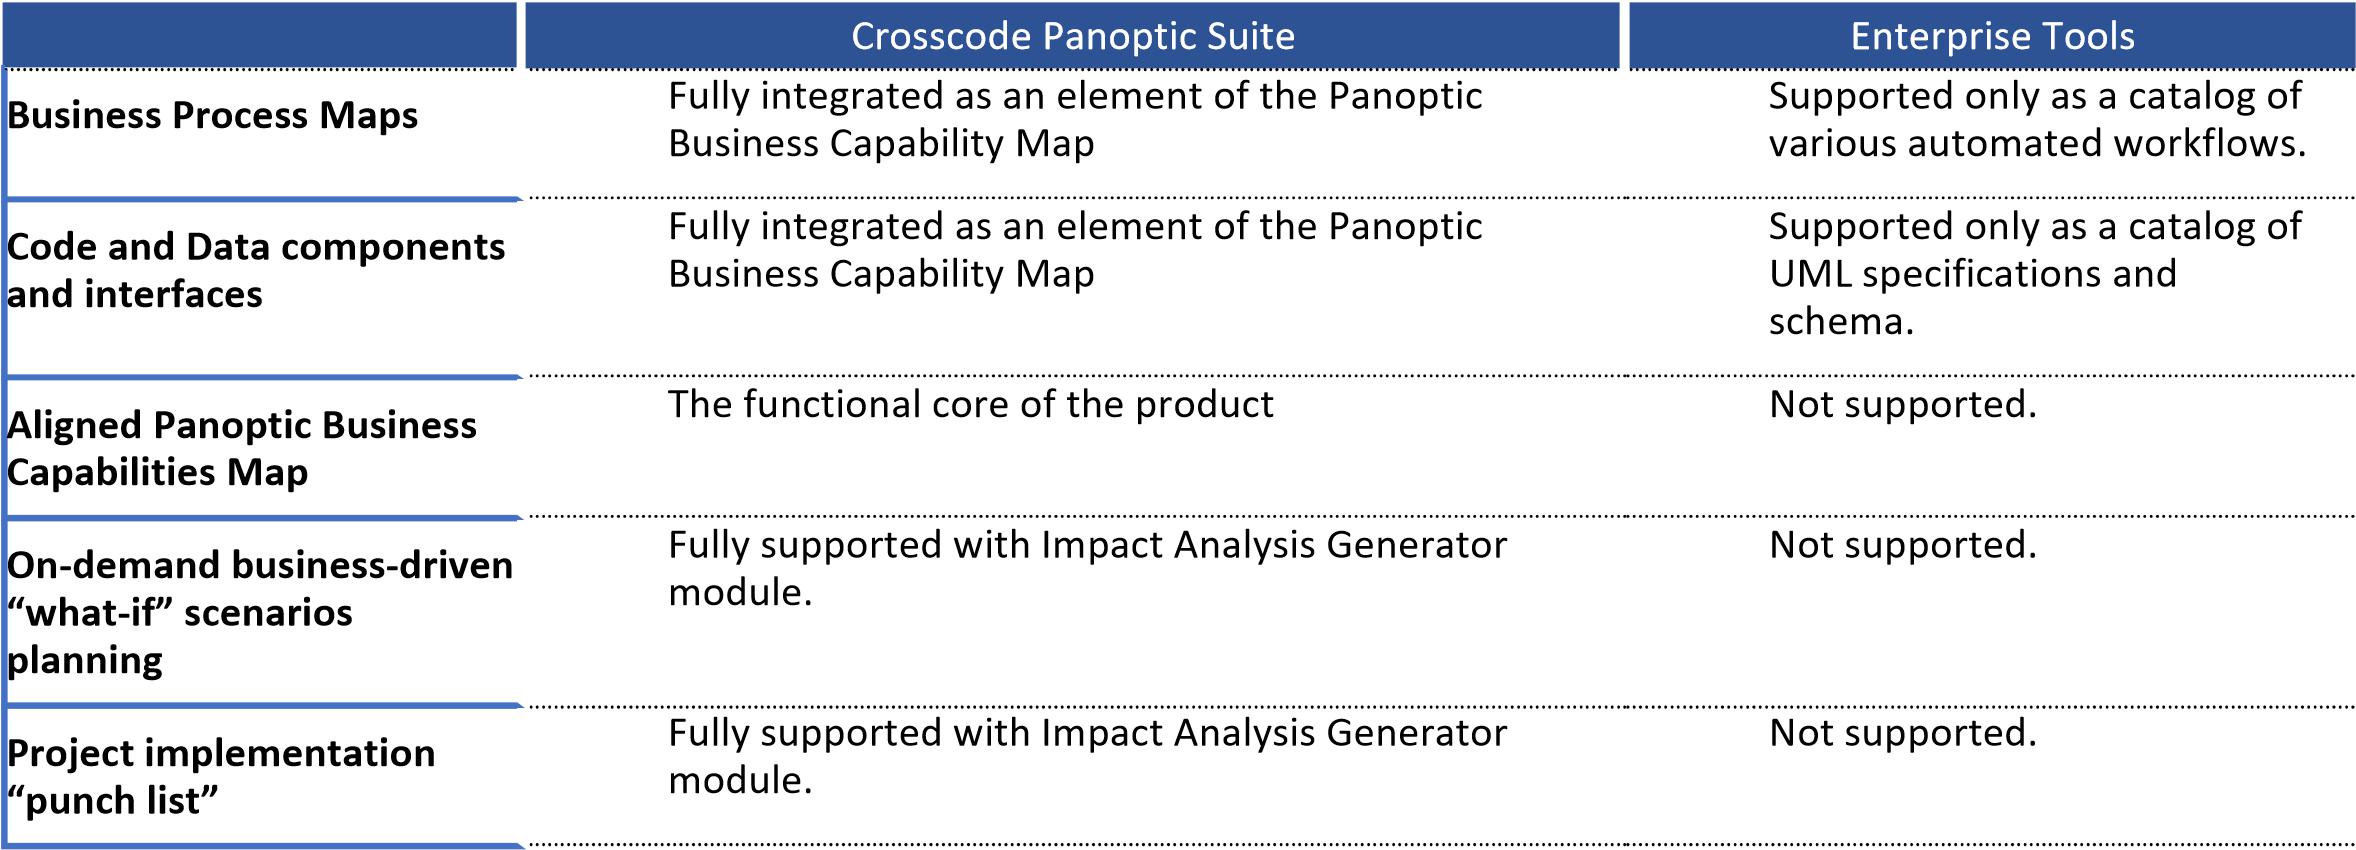
“Business Transformation projects are complex, cumbersome and require a fair amount of analysis in order to do the project right. Our project teams spend approximately 50% of the total project time on analyzing the technology impacts of changing the business capabilities. I feel the industry will greatly benefit from a software that can automate this aspect.” — Statement of a Large Fortune Global CIO
Initially, for each new large enterprise customer, Crosscode has deployed a trained team to implement the customer’s first project and fully train their team on the technology. The hard numbers promised to both the CIO and CFO is that, once the Panoptic Business Capability map is in place, new project requires over 50% less time and effort (labor) to implement, decreasing time-to-value and increasing the number of projects IT can take on. The benefits to the approach don’t stop there:
| ■ | An enduring model. By centering the Enterprise Architecture on Whats, not Hows, project designers are not standing on quicksand. There is improved longevity of developed IT assets, which fosters modularity and reuse while reducing redundancy. |
| ■ | A Panoptic (360º) view of the enterprise. Executives always have access to coherent and comprehensive view of business motivation, capabilities, processes, data and resources, and now have the ability to understand interconnectedness, overlaps and synergies |
| ■ | Composability of capabilities. Breaks the higher level business capabilities into smaller capabilities and builds a dependency network for each, enabling the application of maturity models to each business capability |
| ■ | A Common Language. Provides business and IT an actionable framework and a common language to communicate a holistic picture of products/initiatives, identifying overlaps/gaps, synergies and conflicts. |
| ■ | Link up Strategy and Execution. A capability-based approach helps instill and inform corporate strategy by directly linking governance and performance metrics to capabilities and the strategy. |
| ■ | Automate planning and enforce governance: The real, hard numbers in project savings cost come from automating the current manual processes that consume between 50% and 90% of a project’s budget in time and money. Also by automating governance customers are saving the cost of introducing vulnerabilities and errors in the development process. |
19
In brief, Crosscode’s Panoptic Suite dramatically reduces costs and time for each project, increases business alignment with
IT, increases the reuse of IT assets, reduces needless and constant IT project rework, directly links strategy with execution and
makes the enterprise truly adaptive its ever-changing environment.
Deployment in the Cloud
Crosscode’s Panoptic platform has been offered to customers, both large enterprise as well as Small & Medium Businesses “SMB” via the Software as a Service “SaaS” and delivered via the cloud. It is composed of the following sub-components: User Interface Services “UIS’ via which users of the system interact with the system, Database services “DS” which store the data, Backend services “BES” are the panoptic co-relation engine and an Asset Plugin “AP” is a small plugin which is deployed to all of the customer’s IT nodes.
Each component talks to the others over a network connection secured with by TLS 1.2 protocol with 4096 bit RSA keys for mutual authentication. Contents of the database is also encrypted using AES256 bit keys.
Depending on the customer's risk tolerance, all three sub-components can be deployed in the customer's data center or into a cloud provider. The customer can also choose a hybrid deployment model where some components of the system are deployed in the customer's data center while others are deployed in the cloud.
In addition to this, Crosscode also provides a SaaS solution where the only component running on premise with the customer is the AP component on each of the customer's IT nodes. In this configuration, Crosscode will host everything else using the same level of encryption and separation.
Elements of the Future Product Roadmap
Panoptics 2.0
Crosscode commercially released Panoptics v1.0 in October’2017 and released v2.0 in May’2018. Further v2.0 incorporates many of the suggestions and requests by prospective customers and has a more robust and streamlined user interface (UI). It also includes new features and enhancements that will go through the patenting process.
Company also released Panoptics v2.1 in July’2018 that extends technology coverage to support Microservices which is the de-facto enterprise architectural framework we believe organizations are moving towards.
In September’2018, company plans to release Panoptics v2.2 which is being designed to cover virtually all currently used technologies and platforms along with supporting all major “clouds” like Amazon Web Services (AWS), Microsoft Azure and Google Cloud. It is being developed with enhanced features and functionalities which we hope will improve our competitive advantage in the marketplace. Further, we are working with a large financial institution to create a “must have” solution for financial institutions (Banks, Insurance, Asset Management, Brokerage Houses, etc.) to be introduced as v2.3. Our current timeline for release of v2.3 is mid-November.
Crosscode RapiDex
Crosscode is working on extending its product portfolio and towards the end of 2018 will be releasing a new product, Crosscode RapiDex v1.0. This will again be a first of its solution in the industry and will go through a patenting process. Crosscode RapiDex will completely change the way organizations deploy their cloud strategies and with cloud adoption still in its infancy, the value [proposition and market potential for this technology will be immense.
Future: Business User Created IT Systems
Crosscode’s future product roadmap envisions the inclusion of features which will, in addition to making a detailed change-impact list, make architectural recommendations to enable any changes under consideration. Dynamic scoring of alternatives heavily favors those alternatives that:
■ Have minimal impact to the enterprise IT systems;
■ Do not introduce new architectural complexities into the enterprise; and
■ Make incremental steps towards architectural simplification and standardization in the enterprise.
An exciting possibility that becomes conceptually achievable is to unlock the ability for business users themselves, using simple wizards, to create new business applications and processes utilizing existing IT assets with little or no necessary assistance from the IT organization. This will change how IT is managed and run within large enterprises beyond current recognition and drastically cut down application development costs and time.
20
Results of Operations
The following discussion and analysis of our results of operations and financial condition for the periods ended September 30, 2018 and 2017 should be read in conjunction with our audited financial statements for the year ended December 31, 2017 included in our Form S-1 filed with the SEC.
Three and nine months ended September 30, 2018 and 2017
Revenue
The Company had revenues of $3,495 and $3,495 during the three and nine months ended September 30, 2018, respectively The Company had no revenues during the three and nine months ended September 30, 2017.
General and Administrative Expenses
Our general and administrative expenses for the three months ended September 30, 2018 and 2017 were $285,643 and $60,062, respectively, representing an increase of $225,581. The increase is partially related to the increase in salaries and wages, legal and professional services, advertising and trade shows, travel, and amortization expense during the three months ended September 30, 2018.
Our general and administrative expenses for the nine months ended September 30, 2018 and 2017 were $794,702 and $144,309, respectively, representing an increase of $650,394. The increase is partially related to the increase in salaries and wages, legal and professional services, marketing, office expenses, advertising and trade shows, travel, and amortization expense during the nine months ended September 30, 2018. General and administrative expenses for the nine months ended September 30, 2017 of $144,309 included an offset of $(17,500) representing the proceeds from a lawsuit settlement.
Research and Development Expenses
The Company incurred research and development costs of $203,373 and $0 during the three months ended September 30, 2018 and 2017, respectively. Research and development expenses for the three months ended September 30, 2018 included consulting fees related to continuing product development of $185,493, and other miscellaneous related costs of $17,880.
The Company incurred research and development costs of $404,040 and $0 during the nine months ended September 30, 2018 and 2017, respectively. Research and development expenses for the nine months ended September 30, 2018 included consulting fees related to continuing product development of $361,201, and other miscellaneous related costs of $42,839.
Depreciation and Amortization Expenses
The Company incurred depreciation and amortization expense of $31,359 and $2,189 during the three months ended September 30, 2018 and 2017, respectively.
The Company incurred depreciation and amortization expense of $94,07 and $6,454 during the nine months ended September 30, 2018 and 2017, respectively.
Amortization of capitalized development costs began during the 4th quarter of 2017 as a result of the Company’s software becoming available for general use. This resulted in an increase of $29,170 and $87,622 of amortization expense for the three and nine months ended September 30, 2018, respectively.
Interest Income / (Expense)
The Company incurred total interest income / (expense) of $28,198 and $9,758 during the three months ended September 30, 2018 and 2017, respectively. Interest income / (expense) for the three months ended September 30, 2018 consisted of $28,229 of interest expense related to the Company’s debt, partially offset by $31 of interest income. Interest income / (expense) for the three months ended September 30, 2017 consisted of $9,788 of interest expense related to the Company’s debt, partially offset by $30 of interest income.
The Company incurred total interest income / (expense) of $61,493 and $29,445 during the nine months ended September 30, 2018 and 2017, respectively. Interest income / (expenses) for the nine months ended September 30, 2018 consisted of $61,569 of interest expense related to the Company’s debt, partially offset by $76 of interest income. Interest income / (expense) for the nine months ended September 30, 2017 consisted of $29,591 of interest expense related to the Company’s debt, partially offset by $146 of interest income.
Net Loss
As a result of the foregoing, our net loss the three and nine months ended September 30, 2018 and 2017 was $545,078 and $72,009, and $1,350,817 and $180,208, respectively.
21
Liquidity and Capital Resources
Since our inception, we have funded our operations primarily through loans made by related parties and contributions by founders.
As of September 30, 2018, we had cash and cash equivalents of $76,434.
We had net cash used in operating activities of $1,243,033 and $136,171 for the nine months ended September 30, 2018 and 2017, respectively.
We had net cash used in investing activities of $0 and $296,122 for the nine months ended September 30, 2018 and 2017, respectively. Cash used in investing activities for the nine months ended September 30, 2017 consist of purchase of property and equipment of $1,332 and capitalized software development costs of $294,790.
We had net cash provided by financing activities of $1,002,871 and net cash provided by financing activities of $115,709 for the nine months ended September 30, 2018 and 2017, respectively. Cash provided by financing activities for the nine months ended September 30, 2018 consist of proceeds from borrowing from related parties of $100,266, proceeds from third party debt of $38,000, and proceeds from revolving line of credit of $950,000, partially offset by repayment on third party debt of $54,117 and repayment on related party debt of $31,278. Cash provided by financing activities for the nine months ended September 30, 2017 consist of proceeds from credit card advances of $124,040, proceeds from sale of common stock of $63,500, and proceeds from related party debt, offset partially by third party debt repayments of $49,680 and repayments on related party debt of $24,895.
For the Company to continue its operations for the next 12 months from the filing date of the registration statement and execute its business plan as outlined here, we expect to require an additional $5,000,000 over the next 12 months. We may not be able to secure additional funding on terms acceptable to the Company in a timely manner if any which will have a material adverse impact on our ability to continue our operations.
Off-Balance Sheet Arrangements
We have no significant off-balance sheet arrangements that have or are reasonably likely to have a current or future effect on our financial condition, revenues or expenses, results of operations, liquidity, capital expenditures or capital resources that are material to stockholders.
Going Concern
Our financial statements for the nine months ended September 30, 2018 have been prepared on a going concern basis and Note 2 to the financial statements identifies issues that raise substantial doubt about our ability to continue as a going concern. Our financial statements do not include any adjustments that might result from the outcome of this uncertainty.
We have suffered from losses since our inception, and rely upon the sale of our common stock and loans from related and other parties to fund our operations. However this is expected to change in late 2018, and we anticipate generating revenues by the sale of our technology.
Application of Critical Accounting Policies and Estimates
Our management’s discussion and analysis of our financial condition and results of operations is based on our financial statements, which we have prepared in accordance with U.S. generally accepted accounting principles issued by the FASB. The preparation of these financial statements requires us to make estimates and assumptions that affect the reported amounts of assets and liabilities and the disclosure of contingent assets and liabilities at the date of the financial statements, as well as the reported expenses during the reporting periods. Actual results may differ from these estimates under different assumptions or conditions.
While our significant accounting policies are more fully described in the notes to our financial statements appearing elsewhere in this filing we believe that the accounting policies discussed below are critical to our financial results and to the understanding of our past and future performance, as these policies relate to the more significant areas involving management’s estimates and assumptions. We consider an accounting estimate to be critical if: (1) it requires us to make assumptions because information was not available at the time or it included matters that were highly uncertain at the time we were making our estimate; and (2) changes in the estimate could have a material impact on our financial condition or results of operations.
22
| ITEM 3. | QUANTITATIVE AND QUALITATIVE DISCLOSURES ABOUT MARKET RISK |
Not applicable.
| ITEM 4. | CONTROLS AND PROCEDURES |
Evaluation of Disclosure Controls and Procedures
We carried out an evaluation required by the Securities Exchange Act of 1934 (the “1934 Act”), under the supervision and with the participation of our principal executive officer and principal financial officer, of the effectiveness of the design and operation of our disclosure controls and procedures, as defined in Rule 13a-15(e) of the 1934 Act, as of the end of the period covered by this report. Based on this evaluation, our principal executive officer and principal financial officer concluded that our disclosure controls and procedures were not effective, mainly related to lack of segregation of duties, and lack of an audit committee, to provide reasonable assurance that information required to be disclosed by us in the reports that we file or submit under the 1934 Act is recorded, processed, summarized and reported within the time periods specified in the SEC’s rules and forms and to provide reasonable assurance that such information is accumulated and communicated to our management, including our principal executive officer and principal financial officer, as appropriate to allow timely decisions regarding required disclosure.
Our disclosure controls and procedures are designed to provide reasonable assurance of achieving their objectives as specified above. Management does not expect, however, that our disclosure controls and procedures will prevent or detect all error and fraud. Any control system, no matter how well designed and operated, is based upon certain assumptions and can provide only reasonable, not absolute, assurance that its objectives will be met. Further, no evaluation of controls can provide absolute assurance that misstatements due to error or fraud will not occur or that all control issues and instances of fraud, if any, within the Company have been detected
Changes in Internal Control Over Financial Reporting
Beginning January 1, 2018, we adopted ASC 606, Revenue from Contracts with Customers. W e did implement changes to our processes related to revenue recognition and the control of activities within them. These included the development of new policies based on the five-step model provided in the new revenue standard, new training, ongoing contract review requirements, and gathering information provided by disclosures. There were no other changes in our internal controls over financial reporting (as such term is defined in Rules 13a-15(f) and 15d-15(f) under the Exchange Act) during the quarter ended September 30, 2018 that have materially affected, or are reasonably likely to materially affect, our internal control over financial reporting.
23
PART II. OTHER INFORMATION
| ITEM 1. | LEGAL PROCEEDINGS |
Not applicable
| ITEM 1A. | RISK FACTORS |
Not applicable
| ITEM 2. | UNREGISTERED SALES OF EQUITY SECURITIES AND USE OF PROCEEDS |
Not applicable.
| ITEM 3. | DEFAULTS UPON SENIOR SECURITIES |
Not applicable.
| ITEM 4. | MINE SAFETY DISCLOSURES |
Not applicable.
| ITEM 5. | OTHER INFORMATION |
None.
| ITEM 6. | EXHIBITS |
The Exhibits listed below are filed or incorporated by reference as part of this Form 10-Q .
24
SIGNATURES
Pursuant to the requirements of the Securities Act of 1933, the registrant has duly caused this amendment to the registration statement to be signed on its behalf by the undersigned, thereunto duly authorized in the City of High Point, State of Delaware on January 16, 2019.
| CROSSCODE, INC. | |
| Date: January 16, 2019 | /s/ Aditya Sharma |
| By: Aditya Sharma | |
| Its: Chief Executive Officer; Director |
In accordance with the requirements of the Securities Act of 1933, this registration statement was signed by the following persons in the capacities and on the dates stated.
| Signature | Capacity in Which Signed | Date | ||
| /s/ Aditya Sharma | Chief Executive Officer | January 16, 2019 | ||
| Aditya Sharma | (Principal Executive Officer and Director) | |||
| /s/ David S. Palan | Chief Financial Officer, Director, Secretary | January 16, 2019 | ||
| David S. Palan, CPA | (Principal Accounting and Financial Officer and Director) |
25