Attached files
| file | filename |
|---|---|
| 8-K - 8-K - EVERBRIDGE, INC. | d642249d8k.htm |
Exhibit 99.1
Investor Presentation Helping Keep People Safe and Businesses Running
Safe Harbor This presentation contains forward-looking statements about Everbridge, Inc. (“Everbridge” or the “Company”) within the meaning of the “safe harbor” provisions of the Private Securities Litigation Reform Act of 1995, based on management’s current expectation. These statements are often identified by the use of words such as “anticipate,” “believe,” “continue,” “could,” “estimate,” “expect,” “intend,” “may,” “plan,” “project,” “will,” “would” or the negative or plural of these words or similar expressions or variations. Such forward-looking statements are subject to a number of risks, uncertainties, assumptions and other factors that could cause actual results and the timing of certain events to differ materially from future results expressed or implied by the forward-looking statements. Factors that could cause or contribute to such differences include, but are not limited to: our ability to attract new customers and retain and increase sales to existing customers; developments in the market for critical communications and enterprise safety applications and the associated regulatory environment; our estimates of market opportunity and forecasts of market growth may prove to be inaccurate; we have not been profitable on a consistent basis historically and may not achieve or maintain profitability in the future; the lengthy and unpredictable sales cycles for new customers; nature of our business exposes us to inherent liability risks; our ability to successfully integrate businesses and assets that we may acquire; our ability to maintain successful relationships with our partners; our ability to respond to competitive pressures; potential liability related to data privacy and security; our ability to protect our intellectual property rights; and the other risks detailed in our risk factors discussed in filings with the U.S. Securities and Exchange Commission. Moreover, Everbridge operates in a very competitive and rapidly changing environment. New risks emerge from time to time. It is not possible for the Company’s management to predict all risks, nor can it assess the impact of all factors on its business or the extent to which any factor, or combination of factors, may cause actual results to differ materially from those contained in any forward-looking statement. In light of these risks, uncertainties and assumptions, the forward-looking events and circumstances discussed in this presentation may not occur and actual results could differ materially and adversely from those anticipated or implied. Neither Everbridge nor any other person assumes responsibility for the accuracy and completeness of the forward-looking statements. We are providing this information as of the date of this presentation and do not undertake any obligation to update any forward-looking statements contained in this presentation as a result of new information, future events or otherwise, except as required by law. This presentation also contains estimates and other statistical data made by independent parties and by Everbridge relating to market size and growth and other data about the Company’s industry. This data involves a number of assumptions and limitations, and you are cautioned not to give undue weight to such estimates. Neither Everbridge nor any other person makes any representation as to the accuracy or completeness of such data or undertakes any obligation to update such data after the date of this presentation. In addition, projections, assumptions and estimates of the Company’s future performance and the future performance of the markets in which the Company operates are necessarily subject to a high degree of uncertainty and risk. By attending or receiving this presentation you acknowledge that you will be solely responsible for your own assessment of the market and Everbridge’s market position and that you will conduct your own analysis and be solely responsible for forming your own view of the potential future performance of Everbridge’s business. In addition to U.S. GAAP financials, this presentation includes certain non-GAAP financial measures, including Adjusted EBITDA and Free Cash Flow among others. These non-GAAP measures are in addition to, not a substitute for or superior to, measures of financial performance prepared in accordance with U.S. GAAP. The non-GAAP financial measures used by Everbridge may differ from the non-GAAP financial measures used by other companies. A reconciliation of these measures to the most directly comparable GAAP measure is included in the Appendix to these slides.

Jaime Ellertson Chairman & CEO
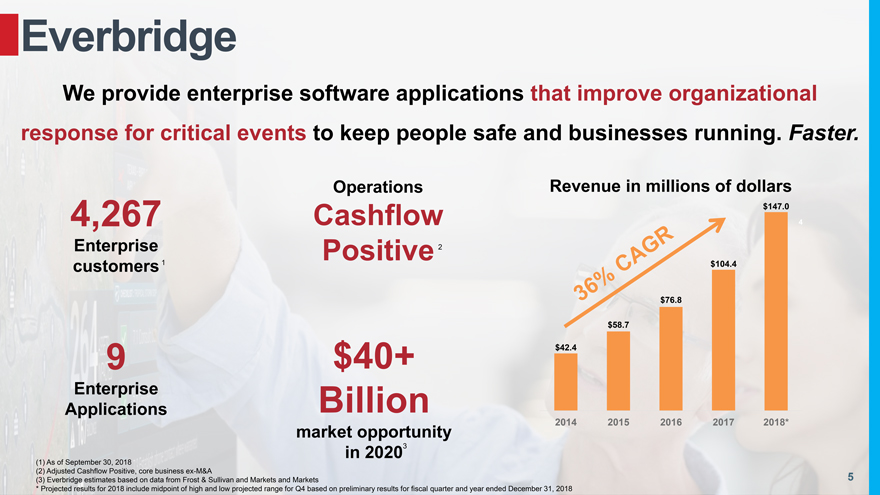
Everbridge We provide enterprise software applications that improve organizational response for critical events to keep people safe and businesses running. Faster. Operations Revenue in millions of dollars $147.0 4,267 Cashflow 4 Enterprise Positive 2 customers1 $104.4 $76.8 $58.7 9 $40+ $42.4 Enterprise Billion Applications 2014 2015 2016 2017 2018* market opportunity in 20203 (1) As of September 30, 2018 (2) Adjusted Cashflow Positive, core business ex-M&A (3) Everbridge estimates based on data from Frost & Sullivan and Markets and Markets 5 * Projected results for 2018 include midpoint of high and low projected range for Q4 based on preliminary results for fiscal quarter and year ended December 31, 2018
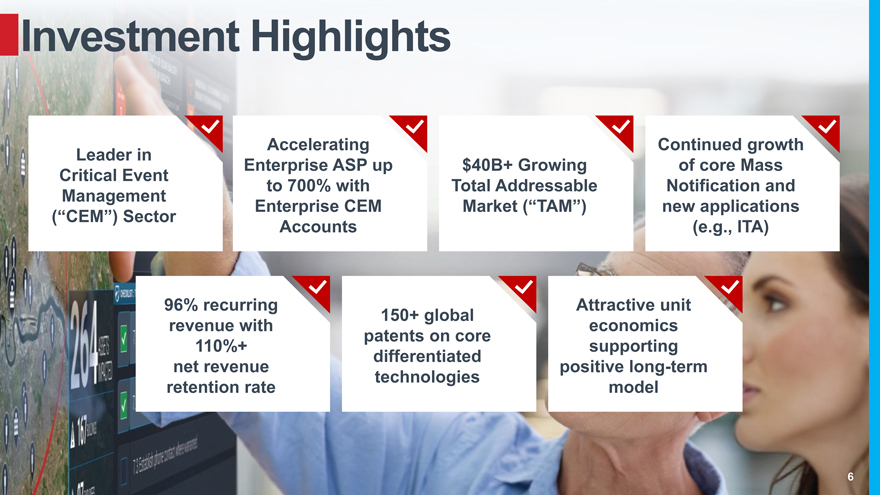
Investment Highlights Accelerating Continued growth Leader in Enterprise ASP up $40B+ Growing of core Mass Critical Event to 700% with Total Addressable Notification and Management Enterprise CEM Market (“TAM”) new applications (“CEM”) Sector Accounts (e.g., ITA) 96% recurring Attractive unit 150+ global revenue with economics patents on core 110%+ supporting differentiated net revenue positive long-term technologies retention rate model 6
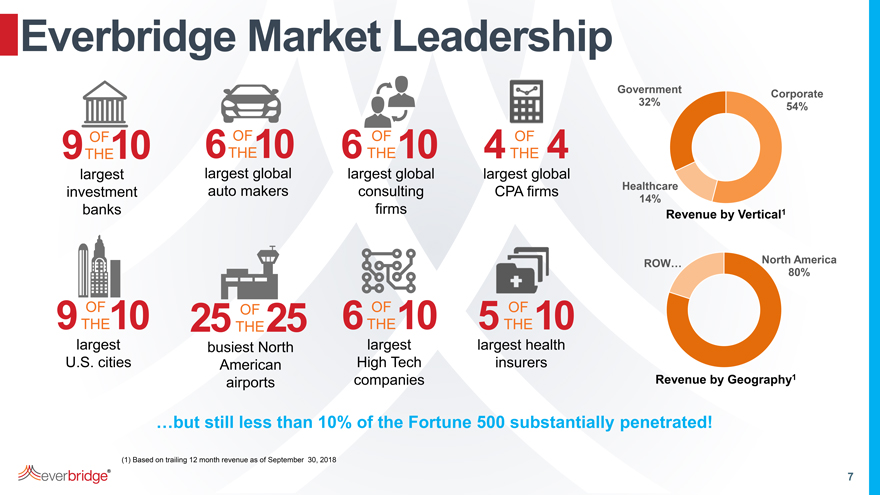
Everbridge Market Leadership Government Corporate 32% 54% OF OF OF OF 9THE 10 6THE 10 6THE10 4THE 4 largest largest global largest global largest global investment auto makers consulting CPA firms Healthcare 14% banks firms Revenue by Vertical1 ROW… North America 80% OF OF OF OF 9THE10 25THE25 6THE10 5THE10 largest busiest North largest largest health U.S. cities American High Tech insurers airports companies Revenue by Geography1 …but still less than 10% of the Fortune 500 substantially penetrated! (1) Based on trailing 12 month revenue as of September 30, 2018 7
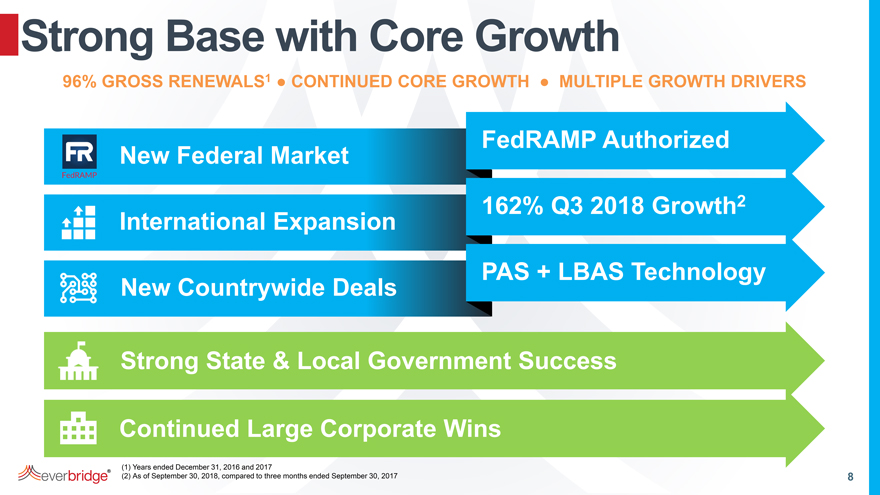
Strong Base with Core Growth 96% GROSS RENEWALS1 • CONTINUED CORE GROWTH • MULTIPLE GROWTH DRIVERS FedRAMP Authorized New Federal Market 162% Q3 2018 Growth2 International Expansion PAS + LBAS Technology New Countrywide Deals Strong State & Local Government Success Continued Large Corporate Wins (1) Years ended December 31, 2016 and 2017 (2) As of September 30, 2018, compared to three months ended September 30, 2017 8
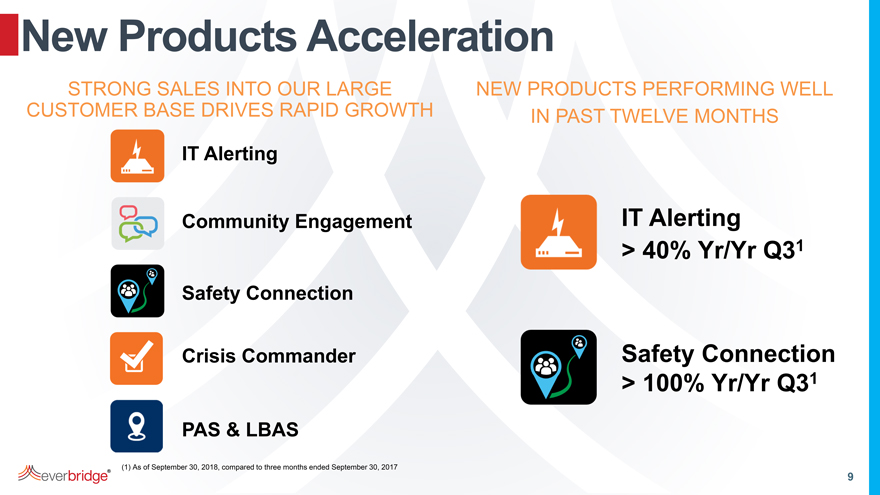
New Products Acceleration STRONG SALES INTO OUR LARGE NEW PRODUCTS PERFORMING WELL CUSTOMER BASE DRIVES RAPID GROWTH IN PAST TWELVE MONTHS IT Alerting Community Engagement IT Alerting > 40% Yr/Yr Q31 Safety Connection Crisis Commander Safety Connection > 100% Yr/Yr Q31 PAS & LBAS (1) As of September 30, 2018, compared to three months ended September 30, 2017 9
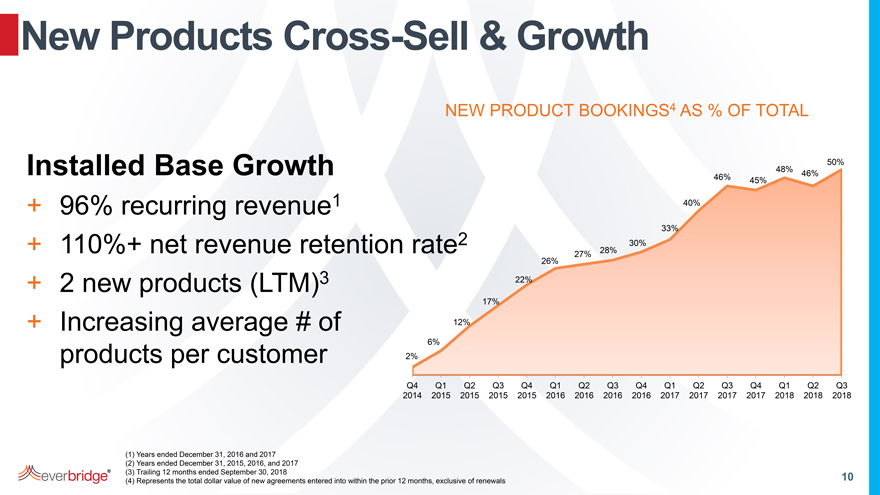
New Products Cross-Sell & Growth NEW PRODUCT BOOKINGS4 AS % OF TOTAL 50% Installed Base Growth 48% 46% 46% 45% + 96% recurring revenue1 40% 33% 2 30% + 110%+ net revenue retention rate 28% 27% 26% + 2 new products (LTM)3 22% 17% + Increasing average # of 12% 6% products per customer 2% Q4 Q1 Q2 Q3 Q4 Q1 Q2 Q3 Q4 Q1 Q2 Q3 Q4 Q1 Q2 Q3 2014 2015 2015 2015 2015 2016 2016 2016 2016 2017 2017 2017 2017 2018 2018 2018 (1) Years ended December 31, 2016 and 2017 (2) Years ended December 31, 2015, 2016, and 2017 (3) Trailing 12 months ended September 30, 2018 10 (4) Represents the total dollar value of new agreements entered into within the prior 12 months, exclusive of renewals
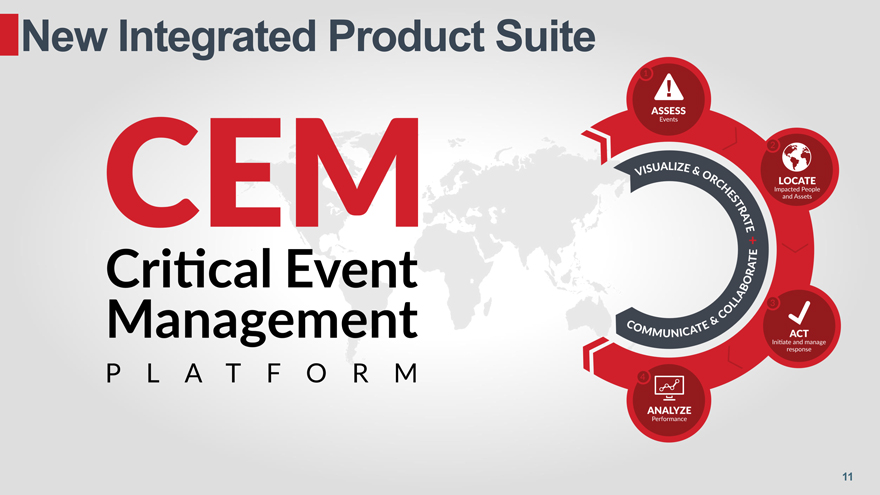
New Integrated Product Suite 11
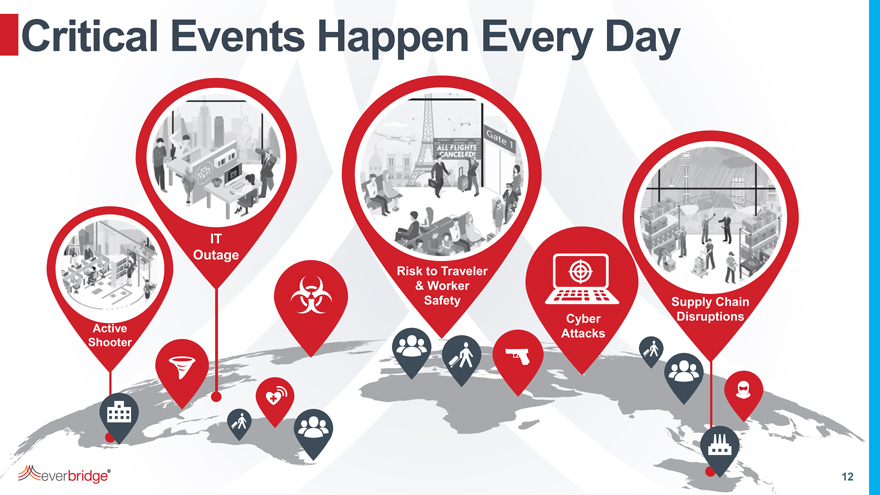
Critical Events Happen Every Day IT Outage Risk to Traveler & Worker Safety Supply Chain Cyber Disruptions Active Attacks Shooter 12
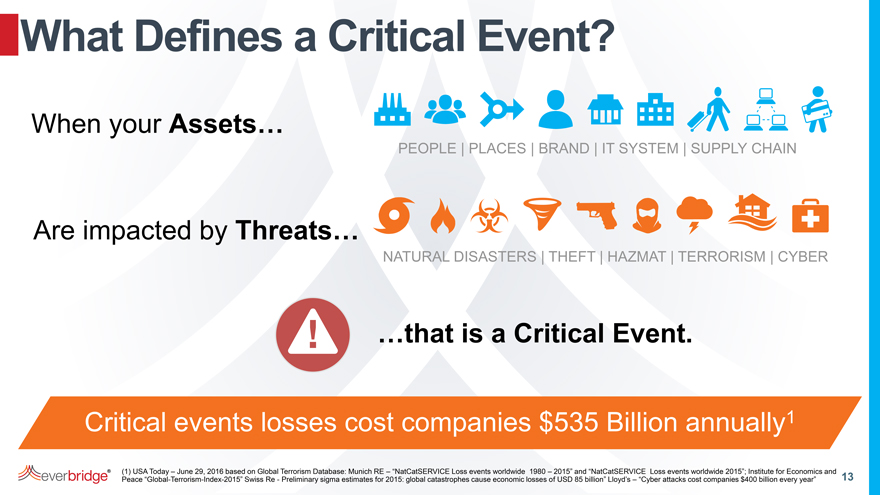
What Defines a Critical Event? When your Assets… PEOPLE | PLACES | BRAND | IT SYSTEM | SUPPLY CHAIN Are impacted by Threats… NATURAL DISASTERS | THEFT | HAZMAT | TERRORISM | CYBER …that is a Critical Event. Critical events losses cost companies $535 Billion annually1 (1) USA Today – June 29, 2016 based on Global Terrorism Database: Munich RE – “NatCatSERVICE Loss events worldwide 1980 – 2015” and “NatCatSERVICE Loss events worldwide 2015”; Institute for Economics and Peace “Global-Terrorism-Index-2015” Swiss Re—Preliminary sigma estimates for 2015: global catastrophes cause economic losses of USD 85 billion” Lloyd’s – “Cyber attacks cost companies $400 billion every year” 13
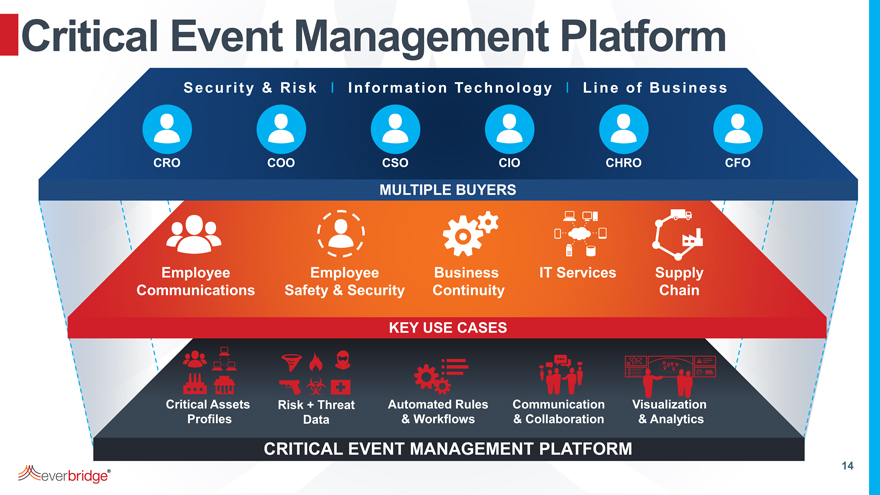
Critical Event Management Platform S e c u r i t y & R i s k I I n f o r m a t i o n Te c h n o l o g y l L i n e o f B u s i n e s s CRO COO CSO CIO CHRO CFO MULTIPLE BUYERS Employee Employee Business IT Services Supply Communications Safety & Security Continuity Chain KEY USE CASES Critical Assets Risk + Threat Automated Rules Communication Visualization Profiles Data & Workflows & Collaboration & Analytics CRITICAL EVENT MANAGEMENT PLATFORM 14
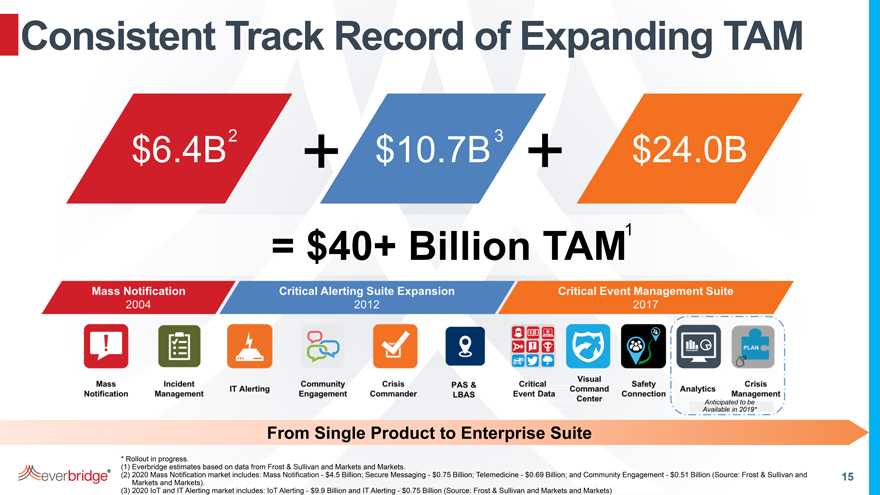
Consistent Track Record of Expanding TAM $6.4B2 + $10.7B3 + $24.0B = $40+ Billion TAM1 Anticipated to be Available in 2019* From Single Product to Enterprise Suite * Rollout in progress. (1) Everbridge estimates based on data from Frost & Sullivan and Markets and Markets. (2) 2020 Mass Notification market includes: Mass Notification—$4.5 Billion; Secure Messaging—$0.75 Billion; Telemedicine—$0.69 Billion; and Community Engagement—$0.51 Billion (Source: Frost & Sullivan and 15 Markets and Markets). (3) 2020 IoT and IT Alerting market includes: IoT Alerting—$9.9 Billion and IT Alerting—$0.75 Billion (Source: Frost & Sullivan and Markets and Markets)
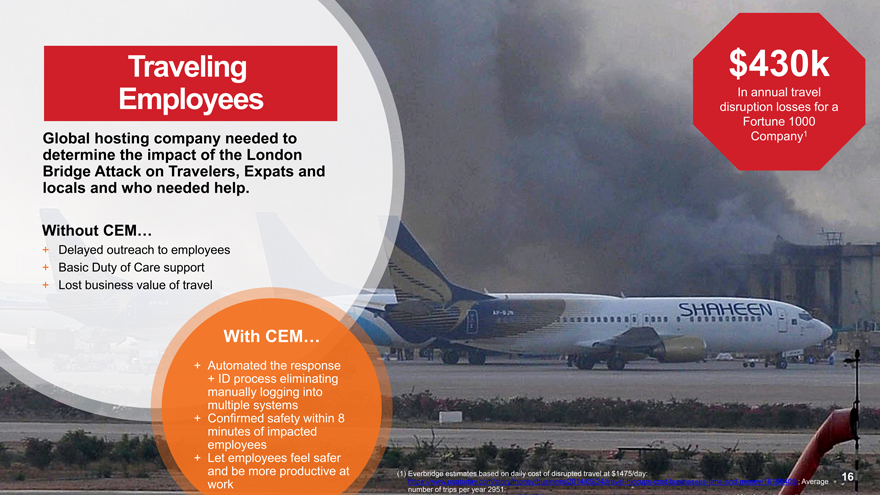
Traveling $430k Employees In annual travel disruption losses for a Fortune 1000 Global hosting company needed to Company1 determine the impact of the London Bridge Attack on Travelers, Expats and locals and who needed help. Without CEM… + Delayed outreach to employees + Basic Duty of Care support + Lost business value of travel With CEM… + Automated the response + ID process eliminating manually logging into multiple systems + Confirmed safety within 8 minutes of impacted employees + Let employees feel safer and be more productive at (1) Everbridge estimates based on daily cost of disrupted travel at $1475/day: 16 work https://www.usatoday.com/story/money/business/2014/09/24/travel-hiccups-cost-businesses-time-and-money/16156405/; Average number of trips per year 2951:
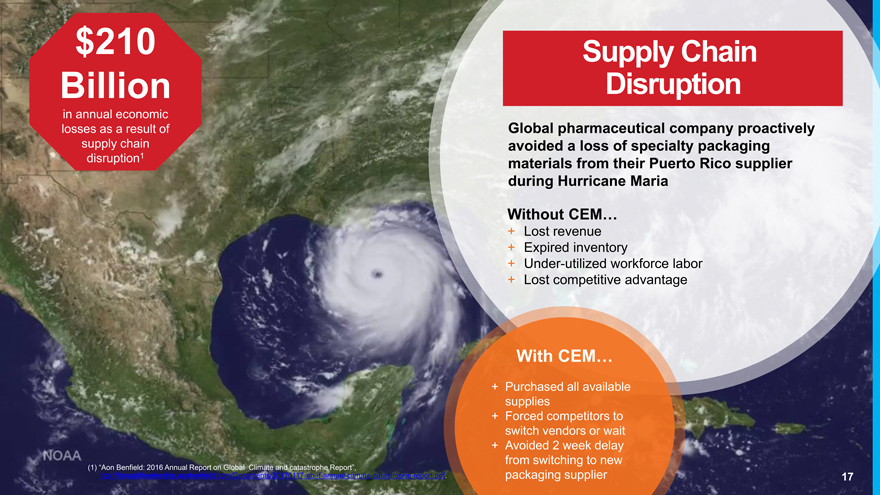
$210 Supply Chain Billion Disruption in annual economic losses as a result of Global pharmaceutical company proactively supply chain avoided a loss of specialty packaging disruption1 materials from their Puerto Rico supplier during Hurricane Maria Without CEM… + Lost revenue + Expired inventory + Under-utilized workforce labor + Lost competitive advantage With CEM… + Purchased all available supplies + Forced competitors to switch vendors or wait + Avoided 2 week delay from switching to new (1) “Aon Benfield: 2016 Annual Report on Global Climate and catastrophe Report”, http://thoughtleadership.aonbenfield.com/Documents/20170117-ab-if-annual-climate-catastrophe-report.pdf. packaging supplier 17
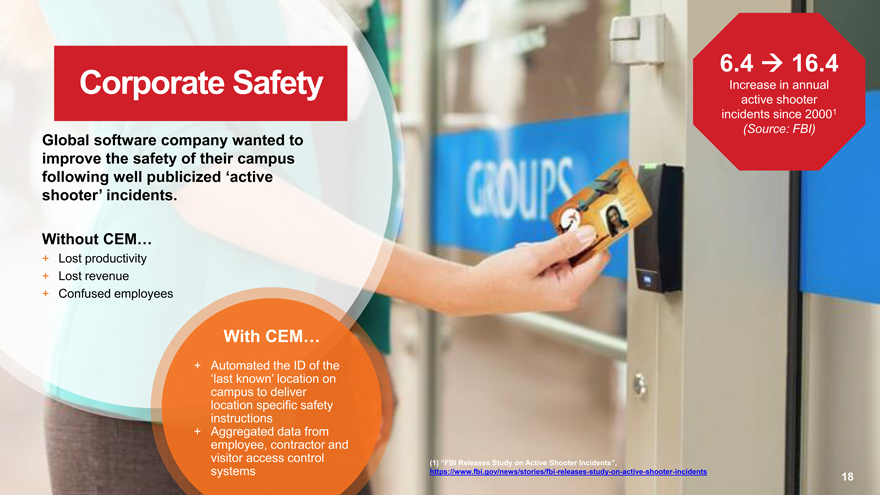
6.4 16.4 Corporate Safety Increase in annual active shooter incidents since 20001 (Source: FBI) Global software company wanted to improve the safety of their campus following well publicized ‘active shooter’ incidents. Without CEM… + Lost productivity + Lost revenue + Confused employees With CEM… + Automated the ID of the ‘last known’ location on campus to deliver location specific safety instructions + Aggregated data from employee, contractor and visitor access control (1) “FBI Releases Study on Active Shooter Incidents”, systems https://www.fbi.gov/news/stories/fbi-releases-study-on-active-shooter-incidents 18
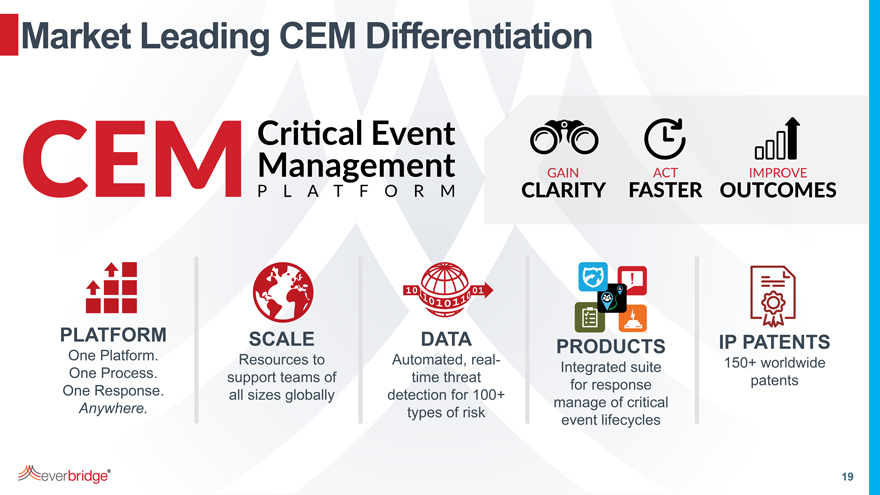
Market Leading CEM Differentiation PLATFORM SCALE DATA IP PATENTS PRODUCTS One Platform. Resources to Automated, real- Integrated suite 150+ worldwide One Process. support teams of time threat for response patents One Response. all sizes globally detection for 100+ Anywhere. manage of critical types of risk event lifecycles 19
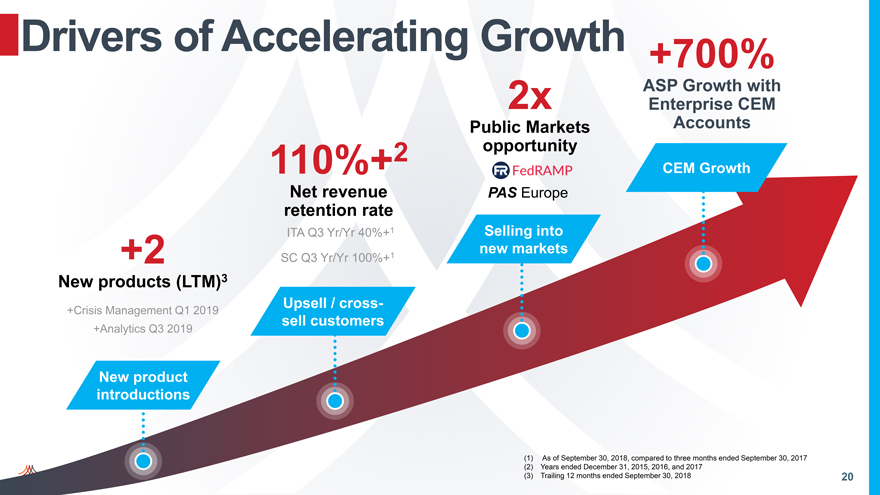
Drivers of Accelerating Growth +700% 2x ASP Growth with Enterprise CEM Public Markets Accounts 2 opportunity 110%+ CEM Growth Net revenue PAS Europe retention rate ITA Q3 Yr/Yr 40%+1 Selling into new markets +2 SC Q3 Yr/Yr 100%+1 New products (LTM)3 Upsell / cross- +Crisis Management Q1 2019 sell customers +Analytics Q3 2019 New product introductions (1) As of September 30, 2018, compared to three months ended September 30, 2017 (2) Years ended December 31, 2015, 2016, and 2017 (3) Trailing 12 months ended September 30, 2018 20

Ken Goldman SVP & CFO
Financial Highlights Strong Revenue Growth Attractive Customer Economics Predictable SaaS Recurring Revenue Model Diversified Revenue Profile Improving Customer Metrics Adjusted EBITDA1 and Cash Flow Positive Attractive Long-term Model (1) Adjusted EBITDA Positive 2012-2014, 2016, and 2017 22
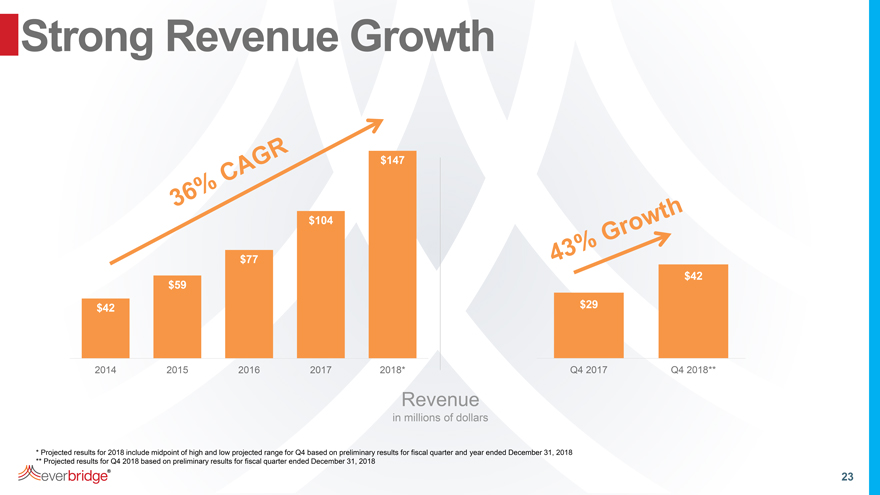
Strong Revenue Growth $147 $104 $77 $42 $59 $42 $29 2014 2015 2016 2017 2018* Q4 2017 Q4 2018** Revenue in millions of dollars * Projected results for 2018 include midpoint of high and low projected range for Q4 based on preliminary results for fiscal quarter and year ended December 31, 2018 ** Projected results for Q4 2018 based on preliminary results for fiscal quarter ended December 31, 2018 23
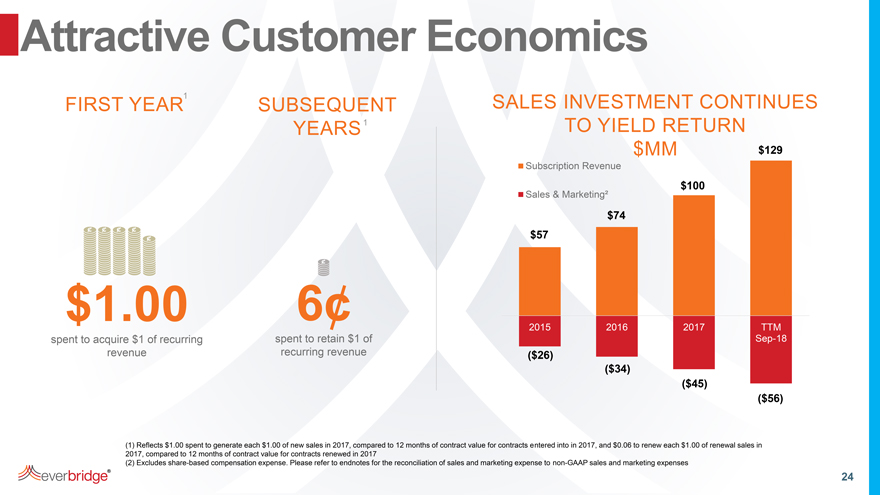
Attractive Customer Economics FIRST YEAR1 SUBSEQUENT SALES INVESTMENT CONTINUES YEARS1 TO YIELD RETURN $MM $129 Subscription Revenue Sales & Marketing² $100 $74 $57 $1.00 6¢ 2015 2016 2017 TTM spent to acquire $1 of recurring spent to retain $1 of Sep-18 revenue recurring revenue ($26) ($34) ($45) ($56) (1) Reflects $1.00 spent to generate each $1.00 of new sales in 2017, compared to 12 months of contract value for contracts entered into in 2017, and $0.06 to renew each $1.00 of renewal sales in 2017, compared to 12 months of contract value for contracts renewed in 2017 (2) Excludes share-based compensation expense. Please refer to endnotes for the reconciliation of sales and marketing expense to non-GAAP sales and marketing expenses 24
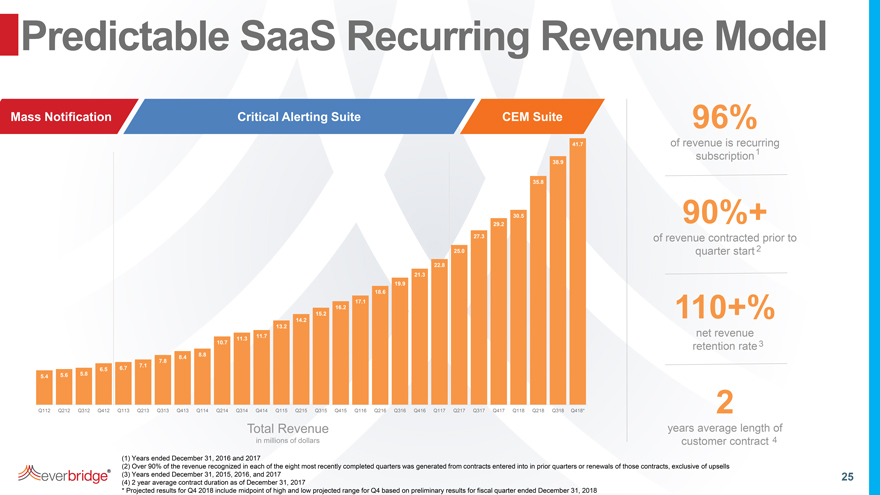
Predictable SaaS Recurring Revenue Model Mass Notification Critical Alerting Suite CEM Suite 96% 41.7 of revenue is recurring subscription1 38.9 35.8 30.5 90%+ 29.2 27.3 of revenue contracted prior to 25.0 quarter start 2 22.8 21.3 19.9 18.6 17.1 16.2 15.2 110+% 14.2 13.2 11.7 net revenue 11.3 10.7 retention rate 3 8.8 8.4 7.8 7.1 6.5 6.7 5.6 5.8 5.4 Q112 Q212 Q312 Q412 Q113 Q213 Q313 Q413 Q114 Q214 Q314 Q414 Q115 Q215 Q315 Q415 Q116 Q216 Q316 Q416 Q117 Q217 Q317 Q417 Q118 Q218 Q318 Q418* 2 Total Revenue years average length of in millions of dollars customer contract 4 (1) Years ended December 31, 2016 and 2017 (2) Over 90% of the revenue recognized in each of the eight most recently completed quarters was generated from contracts entered into in prior quarters or renewals of those contracts, exclusive of upsells (3) Years ended December 31, 2015, 2016, and 2017 25 (4) 2 year average contract duration as of December 31, 2017 * Projected results for Q4 2018 include midpoint of high and low projected range for Q4 based on preliminary results for fiscal quarter ended December 31, 2018
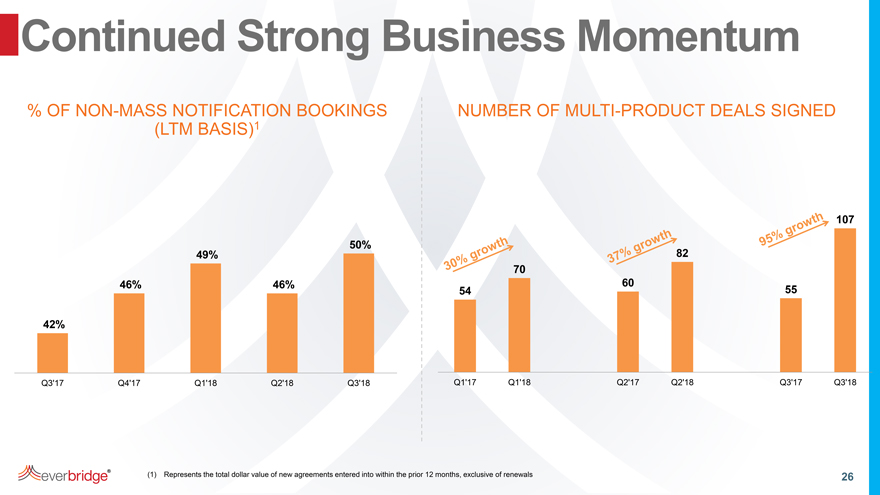
Continued Strong Business Momentum % OF NON-MASS NOTIFICATION BOOKINGS NUMBER OF MULTI-PRODUCT DEALS SIGNED (LTM BASIS)1 107 50% 49% 82 70 46% 46% 60 54 55 42% Q3’17 Q4’17 Q1’18 Q2’18 Q3’18 Q1’17 Q1’18 Q2’17 Q2’18 Q3’17 Q3’18 (1) Represents the total dollar value of new agreements entered into within the prior 12 months, exclusive of renewals 26
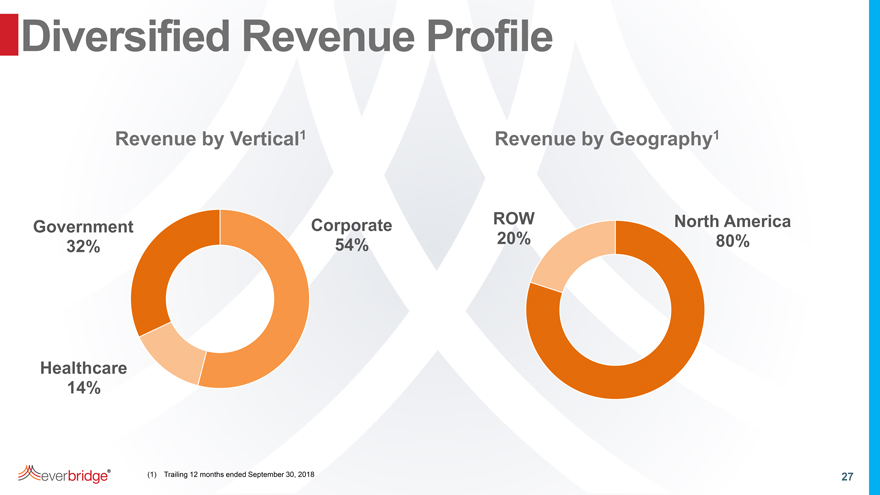
Diversified Revenue Profile Revenue by Vertical1 Revenue by Geography1 Corporate ROW North America Government 54% 20% 80% 32% Healthcare 14% (1) Trailing 12 months ended September 30, 2018 27
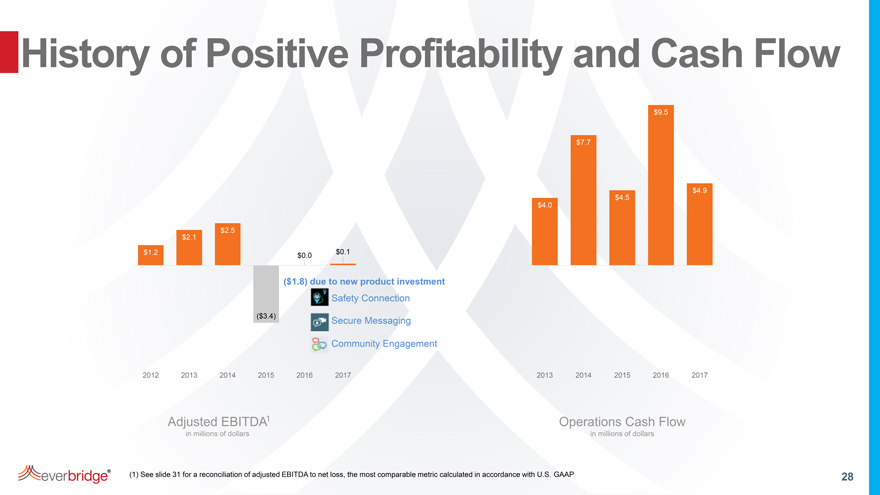
History of Positive Profitability and Cash Flow $9.5 $7.7 $4.9 $4.5 $4.0 $2.5 $2.1 $1.2 $0.1 $0.0 ($1.8) due to new product investment Safety Connection ($3.4) Secure Messaging Community Engagement 2012 2013 2014 2015 2016 2017 2013 2014 2015 2016 2017 Adjusted EBITDA1 Operations Cash Flow in millions of dollars in millions of dollars (1) See slide 31 for a reconciliation of adjusted EBITDA to net loss, the most comparable metric calculated in accordance with U.S. GAAP 28
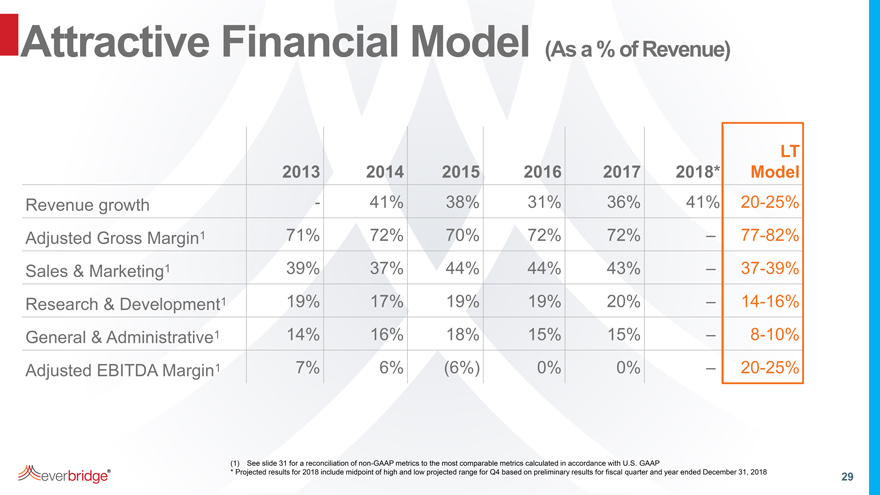
Attractive Financial Model (As a % of Revenue) LT 2013 2014 2015 2016 2017 2018* Model Revenue growth—41% 38% 31% 36% 41% 20-25% Adjusted Gross Margin1 71% 72% 70% 72% 72% –. 77-82% Sales & Marketing1 39% 37% 44% 44% 43% –. 37-39% Research & Development1 19% 17% 19% 19% 20% –. 14-16% General & Administrative1 14% 16% 18% 15% 15% –. 8-10% Adjusted EBITDA Margin1 7% 6% (6%) 0% 0% –. 20-25% (1) See slide 31 for a reconciliation of non-GAAP metrics to the most comparable metrics calculated in accordance with U.S. GAAP * Projected results for 2018 include midpoint of high and low projected range for Q4 based on preliminary results for fiscal quarter and year ended December 31, 2018 29
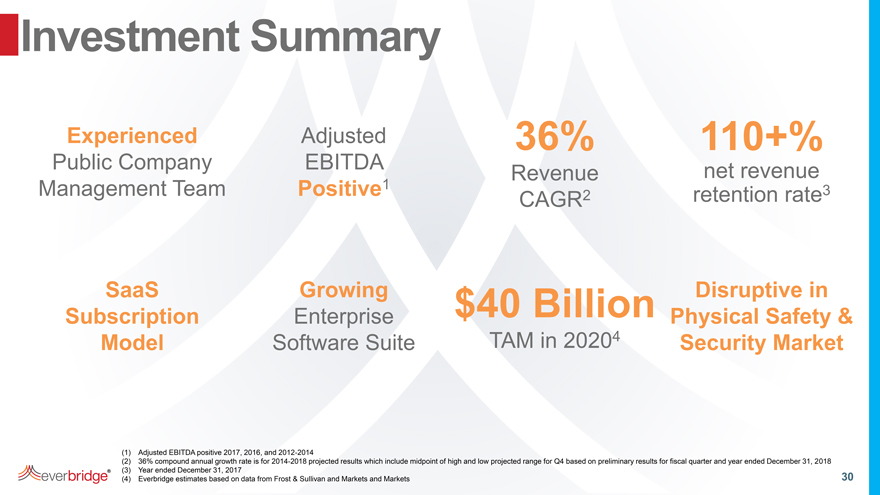
Investment Summary Experienced Adjusted 36% 110+% Public Company EBITDA net revenue Revenue Management Team Positive1 3 CAGR2 retention rate SaaS Growing $40 Billion Disruptive in Subscription Enterprise Physical Safety & Model Software Suite TAM in 20204 Security Market (1) Adjusted EBITDA positive 2017, 2016, and 2012-2014 (2) 36% compound annual growth rate is for 2014-2018 projected results which include midpoint of high and low projected range for Q4 based on preliminary results for fiscal quarter and year ended December 31, 2018 (3) Year ended December 31, 2017 (4) Everbridge estimates based on data from Frost & Sullivan and Markets and Markets 30
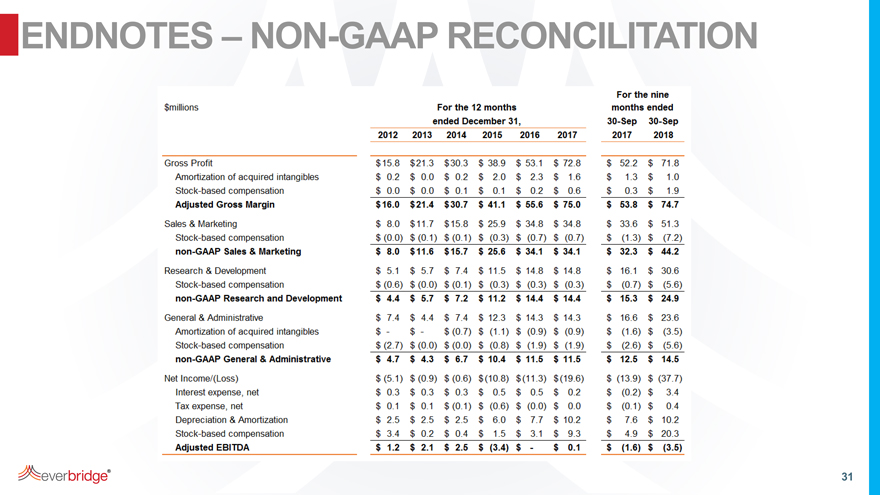
ENDNOTES – NON-GAAP RECONCILITATION 31
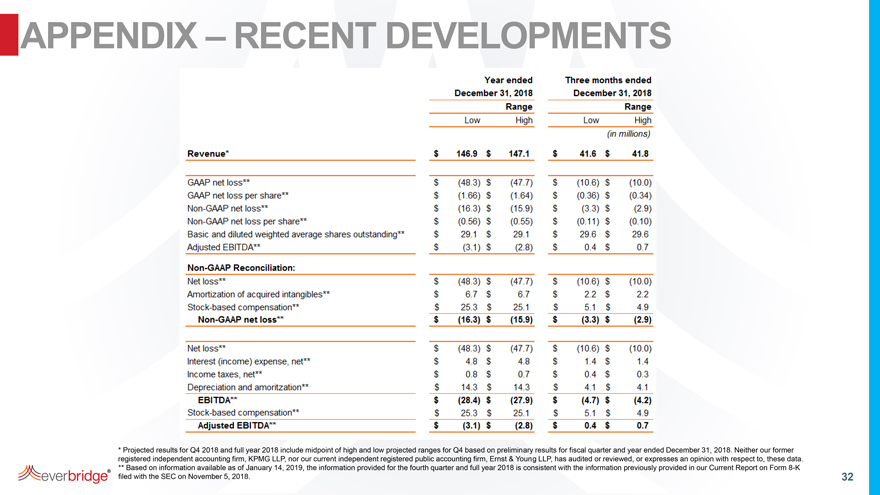
APPENDIX – RECENT DEVELOPMENTS * Projected results for Q4 2018 and full year 2018 include midpoint of high and low projected ranges for Q4 based on preliminary results for fiscal quarter and year ended December 31, 2018. Neither our former registered independent accounting firm, KPMG LLP, nor our current independent registered public accounting firm, Ernst & Young LLP, has audited or reviewed, or expresses an opinion with respect to, these data. ** Based on information available as of January 14, 2019, the information provided for the fourth quarter and full year 2018 is consistent with the information previously provided in our Current Report on Form 8-K filed with the SEC on November 5, 2018.