Attached files
| file | filename |
|---|---|
| 8-K - 8-K - Boot Barn Holdings, Inc. | a19-2441_18k.htm |
IMPORTANT INFORMATION Forward-Looking Statements This presentation contains forward-looking statements that are subject to risks and uncertainties. All statements other than statements of historical fact included in this presentation are forward-looking statements. You can identify forward-looking statements by the fact that they generally include words such as "anticipate," "estimate," "expect," "project," "plan,“ "intend," "believe," “outlook” and other words of similar meaning in connection with any discussion of the timing or nature of future operating or financial performance or other events but not all forward-looking statements contain these identifying words. These forward-looking statements are based on assumptions that the Company’s management has made in light of their industry experience and on their perceptions of historical trends, current conditions, expected future developments and other factors they believe are appropriate under the circumstances. As you consider this presentation, you should understand that these statements are not guarantees of performance or results. They involve risks, uncertainties (some of which are beyond the Company’s control) and assumptions. These risks, uncertainties and assumptions include, but are not limited to, the following: decreases in consumer spending due to declines in consumer confidence, local economic conditions or changes in consumer preferences and the Company’s ability to effectively: execute on its growth strategy; maintain and enhance its strong brand image; compete effectively; maintain good relationships with its key suppliers; and improve and expand its exclusive product offerings. The Company discusses the foregoing risks and other risks in greater detail under the heading “Risk factors” in the periodic reports filed by the Company with the Securities and Exchange Commission. Although the Company believes that these forward-looking statements are based on reasonable assumptions, you should be aware that many factors could affect the Company’s actual financial results and cause them to differ materially from those anticipated in the forward-looking statements. Because of these factors, the Company cautions that you should not place undue reliance on any of these forward-looking statements. New risks and uncertainties arise from time to time, and it is impossible for the Company to predict those events or how they may affect the Company. Further, any forward-looking statement speaks only as of the date on which it is made. Except as required by law, the Company does not intend to update or revise the forward-looking statements in this presentation after the date of this presentation. Industry and Market Information Statements in this presentation concerning our industry and the markets in which we operate, including our general expectations and competitive position, business opportunity and market size, growth and share, are based on information from independent industry organizations and other third-party sources, data from our internal research and management estimates. Management estimates are derived from publicly available information and the information and data referred to above, and are based on assumptions and calculations made by us based upon our interpretation of such information and data. The information and data referred to above are imprecise and may prove to be inaccurate because the information cannot always be verified with complete certainty due to the limitations on the availability and reliability of raw data, the voluntary nature of the data gathering process and other limitations and uncertainties. As a result, please be aware that the data and statistical information in this presentation may differ from information provided by our competitors or from information found in current or future studies conducted by market research institutes, consultancy firms or independent sources. Non-GAAP Financial Measures The Company presents Adjusted EBITDA and Adjusted EBIT because they are important financial measures that its management, board of directors and lenders use to assess the Company’s operating performance. However, Adjusted EBITDA and Adjusted EBIT are non-GAAP financial measures and should not be considered in isolation or as an alternative to net income or any other measure of financial performance calculated and presented in accordance with GAAP. The Company defines Adjusted EBITDA as earnings before interest, income tax, depreciation and amortization, or EBITDA, adjusted to exclude non-cash stock-based compensation, the non-cash accrual for future award redemptions, recapitalization expenses, acquisition-related expenses, acquisition-related integration costs, amortization of inventory fair value adjustment, loss on disposal of assets and contract termination costs, secondary offering costs, and other due diligence expenses. Adjusted EBIT is defined as Adjusted EBITDA less depreciation and amortization. In addition, for fiscal year 2017, which was a 53-week fiscal year, the Company has made further adjustments to account for the extra week. Since Adjusted EBITDA and Adjusted EBIT are non-GAAP financial measures, they are susceptible to varying calculations and the Company’s Adjusted EBITDA and Adjusted EBIT may not be comparable to similarly titled measures of other companies, including companies in its industry. See the Appendix to this presentation for a reconciliation of Adjusted EBITDA and Adjusted EBIT to Net Income, and the computation of the Company’s Net Debt Leverage Ratio for the trailing twelve months ended September 29, 2018, and fiscal years 2018 and 2017. 2
BOOT BARN IS A COMPELLING INVESTMENT STORY • Healthy same store sales growth in stores and online • Leader and authority in the western and work industry • Proven ability to drive growth and expansion • Importance of quality and fit • Genuine lifestyle retail brand • Exclusive brand growth • Lifestyle experience across stores, e-commerce and events • Extremely loyal customers seeking authenticity • Economies of scale in purchasing • Unique merchandise assortment • Ability to leverage expenses • Significant e-commerce penetration through 3 brands 3 GROWTH AND PROFIT ENHANCEMENT OPPORTUNITIES NATIONAL LEADER IN ATTRACTIVE NICHE STRONG OMNI-CHANNEL BRAND PRESENCE
AGENDA BOOT BARN STORY STRATEGIC INITIATIVES DRIVE SAME STORE SALES GROWTH 1 CONTINUE OMNI-CHANNEL LEADERSHIP 2 BUILD OUT EXCLUSIVE BRAND PORTFOLIO 3 EXPAND OUR STORE BASE 4 INVESTMENT THESIS 4
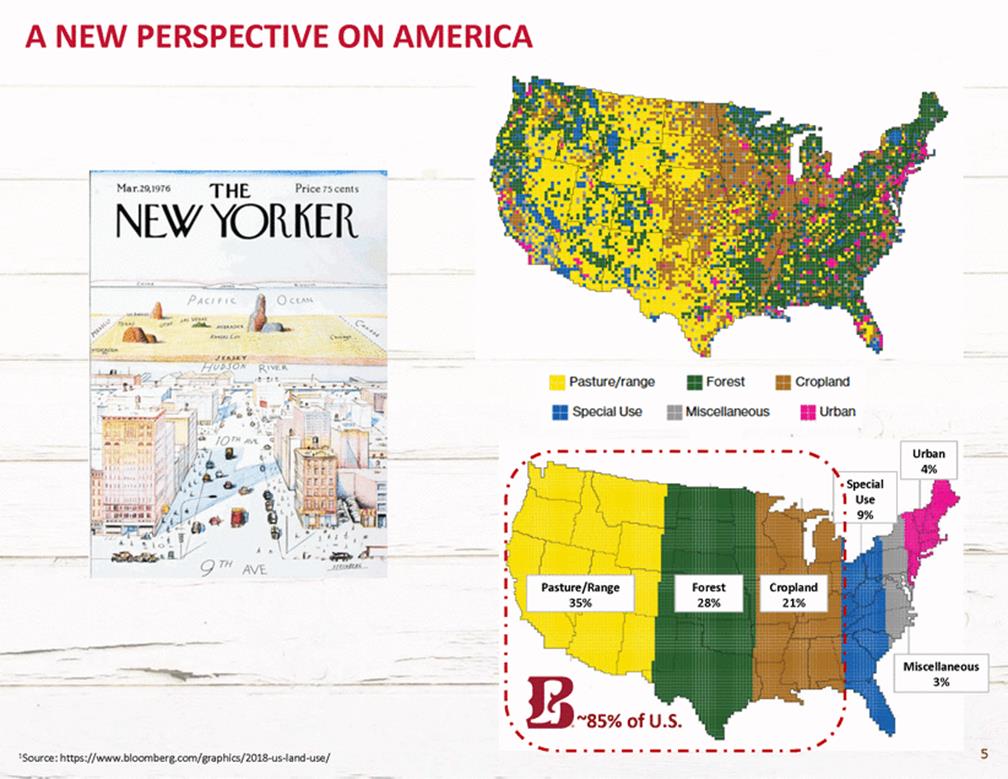
A NEW PERSPECTIVE ON AMERICA ~85% of U.S. 5 1Source: https://www.bloomberg.com/graphics/2018-us-land-use/ Miscellaneous 3% Cropland 21% Forest 28% Pasture/Range 35% Special Use 9% Urban 4%
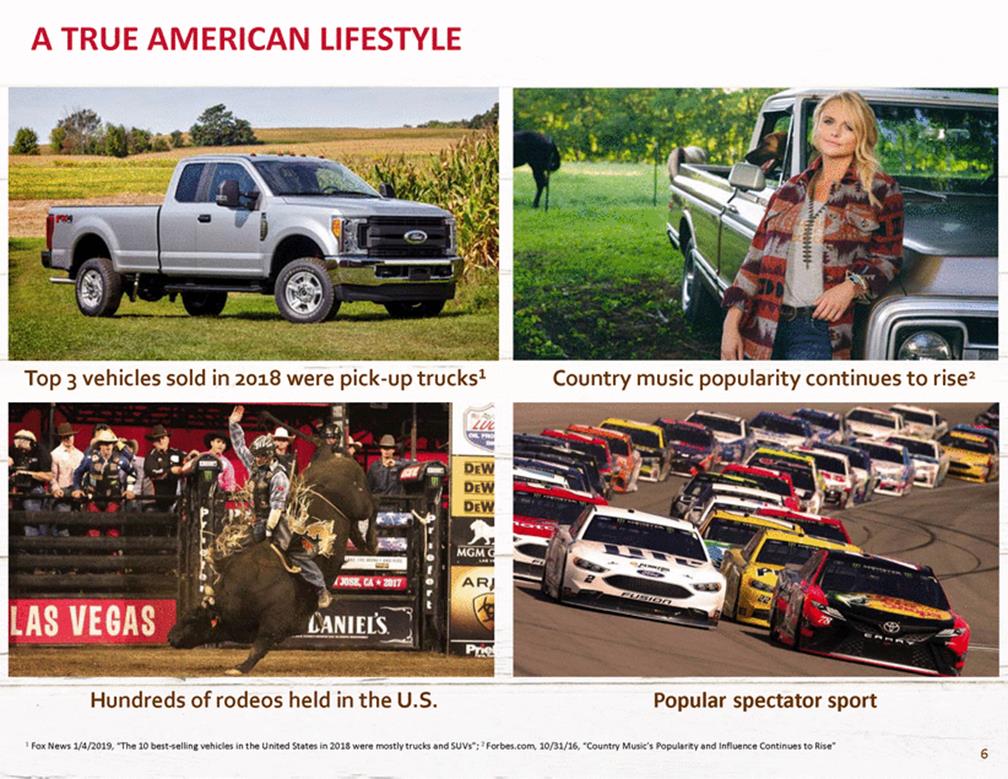
A TRUE AMERICAN LIFESTYLE Top 3 vehicles sold in 2018 were pick-up trucks1 Country music popularity continues to rise2 Hundreds of rodeos held in the U.S. Popular spectator sport 1 Fox News 1/4/2019, “The 10 best-selling vehicles in the United States in 2018 were mostly trucks and SUVs”; 2 Forbes.com, 10/31/16, “Country Music’s Popularity and Influence Continues to Rise” 6
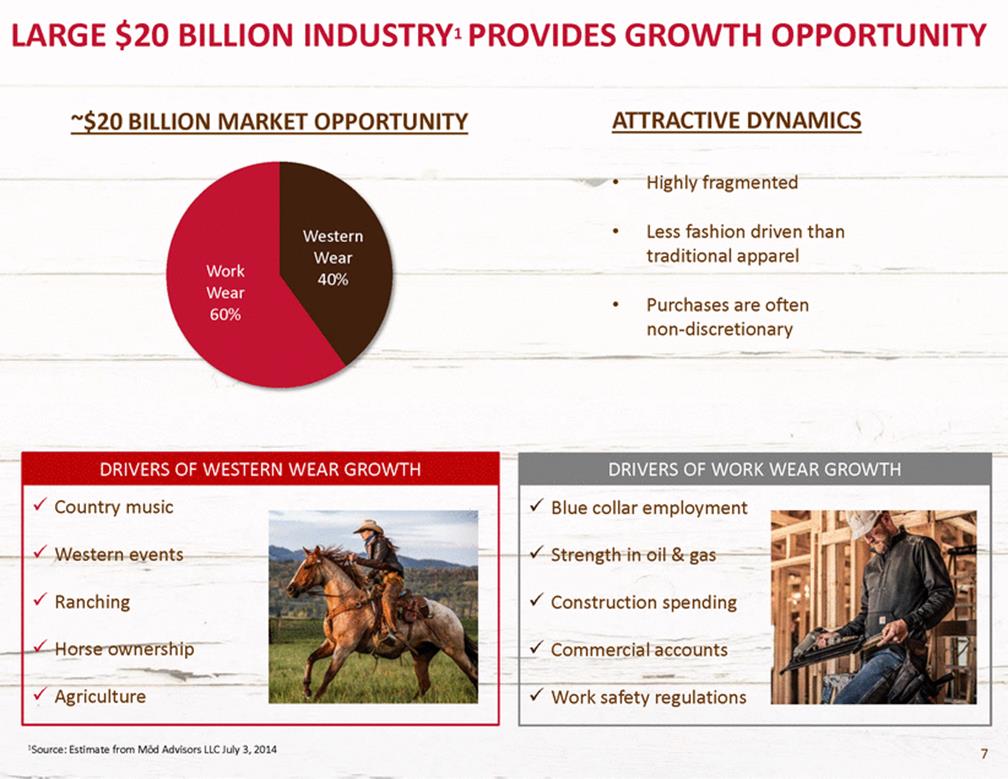
LARGE $20 BILLION INDUSTRY1 PROVIDES GROWTH OPPORTUNITY ATTRACTIVE DYNAMICS ~$20 BILLION MARKET OPPORTUNITY • Highly fragmented • Less fashion driven than traditional apparel Western Wear 40% Work Wear 60% • Purchases are often non-discretionary 1Source: Estimate from Mōd Advisors LLC July 3, 2014 7 DRIVERS OF WESTERN WEAR GROWTH Country music Western events Ranching Horse ownership Agriculture DRIVERS OF WORK WEAR GROWTH Blue collar employment Strength in oil & gas Construction spending Commercial accounts Work safety regulations
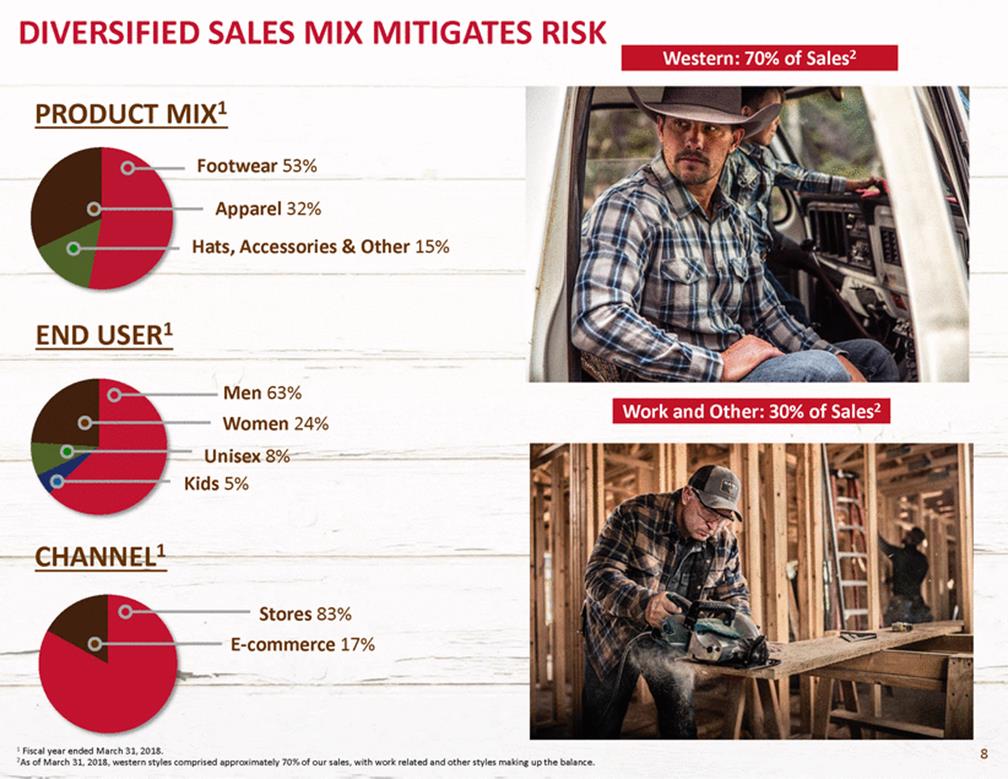
DIVERSIFIED SALES MIX MITIGATES RISK PRODUCT MIX1 Footwear 53% Apparel 32% Hats, Accessories & Other 15% END USER1 Men 63% Women 24% Unisex 8% Kids 5% CHANNEL1 Stores 83% E-commerce 17% 1 Fiscal year ended March 31, 2018. 2As of March 31, 2018, western styles comprised approximately 70% of our sales, with work related and other styles making up the balance. 8 Work and Other: 30% of Sales2 Western: 70% of Sales2
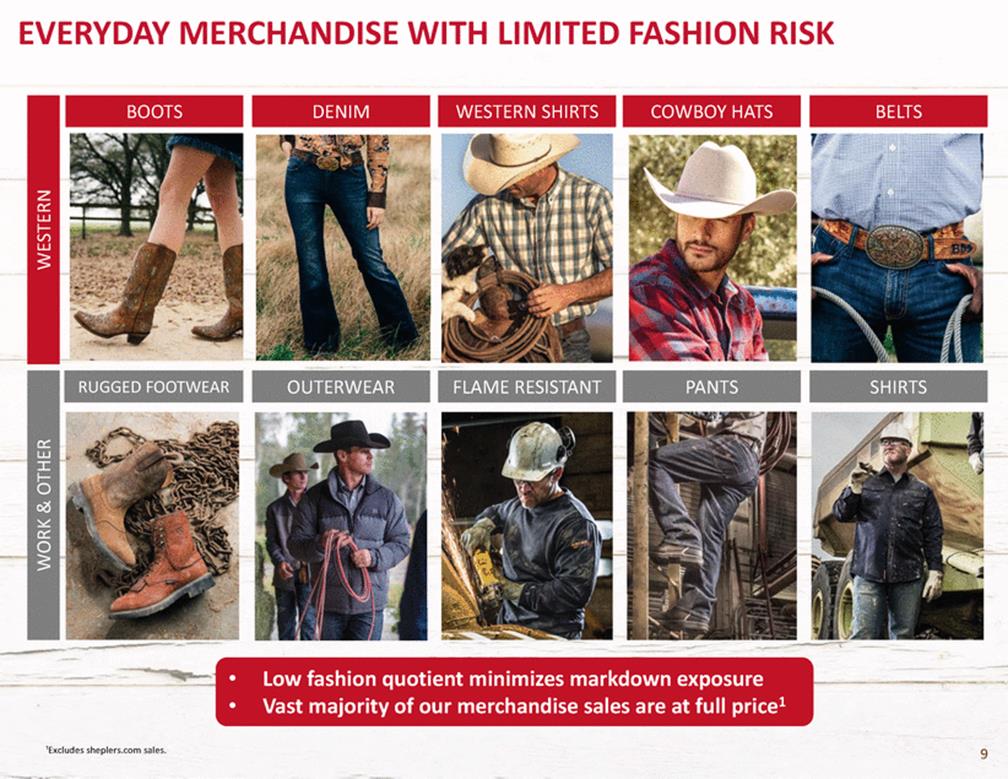
EVERYDAY MERCHANDISE WITH LIMITED FASHION RISK • • Low fashion quotient minimizes markdown exposure Vast majority of our merchandise sales are at full price1 ¹Excludes sheplers.com sales. 9 WORK & OTHER WESTERN SHIRTS PANTS FLAME RESISTANT OUTERWEAR RUGGED FOOTWEAR BELTS COWBOY HATS WESTERN SHIRTS DENIM BOOTS
BOOT BARN HAS A HISTORY OF GROWTH NET SALES ($MM) ~$755 $619 $569 $346 1 2 FY13 FY14 FY15 FY16 FY17 FY18 TTM Q3 FY19 ADJUSTED EBIT ($MM) ~$63 1 2 FY13 FY14 FY15 FY16 FY17 FY18 TTM Q3 FY19 Note: Fiscal year ends March. FY13 includes 29 stores acquired from RCC with 7 month net sales of $35.5 million. FY14 includes 30 stores acquired from Baskins with 10 month net sales of $63.4 million. Sheplers was acquired June 29, 2015, the beginning of Q2 FY16. ¹Fiscal 2017 was a 53-week year. The fiscal 2017 reported results have been adjusted above to reflect management’s estimated 52-week results. The Company estimated that included in fiscal 2017 reported earnings per share was $0.03 attributed to the 53rd week. See the reconciliation included in the Appendix. 2All TTM Q3 Fiscal 2019 results are preliminary and contain an estimate of results for the thirteen weeks ended December 29, 2018. 10 $46$49 $39 $41 $32 $23 $678 $403 $233
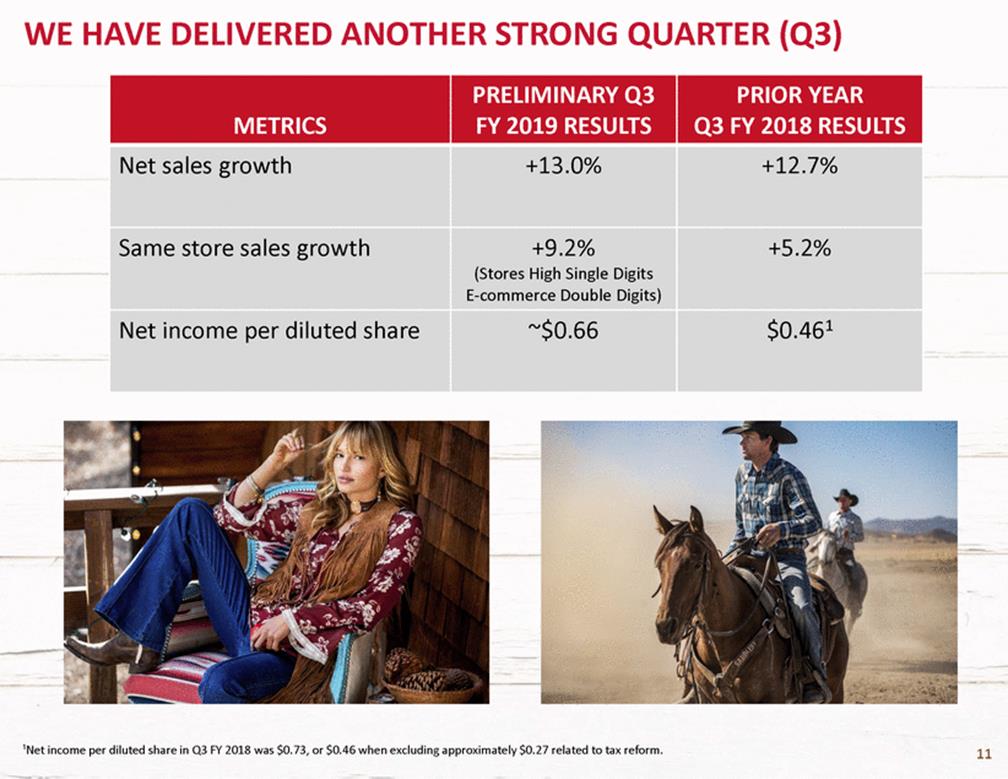
WE HAVE DELIVERED ANOTHER STRONG QUARTER (Q3) ¹Net income per diluted share in Q3 FY 2018 was $0.73, or $0.46 when excluding approximately $0.27 related to tax reform. 11 METRICS PRELIMINARY Q3 FY 2019 RESULTS PRIOR YEAR Q3 FY 2018 RESULTS Net sales growth +13.0% +12.7% Same store sales growth +9.2% (Stores High Single Digits E-commerce Double Digits) +5.2% Net income per diluted share ~$0.66 $0.461
STRATEGIC INITIATIVES DRIVE SAME STORE SALES GROWTH 1 CONTINUE OMNI-CHANNEL LEADERSHIP 2 BUILD OUT EXCLUSIVE BRAND PORTFOLIO 3 EXPAND OUR STORE BASE 4 12 12
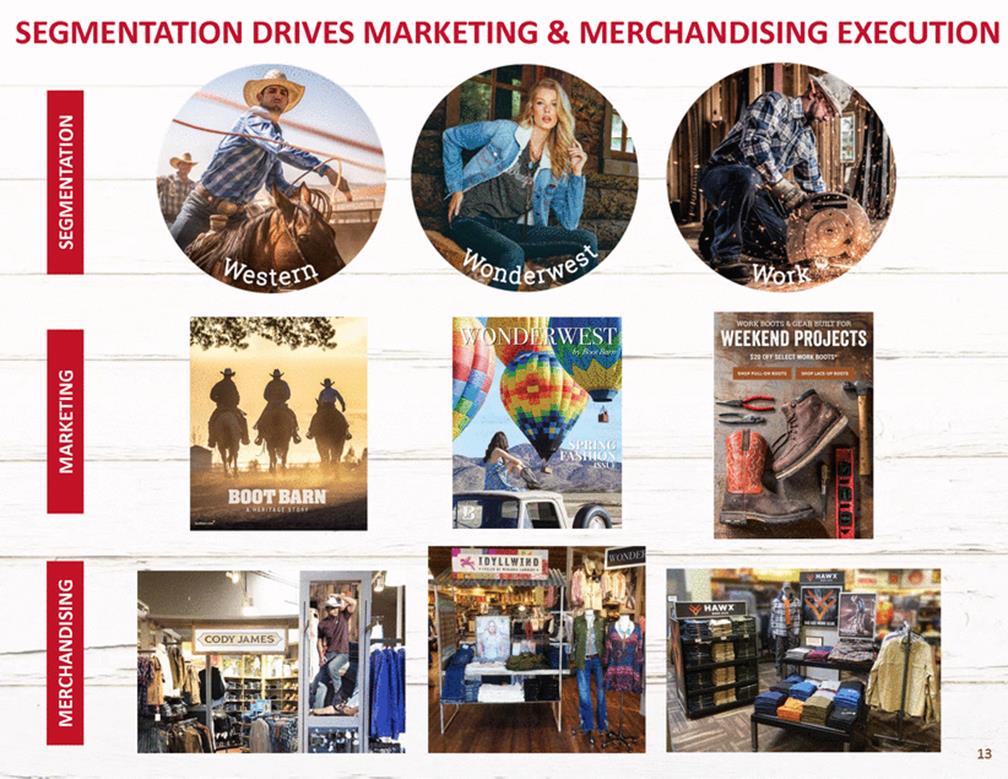
SEGMENTATION DRIVES MARKETING & MERCHANDISING EXECUTION
SHIFTING MEDIA MIX APPEARS TO BE EFFECTIVE oo:m.51 -4 ® I I ------------- ---- 14
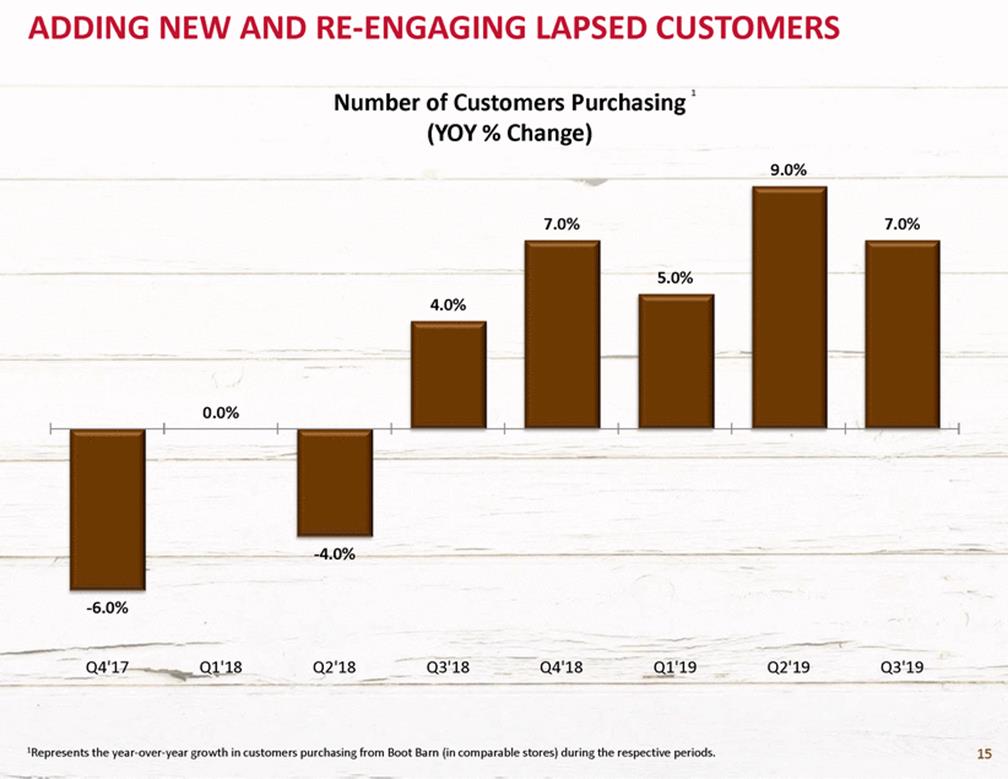
ADDING NEW AND RE-ENGAGING LAPSED CUSTOMERS 1 Number of Customers Purchasing (YOY % Change) 9.0% 7.0% 7.0% 5.0% 4.0% 0.0% -4.0% -6.0% Q4'17 Q1'18 Q2'18 Q3'18 Q4'18 Q1'19 Q2'19 Q3'19 1Represents the year-over-year growth in customers purchasing from Boot Barn (in comparable stores) during the respective periods. 15
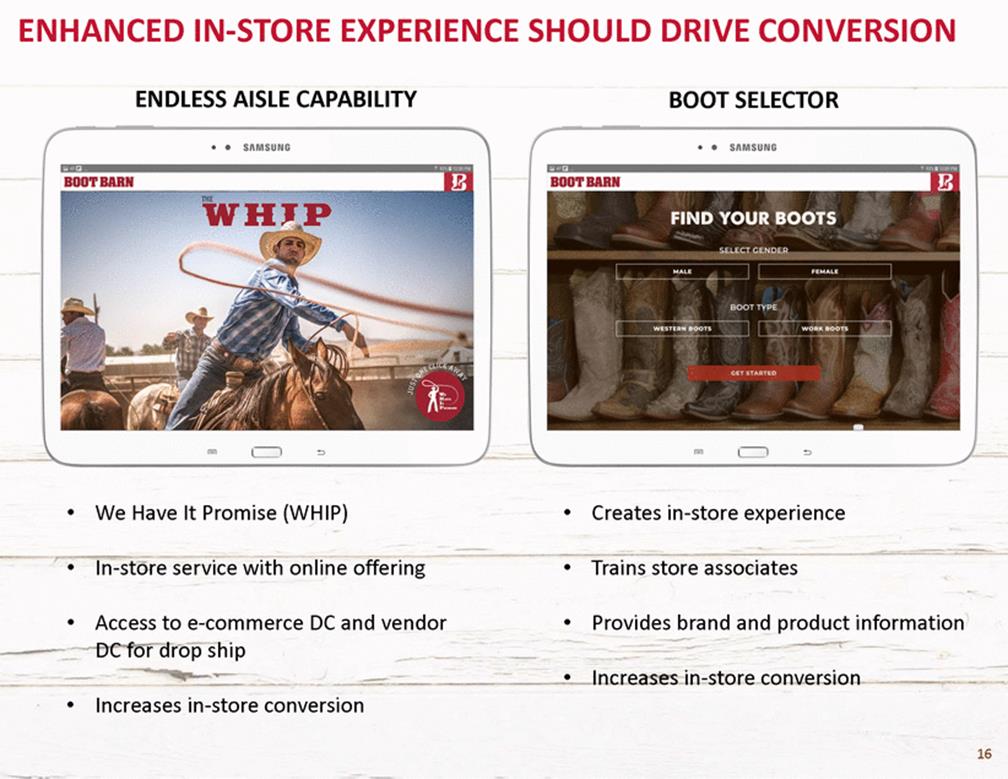
ENHANCED IN-STORE EXPERIENCE SHOULD DRIVE CONVERSION ENDLESS AISLE CAPABILITY BOOT SELECTOR • • We Have It Promise (WHIP) Creates in-store experience • • In-store service with online offering Trains store associates • • Access to e-commerce DC and vendor DC for drop ship Provides brand and product information • Increases in-store conversion • Increases in-store conversion 16
STRONG SSS GROWTH WHILE REDUCING PROMOTIONS Same Store Sales Growth (Consolidated) 12.1% 11.6% 11.3% 1.3% Q1 '18 Q2 '18 Q3 '18 Q4 '18 Q1 '19 Q2 '19 Q3 '19 17 Average SSS growth of 8.1% over the last 36 quarters 5.2% 9.2% 1.8%
STRATEGIC INITIATIVES DRIVE SAME STORE SALES GROWTH 1 CONTINUE OMNI-CHANNEL LEADERSHIP 2 BUILD OUT EXCLUSIVE BRAND PORTFOLIO 3 EXPAND OUR STORE BASE 4 18 18
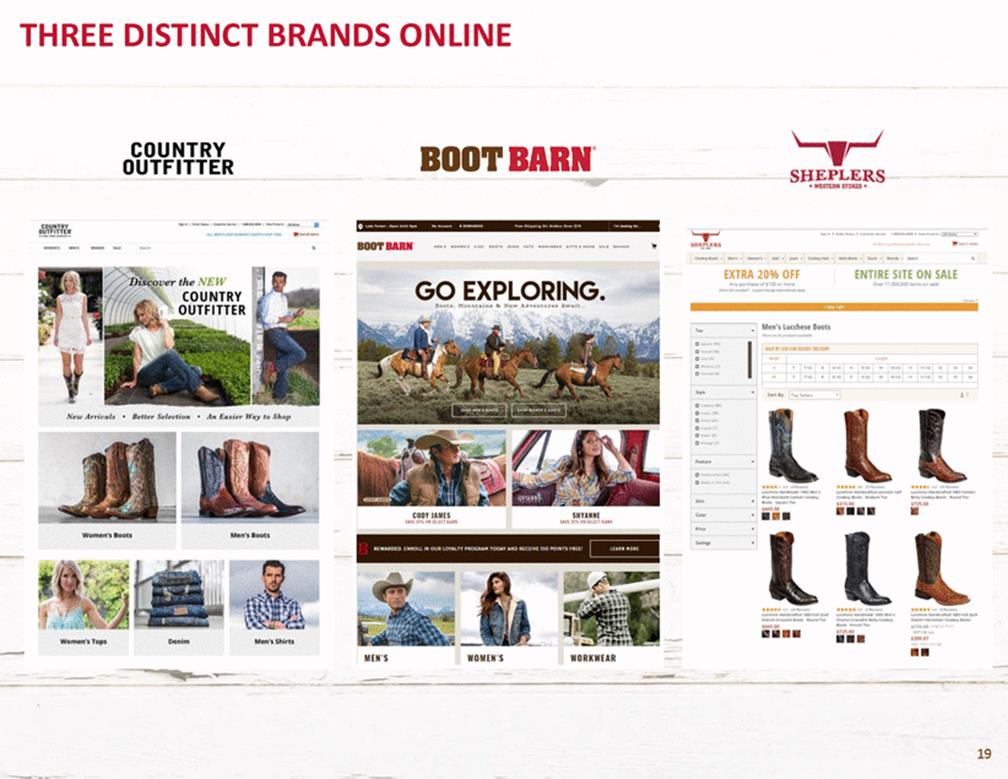
THREE DISTINCT BRANDS ONLINE .,-I COUNTRY OUTFITTER BOO,.BARN. SHEPLERS •WES'I'ERHSTOW• . .....,._.... ----·---·---,._ ,.., o... ,.,.'.... '"• '"•••• or-uoro COUNTRY T!,I!!!, '••• ' .•..,_. o...o••• O••• $" -..,. -... _,. -·,..... .....,_. - EXTRA 20% OFF ·,....... ENTIRE SITE ON SALE tt.QCQ.OOO..........,.... 800'1'BARN' Discover the NEW GO EXPLORING. COUNTRY OUTFITTER Mtn's lucchtst Boots I 0 0 0 0 0 0 0 0 0 0 0 ,....... 0 0 Nw Arrivals • B.tltu• Stlectio r • Att Ea.1ier Way to Shop .._........ ........-,.. ._ _...-..-..,.,_, .·...-.,.· ,_( ., .... •....•..• ._.... - • nnoo CODY JAMES U'fllO'Ii.Oif SiUCTIU.ItS SHYANNE Sh'[ JO"OH Si:UOlUlU Men's loots Women's Boots II£WA AD£0 £NAOLL IN OUR LOYALTY PAOC.A.lM TODAY AND A£UIY[ 150 POINTS rAH• ....,...._ -'"-·-.....-,.....-....·. .............•.'"_""_"'llt.U_f....,.. =:.:.:::.-...c...-.... a••• St4)00 •171)0•0• '"''" women·srops Denim Men'sShirts •• - - -MEN'S WOMEN 'S WORKWEAR 19 0 ••••,.
IMPROVING ONLINE & IN-STORE INTEGRATION SEAMLESS E-COMMERCE RETURNS IN STORE BUY ONLINE PICK UP IN STORE • • Provides competitive advantage Current functionality ships online inventory to store for pickup • Roughly 2/3rds of bootbarn.com returns came to store during holiday period • Soon to offer product in local store • • Creates an opportunity to save the sale in store Creates additional store visit and associated selling opportunity 20

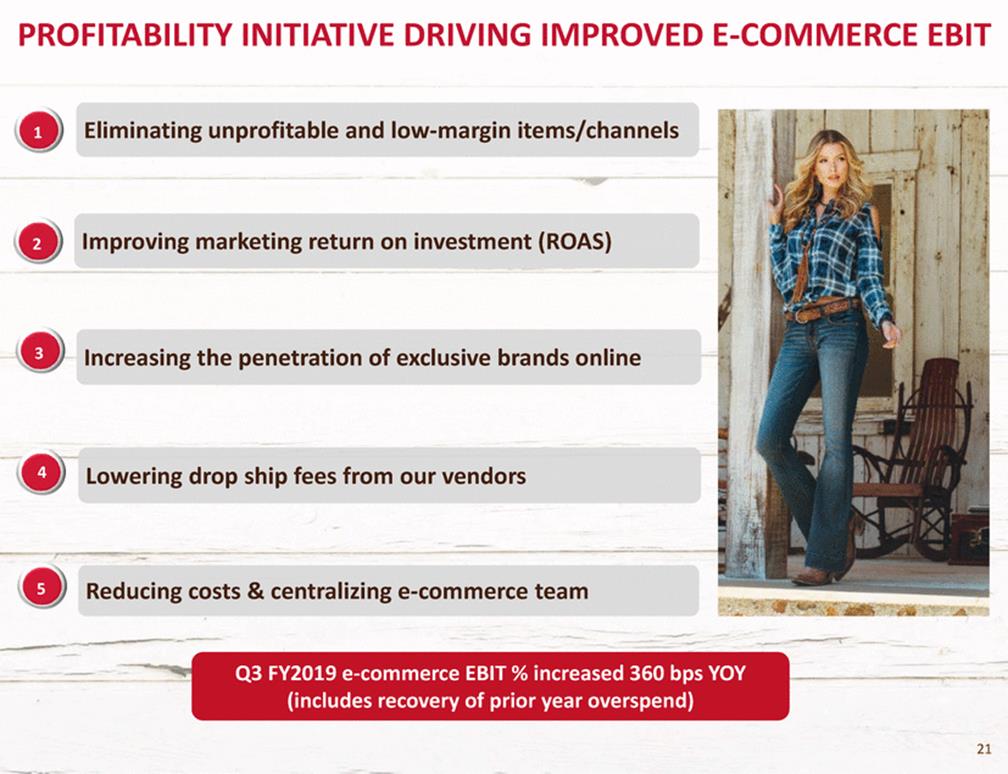
PROFITABILITY INITIATIVE DRIVING IMPROVED E-COMMERCE EBIT Eliminating unprofitable and low-margin items/channels 1 Improving marketing return on investment (ROAS) 2 3 Increasing the penetration of exclusive brands online 4 Lowering drop ship fees from our vendors 5 Reducing costs & centralizing e-commerce team Q3 FY2019 e-commerce EBIT % increased 360 bps YOY (includes recovery of prior year overspend) 21
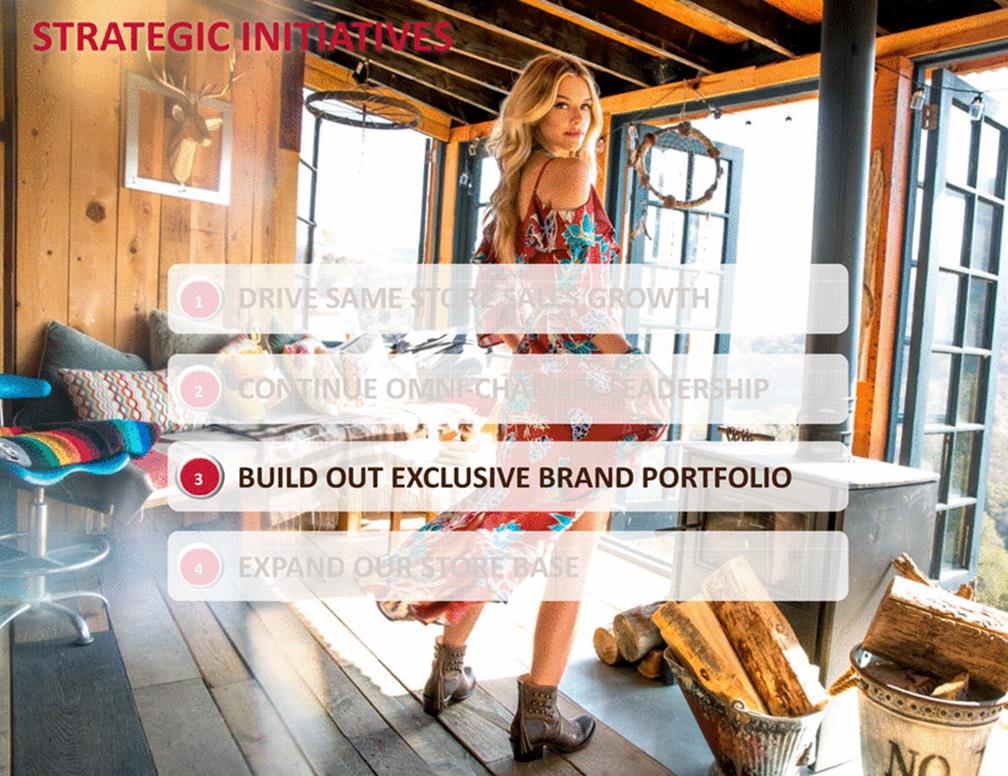
STRATEGIC INITIATIVES DRIVE SAME STORE SALES GROWTH 1 CONTINUE OMNI-CHANNEL LEADERSHIP 2 BUILD OUT EXCLUSIVE BRAND PORTFOLIO 3 EXPAND OUR STORE BASE 4 22
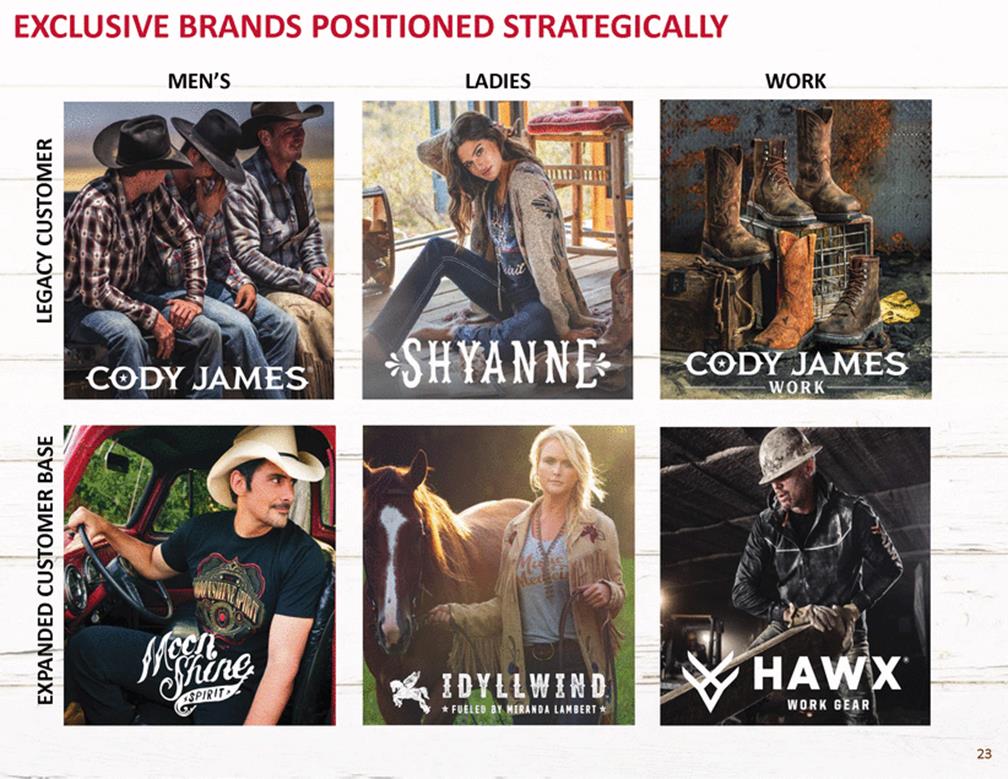
EXCLUSIVE BRANDS MEN'S POSITIONED STRATEGICALLY LADIES WORK 23
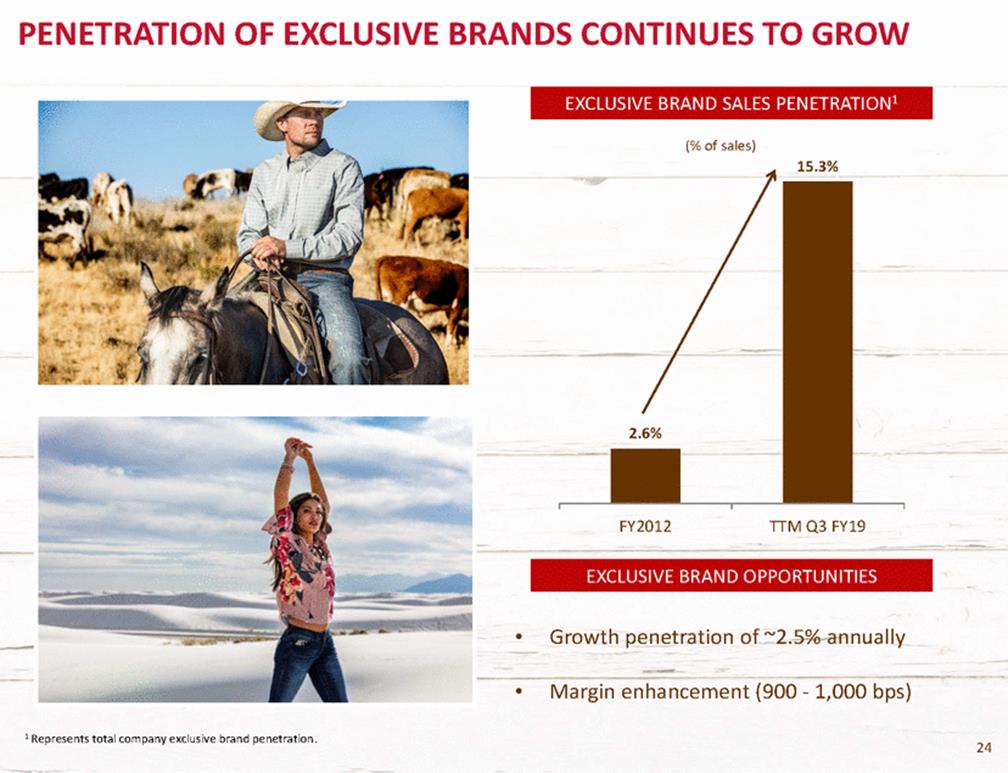
PENETRATION OF EXCLUSIVE BRANDS CONTINUES TO GROW (% of sales) 15.3% FY2012 TTM Q3 FY19 • Growth penetration of ~2.5% annually • Margin enhancement (900 - 1,000 bps) 1 Represents total company exclusive brand penetration. 24 EXCLUSIVE BRAND OPPORTUNITIES 2.6% EXCLUSIVE BRAND SALES PENETRATION1
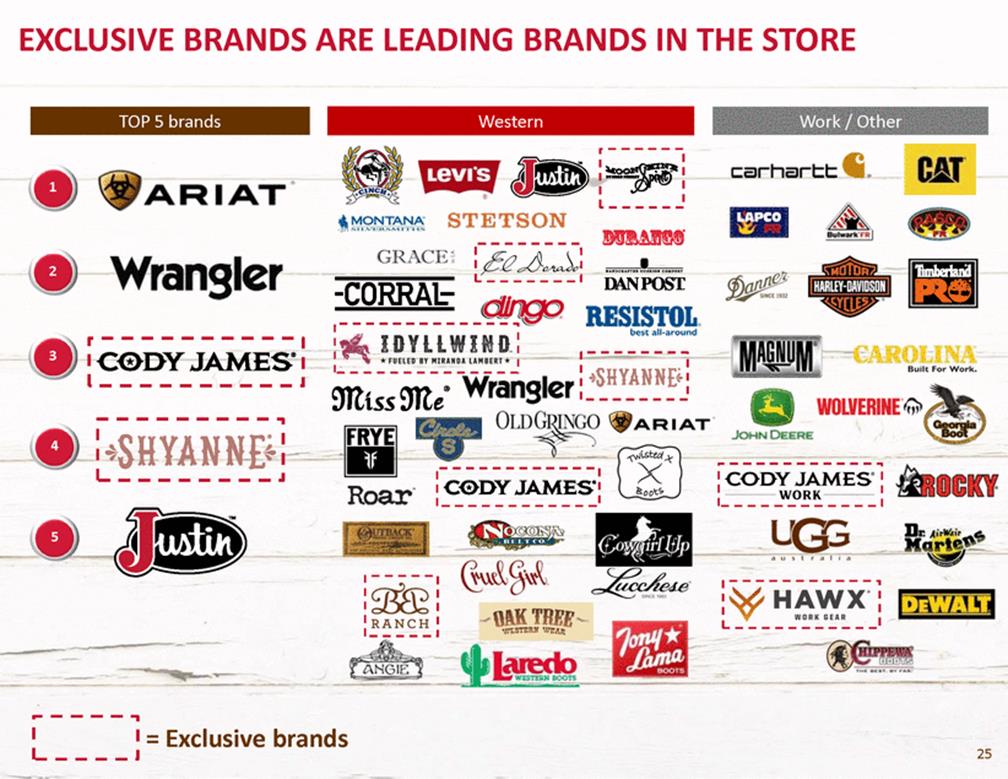
EXCLUSIVE BRANDS ARE LEADING BRANDS IN THE STORE Work I Other c:arhart:t:ti. r------Mifif1• :: ARIAT. L------• I .9 }"ST!::_?-:;£2Aoo Wrangler GRACE u .. .. . , "'""'"" -CORRAl:-Il\NPOSI L - _, 1-----------r!#JgO RESISTOL. e: - o d ..L I 0Y l l W IN 0.: I *FUELED BY MIRANDA LAMBERT* 1 I 1 m-t-t-s-s-m-te®---W--r-a-ngler :• _s_H_Y_A_N_NE_+. Built For Work. .1 ---------.. ;;IA::HT-E---• liil ,----ICIIVt· 1 CODY JAMES" I Roar· • CGDY JAMEs·• r '-oot woRK • .....__.._ • I_----------_I I_-----------1 .-----------, i·n'.'L!, l ·HAWX" : I v ---------L--------f-t-:-ll I • - --WORK GEAR ..----., 1 = Exclusive brands I 25 L----1 C.AT Western TOP 5 brands
STRATEGIC INITIATIVES DRIVE SAME STORE SALES GROWTH 1 CONTINUE OMNI-CHANNEL LEADERSHIP 2 BUILD OUT EXCLUSIVE BRAND PORTFOLIO 3 EXPAND OUR STORE BASE 4 2266
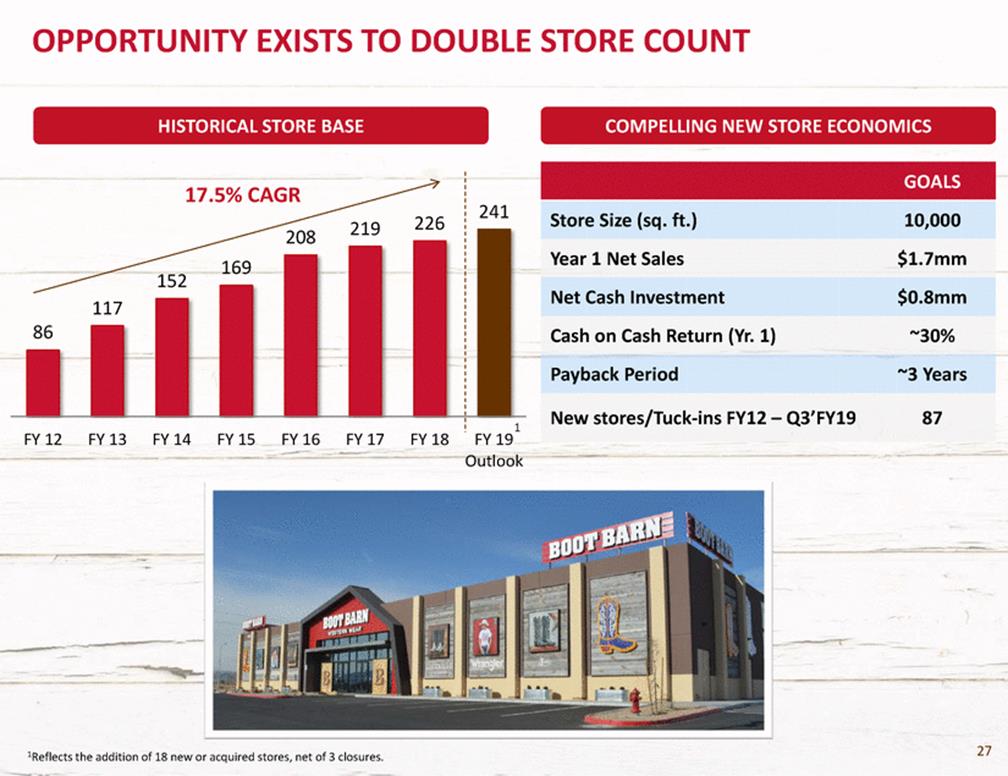
OPPORTUNITY EXISTS TO DOUBLE STORE COUNT COMPELLING NEW STORE ECONOMICS HISTORICAL STORE BASE 17.5% CAGR 208 241 Store Size (sq. ft.) Year 1 Net Sales Net Cash Investment Cash on Cash Return (Yr. 1) Payback Period 10,000 $1.7mm $0.8mm ~30% ~3 Years 226 219 169 152 117 86 New stores/Tuck-ins FY12 – Q3’FY19 87 1 FY 12 FY 13 FY 14 FY 15 FY 16 FY 17 FY 18 FY 19 Outlook 27 1Reflects the addition of 18 new or acquired stores, net of 3 closures. GOALS
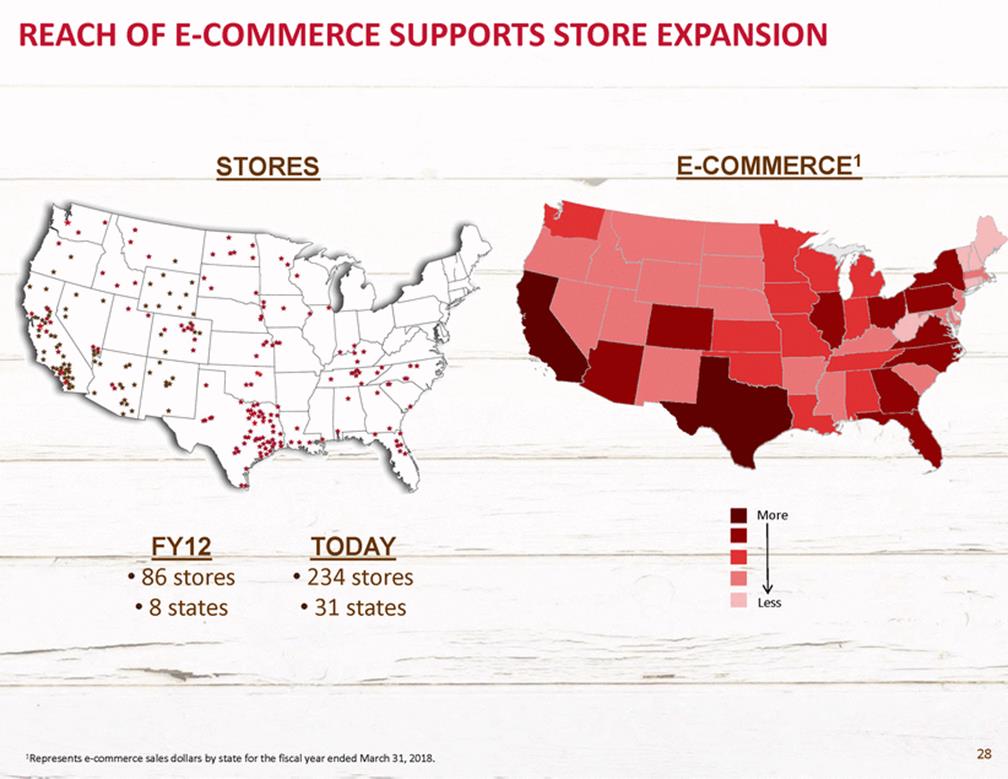
REACH OF E-COMMERCE SUPPORTS STORE EXPANSION E-COMMERCE1 STORES More FY12 • 86 stores • 8 states TODAY • 234 stores • 31 states Less 28 1Represents e-commerce sales dollars by state for the fiscal year ended March 31, 2018.
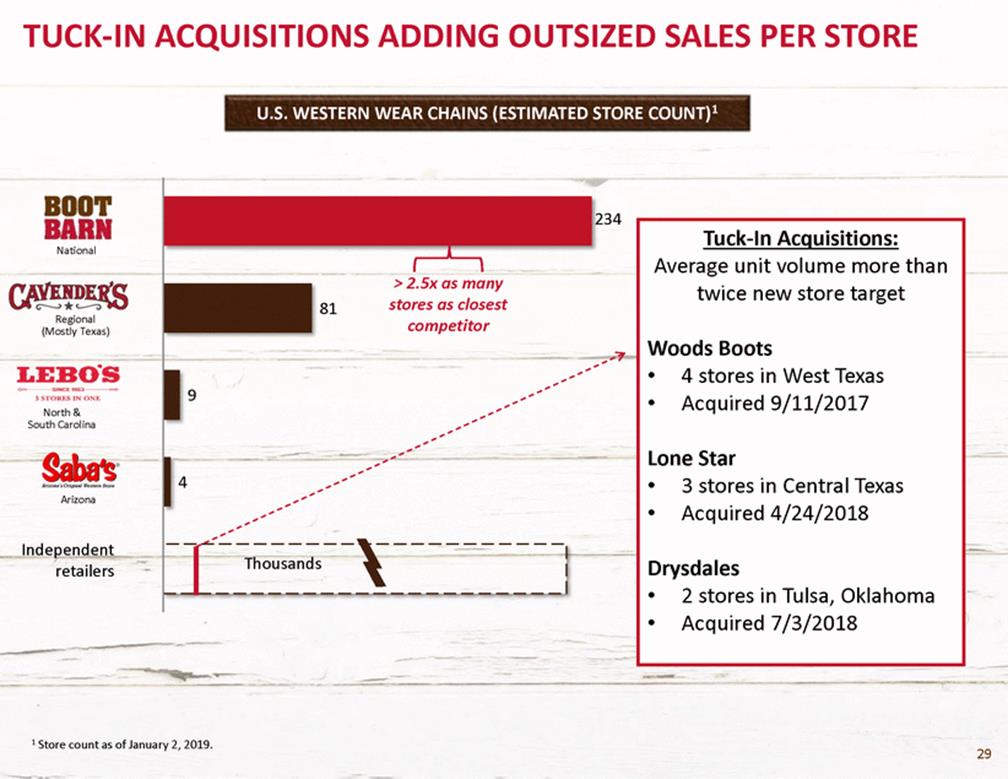
TUCK-IN ACQUISITIONS ADDING OUTSIZED SALES PER STORE U.S. WESTERN WEAR CHAINS (ESTIMATED STORE COUNT)1 234 Tuck-In Acquisitions: National Average unit volume more than twice new store target > 2.5x as many stores as closest competitor 81 Regional (Mostly Texas) Woods Boots • • 4 stores in West Texas Acquired 9/11/2017 9 North & South Carolina Lone Star 4 • • 3 stores in Central Texas Acquired 4/24/2018 Arizona Independent retailers Thousands Drysdales • • 2 stores in Tulsa, Oklahoma Acquired 7/3/2018 1 Store count as of January 2, 2019. 29
INVESTMENT THESIS

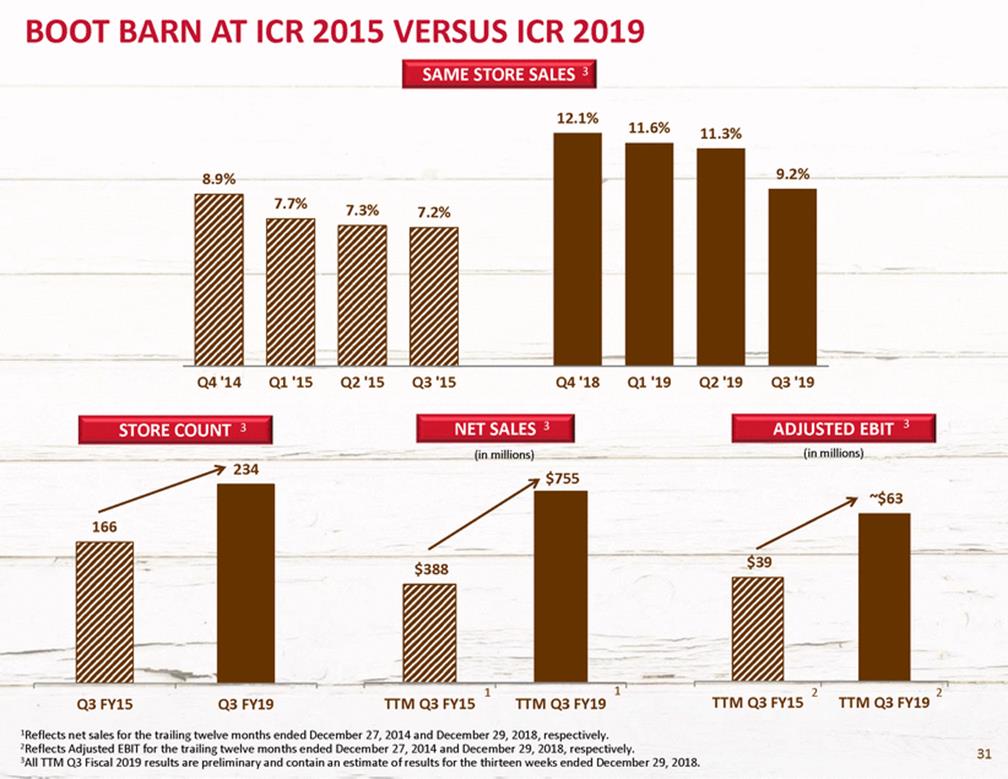
BOOT BARN AT ICR 2015 VERSUS ICR 2019 SAME STORE SALES 3 12.1% 11.6% 11.3% Q4 '14 Q1 '15 Q2 '15 Q3 '15 Q4 '18 Q1 '19 Q2 '19 Q3 '19 3 NET SALES (in millions) 3 ADJUSTED EBIT (in millions) STORE COUNT 3 234 $755 ~$63 1 1 2 2 TTM Q3 FY15 TTM Q3 FY19 TTM Q3 FY15 TTM Q3 FY19 Q3 FY15 Q3 FY19 1Reflects net sales for the trailing twelve months ended December 27, 2014 and December 29, 2018, respectively. 2Reflects Adjusted EBIT for the trailing twelve months ended December 27, 2014 and December 29, 2018, respectively. 3All TTM Q3 Fiscal 2019 results are preliminary and contain an estimate of results for the thirteen weeks ended December 29, 2018. 31 $39 $388 166 8.9% 9.2% 7.7%7.3%7.2%
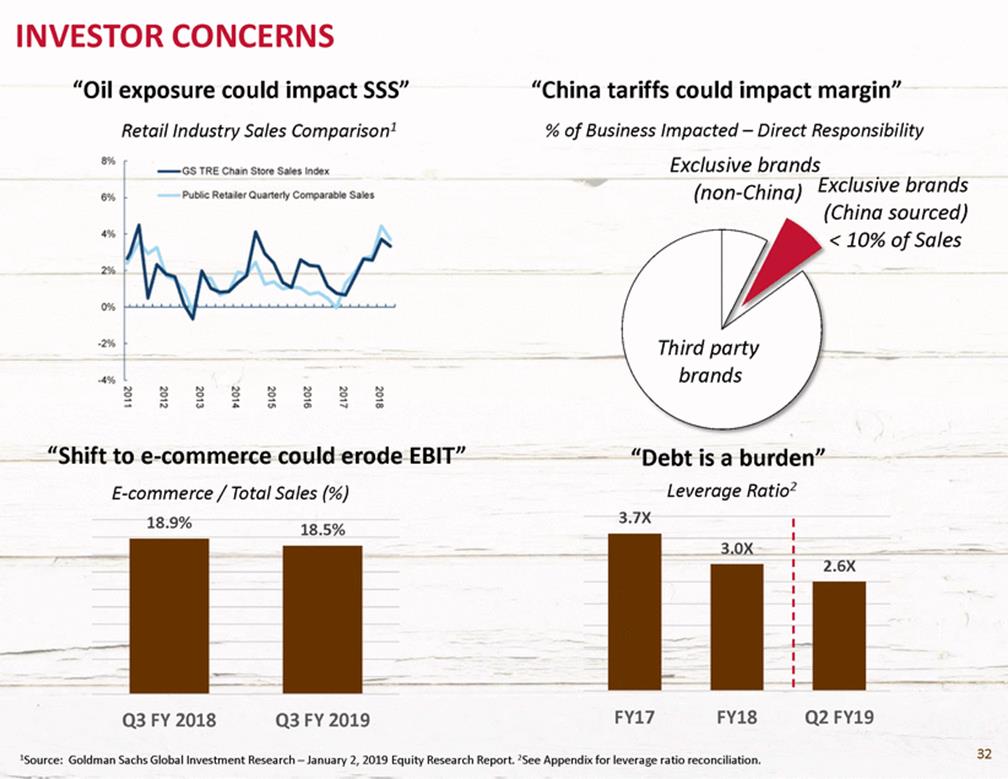
INVESTOR CONCERNS “Oil exposure could impact SSS” Retail Industry Sales Comparison1 “China tariffs could impact margin” % of Business Impacted – Direct Responsibility Exclusive brands Exclusive brands (China sourced) < 10% of Sales (non-China) Third party brands “Shift to e-commerce could erode EBIT” E-commerce / Total Sales (%) “Debt is a burden” Leverage Ratio2 3.7X 18.9% 18.5% FY17 FY18 Q2 FY19 Q3 FY 2018 Q3 FY 2019 32 1Source: Goldman Sachs Global Investment Research – January 2, 2019 Equity Research Report. 2See Appendix for leverage ratio reconciliation. 3.0X 2.6X
BOOT BARN STORY CONTINUES TO IMPROVE • • • Same Store Sales Growth Driven by customer count and transactions Revenue growth with reduced promotions Store 2 year stack accelerating • • • Omni Channel Leadership World class omni capability is complete DTC supply chain fully functioning Significant improvement in profitability • • • Exclusive Brands Product Design team in place Solid base of core brands (#3 & #4 in rank) Three new lines well received & growing • • • New Stores Opportunity to double store count Three year payback (30% return) Tuck-ins provide outsized $ volume 33
APPENDIX
ADJUSTED EBITDA AND ADJUSTED EBIT RECONCILIATION 1All TTM Q3 Fiscal 2019 results are preliminary and contain an estimate of results for the thirteen weeks ended December 29, 2018. 2The fiscal 2017 column has been adjusted to reflect management’s estimated 52-week results as fiscal 2017 was a 53-week year. The Company estimated that included in fiscal 2017 reported earnings per share was $0.03 attributed to the 53rd week. As such, the Company has estimated fiscal 2017 net income, excluding the 53rd week, to be $13.4 million compared to GAAP net income of $14.2 million. In calculating estimated Adjusted EBITDA and Adjusted EBIT on a 52-week basis, the Company also adjusted income tax expense, interest expense, and stock based compensation expense by taking 52/53rds of the GAAP reported fiscal 2017 numbers. (a) Represents non-cash compensation expenses related to stock options, restricted stock awards and restricted stock units granted to certain of our employees and directors. (b) Represents the non-cash accrual for future award redemptions in connection with our customer loyalty program. (c) Includes direct costs and fees related to the acquisitions of RCC, Baskins and Sheplers, which we acquired in August 2012, May 2013 and June 2015, respectively. (d) Represents certain store integration, remerchandising, inventory obsolescence and corporate consolidation costs incurred in connection with the integration of RCC, Baskins and Sheplers, which we acquired in August 2012, May 2013 and June 2015, respectively. Fiscal 2016 includes an adjustment to normalize the gross margin impact of sales of discontinued inventory from Sheplers, which was sold at a discount or written off. The adjustment assumes such inventory was sold at Sheplers’ normalized margin rate. (e) Represents the amortization of purchase-accounting adjustments that adjusted the value of inventory acquired to its fair value. (f) Represents loss on disposal of assets and contract termination costs from store closures and unused office and warehouse space. (g) Represents professional fees and expenses incurred in connection with secondary offerings conducted in January 2018 and February 2015 and a Form S-1 Registration Statement filed in July 2015 and withdrawn in November 2015. (h) Represents professional fees and expenses incurred in connection with acquisition activity. 35 (i) Represents store impairment charges recorded in order to reduce the carrying amount of the assets to their estimated fair values.
NET DEBT LEVERAGE RATIO RECONCILIATION 1For purposes of calculating the Consolidated Net Debt Leverage Ratio in accordance with our respective debt agreement, Fiscal 2017 has not been adjusted to reflect management’s estimate of the impact of the 53rd week. (a) Represents non-cash compensation expenses related to stock options, restricted stock awards and restricted stock units granted to certain of our employees and directors. (b) Represents the non-cash accrual for future award redemptions in connection with our customer loyalty program. (c) Represents loss on disposal of assets and contract termination costs from store closures and unused office and warehouse space. (d) Represents store impairment charges recorded in order to reduce the carrying amount of the assets to their estimated fair values. (e) Represents professional fees and expenses incurred in connection with the January 2018 and May 2018 secondary offerings. (f) Adjustments to Boot Barn's Adjusted EBITDA as provided in the 2015 Golub Term Loan and June 2015 Wells Fargo Revolver include pre-opening costs, franchise and state taxes, and other miscellaneous adjustments. (g) The consolidated net debt leverage ratio is calculated by dividing net consolidated total indebtedness by consolidated EBITDA per the loan agreements. 36