Attached files
| file | filename |
|---|---|
| 8-K - 8-K - Jefferies Financial Group Inc. | d664389d8k.htm |
Exhibit 99
January 10, 2019
Dear Fellow Shareholders,
By most measures, 2018 was a year of meaningful accomplishment at Jefferies Financial Group, as we achieved our overriding priorities identified in last year’s letter. We delivered consistent and solid results at Jefferies Group LLC, completed significant and very profitable transactions involving two of our Merchant Banking portfolio companies and drove solid progress across much of the rest of our principal investments. This was a lot of work and we are incredibly proud of everyone at Jefferies Financial Group for getting so many difficult jobs done so well.
In our fiscal year ended November 30, 2018, Jefferies Financial Group recorded net income attributable to common shareholders of $1.0 billion, or $2.90 per diluted share, and paid $0.45 per share in dividends. Fully diluted tangible equity per share increased by 22% from $20.48 at the beginning of the fiscal year to $24.90 on November 30.
There have been several periods in our careers when our stock price has been out of sync with our operating performance and future prospects. Since this mis-alignment evolved to such a material extent in 2018, it was as if we were “getting the call” from our own company about a compelling new investment opportunity and, in 2018, JEF was our single largest investment. We repurchased 50 million shares, representing 13% of our fully diluted shares outstanding at the beginning of the year and including 24 million shares repurchased in October and November, at an average price per share of $22.86, a material discount to both tangible and intrinsic values, or a total of $1.14 billion. We believe this buyback is highly accretive and rewarding to all our long-term shareholders. In our experience, perception does eventually reflect reality, particularly when the investment story is becoming more focused and straightforward.
Combining the share buyback with the dividends paid in the eleven-month period of 2018, we returned to our shareholders an aggregate of $1.3 billion, or 17% of our beginning of year tangible common shareholders’ equity. Even after this return of capital to our shareholders and our $400 million of investments to expand Vitesse Energy Finance and Leucadia Asset Management, we ended fiscal 2018 with an increase of $300 million in parent company liquidity, which now totals $1.6 billion. This leaves us continuing in a strong position to defend against adversity and to take advantage of new opportunities, whether to acquire businesses or investments, expand our existing franchise or return additional capital to shareholders.
Perhaps even more important than the strong results, we believe the strategic changes made in 2018 will become more apparent and productive starting in fiscal 2019. Despite the many benefits and opportunities that arose from the combination, the merger of Leucadia and Jefferies was confusing to investors and others to understand. The full consolidation of National Beef’s results, given Beef’s high revenues and relatively low operating margin, made it very difficult to comprehend our consolidated income statement. With the deconsolidation of National Beef, we simplified our story considerably and marked this increased focus by changing the name of our parent company to Jefferies Financial Group Inc., a financial services holding company focused on investment banking and capital markets, asset management and principal investing.
Jefferies Financial Group Inc. Annual Report 2018 1
Furthering this simplification, on October 1, we transferred into Jefferies Group our 50% interest in Berkadia and our Leucadia Asset Management seed investments, thereby amalgamating our long-term financial services operating businesses into one platform. Our merchant banking efforts will be presented separately in semi-annual disclosures of the estimated fair market value of this portfolio.
The final and equally necessary simplification was the alignment of our two previously distinct fiscal year ends. There is historical rationale for how we got there, but two different year ends made it more difficult to follow our financial performance. With this alignment to a year ending on November 30, we will provide timely financial information four times a year in a comprehensive, consistent and transparent format.
2019 should be our most straightforward and readily understandable financial reporting period in a long time, and we believe this should help narrow substantially the gap between perception of value and the reality of stock price. We are realists who care passionately about our responsibilities and obligations to all our stakeholders. As long-term, large shareholders, we are fully aligned with all shareholders and committed to not only creating value, but having it recognized.
Looking forward, our top priority is growth and margin improvement at Jefferies Group driven by continued expansion of our Investment Banking effort, continuing market share gains in Equities, recovery in Fixed Income and better results in Asset Management. We expect our Merchant Banking portfolio will yield several further monetization events in the next couple of years. We will continue to review opportunities for further direct investment, and will act when we find solid value that can accrue for our shareholders. We enter 2019 in as strong a position as ever to build upon our solid foundation.
Investment Banking, Capital Markets and Asset Management
We recorded net revenues at Jefferies Group of almost $3.2 billion, pre-tax income of $410 million and adjusted return on tangible equity of 8.7%. There is never a good excuse for missing our double digit goal, but our lower than targeted adjusted ROTE primarily reflects the challenging markets of the fourth quarter. However, despite heightened volatility, a significant decline in oil prices and a severe backup in leveraged finance and all risk classes, all our businesses held up well, albeit, in a few cases, at more moderate levels, but meaningfully better than in similar conditions in 2015 and early 2016. Jefferies Group’s quarter end gross assets have remained at approximately $40 billion since the balance sheet de-leveraging and de-risking we undertook in late 2015 and early 2016. Maintaining consistently lower levels of risk and balance sheet for the last few years has helped limit the downside during times of market stress.
Our competitive position strengthened further over the course of the year. Several of our primary competitors continue to experience challenges, which may lead to further industry consolidation and create additional market share growth opportunities.
Investment Banking. Our Investment Banking net revenues were $1.9 billion in 2018, or 60% of Jefferies Group’s total net revenues, driven by record performance in our advisory and equity capital markets businesses. We believe we are benefitting from our flat structure, our entrepreneurial culture, our focus on prioritizing insight rather than balance sheet, and our approach to client service that emphasizes partnership and the long-term. This has led to over 74% of 2018 Investment Banking net revenues being from existing clients.
Over the last five years, our Investment Banking net revenues have grown at the highest annual rate of all major global investment banks. In the U.S., our home market and the largest market for our services, our overall fee market share increased considerably and, for the twelve months ended November 30, 2018,
2 Jefferies Financial Group Inc. Annual Report 2018
we ranked 7th in mergers and acquisitions, 6th in equity capital markets and 6th in leverage finance, all as measured by Dealogic. The table below is testament to decades of effort by many people, perseverance in our strategy and execution, and Jefferies Group’s good fortune to be the only full service investment banking firm to survive the upheaval and challenges of the past 20+ years and break into the top ranks in all relevant lines of business.
Source: Dealogic
We continue to believe we are experiencing an inflection point in the scale and momentum of our Investment Banking business, driven by our efforts to enter a large number of new industry sectors, significantly expand our product capabilities and increase productivity from our senior investment bankers as they become more tenured at Jefferies Group. We are growing our M&A franchise in larger transactions, with transactions over $1 billion in size now accounting for over 50% of our M&A revenue, while at the same time we remain a leader and continue to build our footprint in the middle market M&A business. Finally, we are monetizing the large M&A and equity capital markets revenue opportunities embedded in the incumbent corporate relationships that we have established as one of the largest providers of U.S. leveraged buyout financing.
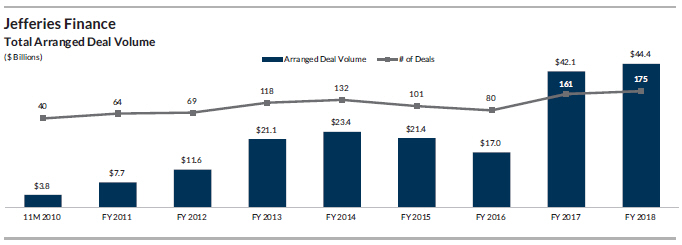
Net revenues and pre-tax income of Jefferies Finance, our corporate lending 50/50 joint venture with MassMutual Life Insurance Company, were a record $438 million and $205 million, respectively, in 2018. Jefferies Finance originated a record $44 billion in corporate loans in 2018.
Established in 2004, Jefferies Finance has demonstrated growth and resilience across multiple market cycles and has lead arranged over $195 billion in financing. In addition to its syndication business, Jefferies Finance is an asset manager and also provides direct lending to middle market companies. Jefferies Finance completed three new CLOs this year and manages over $7.5 billion of assets, a portion of which are retained from Jefferies Finance-arranged transactions. Jefferies Finance’s strategy will remain focused on growing market share in its core U.S. and European loan syndication business, as well as further expanding into middle market direct lending (both origination and asset management), which represents a significant growth opportunity.
Jefferies Financial Group Inc. Annual Report 2018 3
Since we may be late in the credit cycle, it is important to note that Jefferies Finance ended the year in a strong position in terms of risk exposure, having successfully syndicated all deals we brought to market during the year. Our commitments outstanding at year end were all of good quality, with terms consistent with current market conditions, and should be fully syndicated readily in the near-term. We remain vigilant in our underwriting process, while continuing to serve our clients and maintain our market position.
Real Estate Finance. Berkadia, our commercial real estate finance and investment sales 50/50 joint venture with Berkshire Hathaway, delivered a record $222 million of pre-tax income and a record $166 million of cash earnings for the eleven months ended November 30, 2018, up 37% and 12%, respectively from last year’s first eleven months. Strong debt origination and additional third party loan servicing arrangements increased our servicing portfolio to $234.7 billion. Our servicing portfolio has experienced an almost complete turnover since the acquisition of the company in 2009, while the change in mix of the portfolio, coupled with cost compression efforts, have consistently improved revenue and margin. During the year, Berkadia placed a record $23.1 billion of debt for its clients, up over 4% compared to 20171. Similarly, investment sales volumes also set a record, up 6% from the prior year1, totaling $7.5 billion, with 36% of investment sales volume resulting in a debt placement for Berkadia. Berkadia’s improved performance was largely driven by increased productivity of existing mortgage bankers and investment sales advisors, and recruiting of new ones, which bodes well for the future.
Equities. In Equities, we recorded 2018 net revenues of $666 million, relatively flat from the prior year, as growth in our core equities business was offset by losses in certain block positions. The strong performance in our core Equities business reflects continued market share gains driven by intense client focus, enhanced global capabilities and the momentum of the overall Jefferies platform. We have considerably diversified this business, with electronic trading and international markets now representing a significant portion of our Equities net revenues. While absorbing the effects of MiFID II and the increasing market volatility, we have risen to be ranked #5 in the U.S. with large global clients and our overall global market share increased as well.
Fixed Income. Our 2018 Fixed Income net revenues were $560 million, down 9% from the prior year, primarily due to the weakness in the fourth quarter, when our Fixed Income net revenues of $87 million were 45% below the average of the first three quarters of the year. Despite these lower results, Fixed Income is delivering more consistent performance, with increased capital efficiency and lower risk, after further enhancing our team, focusing on our best opportunities and reducing risk, balance sheet and capital utilization.
4 Jefferies Financial Group Inc. Annual Report 2018
Asset Management. Our Asset Management net revenues at Jefferies Group were near zero for the year, as $21 million in fees earned were offset by $22 million in investment losses and net interest expense associated with the capital utilized in Asset Management. At the parent company level, we recorded a further $78 million in pre-tax losses largely due to negative returns in a small handful of our strategies at Leucadia Asset Management prior to the October 1 transfer to Jefferies Group. These investment losses were a product of the two challenging periods of 2018, which overwhelmed most asset management strategies.
We are still in the early days of developing this business, and continue to make significant strides in growing the portfolio of managers with whom we are partnered and the assets under management. We announced partnerships with Weiss Multi-Strategy Advisers and Schonfeld Strategic Advisors in 2018, with the former becoming effective May 1, 2018 and the latter having commenced earlier this month on January 1, 2019. Both transactions allow us to partner with well-established firms in the broadly defined multi-manager space that we believe will be in high demand for the foreseeable future.
To support these new efforts and our other ongoing initiatives, we have been adding to our marketing and business development team. Combined with our world class infrastructure, this sets us apart as the partner of choice for strong investment teams. Given our ability not only to invest in these platforms, but also to help them grow and provide back office support, managers can focus on the most important element to success, investment performance. We believe 2018 marks the end of the initial start-up losses and growing pains for this business, and we look forward to earning reasonable returns as we begin to scale this business with a much-improved level of diversification.
Merchant Banking
Merchant Banking is where we leverage our team, ideas, relationships and information flow to make unique long-term principal investments. Realizations will happen from time to time, typically when we believe the trajectory for growth has been substantially completed or where a third party comes along and makes us the proverbial “offer we can’t refuse.” To help keep track of the progress of our portfolio while we continue to build value and wait for the right time to realize value, we are providing fair value estimates for our investments on a semi-annual basis. The second iteration of this process is below:
| As of November 30, 2018 | ||||||||||
| ($ Millions) | Book Value | Estimated Fair Value |
Basis for Fair Value Estimate | |||||||
| Investments in Public Companies |
||||||||||
| Spectrum Brands |
$ | 374 | $ | 374 | Mark-to-market (same for GAAP book value) | |||||
| HomeFed |
338 | 488 | Mark-to-market (equity method for GAAP book value) | |||||||
| Other |
263 | 263 | Mark-to-market (same for GAAP book value) | |||||||
|
|
|
|
|
|||||||
| Sub-Total |
975 | 1,125 | ||||||||
| Investments in Private Companies |
||||||||||
| National Beef |
654 | 695 | Income approach, market comparable and market transaction method | |||||||
| Linkem |
165 | 555 | Income approach, market comparable and market transaction method | |||||||
| Oil and Gas (Vitesse and JETX) |
641 | 671 | Income approach, market comparable and market transaction method | |||||||
| WeWork |
254 | 254 | Market transaction method and option pricing theory | |||||||
| Idaho Timber |
78 | 145 | Income approach, market comparable and market transaction method | |||||||
| Other(A) |
558 | 684 | Various | |||||||
|
|
|
|
|
|||||||
| Sub-Total |
2,350 | 3,004 | ||||||||
|
|
|
|
|
|||||||
| Total Merchant Banking Business |
$ | 3,325 | $ | 4,129 | ||||||
|
|
|
|
|
|||||||
| (A) | Includes FXCM, Golden Queen, M Science, Foursight and various other investments. |
Jefferies Financial Group Inc. Annual Report 2018 5
Realizations. In 2018, we completed two substantial realizations, booking considerable profits. In June, we sold 48% of National Beef to Marfrig Global Foods, a Brazilian beef packer, for $908 million in cash, reducing our ownership in National Beef from 79% to 31%. In 2018, we recognized a pre-tax gain on this transaction of $873 million. We continue to designate two board members and have a series of other rights in respect of our continuing equity interest, with a lockup period of five years and thereafter a fair market value liquidity option. As of the closing of the sale on June 5, 2018, we deconsolidated our investment in National Beef and account for our remaining 31% interest in National Beef under the equity method of accounting.
During the third quarter of 2018, we sold 100% of our equity interests in Garcadia, our auto dealer group, and our associated real estate holdings to our former partners, the Garff family, for $417 million in cash. We recognized a pre-tax gain as a result of this transaction of $222 million.
Portfolio Update. National Beef’s 2018 EBITDA2 of $648 million was a run-away all-time record. National Beef continues to benefit from being on the front-end of the multi-year cattle cycle, with cattle available for slaughter continuing to grow. There is ample supply to run our plants efficiently and meet consumer demand, which is the other half of the equation.
Having finished the clean-up of HRG’s other assets, HRG merged into Spectrum Brands in July. Unfortunately, results at Spectrum Brands deteriorated considerably during 2018 and the stock price declined significantly. We recorded a $419 million unrealized mark-to-market write-down of the value of our Spectrum Brands shares in 2018. Needless to say, we are rolling up our sleeves to help fix Spectrum Brands.
Vitesse Energy Finance completed a timely and value-creating $190 million acquisition of additional Bakken oil assets in April 2018 and cumulatively has invested $439 million of our capital to acquire, develop and produce cash flow from oil and gas properties in proven, lower risk oil and gas fields in the growing core of the Bakken Field in North Dakota.
This was an eventful year for Linkem and one that has provided strong validation of its bright future. Aside from continued strong subscriber growth and the development and launch of new products and services, a handful of auctions for similar frequency to that owned by Linkem, including the Italian 3.6-3.8GHz auction, resulted in prices far exceeding expectations. Linkem had 586,000 subscribers at November 30, 2018.
While our $279 million rescue of FXCM has so far generated $350 million of principal, interest and fees in cash back to Jefferies, FXCM had another challenging year. FXCM has done a good job streamlining operations and improving its product offerings and remains well positioned to take advantage of rising interest rates and the return of volatility to the FX and equities markets.
HomeFed had a strong year. At its Otay Land project in San Diego county, which is entitled for approximately 13,050 residential units and 1.85 million square feet of commercial space, 340 of the 992 planned home sales have closed at the Village of Escaya, its initial development at Otay. Construction has also started on its first mixed-use project at Otay, The Residences and Shops at The Village of Escaya.
It was a tale of two halves for Idaho Timber. Thankfully the two halves added up to a very good year as a whole. The first half saw record spreads and margin thanks to sustained high prices due to supply limitations industry-wide. The second half saw a deterioration in demand and increased supply which contributed to a steep drop in prices that left many wood suppliers off-balance. Of late, the supply/demand dynamic has stabilized, with operations returning to solid levels of profitability.
6 Jefferies Financial Group Inc. Annual Report 2018
Annual Meeting and Investor Day
We look forward to answering your questions at our upcoming Annual Meeting on March 28, 2019. We also will hold our annual Jefferies Investor Day on October 16, 2019, at which time you will have the opportunity to hear from our senior leaders across the Jefferies platform.
We thank all of you—our clients and customers, employee-partners, fellow shareholders, bondholders, vendors and all others associated with our businesses—for your continued partnership and support.
Sincerely,
| /s/ Richard B. Handler |
/s/ Brian P. Friedman |
|||||
| Richard B. Handler | Brian P. Friedman | |||||
| Chief Executive Officer | President |
| 1 | Berkadia year-over-year comparisons are for the first eleven months of 2018 compared to the first eleven months of 2017. |
| 2 | National Beef’s EBITDA is for the first eleven months of 2018. |
Jefferies Financial Group Inc. Annual Report 2018 7
Appendix
The following tables reconcile financial results reported in accordance with generally accepted accounting principles (“GAAP”) to non-GAAP financial results. The shareholders’ letter contains non-GAAP financial information to aid investors in viewing our businesses and investments through the eyes of management while facilitating a comparison across historical periods. However, these non-GAAP financial measures should be viewed in addition to, and not as a substitute for, reported results prepared in accordance with GAAP.
Note: Berkadia and National Beef are not consolidated by Jefferies Financial Group and are accounted for under the equity method. The Berkadia and National Beef reconciliations below are provided for convenience only.
8 Jefferies Financial Group Inc. Annual Report 2018
Cautionary Note on Forward-Looking Statements
This letter contains “forward-looking statements” within the meaning of the safe harbor provisions of Section 27A of the Securities Act of 1933 and Section 21E of the Securities Act of 1934. Forward-looking statements include statements about our future and statements that are not historical facts. These forward-looking statements are usually preceded by the words “should,” “expect,” “intend,” “may,” “will,” or similar expressions. Forward-looking statements may contain expectations regarding revenues, earnings, operations, and other results, and may include statements of future performance, plans, and objectives. Forward-looking statements also include statements pertaining to our strategies for future development of our businesses and products. Forward-looking statements represent only our belief regarding future events, many of which by their nature are inherently uncertain. It is possible that the actual results may differ, possibly materially, from the anticipated results indicated in these forward-looking statements. Information regarding important factors, including Risk Factors that could cause actual results to differ, perhaps materially, from those in our forward-looking statements is contained in reports we file with the SEC. You should read and interpret any forward-looking statement together with reports we file with the SEC.
Past performance may not be indicative of future results. Different types of investments involve varying degrees of risk. Therefore, it should not be assumed that future performance of any specific investment or investment strategy will be profitable or equal the corresponding indicated performance level(s).
Jefferies Financial Group Inc. Annual Report 2018 9