Attached files
| file | filename |
|---|---|
| 8-K - 8-K - Jernigan Capital, Inc. | f8-k.htm |
Exhibit 99.1
| November 2018 Investor Presentation INVESTOR PRESENTATION JERNIGAN CAPITAL 6410 Poplar Ave, Suite 650 Memphis, TN 38119 |
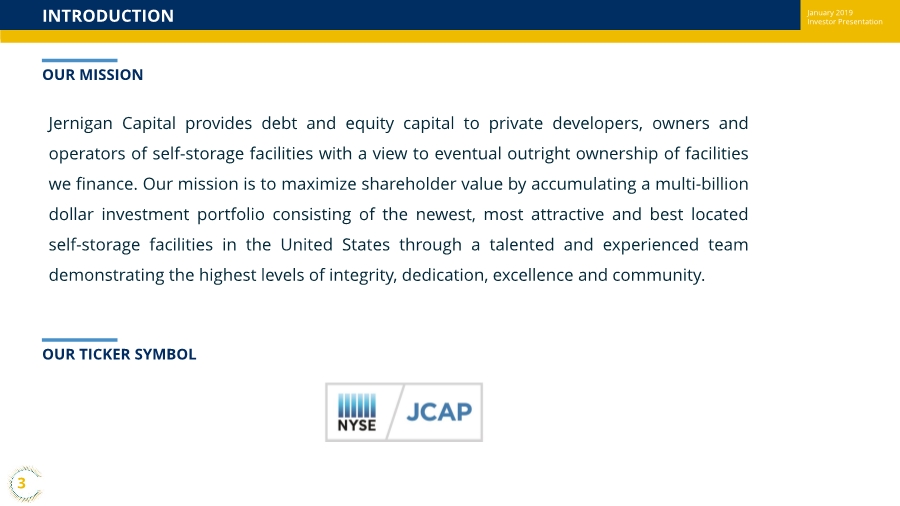
| November 2018 Investor PresentationSAFE HARBOR DISCLOSURE REGARDING FORWARD-LOOKING STATEMENTS This presentation includes "forward-looking statements" within the meaning of Section 27A of the Securities Act of 1933 and Section 21E of the Securities Exchange Act of 1934 and other federal securities laws. Such statements relate to our future performance, future book value, rates of return, ability to obtain future financing, including our ability to increase the capacity under our credit facility, exit capitalization rates, our use of capital, the timing of our investment cycle, future deliveries of new self-storage facilities in United States markets, the expected timing of completion of projects we finance, our ability to acquire wholly-owned assets, future profits from investments, our future stock price, our dividends to our common stockholders and the holders of our Series A and Series B Preferred Stock, our investment pipeline, our anticipated investment closings, future funding of existing investment commitments, and components of our full-year 2018 earnings guidance. The ultimate occurrence of events and results referenced in these forward-looking statements is subject to known and unknown risks and uncertainties, many of which are beyond our control. Such risks include our ability to obtain additional liquidity to fund our investment pipeline, our ability to make distributions at expected levels, the potential impact of interest rate fluctuations, the uncertainty as to the value of our investments, the lack of liquidity in our investments and whether we can realize expected gains from our equity participation interests. These forward-looking statements are based upon our present intentions and expectations, but the events and results referenced in these statements are not guaranteed to occur. Investors should not place undue reliance upon forward-looking statements. There can be no assurance that our expectations of the future performance of our investments will be achieved. This information provided herein is as of this date, and we undertake no duty to update any forward-looking statements contained herein. For a discussion of these and other risks facing our business, see the information under the heading “Risk Factors” in our Annual Report on Form 10-K for the year ended December 31, 2017 and in other filings we make with the Securities and Exchange Commission (“SEC”) from time to time, which are accessible on the SEC’s website at www.sec.gov. This presentation contains statistics and other data that has been obtained from or compiled from information made available by third parties. We have not independently verified such statistics or data. Unless otherwise indicated, all metrics presented herein are as of September 30, 2018. 2 |
| November 2018 Investor PresentationINTRODUCTION January 2019 Investor Presentation OUR MISSION OUR TICKER SYMBOL Jernigan Capital provides debt and equity capital to private developers, owners and operators of self-storage facilities with a view to eventual outright ownership of facilities we finance. Our mission is to maximize shareholder value by accumulating a multi-billion dollar investment portfolio consisting of the newest, most attractive and best located self-storage facilities in the United States through a talented and experienced team demonstrating the highest levels of integrity, dedication, excellence and community. 3 |
| November 2018 Investor PresentationRecent Events (1) The accordion feature is subject to certain conditions including obtaining additional commitments from lenders. The following events occurred during the quarter ending 12/31/2018: 4 . 11/20/2018: The Company closed on a development investment with a commitment amount of $9.2 million in the Baltimore, MD MSA. . 11/30/2018: The Company’s common stock was included in the MSCI US Investible Market 2500 Index. . 12/4/2018: The Company received full repayment of its Chicago operating property loan in the amount of $2.5 million. . 12/6/2018: Rebecca Owen and Randy Churchey joined the Company’s Board of Directors as independent members, expanding the board to eight members. . 12/7/2018: The Company refreshed its common stock at-the-market (“ATM”) program for $75 million. . 12/18/2018: The Company’s Boston 1 development loan was refinanced by a third party, resulting in full repayment of the outstanding loan balance in the amount of $12.6 million. JCAP retained its 49.9% profits interest in the underlying self-storage facility. . 12/21/2018: The Company acquired the membership interest of its developer partner in a recently completed self-storage facility located at 1775 Fifth Avenue in Bay Shore, New York. With this acquisition, the Company now has 100% ownership of seven on- balance sheet development investments. . 12/28/2018: The Company entered into an amended and restated senior secured revolving credit facility of up to $235 million with an accordion feature permitting expansion up to $400 million.(1) The facility has a three-year term that expires December 28, 2021 and two one-year extension options to extend the maturity of the facility to December 28, 2023. Advances under the credit agreement bear interest at rates between 225 and 325 basis points over 30-day LIBOR. . From time to time during the quarter, the Company issued an aggregate $20.3 million of common stock under the company’s ATM program at an average share price of $21.16. This average price represents a 15% premium to the Company’s reported book value per share on 9/30/2018. The majority of these shares were issued into significantly elevated trading volume that management believes is due to the inclusion of the Company’s common stock in the MSCI US Investible Market 2500 Index beginning on November 30, 2018. Proceeds have already been fully deployed into development properties. January 2019 Investor Presentation |
| November 2018 Investor Presentation . $370+ million pipeline of investments in underwriting . Increasing short-term opportunity to acquire full ownership of existing projects as 2017 investments are completed and lease up . Bridge and other creative financing structures provide additional acquisition opportunities in addition to accretive earnings growth opportunities Significant Identified and Potential Growth Opportunities Compelling Investment Economics . Solely focused on self-storage – top performing real estate sector in total shareholder return since 1994(1) . Core Investment Structure – 6.9%+ fixed return and profits interest = high IRRs, strong earnings and value growth . RoFRs (“Right of First Refusal”) and motivated sellers create high return opportunities to acquire developers’ interests in existing projects; seven buyouts completed through 12/31/2018 Flexible Capital Structure Supports Strong Future Growth . Demonstrated access to capital for external growth via public offerings of common and preferred stock, private preferred stock sale, ATM programs, credit facility, secured term loans, senior participations and joint venture transactions . Identified sources of capital to fund all current commitments . Strong ownership by senior executives and board (~8%) and institutions (~63%) . Stable $1.40 per share of common stock annualized dividend supported by GAAP earnings in 2018 High Quality Platform with Demonstrated Expertise . 70 current investments totaling ~$834 million – $711 million on balance sheet and $123 million in joint venture with Heitman (“Heitman JV”)(2) . Closed $409 million of new development investments in 2017 . Dedicated team with extensive knowledge of and relationships within the self-storage industry . Disciplined investment process; closed on only ~8% of the investments evaluated since IPO(3) . Scalable corporate platform and best-of-class third party management by powerful REIT platforms – e.g. CUBE, EXR, LSI INVESTMENT HIGHLIGHTS (1) Source: Nareit. | (2) Represents closed loan commitments and wholly-owned property investments as of 12/31/18, excluding closed investments that have been repaid. | (3) Represents closed loan commitments and wholly-owned property investments as of 12/31/18, including closed investments that have been repaid.5 January 2019 Investor Presentation |
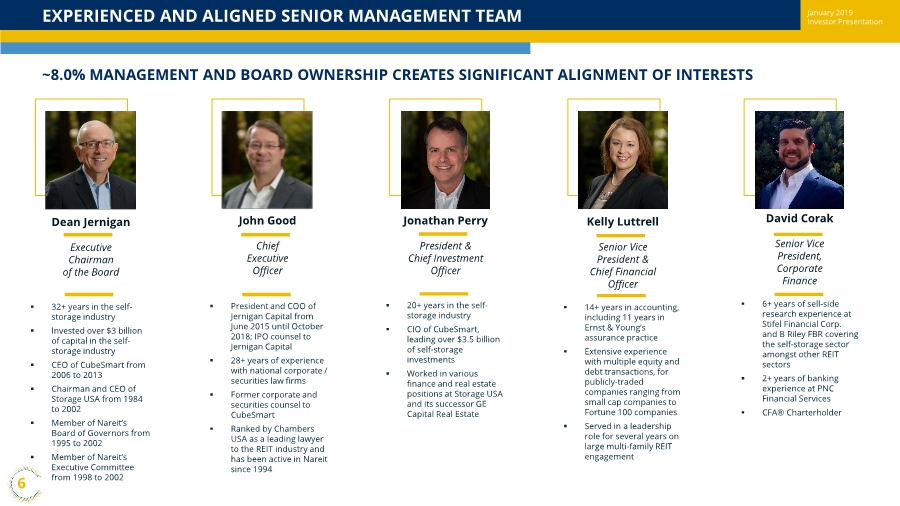
| November 2018 Investor PresentationEXPERIENCED AND ALIGNED SENIOR MANAGEMENT TEAM ~8.0% Management and Board Ownership Creates Significant Alignment of Interests ~8.0% MANAGEMENT AND BOARD OWNERSHIP CREATES SIGNIFICANT ALIGNMENT OF INTERESTS . 32+ years in the self- storage industry . Invested over $3 billion of capital in the self- storage industry . CEO of CubeSmart from 2006 to 2013 . Chairman and CEO of Storage USA from 1984 to 2002 . Member of Nareit’s Board of Governors from 1995 to 2002 . Member of Nareit’s Executive Committee from 1998 to 2002 Dean Jernigan Executive Chairman of the Board . President and COO of Jernigan Capital from June 2015 until October 2018; IPO counsel to Jernigan Capital . 28+ years of experience with national corporate / securities law firms . Former corporate and securities counsel to CubeSmart . Ranked by Chambers USA as a leading lawyer to the REIT industry and has been active in Nareit since 1994 John Good Chief Executive Officer Jonathan Perry President & Chief Investment Officer . 20+ years in the self- storage industry . CIO of CubeSmart, leading over $3.5 billion of self-storage investments . Worked in various finance and real estate positions at Storage USA and its successor GE Capital Real Estate . 14+ years in accounting, including 11 years in Ernst & Young’s assurance practice . Extensive experience with multiple equity and debt transactions, for publicly-traded companies ranging from small cap companies to Fortune 100 companies . Served in a leadership role for several years on large multi-family REIT engagement Kelly Luttrell Senior Vice President & Chief Financial Officer . 6+ years of sell-side research experience at Stifel Financial Corp. and B Riley FBR covering the self-storage sector amongst other REIT sectors . 2+ years of banking experience at PNC Financial Services . CFA® Charterholder David Corak Senior Vice President, Corporate Finance 6 January 2019 Investor Presentation |
| November 2018 Investor PresentationJCAP’S COMPETITIVE ADVANTAGE ACCESSIBLE JCAP CAPITAL vs. COMMERICAL BANKS’ RETREAT FROM SELF-STORAGE CONSTRUCTION LENDING . Continued post-recession hangover of commercial banks diminishes appetite for self-storage construction loans . Regulatory hurdles diminish the profitability of self-storage construction loans for banks . Dodd-Frank, Basel III and HVCRE reserve requirements . Allocation preference to stabilized / pre-leased CRE (e.g. Industrial, Office, Multi-family) CREATIVE INVESTMENT STRUCTURES PROVIDE ONE-STOP SHOP . Development financing of up to 97% loan-to-cost (“LTC”). Banks offer 60% to 65% . JCAP can offer flexible financing structures on both development projects and projects in lease-up . Developer freed of burden to raise capital from multiple sources . Unitranche JCAP pricing (coupon + profits interest + RoFR) is highly competitive compared to pricing of component parts NON-RECOURSE . JCAP capital is non-recourse to the developer (except for certain carve outs) SELF-STORAGE EXPERTISE AND FOCUS . JCAP adds value as a storage expert that can assist in avoiding costly common mistakes, such as selecting poor sites in saturated submarkets and selecting subpar property managers who do not drive occupancy or effectively manage revenue and / or operating expenses . JCAP is a reliable exit option – operating partnership units provide tax efficient means for developer exit 7 January 2019 Investor Presentation |
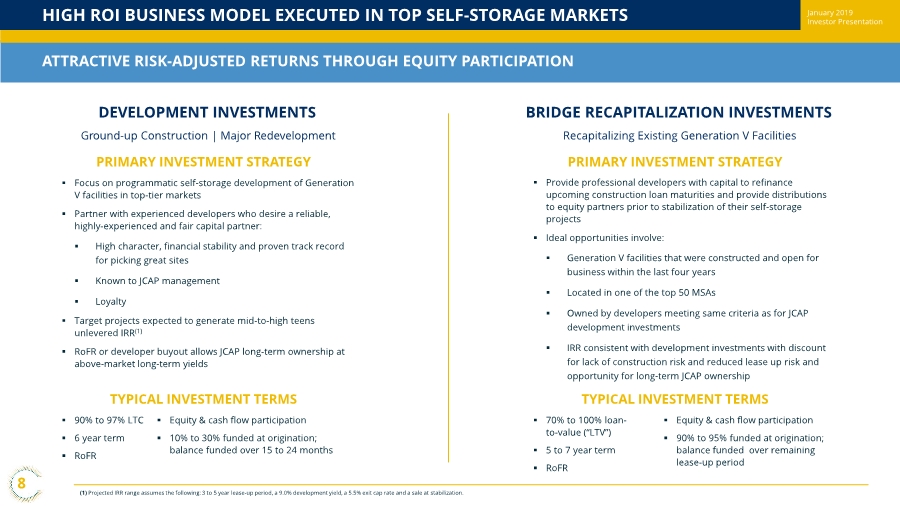
| November 2018 Investor PresentationHIGH ROI BUSINESS MODEL EXECUTED IN TOP SELF-STORAGE MARKETS ATTRACTIVE RISK-ADJUSTED RETURNS THROUGH EQUITY PARTICIPATION DEVELOPMENT INVESTMENTS Ground-up Construction | Major Redevelopment . Focus on programmatic self-storage development of Generation V facilities in top-tier markets . Partner with experienced developers who desire a reliable, highly-experienced and fair capital partner: . High character, financial stability and proven track record for picking great sites . Known to JCAP management . Loyalty . Target projects expected to generate mid-to-high teens unlevered IRR(1) . RoFR or developer buyout allows JCAP long-term ownership at above-market long-term yields PRIMARY INVESTMENT STRATEGY TYPICAL INVESTMENT TERMS . 90% to 97% LTC . 6 year term . RoFR . Equity & cash flow participation . 10% to 30% funded at origination; balance funded over 15 to 24 months BRIDGE RECAPITALIZATION INVESTMENTS Recapitalizing Existing Generation V Facilities . Provide professional developers with capital to refinance upcoming construction loan maturities and provide distributions to equity partners prior to stabilization of their self-storage projects . Ideal opportunities involve: . Generation V facilities that were constructed and open for business within the last four years . Located in one of the top 50 MSAs . Owned by developers meeting same criteria as for JCAP development investments . IRR consistent with development investments with discount for lack of construction risk and reduced lease up risk and opportunity for long-term JCAP ownership PRIMARY INVESTMENT STRATEGY TYPICAL INVESTMENT TERMS . 70% to 100% loan- to-value (“LTV”) . 5 to 7 year term . RoFR . Equity & cash flow participation . 90% to 95% funded at origination; balance funded over remaining lease-up period (1) Projected IRR range assumes the following: 3 to 5 year lease-up period, a 9.0% development yield, a 5.5% exit cap rate and a sale at stabilization. 8 January 2019 Investor Presentation |
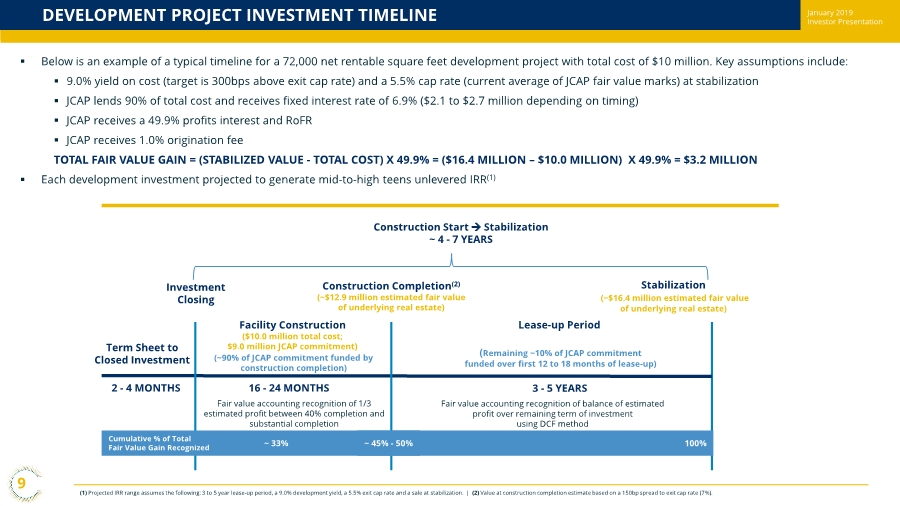
| November 2018 Investor PresentationDEVELOPMENT PROJECT INVESTMENT TIMELINE (1) Projected IRR range assumes the following: 3 to 5 year lease-up period, a 9.0% development yield, a 5.5% exit cap rate and a sale at stabilization. | (2) Value at construction completion estimate based on a 150bp spread to exit cap rate (7%). . Below is an example of a typical timeline for a 72,000 net rentable square feet development project with total cost of $10 million. Key assumptions include: . 9.0% yield on cost (target is 300bps above exit cap rate) and a 5.5% cap rate (current average of JCAP fair value marks) at stabilization . JCAP lends 90% of total cost and receives fixed interest rate of 6.9% ($2.1 to $2.7 million depending on timing) . JCAP receives a 49.9% profits interest and RoFR . JCAP receives 1.0% origination fee TOTAL FAIR VALUE GAIN = (STABILIZED VALUE - TOTAL COST) X 49.9% = ($16.4 MILLION – $10.0 MILLION) X 49.9% = $3.2 MILLION . Each development investment projected to generate mid-to-high teens unlevered IRR(1) Fair value accounting recognition of 1/3 estimated profit between 40% completion and substantial completion Fair value accounting recognition of balance of estimated profit over remaining term of investment using DCF method Term Sheet to Closed Investment Facility Construction ($10.0 million total cost; $9.0 million JCAP commitment) Lease-up Period Construction Completion(2) (~$12.9 million estimated fair value of underlying real estate) Investment Closing Stabilization (~$16.4 million estimated fair value of underlying real estate) Construction Start Stabilization ~ 4 - 7 YEARS (~90% of JCAP commitment funded by construction completion) 16 - 24 MONTHS 3 - 5 YEARS (Remaining ~10% of JCAP commitment funded over first 12 to 18 months of lease-up) 2 - 4 MONTHS Cumulative % of Total Fair Value Gain Recognized ~ 33% ~ 45% - 50% 100% 9 January 2019 Investor Presentation |
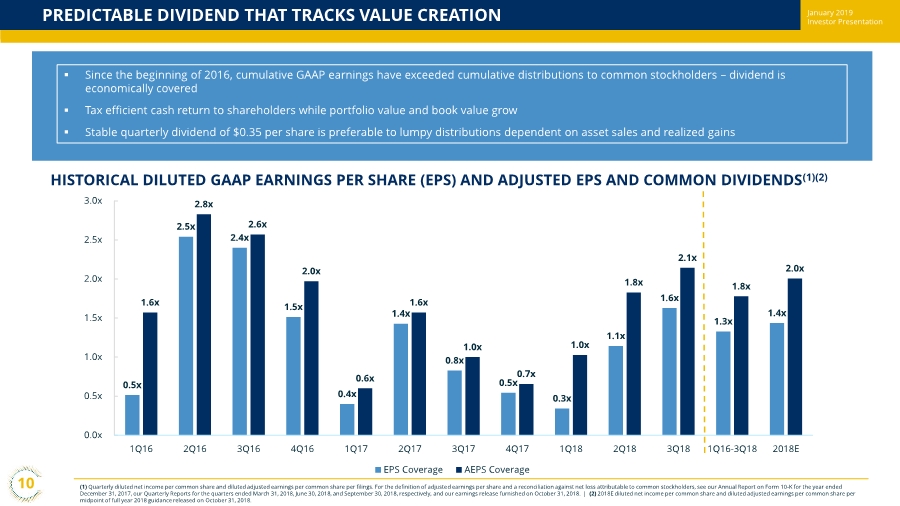
| November 2018 Investor Presentation 0.5x 2.5x 2.4x 1.5x 0.4x 1.4x 0.8x 0.5x 0.3x 1.1x 1.6x 1.3x 1.4x 1.6x 2.8x 2.6x 2.0x 0.6x 1.6x 1.0x 0.7x 1.0x 1.8x 2.1x 1.8x 2.0x 0.0x 0.5x 1.0x 1.5x 2.0x 2.5x 3.0x 1Q16 2Q16 3Q16 4Q16 1Q17 2Q17 3Q17 4Q17 1Q18 2Q18 3Q18 1Q16-3Q18 2018E EPS Coverage AEPS Coverage PREDICTABLE DIVIDEND THAT TRACKS VALUE CREATION (1) Quarterly diluted net income per common share and diluted adjusted earnings per common share per filings. For the definition of adjusted earnings per share and a reconciliation against net loss attributable to common stockholders, see our Annual Report on Form 10-K for the year ended December 31, 2017, our Quarterly Reports for the quarters ended March 31, 2018, June 30, 2018, and September 30, 2018, respectively, and our earnings release furnished on October 31, 2018. | (2) 2018E diluted net income per common share and diluted adjusted earnings per common share per midpoint of full year 2018 guidance released on October 31, 2018. . Since the beginning of 2016, cumulative GAAP earnings have exceeded cumulative distributions to common stockholders – dividend is economically covered . Tax efficient cash return to shareholders while portfolio value and book value grow . Stable quarterly dividend of $0.35 per share is preferable to lumpy distributions dependent on asset sales and realized gains HISTORICAL DILUTED GAAP EARNINGS PER SHARE (EPS) AND ADJUSTED EPS AND COMMON DIVIDENDS(1)(2) 10 January 2019 Investor Presentation |
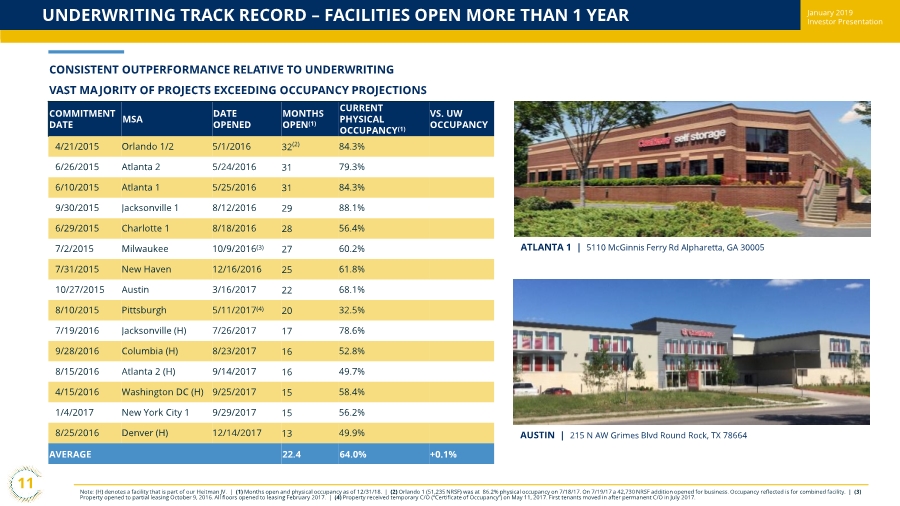
| November 2018 Investor PresentationUNDERWRITING TRACK RECORD – FACILITIES OPEN MORE THAN 1 YEAR Note: (H) denotes a facility that is part of our Heitman JV. | (1) Months open and physical occupancy as of 12/31/18. | (2) Orlando 1 (51,235 NRSF) was at 86.2% physical occupancy on 7/18/17. On 7/19/17 a 42,730 NRSF addition opened for business. Occupancy reflected is for combined facility. | (3) Property opened to partial leasing October 9, 2016. All floors opened to leasing February 2017. | (4) Property received temporary C/O (“Certificate of Occupancy”) on May 11, 2017. First tenants moved in after permanent C/O in July 2017. COMMITMENT DATE MSA DATE OPENED MONTHS OPEN(1) CURRENT PHYSICAL OCCUPANCY(1) VS. UW OCCUPANCY 4/21/2015 Orlando 1/2 5/1/2016 32(2) 84.3% 6/26/2015 Atlanta 2 5/24/2016 31 79.3% 6/10/2015 Atlanta 1 5/25/2016 31 84.3% 9/30/2015 Jacksonville 1 8/12/2016 29 88.1% 6/29/2015 Charlotte 1 8/18/2016 28 56.4% 7/2/2015 Milwaukee 10/9/2016(3) 27 60.2% 7/31/2015 New Haven 12/16/2016 25 61.8% 10/27/2015 Austin 3/16/2017 22 68.1% 8/10/2015 Pittsburgh 5/11/2017(4) 20 32.5% 7/19/2016 Jacksonville (H) 7/26/2017 17 78.6% 9/28/2016 Columbia (H) 8/23/2017 16 52.8% 8/15/2016 Atlanta 2 (H) 9/14/2017 16 49.7% 4/15/2016 Washington DC (H) 9/25/2017 15 58.4% 1/4/2017 New York City 1 9/29/2017 15 56.2% 8/25/2016 Denver (H) 12/14/2017 13 49.9% AVERAGE 22.4 64.0% +0.1% ATLANTA 1 | 5110 McGinnis Ferry Rd Alpharetta, GA 30005 AUSTIN | 215 N AW Grimes Blvd Round Rock, TX 78664 11 CONSISTENT OUTPERFORMANCE RELATIVE TO UNDERWRITING VAST MAJORITY OF PROJECTS EXCEEDING OCCUPANCY PROJECTIONS January 2019 Investor Presentation |
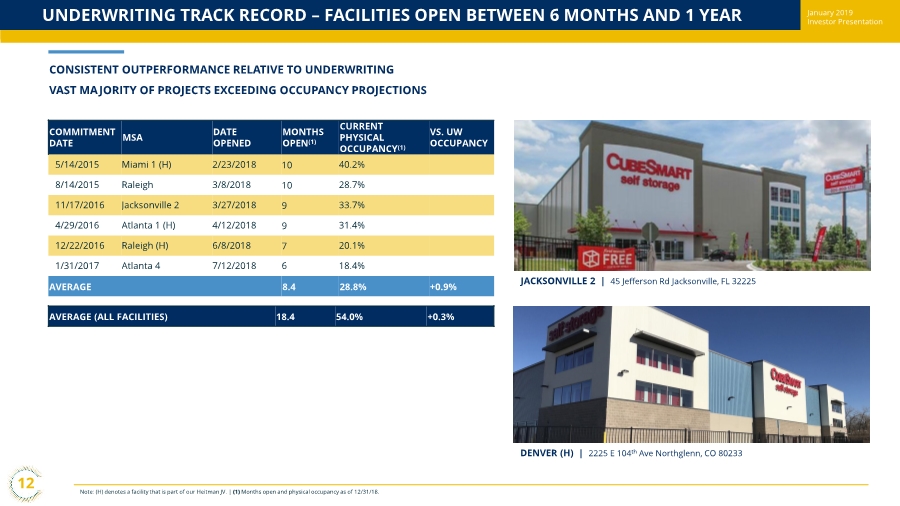
| November 2018 Investor PresentationUNDERWRITING TRACK RECORD – FACILITIES OPEN BETWEEN 6 MONTHS AND 1 YEAR Note: (H) denotes a facility that is part of our Heitman JV. | (1) Months open and physical occupancy as of 12/31/18. DENVER (H) | 2225 E 104th Ave Northglenn, CO 80233 AVERAGE (ALL FACILITIES) 18.4 54.0% +0.3% 12 JACKSONVILLE 2 | 45 Jefferson Rd Jacksonville, FL 32225 January 2019 Investor Presentation CONSISTENT OUTPERFORMANCE RELATIVE TO UNDERWRITING VAST MAJORITY OF PROJECTS EXCEEDING OCCUPANCY PROJECTIONS COMMITMENT DATE MSA DATE OPENED MONTHS OPEN(1) CURRENT PHYSICAL OCCUPANCY(1) VS. UW OCCUPANCY 5/14/2015 Miami 1 (H) 2/23/2018 10 40.2% 8/14/2015 Raleigh 3/8/2018 10 28.7% 11/17/2016 Jacksonville 2 3/27/2018 9 33.7% 4/29/2016 Atlanta 1 (H) 4/12/2018 9 31.4% 12/22/2016 Raleigh (H) 6/8/2018 7 20.1% 1/31/2017 Atlanta 4 7/12/2018 6 18.4% AVERAGE 8.4 28.8% +0.9% |
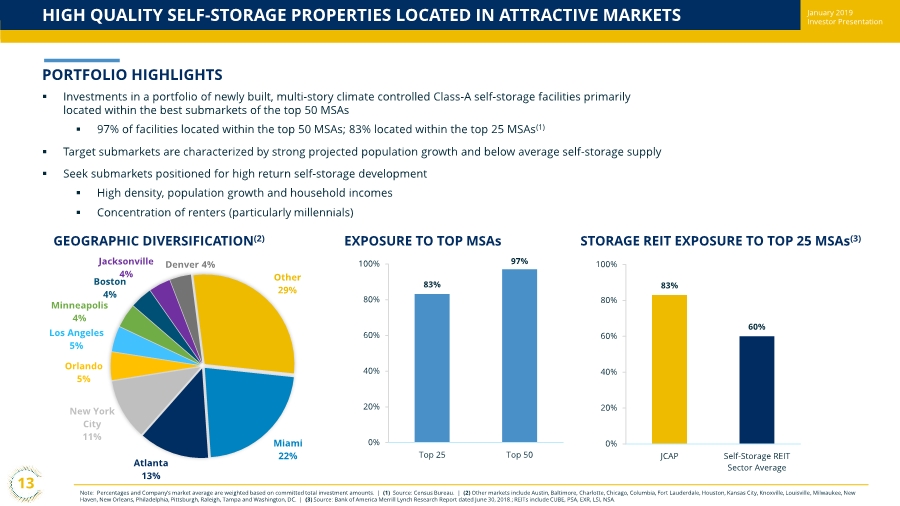
| November 2018 Investor PresentationHIGH QUALITY SELF-STORAGE PROPERTIES LOCATED IN ATTRACTIVE MARKETS Note: Percentages and Company’s market average are weighted based on committed total investment amounts. | (1) Source: Census Bureau. | (2) Other markets include Austin, Baltimore, Charlotte, Chicago, Columbia, Fort Lauderdale, Houston, Kansas City, Knoxville, Louisville, Milwaukee, New Haven, New Orleans, Philadelphia, Pittsburgh, Raleigh, Tampa and Washington, DC. | (3) Source: Bank of America Merrill Lynch Research Report dated June 30, 2018.; REITs include CUBE, PSA, EXR, LSI, NSA. PORTFOLIO HIGHLIGHTS . Investments in a portfolio of newly built, multi-story climate controlled Class-A self-storage facilities primarily located within the best submarkets of the top 50 MSAs . 97% of facilities located within the top 50 MSAs; 83% located within the top 25 MSAs(1) . Target submarkets are characterized by strong projected population growth and below average self-storage supply . Seek submarkets positioned for high return self-storage development . High density, population growth and household incomes . Concentration of renters (particularly millennials) GEOGRAPHIC DIVERSIFICATION(2) EXPOSURE TO TOP MSAs Miami 22%Atlanta 13% New York City 11% Orlando 5% Los Angeles 5% Minneapolis 4% Boston 4% Jacksonville 4% Denver 4% Other 29% 83% 97% 0% 20% 40% 60% 80% 100% Top 25 Top 50 13 STORAGE REIT EXPOSURE TO TOP 25 MSAs(3) 83% 60% 0% 20% 40% 60% 80% 100% JCAP Self-Storage REIT Sector Average January 2019 Investor Presentation |
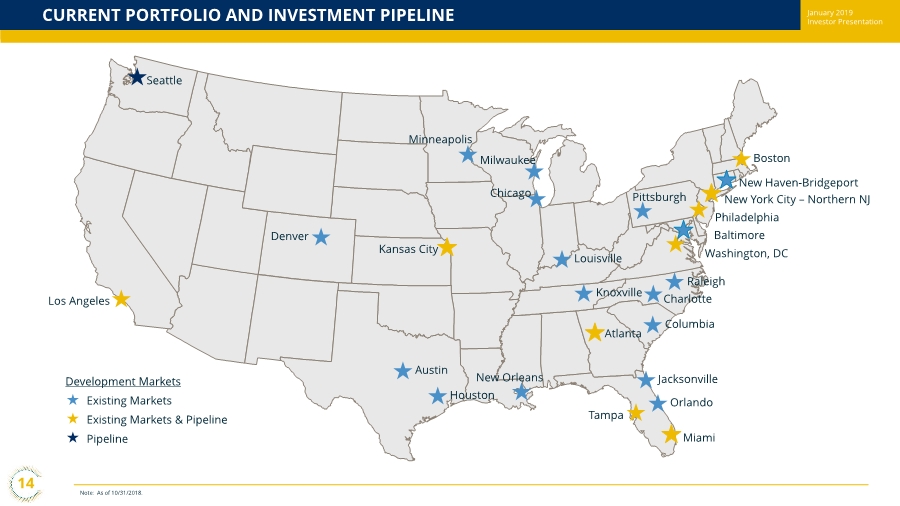
| November 2018 Investor Presentation 14 CURRENT PORTFOLIO AND INVESTMENT PIPELINE Note: As of 10/31/2018. Boston Los Angeles Development Markets Existing Markets Existing Markets & Pipeline Pipeline Washington, DCKansas City New Haven-Bridgeport Seattle New York City – Northern NJ Philadelphia Tampa Baltimore Miami Atlanta Orlando Minneapolis Jacksonville Houston Austin New Orleans Chicago Knoxville Louisville Charlotte Columbia Milwaukee Pittsburgh Raleigh Denver January 2019 Investor Presentation |
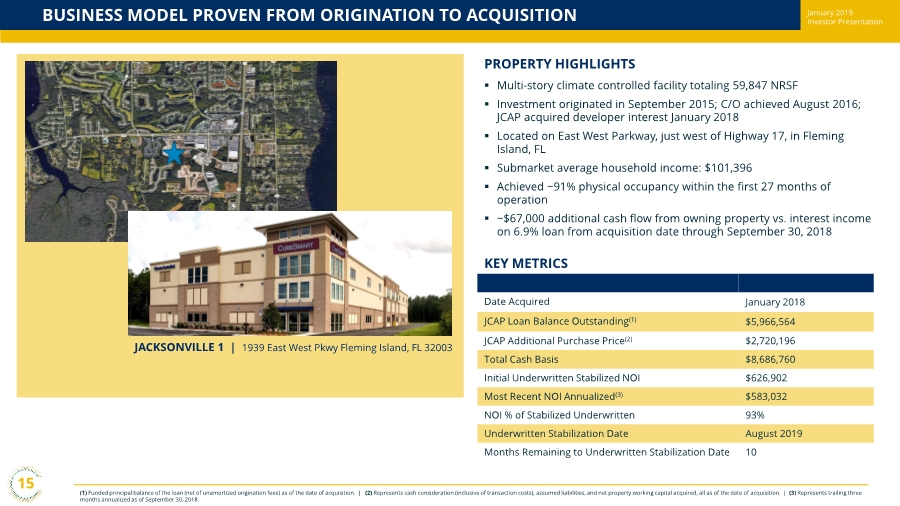
| November 2018 Investor PresentationBUSINESS MODEL PROVEN FROM ORIGINATION TO ACQUISITION (1) Funded principal balance of the loan (net of unamortized origination fees) as of the date of acquisition. | (2) Represents cash consideration (inclusive of transaction costs), assumed liabilities, and net property working capital acquired, all as of the date of acquisition. | (3) Represents trailing three months annualized as of September 30, 2018. PROPERTY HIGHLIGHTS . Multi-story climate controlled facility totaling 59,847 NRSF . Investment originated in September 2015; C/O achieved August 2016; JCAP acquired developer interest January 2018 . Located on East West Parkway, just west of Highway 17, in Fleming Island, FL . Submarket average household income: $101,396 . Achieved ~91% physical occupancy within the first 27 months of operation . ~$67,000 additional cash flow from owning property vs. interest income on 6.9% loan from acquisition date through September 30, 2018 Date Acquired January 2018 JCAP Loan Balance Outstanding(1) $5,966,564 JCAP Additional Purchase Price(2) $2,720,196 Total Cash Basis $8,686,760 Initial Underwritten Stabilized NOI $626,902 Most Recent NOI Annualized(3) $583,032 NOI % of Stabilized Underwritten 93% Underwritten Stabilization Date August 2019 Months Remaining to Underwritten Stabilization Date 10 JACKSONVILLE 1 | 1939 East West Pkwy Fleming Island, FL 32003 15 KEY METRICS January 2019 Investor Presentation |
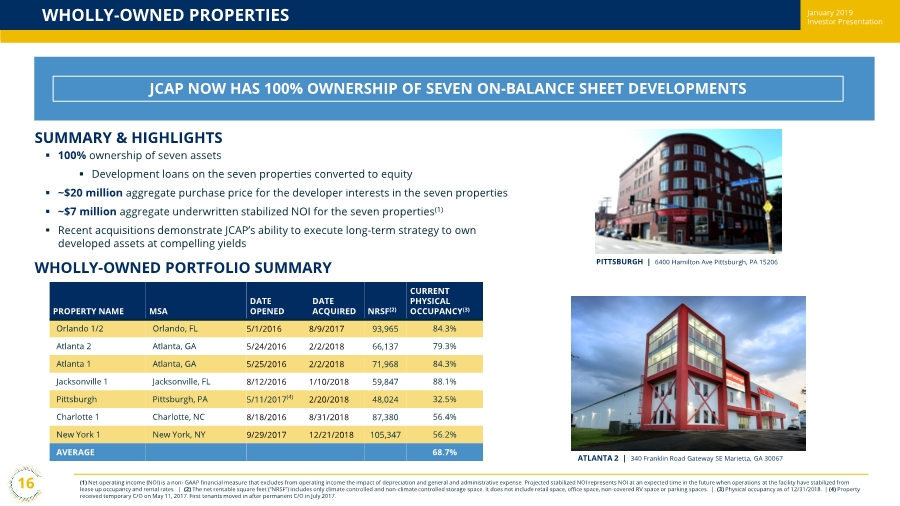
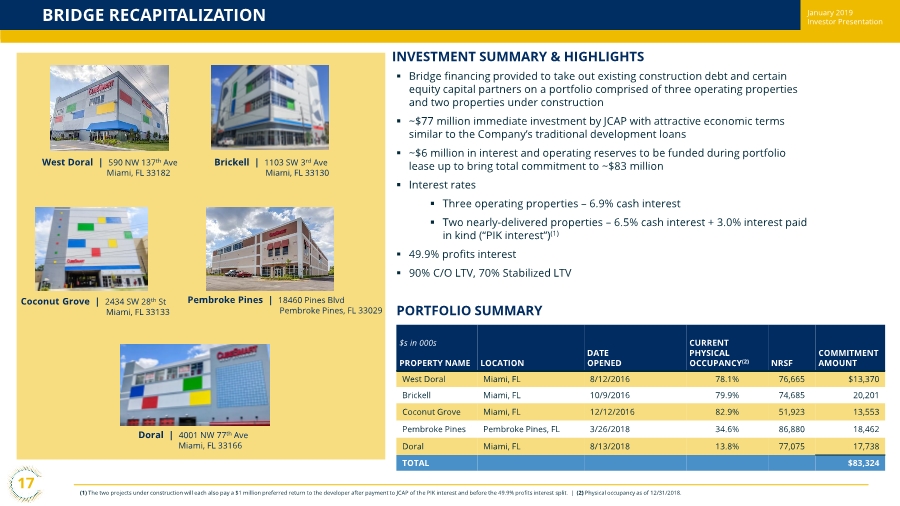
| November 2018 Investor PresentationWHOLLY-OWNED PROPERTIES (1) Net operating income (NOI) is a non- GAAP financial measure that excludes from operating income the impact of depreciation and general and administrative expense. Projected stabilized NOI represents NOI at an expected time in the future when operations at the facility have stabilized from lease up occupancy and rental rates. | (2) The net rentable square feet (“NRSF”) includes only climate controlled and non-climate controlled storage space. It does not include retail space, office space, non-covered RV space or parking spaces. | (3) Physical occupancy as of 12/31/2018. | (4) Property received temporary C/O on May 11, 2017. First tenants moved in after permanent C/O in July 2017. . 100% ownership of seven assets . Development loans on the seven properties converted to equity . ~$20 million aggregate purchase price for the developer interests in the seven properties . ~$7 million aggregate underwritten stabilized NOI for the seven properties(1) . Recent acquisitions demonstrate JCAP’s ability to execute long-term strategy to own developed assets at compelling yields WHOLLY-OWNED PORTFOLIO SUMMARY PROPERTY NAME MSA DATE OPENED DATE ACQUIRED NRSF(2) CURRENT PHYSICAL OCCUPANCY(3) Orlando 1/2 Orlando, FL 5/1/2016 8/9/2017 93,965 84.3% Atlanta 2 Atlanta, GA 5/24/2016 2/2/2018 66,137 79.3% Atlanta 1 Atlanta, GA 5/25/2016 2/2/2018 71,968 84.3% Jacksonville 1 Jacksonville, FL 8/12/2016 1/10/2018 59,847 88.1% Pittsburgh Pittsburgh, PA 5/11/2017(4) 2/20/2018 48,024 32.5% Charlotte 1 Charlotte, NC 8/18/2016 8/31/2018 87,380 56.4% New York 1 New York, NY 9/29/2017 12/21/2018 105,347 56.2% AVERAGE 68.7% JCAP NOW HAS 100% OWNERSHIP OF SEVEN ON-BALANCE SHEET DEVELOPMENTS 16 January 2019 Investor Presentation SUMMARY & HIGHLIGHTS PITTSBURGH | 6400 Hamilton Ave Pittsburgh, PA 15206 ATLANTA 2 | 340 Franklin Road Gateway SE Marietta, GA 30067 |
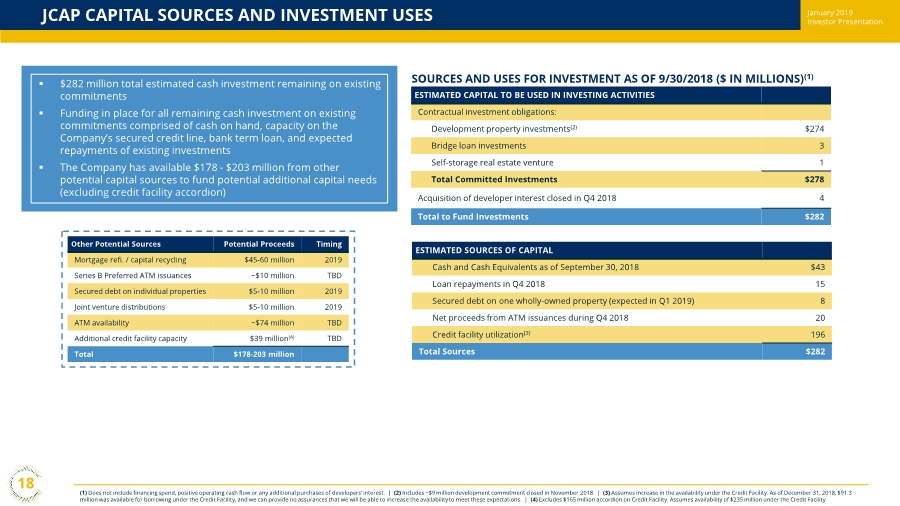
| November 2018 Investor PresentationBRIDGE RECAPITALIZATION (1) The two projects under construction will each also pay a $1 million preferred return to the developer after payment to JCAP of the PIK interest and before the 49.9% profits interest split. | (2) Physical occupancy as of 12/31/2018. INVESTMENT SUMMARY & HIGHLIGHTS . Bridge financing provided to take out existing construction debt and certain equity capital partners on a portfolio comprised of three operating properties and two properties under construction . ~$77 million immediate investment by JCAP with attractive economic terms similar to the Company’s traditional development loans . ~$6 million in interest and operating reserves to be funded during portfolio lease up to bring total commitment to ~$83 million . Interest rates . Three operating properties – 6.9% cash interest . Two nearly-delivered properties – 6.5% cash interest + 3.0% interest paid in kind (“PIK interest”)(1) . 49.9% profits interest . 90% C/O LTV, 70% Stabilized LTV PORTFOLIO SUMMARY $s in 000s PROPERTY NAME LOCATION DATE OPENED CURRENT PHYSICAL OCCUPANCY(2) NRSF COMMITMENT AMOUNT West Doral Miami, FL 8/12/2016 78.1% 76,665 $13,370 Brickell Miami, FL 10/9/2016 79.9% 74,685 20,201 Coconut Grove Miami, FL 12/12/2016 82.9% 51,923 13,553 Pembroke Pines Pembroke Pines, FL 3/26/2018 34.6% 86,880 18,462 Doral Miami, FL 8/13/2018 13.8% 77,075 17,738 TOTAL $83,324 West Doral | 590 NW 137th Ave Miami, FL 33182 17 Coconut Grove | 2434 SW 28th St Miami, FL 33133 Brickell | 1103 SW 3rd Ave Miami, FL 33130 Pembroke Pines | 18460 Pines Blvd Pembroke Pines, FL 33029 Doral | 4001 NW 77th Ave Miami, FL 33166 January 2019 Investor Presentation |
| November 2018 Investor PresentationJCAP CAPITAL SOURCES AND INVESTMENT USES (1) Does not include financing spend, positive operating cash flow or any additional purchases of developers’ interest. | (2) Includes ~$9 million development commitment closed in November 2018. | (3) Assumes increase in the availability under the Credit Facility. As of December 31, 2018, $91.3 million was available for borrowing under the Credit Facility, and we can provide no assurances that we will be able to increase the availability to meet these expectations. | (4) Excludes $165 million accordion on Credit Facility. Assumes availability of $235 million under the Credit Facility. . $282 million total estimated cash investment remaining on existing commitments . Funding in place for all remaining cash investment on existing commitments comprised of cash on hand, capacity on the Company’s secured credit line, bank term loan, and expected repayments of existing investments . The Company has available $178 - $203 million from other potential capital sources to fund potential additional capital needs (excluding credit facility accordion) SOURCES AND USES FOR INVESTMENT AS OF 9/30/2018 ($ IN MILLIONS)(1) ESTIMATED CAPITAL TO BE USED IN INVESTING ACTIVITIES Contractual investment obligations: Development property investments(2) $274 Bridge loan investments 3 Self-storage real estate venture 1 Total Committed Investments $278 Acquisition of developer interest closed in Q4 2018 4 Total to Fund Investments $282 ESTIMATED SOURCES OF CAPITAL Cash and Cash Equivalents as of September 30, 2018 $43 Loan repayments in Q4 2018 15 Secured debt on one wholly-owned property (expected in Q1 2019) 8 Net proceeds from ATM issuances during Q4 2018 20 Credit facility utilization(3) 196 Total Sources $282 Other Potential Sources Potential Proceeds Timing Mortgage refi. / capital recycling $45-60 million 2019 Series B Preferred ATM issuances ~$10 million TBD Secured debt on individual properties $5-10 million 2019 Joint venture distributions $5-10 million 2019 ATM availability ~$74 million TBD Additional credit facility capacity $39 million(4) TBD Total $178-203 million 18 January 2019 Investor Presentation |
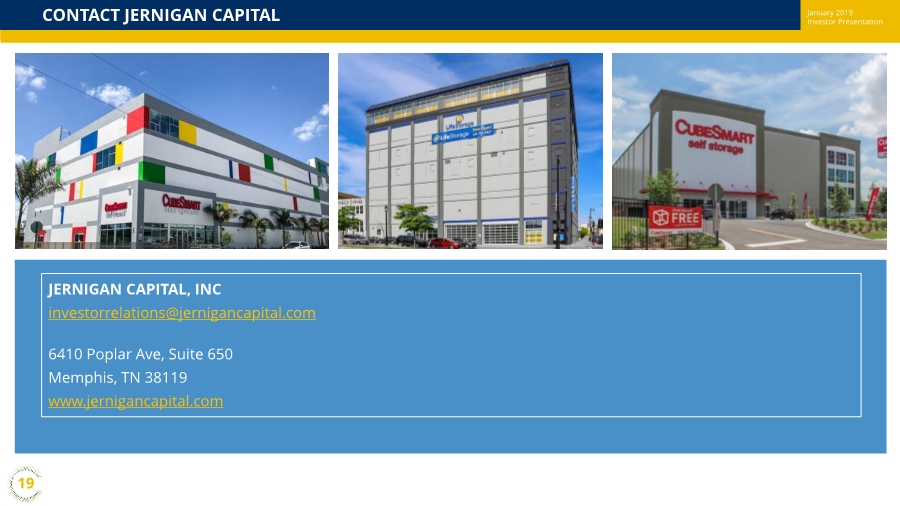
| November 2018 Investor PresentationCONTACT JERNIGAN CAPITAL JERNIGAN CAPITAL, INC investorrelations@jernigancapital.com 6410 Poplar Ave, Suite 650 Memphis, TN 38119 www.jernigancapital.com 19 January 2019 Investor Presentation |
| November 2018 Investor Presentation APPENDIX |

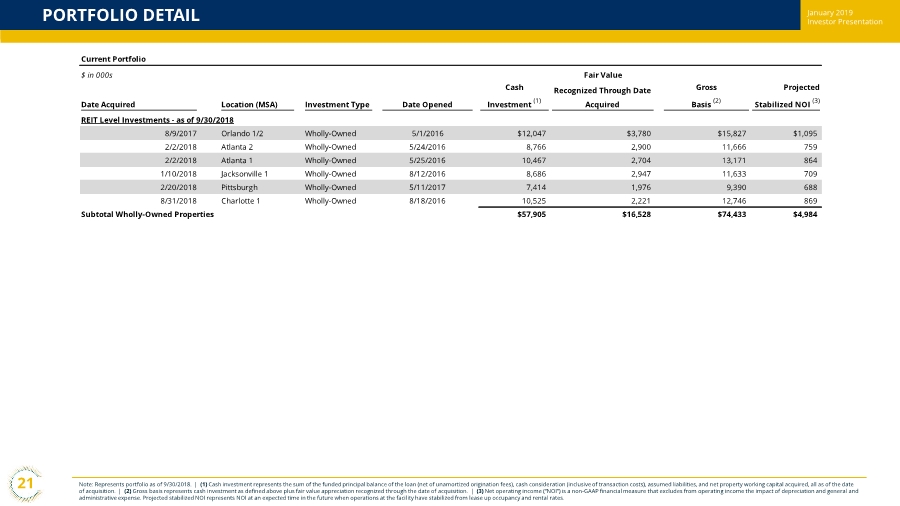
| November 2018 Investor PresentationPORTFOLIO DETAIL Note: Represents portfolio as of 9/30/2018. | (1) Cash investment represents the sum of the funded principal balance of the loan (net of unamortized origination fees), cash consideration (inclusive of transaction costs), assumed liabilities, and net property working capital acquired, all as of the date of acquisition. | (2) Gross basis represents cash investment as defined above plus fair value appreciation recognized through the date of acquisition. | (3) Net operating income (“NOI”) is a non-GAAP financial measure that excludes from operating income the impact of depreciation and general and administrative expense. Projected stabilized NOI represents NOI at an expected time in the future when operations at the facility have stabilized from lease up occupancy and rental rates. 21 Current Portfolio $ in 000s Fair Value Date Acquired Location (MSA) Investment Type Date Opened Cash Investment (1) Recognized Through Date Acquired Gross Basis (2) Projected Stabilized NOI (3) REIT Level Investments - as of 9/30/2018 8/9/2017 Orlando 1/2 Wholly-Owned 5/1/2016 $12,047 $3,780 $15,827 $1,095 2/2/2018 Atlanta 2 Wholly-Owned 5/24/2016 8,766 2,900 11,666 759 2/2/2018 Atlanta 1 Wholly-Owned 5/25/2016 10,467 2,704 13,171 864 1/10/2018 Jacksonville 1 Wholly-Owned 8/12/2016 8,686 2,947 11,633 709 2/20/2018 Pittsburgh Wholly-Owned 5/11/2017 7,414 1,976 9,390 688 8/31/2018 Charlotte 1 Wholly-Owned 8/18/2016 10,525 2,221 12,746 869 Subtotal Wholly-Owned Properties $57,905 $16,528 $74,433 $4,984 January 2019 Investor Presentation |
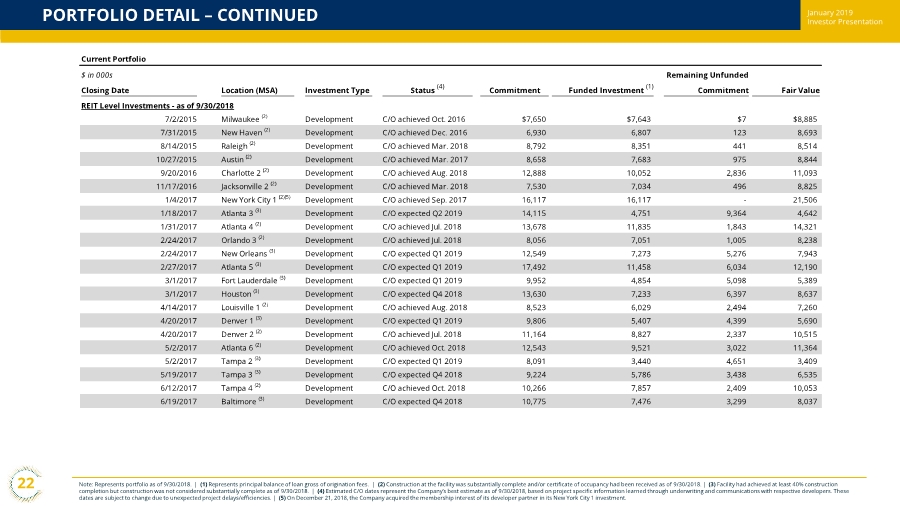
| November 2018 Investor PresentationPORTFOLIO DETAIL – CONTINUED 22 Note: Represents portfolio as of 9/30/2018. | (1) Represents principal balance of loan gross of origination fees. | (2) Construction at the facility was substantially complete and/or certificate of occupancy had been received as of 9/30/2018. | (3) Facility had achieved at least 40% construction completion but construction was not considered substantially complete as of 9/30/2018. | (4) Estimated C/O dates represent the Company’s best estimate as of 9/30/2018, based on project specific information learned through underwriting and communications with respective developers. These dates are subject to change due to unexpected project delays/efficiencies. | (5) On December 21, 2018, the Company acquired the membership interest of its developer partner in its New York City 1 investment. January 2019 Investor Presentation Current Portfolio $ in 000s Remaining Unfunded Closing Date Location (MSA) Investment Type Status (4) Commitment Funded Investment (1) Commitment Fair Value REIT Level Investments - as of 9/30/2018 7/2/2015 Milwaukee (2) Development C/O achieved Oct. 2016 $7,650 $7,643 $7 $8,885 7/31/2015 New Haven (2) Development C/O achieved Dec. 2016 6,930 6,807 123 8,693 8/14/2015 Raleigh (2) Development C/O achieved Mar. 2018 8,792 8,351 441 8,514 10/27/2015 Austin (2) Development C/O achieved Mar. 2017 8,658 7,683 975 8,844 9/20/2016 Charlotte 2 (2) Development C/O achieved Aug. 2018 12,888 10,052 2,836 11,093 11/17/2016 Jacksonville 2 (2) Development C/O achieved Mar. 2018 7,530 7,034 496 8,825 1/4/2017 New York City 1 (2)(5) Development C/O achieved Sep. 2017 16,117 16,117 - 21,506 1/18/2017 Atlanta 3 (3) Development C/O expected Q2 2019 14,115 4,751 9,364 4,642 1/31/2017 Atlanta 4 (2) Development C/O achieved Jul. 2018 13,678 11,835 1,843 14,321 2/24/2017 Orlando 3 (2) Development C/O achieved Jul. 2018 8,056 7,051 1,005 8,238 2/24/2017 New Orleans (3) Development C/O expected Q1 2019 12,549 7,273 5,276 7,943 2/27/2017 Atlanta 5 (3) Development C/O expected Q1 2019 17,492 11,458 6,034 12,190 3/1/2017 Fort Lauderdale (3) Development C/O expected Q1 2019 9,952 4,854 5,098 5,389 3/1/2017 Houston (3) Development C/O expected Q4 2018 13,630 7,233 6,397 8,637 4/14/2017 Louisville 1 (2) Development C/O achieved Aug. 2018 8,523 6,029 2,494 7,260 4/20/2017 Denver 1 (3) Development C/O expected Q1 2019 9,806 5,407 4,399 5,690 4/20/2017 Denver 2 (2) Development C/O achieved Jul. 2018 11,164 8,827 2,337 10,515 5/2/2017 Atlanta 6 (2) Development C/O achieved Oct. 2018 12,543 9,521 3,022 11,364 5/2/2017 Tampa 2 (3) Development C/O expected Q1 2019 8,091 3,440 4,651 3,409 5/19/2017 Tampa 3 (3) Development C/O expected Q4 2018 9,224 5,786 3,438 6,535 6/12/2017 Tampa 4 (2) Development C/O achieved Oct. 2018 10,266 7,857 2,409 10,053 6/19/2017 Baltimore (3) Development C/O expected Q4 2018 10,775 7,476 3,299 8,037 |
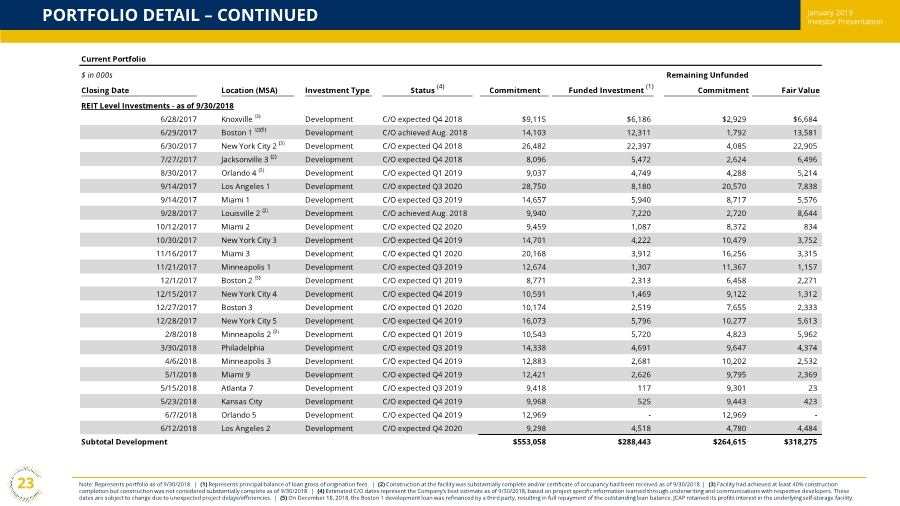
| November 2018 Investor PresentationPORTFOLIO DETAIL – CONTINUED 23 Note: Represents portfolio as of 9/30/2018. | (1) Represents principal balance of loan gross of origination fees. | (2) Construction at the facility was substantially complete and/or certificate of occupancy had been received as of 9/30/2018. | (3) Facility had achieved at least 40% construction completion but construction was not considered substantially complete as of 9/30/2018 . | (4) Estimated C/O dates represent the Company’s best estimate as of 9/30/2018, based on project specific information learned through underwriting and communications with respective developers. These dates are subject to change due to unexpected project delays/efficiencies. | (5) On December 18, 2018, the Boston 1 development loan was refinanced by a third party, resulting in full repayment of the outstanding loan balance. JCAP retained its profits interest in the underlying self-storage facility. January 2019 Investor Presentation Current Portfolio $ in 000s Remaining Unfunded Closing Date Location (MSA) Investment Type Status (4) Commitment Funded Investment (1) Commitment Fair Value REIT Level Investments - as of 9/30/2018 6/28/2017 Knoxville (3) Development C/O expected Q4 2018 $9,115 $6,186 $2,929 $6,684 6/29/2017 Boston 1 (2)(5) Development C/O achieved Aug. 2018 14,103 12,311 1,792 13,581 6/30/2017 New York City 2 (3) Development C/O expected Q4 2018 26,482 22,397 4,085 22,905 7/27/2017 Jacksonville 3 (2) Development C/O expected Q4 2018 8,096 5,472 2,624 6,496 8/30/2017 Orlando 4 (3) Development C/O expected Q1 2019 9,037 4,749 4,288 5,214 9/14/2017 Los Angeles 1 Development C/O expected Q3 2020 28,750 8,180 20,570 7,838 9/14/2017 Miami 1 Development C/O expected Q3 2019 14,657 5,940 8,717 5,576 9/28/2017 Louisville 2 (2) Development C/O achieved Aug. 2018 9,940 7,220 2,720 8,644 10/12/2017 Miami 2 Development C/O expected Q2 2020 9,459 1,087 8,372 834 10/30/2017 New York City 3 Development C/O expected Q4 2019 14,701 4,222 10,479 3,752 11/16/2017 Miami 3 Development C/O expected Q1 2020 20,168 3,912 16,256 3,315 11/21/2017 Minneapolis 1 Development C/O expected Q3 2019 12,674 1,307 11,367 1,157 12/1/2017 Boston 2 (3) Development C/O expected Q1 2019 8,771 2,313 6,458 2,271 12/15/2017 New York City 4 Development C/O expected Q4 2019 10,591 1,469 9,122 1,312 12/27/2017 Boston 3 Development C/O expected Q1 2020 10,174 2,519 7,655 2,333 12/28/2017 New York City 5 Development C/O expected Q4 2019 16,073 5,796 10,277 5,613 2/8/2018 Minneapolis 2 (3) Development C/O expected Q1 2019 10,543 5,720 4,823 5,962 3/30/2018 Philadelphia Development C/O expected Q3 2019 14,338 4,691 9,647 4,374 4/6/2018 Minneapolis 3 Development C/O expected Q4 2019 12,883 2,681 10,202 2,532 5/1/2018 Miami 9 Development C/O expected Q4 2019 12,421 2,626 9,795 2,369 5/15/2018 Atlanta 7 Development C/O expected Q3 2019 9,418 117 9,301 23 5/23/2018 Kansas City Development C/O expected Q4 2019 9,968 525 9,443 423 6/7/2018 Orlando 5 Development C/O expected Q4 2019 12,969 - 12,969 - 6/12/2018 Los Angeles 2 Development C/O expected Q4 2020 9,298 4,518 4,780 4,484 Subtotal Development $553,058 $288,443 $264,615 $318,275 |
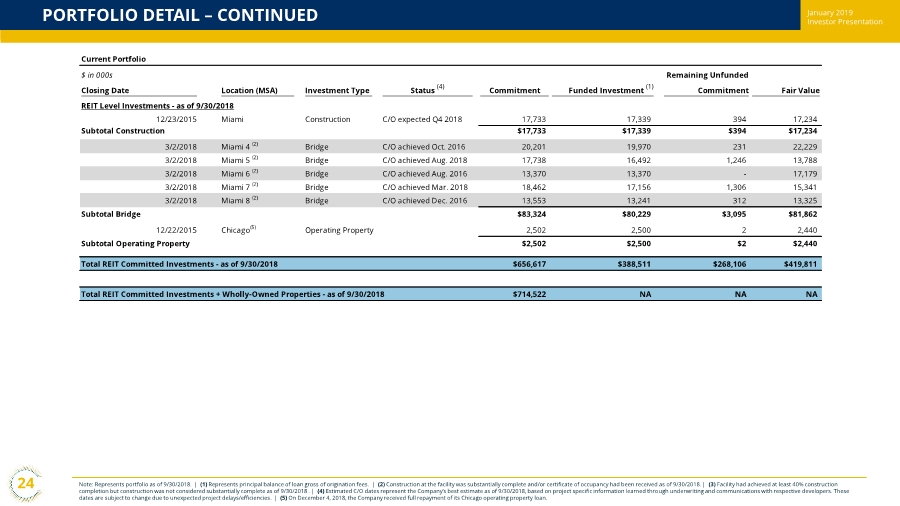
| November 2018 Investor PresentationPORTFOLIO DETAIL – CONTINUED 24 Note: Represents portfolio as of 9/30/2018. | (1) Represents principal balance of loan gross of origination fees. | (2) Construction at the facility was substantially complete and/or certificate of occupancy had been received as of 9/30/2018. | (3) Facility had achieved at least 40% construction completion but construction was not considered substantially complete as of 9/30/2018 . | (4) Estimated C/O dates represent the Company’s best estimate as of 9/30/2018, based on project specific information learned through underwriting and communications with respective developers. These dates are subject to change due to unexpected project delays/efficiencies. | (5) On December 4, 2018, the Company received full repayment of its Chicago operating property loan. January 2019 Investor Presentation Current Portfolio $ in 000s Remaining Unfunded Closing Date Location (MSA) Investment Type Status (4) Commitment Funded Investment (1) Commitment Fair Value REIT Level Investments - as of 9/30/2018 12/23/2015 Miami Construction C/O expected Q4 2018 17,733 17,339 394 17,234 Subtotal Construction $17,733 $17,339 $394 $17,234 3/2/2018 Miami 4 (2) Bridge C/O achieved Oct. 2016 20,201 19,970 231 22,229 3/2/2018 Miami 5 (2) Bridge C/O achieved Aug. 2018 17,738 16,492 1,246 13,788 3/2/2018 Miami 6 (2) Bridge C/O achieved Aug. 2016 13,370 13,370 - 17,179 3/2/2018 Miami 7 (2) Bridge C/O achieved Mar. 2018 18,462 17,156 1,306 15,341 3/2/2018 Miami 8 (2) Bridge C/O achieved Dec. 2016 13,553 13,241 312 13,325 Subtotal Bridge $83,324 $80,229 $3,095 $81,862 12/22/2015 Chicago(5) Operating Property 2,502 2,500 2 2,440 Subtotal Operating Property $2,502 $2,500 $2 $2,440 Total REIT Committed Investments - as of 9/30/2018 $656,617 $388,511 $268,106 $419,811 Total REIT Committed Investments + Wholly-Owned Properties - as of 9/30/2018 $714,522 NA NA NA |
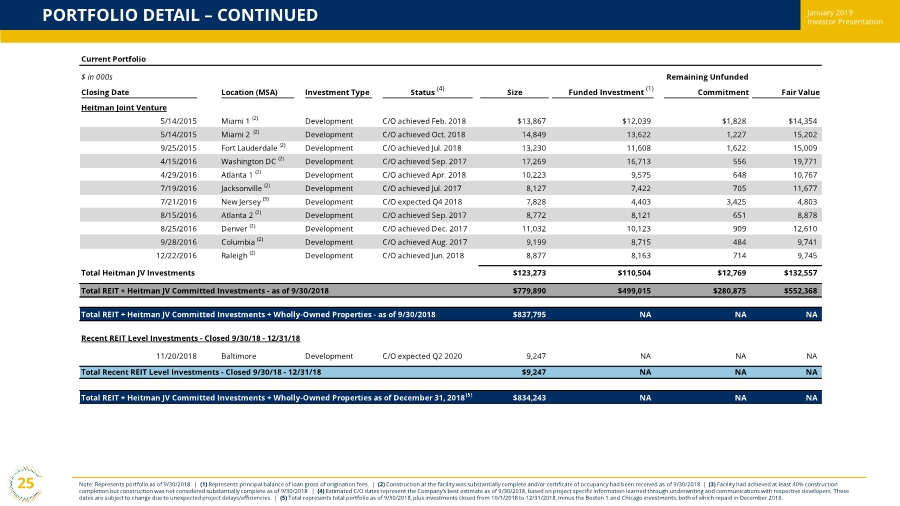
| November 2018 Investor PresentationPORTFOLIO DETAIL – CONTINUED Note: Represents portfolio as of 9/30/2018. | (1) Represents principal balance of loan gross of origination fees. | (2) Construction at the facility was substantially complete and/or certificate of occupancy had been received as of 9/30/2018. | (3) Facility had achieved at least 40% construction completion but construction was not considered substantially complete as of 9/30/2018 . | (4) Estimated C/O dates represent the Company’s best estimate as of 9/30/2018, based on project specific information learned through underwriting and communications with respective developers. These dates are subject to change due to unexpected project delays/efficiencies. | (5) Total represents total portfolio as of 9/30/2018, plus investments closed from 10/1/2018 to 12/31/2018, minus the Boston 1 and Chicago investments, both of which repaid in December 2018. 25 January 2019 Investor Presentation Current Portfolio $ in 000s Remaining Unfunded Closing Date Location (MSA) Investment Type Status (4) Size Funded Investment (1) Commitment Fair Value Heitman Joint Venture 5/14/2015 Miami 1 (2) Development C/O achieved Feb. 2018 $13,867 $12,039 $1,828 $14,354 5/14/2015 Miami 2 (2) Development C/O achieved Oct. 2018 14,849 13,622 1,227 15,202 9/25/2015 Fort Lauderdale (2) Development C/O achieved Jul. 2018 13,230 11,608 1,622 15,009 4/15/2016 Washington DC (2) Development C/O achieved Sep. 2017 17,269 16,713 556 19,771 4/29/2016 Atlanta 1 (2) Development C/O achieved Apr. 2018 10,223 9,575 648 10,767 7/19/2016 Jacksonville (2) Development C/O achieved Jul. 2017 8,127 7,422 705 11,677 7/21/2016 New Jersey (3) Development C/O expected Q4 2018 7,828 4,403 3,425 4,803 8/15/2016 Atlanta 2 (2) Development C/O achieved Sep. 2017 8,772 8,121 651 8,878 8/25/2016 Denver (2) Development C/O achieved Dec. 2017 11,032 10,123 909 12,610 9/28/2016 Columbia (2) Development C/O achieved Aug. 2017 9,199 8,715 484 9,741 12/22/2016 Raleigh (2) Development C/O achieved Jun. 2018 8,877 8,163 714 9,745 Total Heitman JV Investments $123,273 $110,504 $12,769 $132,557 Total REIT + Heitman JV Committed Investments - as of 9/30/2018 $779,890 $499,015 $280,875 $552,368 Total REIT + Heitman JV Committed Investments + Wholly-Owned Properties - as of 9/30/2018 $837,795 NA NA NA Recent REIT Level Investments - Closed 9/30/18 - 12/31/18 11/20/2018 Baltimore Development C/O expected Q2 2020 9,247 NA NA NA Total Recent REIT Level Investments - Closed 9/30/18 - 12/31/18 $9,247 NA NA NA Total REIT + Heitman JV Committed Investments + Wholly-Owned Properties as of December 31, 2018(5) $834,243 NA NA NA |
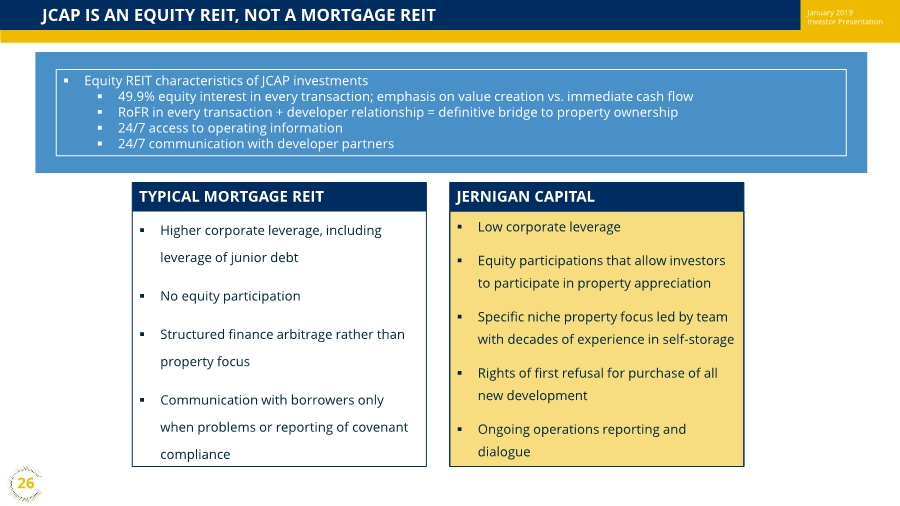
| November 2018 Investor PresentationJCAP IS AN EQUITY REIT, NOT A MORTGAGE REIT TYPICAL MORTGAGE REIT . Higher corporate leverage, including leverage of junior debt . No equity participation . Structured finance arbitrage rather than property focus . Communication with borrowers only when problems or reporting of covenant compliance JERNIGAN CAPITAL . Low corporate leverage . Equity participations that allow investors to participate in property appreciation . Specific niche property focus led by team with decades of experience in self-storage . Rights of first refusal for purchase of all new development . Ongoing operations reporting and dialogue . Equity REIT characteristics of JCAP investments . 49.9% equity interest in every transaction; emphasis on value creation vs. immediate cash flow . RoFR in every transaction + developer relationship = definitive bridge to property ownership . 24/7 access to operating information . 24/7 communication with developer partners 26 January 2019 Investor Presentation |
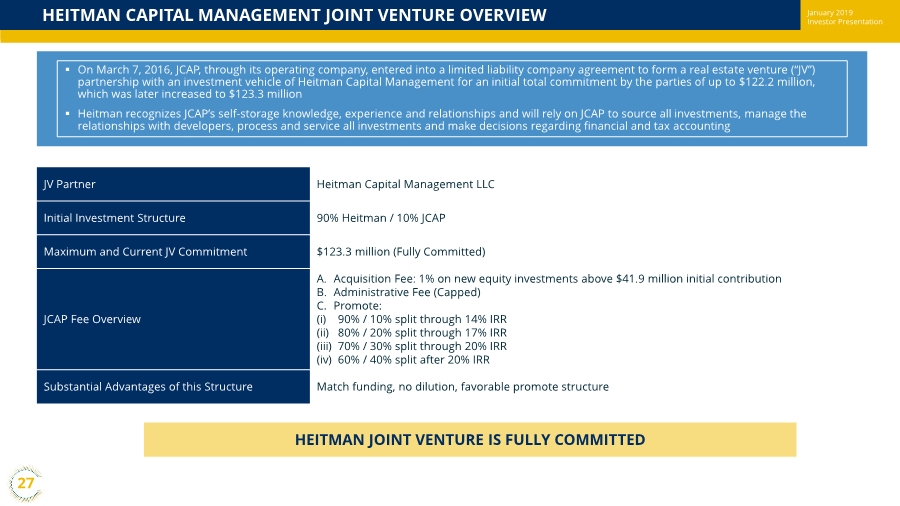
| November 2018 Investor PresentationHEITMAN CAPITAL MANAGEMENT JOINT VENTURE OVERVIEW HEITMAN JOINT VENTURE IS FULLY COMMITTED JV Partner Heitman Capital Management LLC Initial Investment Structure 90% Heitman / 10% JCAP Maximum and Current JV Commitment $123.3 million (Fully Committed) JCAP Fee Overview A. Acquisition Fee: 1% on new equity investments above $41.9 million initial contribution B. Administrative Fee (Capped) C. Promote: (i) 90% / 10% split through 14% IRR (ii) 80% / 20% split through 17% IRR (iii) 70% / 30% split through 20% IRR (iv) 60% / 40% split after 20% IRR Substantial Advantages of this Structure Match funding, no dilution, favorable promote structure . On March 7, 2016, JCAP, through its operating company, entered into a limited liability company agreement to form a real estate venture (“JV”) partnership with an investment vehicle of Heitman Capital Management for an initial total commitment by the parties of up to $122.2 million, which was later increased to $123.3 million . Heitman recognizes JCAP’s self-storage knowledge, experience and relationships and will rely on JCAP to source all investments, manage the relationships with developers, process and service all investments and make decisions regarding financial and tax accounting 27 January 2019 Investor Presentation |
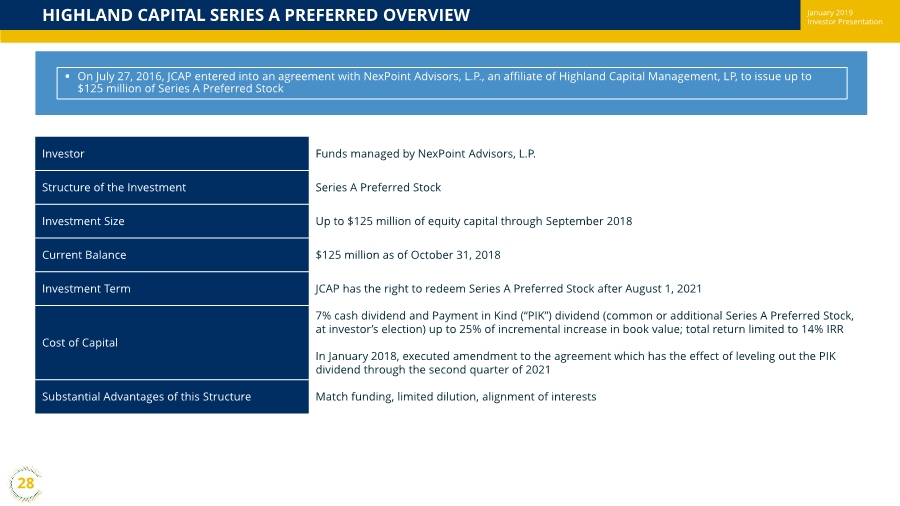
| November 2018 Investor PresentationHIGHLAND CAPITAL SERIES A PREFERRED OVERVIEW Investor Funds managed by NexPoint Advisors, L.P. Structure of the Investment Series A Preferred Stock Investment Size Up to $125 million of equity capital through September 2018 Current Balance $125 million as of October 31, 2018 Investment Term JCAP has the right to redeem Series A Preferred Stock after August 1, 2021 Cost of Capital 7% cash dividend and Payment in Kind (“PIK”) dividend (common or additional Series A Preferred Stock, at investor’s election) up to 25% of incremental increase in book value; total return limited to 14% IRR In January 2018, executed amendment to the agreement which has the effect of leveling out the PIK dividend through the second quarter of 2021 Substantial Advantages of this Structure Match funding, limited dilution, alignment of interests . On July 27, 2016, JCAP entered into an agreement with NexPoint Advisors, L.P., an affiliate of Highland Capital Management, LP, to issue up to $125 million of Series A Preferred Stock 28 January 2019 Investor Presentation |
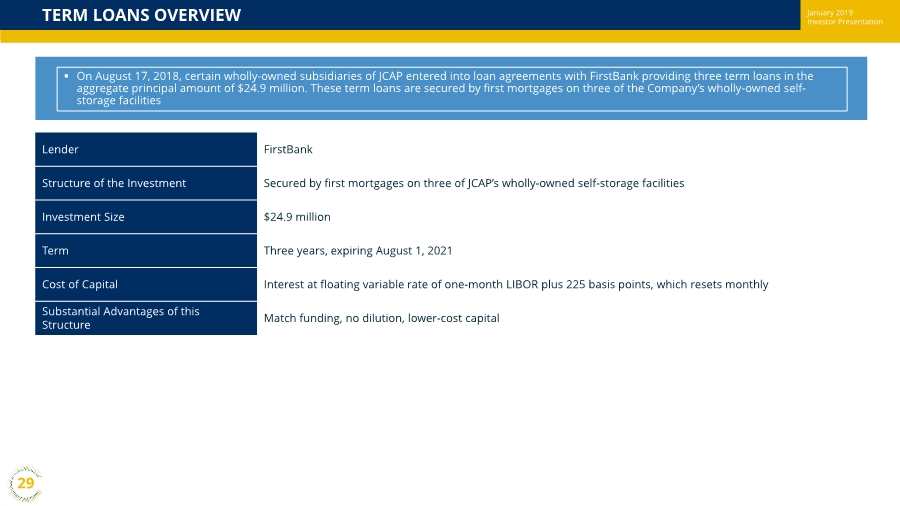
| November 2018 Investor PresentationTERM LOANS OVERVIEW Lender FirstBank Structure of the Investment Secured by first mortgages on three of JCAP’s wholly-owned self-storage facilities Investment Size $24.9 million Term Three years, expiring August 1, 2021 Cost of Capital Interest at floating variable rate of one-month LIBOR plus 225 basis points, which resets monthly Substantial Advantages of this Structure Match funding, no dilution, lower-cost capital . On August 17, 2018, certain wholly-owned subsidiaries of JCAP entered into loan agreements with FirstBank providing three term loans in the aggregate principal amount of $24.9 million. These term loans are secured by first mortgages on three of the Company’s wholly-owned self- storage facilities 29 January 2019 Investor Presentation |
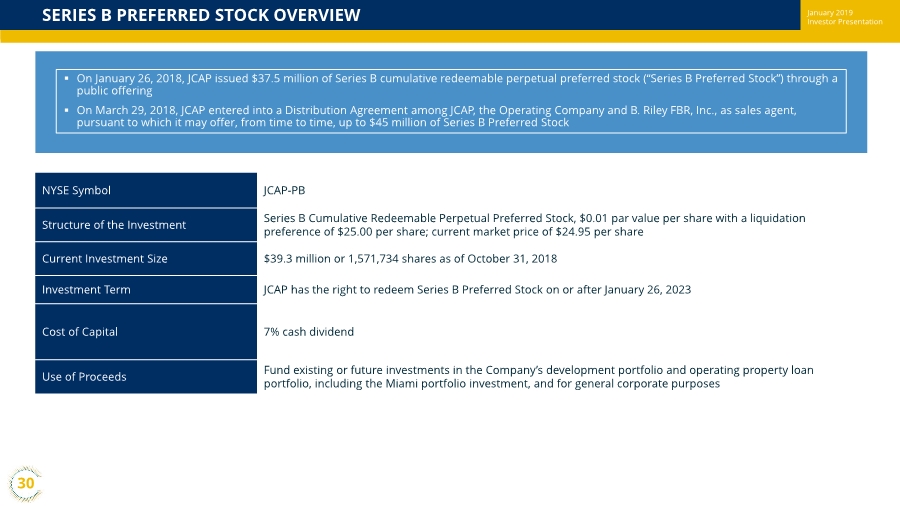
| November 2018 Investor PresentationSERIES B PREFERRED STOCK OVERVIEW NYSE Symbol JCAP-PB Structure of the Investment Series B Cumulative Redeemable Perpetual Preferred Stock, $0.01 par value per share with a liquidation preference of $25.00 per share; current market price of $24.95 per share Current Investment Size $39.3 million or 1,571,734 shares as of October 31, 2018 Investment Term JCAP has the right to redeem Series B Preferred Stock on or after January 26, 2023 Cost of Capital 7% cash dividend Use of Proceeds Fund existing or future investments in the Company’s development portfolio and operating property loan portfolio, including the Miami portfolio investment, and for general corporate purposes . On January 26, 2018, JCAP issued $37.5 million of Series B cumulative redeemable perpetual preferred stock (“Series B Preferred Stock”) through a public offering . On March 29, 2018, JCAP entered into a Distribution Agreement among JCAP, the Operating Company and B. Riley FBR, Inc., as sales agent, pursuant to which it may offer, from time to time, up to $45 million of Series B Preferred Stock 30 January 2019 Investor Presentation |
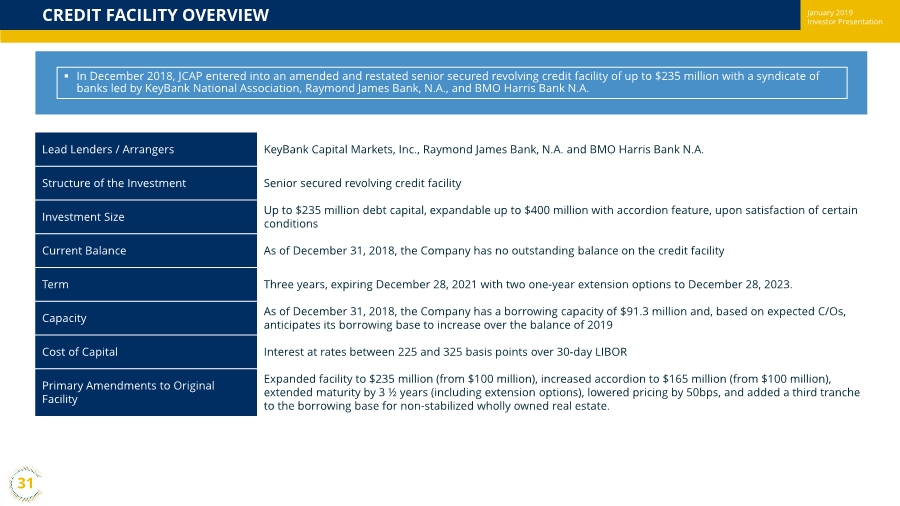
| November 2018 Investor PresentationCREDIT FACILITY OVERVIEW Lead Lenders / Arrangers KeyBank Capital Markets, Inc., Raymond James Bank, N.A. and BMO Harris Bank N.A. Structure of the Investment Senior secured revolving credit facility Investment Size Up to $235 million debt capital, expandable up to $400 million with accordion feature, upon satisfaction of certain conditions Current Balance As of December 31, 2018, the Company has no outstanding balance on the credit facility Term Three years, expiring December 28, 2021 with two one-year extension options to December 28, 2023. Capacity As of December 31, 2018, the Company has a borrowing capacity of $91.3 million and, based on expected C/Os, anticipates its borrowing base to increase over the balance of 2019 Cost of Capital Interest at rates between 225 and 325 basis points over 30-day LIBOR Primary Amendments to Original Facility Expanded facility to $235 million (from $100 million), increased accordion to $165 million (from $100 million), extended maturity by 3 ½ years (including extension options), lowered pricing by 50bps, and added a third tranche to the borrowing base for non-stabilized wholly owned real estate. . In December 2018, JCAP entered into an amended and restated senior secured revolving credit facility of up to $235 million with a syndicate of banks led by KeyBank National Association, Raymond James Bank, N.A., and BMO Harris Bank N.A. 31 January 2019 Investor Presentation |