Attached files
| file | filename |
|---|---|
| EX-32.1 - EXHIBIT 32.1 - HURCO COMPANIES INC | tv509497_ex32-1.htm |
| EX-32.2 - EXHIBIT 32.2 - HURCO COMPANIES INC | tv509497_ex32-2.htm |
| EX-31.2 - EXHIBIT 31.2 - HURCO COMPANIES INC | tv509497_ex31-2.htm |
| EX-31.1 - EXHIBIT 31.1 - HURCO COMPANIES INC | tv509497_ex31-1.htm |
| EX-23.2 - EXHIBIT 23.2 - HURCO COMPANIES INC | tv509497_ex23-2.htm |
| EX-23.1 - EXHIBIT 23.1 - HURCO COMPANIES INC | tv509497_ex23-1.htm |
| EX-21 - EXHIBIT 21 - HURCO COMPANIES INC | tv509497_ex21.htm |
| EX-10.1 - EXHIBIT 10.1 - HURCO COMPANIES INC | tv509497_ex10-1.htm |
UNITED STATES
SECURITIES AND EXCHANGE COMMISSION
Washington, D.C. 20549
FORM 10–K
(Mark One)
| x | Annual report pursuant to Section 13 or 15(d) of the Securities Exchange Act of 1934 for the fiscal year ended October 31, 2018 or |
| ¨ | Transition report pursuant to Section 13 or 15(d) of the Securities Exchange Act of 1934 for the transition period from _________ to _________. |
Commission File No. 0–9143
HURCO COMPANIES, INC.
(Exact name of registrant as specified in its charter)
| Indiana | 35–1150732 |
| (State or other jurisdiction of | (I.R.S. Employer Identification Number) |
|
incorporation or organization) |
|
| One Technology Way | |
| Indianapolis, Indiana | 46268 |
| (Address of principal executive offices) | (Zip code) |
Registrant’s telephone number, including area code (317) 293–5309
Securities registered pursuant to Section 12(b) of the Act:
| Title of each class | Name of each exchange on which registered | |
| Common Stock, No Par Value | Nasdaq Global Select Market |
Securities registered pursuant to Section 12(g) of the Act: None
Indicate by check mark if the registrant is a well–known seasoned issuer, as defined in Rule 405 of the
Securities Act.
Yes ¨ No x
Indicate by check mark if the registrant is not required to file reports pursuant to Section 13 or
Section 15(d) of the Act.
Yes ¨ No x
Indicate by check mark whether the registrant (1) has filed all reports required to be filed by Section 13 or 15(d) of the Securities Exchange Act of 1934 during the preceding 12 months (or for such shorter period that the registrant was required to file such reports), and (2) has been subject to the filing requirements for the past 90 days.
Yes x No ¨
Indicate by check mark whether the registrant has submitted electronically every Interactive Data File required to be submitted pursuant to Rule 405 of Regulation S–T (§232.405 of this chapter) during the preceding 12 months (or for such shorter period that the registrant was required to submit such files). Yes x No ¨
Indicate by check mark if disclosure of delinquent filers pursuant to Item 405 (§229.405 of this chapter) of Regulation S–K is not contained herein, and will not be contained, to the best of registrant's knowledge, in definitive proxy or information statements incorporated by reference in Part III of this Form 10–K or any amendment to this Form 10–K. ¨
Indicate by check mark whether the registrant is a large accelerated filer, an accelerated filer, a non–accelerated filer, a smaller reporting company, or an emerging growth company. See the definitions of “large accelerated filer,” “accelerated filer,” “smaller reporting company,” and “emerging growth company” in Rule 12b–2 of the Exchange Act.
¨ Large accelerated filer
x Accelerated filer
¨ Non–accelerated filer
¨ Smaller reporting company
¨ Emerging growth company
If an emerging growth company, indicate by check mark if the registrant has elected not to use the extended transition period for complying with any new or revised financial accounting standards provided pursuant to Section 13(a) of the Exchange Act. ¨
Indicate by check mark whether the registrant is a shell company (as defined in Rule 12b–2 of the Act).
Yes ¨ No x
The aggregate market value of the registrant’s voting stock held by non–affiliates as of April 30, 2018 (the last business day of our most recently completed second quarter) was $296,666,000.
The number of shares of the registrant’s common stock outstanding as of December 18, 2018 was 6,723,160.
DOCUMENTS INCORPORATED BY REFERENCE: Portions of the registrant’s Proxy Statement for its 2019 Annual Meeting of Shareholders (Part III).
Forward–Looking Statements
This report contains certain statements that are forward–looking statements within the meaning of federal securities laws. Forward–looking statements can be identified by the fact that they do not relate strictly to historical or current facts. When used in this report, the words “may”, “will”, “should”, “would” ,“could”, “anticipate”, “expect”, “plan”, “seek”, “believe”, “predict”, “estimate”, “potential”, “project”, “target”, “forecast”, “intend”, “strategy”, “future”, “opportunity”, “assume”, “guide”, and similar expressions are intended to identify forward–looking statements. Forward–looking statements are based on current expectations and assumptions that are subject to risks and uncertainties that could cause actual results to differ materially from such forward–looking statements. These risks and uncertainties include, but are not limited to, the cyclical nature of the machine tool industry, changes in general economic and business conditions that affect demand for our products, the risks of our international operations, changes in manufacturing markets, innovations by competitors, the ability to protect our intellectual property, breaches of our network and system security measures, fluctuations in foreign currency exchange rates, increases in prices of raw materials, quality and delivery performance by our vendors, our ability to effectively integrate acquisitions, negative or unforeseen tax consequences, governmental actions and initiatives including import and export restrictions and tariffs, and the risks and other important factors under the heading “Risk Factors” in Part I, Item 1A of this report. You should understand that it is not possible to predict or identify all factors that could cause actual results to differ materially from forward–looking statements. Consequently, you should not consider any list or discussion of such factors to be a complete set of all potential risks or uncertainties. Readers of this report are cautioned not to place undue reliance on these forward–looking statements. While we believe the assumptions on which the forward–looking statements are based are reasonable, there can be no assurance that these forward–looking statements will prove to be accurate. This cautionary statement is applicable to all forward–looking statements contained in this report. We expressly disclaim any obligation to update or revise any forward–looking statements, whether as a result of new information, future events or otherwise. You are advised, however, to consult any further disclosures we make on related subjects in our Form 10–Q, 8–K and 10–K reports and our other filings with the Securities and Exchange Commission (“SEC”).
PART I
Item 1. BUSINESS
General
Hurco Companies, Inc. is an international, industrial technology company. We design, manufacture and sell computerized (i.e., Computer Numeric Control (“CNC”)) machine tools, consisting primarily of vertical machining centers (mills) and turning centers (lathes), to companies in the metal cutting industry through a worldwide sales, service and distribution network. Although the majority of our computer control systems and software products are proprietary, they predominantly use industry standard personal computer components. Our computer control systems and software products are primarily sold as integral components of our computerized machine tool products. We also provide machine tool components, software options, control upgrades, accessories and replacement parts for our products, as well as customer service and training and applications support. As used in this report, the words “we”, “us”, “our”, “Hurco” and the “Company” refer to Hurco Companies, Inc. and its consolidated subsidiaries.
Since our founding in 1968, we have been a leader in the introduction of interactive computer control systems that automate manufacturing processes and improve productivity in the metal parts manufacturing industry. We pioneered the application of microprocessor technology and conversational programming software for use in machine tools. Our computer control systems can be operated by both skilled and unskilled machine tool operators and yet are capable of instructing a machine to perform complex tasks. The combination of microprocessor technology and patented interactive, conversational programming software in our computer control systems enables operators on the production floor to quickly and easily create a program for machining a particular part from a blueprint or computer aided design file and immediately begin machining that part.
| 2 |
Our executive offices and principal design and engineering operations are headquartered in Indianapolis, Indiana, U.S. Sales, application engineering and service subsidiaries are located in China, France, Germany, India, Italy, Poland, Singapore, South Africa, Taiwan, the United Kingdom, and the U.S. We have manufacturing and assembly operations in Taiwan, the U.S., Italy and China, and distribution facilities in the U.S., the Netherlands, and Taiwan.
Our strategy is to design, manufacture and sell a comprehensive line of computerized machine tools that help customers in the worldwide metal cutting market increase productivity and profitability. The majority of our machine tools employ proprietary, interactive, computer control technology that increases productivity through ease of operation via interactive conversational and graphical programming software. All of our machine tools deliver high levels of machine performance (speed, accuracy and surface finish quality) that increases productivity. We routinely expand our product offerings to meet customer needs, which has led us to design and manufacture more complex machining centers with advanced capabilities. We bring a disciplined approach to strategically enter new geographic markets, as appropriate.
Industry
Machine tool products are considered capital goods, which makes them part of an industry that has historically been highly cyclical.
Industry association data for the U.S. machine tool market is available and that market accounts for approximately 10% of worldwide consumption. Reports available for the U.S. machine tool market include:
| • | United States Machine Tool Consumption – generated by the Association for Manufacturing Technology, this report includes metal cutting machines of all types and sizes, including segments in which we do not compete | |
| • | Purchasing Manager’s Index – developed by the Institute for Supply Management, this report includes activity levels in U.S. manufacturing plants that purchase machine tools | |
| • | Capacity Utilization of Manufacturing Companies – issued by the Federal Reserve Board |
A limited amount of information is available for foreign markets, and different reporting methodologies are used by various countries. Machine tool consumption data, published by Gardner Publications, Inc., calculates machine tool consumption annually by country. It is important to note that data for foreign countries are based on government reports that may lag 6 to 12 months behind real–time and, therefore, are unreliable for forecasting purposes.
Demand for capital equipment can fluctuate significantly during periods of changing economic conditions. Manufacturers and suppliers of capital goods, such as our company, are often the first to experience these changes in demand. Additionally, since our typical order backlog is approximately 45 days, it is difficult to estimate demand with any reasonable certainty. Therefore, we do not have the benefit of relying on the common leading indicators that other industries use for market analysis and forecasting purposes.
Products
Our core products consist of general purpose computerized machine tools for the metal cutting industry, principally, vertical machining centers (mills) and turning centers (lathes). The majority of our machine tools are equipped and integrated fully with our proprietary software and computer control systems, while the remaining machine tools are equipped with industry standard controls. Additionally, we produce and distribute software options, control upgrades, hardware accessories and replacement parts for our machine tool product lines, and we provide operator training and support services to our customers. We also produce computer control systems and related software for press brake applications that are sold as retrofit units for installation on existing or new press brake machines.
| 3 |
The following table sets forth the contribution of each of our product groups and services to our total revenues during each of the past three fiscal years (in thousands):
Net Sales and Service Fees by Product Category
| Year Ended October 31, | ||||||||||||||||||||||||
| 2018 | 2017 | 2016 | ||||||||||||||||||||||
| Computerized Machine Tools | $ | 261,710 | 87 | % | $ | 209,311 | 86 | % | $ | 195,618 | 86 | % | ||||||||||||
| Computer Control Systems and Software † | 2,870 | 1 | % | 2,324 | 1 | % | 2,078 | 1 | % | |||||||||||||||
| Service Parts | 27,501 | 9 | % | 24,255 | 10 | % | 21,908 | 10 | % | |||||||||||||||
| Service Fees | 8,590 | 3 | % | 7,777 | 3 | % | 7,685 | 3 | % | |||||||||||||||
| Total | $ | 300,671 | 100 | % | $ | 243,667 | 100 | % | $ | 227,289 | 100 | % | ||||||||||||
† Amounts shown do not include computer control systems and software sold as an integrated component of computerized machine systems.
Product Portfolio by Brand
We have three brands of CNC machine tools in our product portfolio: Hurco is the premium brand focused on innovative technology. Milltronics is the general purpose brand with a simplified control and straightforward feature sets. Takumi is an industry standard brand with machines that are equipped with industry standard controls instead of the proprietary controls found on Hurco and Milltronics machines. Typically, manufacturing facilities that use industry standard controls focus on medium to high production, wherein they run large batches of a few types of parts instead of small batches of many different types of parts. The Takumi brand also is targeted to die and mold customers. In addition, through our wholly–owned subsidiary LCM Precision Technology S.r.l. (“LCM”), we produce machine tool components and accessories. The main product categories of each brand are outlined below.
The Hurco, Milltronics and Takumi product lines represent a comprehensive product portfolio with more than 150 different models. The combined machine tool product lines also provide benefits related to the development of product enhancements, technologies and models due to leverage of shared resources and cross–utilization of proven engineering designs that allow us to achieve manufacturing cost reductions from economies of scale and manufacturing efficiencies.
Hurco CNC Machine Tools
Hurco computerized machine tools are equipped with a fully integrated interactive computer control system that features our proprietary WinMax® software. Our computer control system enables a machine tool operator to create complex two–dimensional or three–dimensional machining programs directly from an engineering drawing or computer–aided design geometry file. An operator with little or no machine tool programming experience can successfully create a program with minimal training and begin machining the part in a short period of time. The control features an operator console with active touch, and incorporates an upgradeable personal computer (PC) platform using a high speed processor with solid rendering graphical programming. In addition, WinMax® has a Windows®† based operating system that enables users to improve shop floor flexibility and software productivity. Companies using computer controlled machine tools are better able to:
| • | maximize the efficiency of their human resources; | |
| • | make more advanced and complex parts from a wide range of materials using multiple processes; |
| • | incorporate fast moving changes in technology into their operations to keep their competitive edge; and |
†Windows® is a registered trademark of Microsoft Corporation in the United States and other countries.
| 4 |
| • | integrate their business into the global supply chain of their customers by supporting small to medium lot sizes for “just in time” initiatives. |
Our Windows® based control facilitates our ability to meet these customer needs. The familiar Windows® operating system coupled with our intuitive conversational style of program creation allows our customers’ operators to create and edit part–making programs without incurring the incremental overhead of specialized computer aided design and computer aided manufacturing programmers. With the ability to transfer most computer aided design data directly into a Hurco program, programming time can be significantly reduced.
Machine tool products today are being designed to meet the demand for machining complex parts with greater part accuracies. Our proprietary controls with WinMax® software and high–speed processors efficiently handle the large amounts of data these complex part–making programs require, which enable our customers to create parts with higher accuracy at faster speeds. We continue to add technology to our control design as it becomes available. For example, UltiMotion, our patented motion control system, provides significant cycle time reductions and increases the quality of a part’s surface finish. This technology differentiates us in the marketplace and is incorporated into our control.
Our offering of Hurco machining centers, currently equipped with either a dual touch–screen console or a single touch–screen console, consists of the following product lines:
HTM/HTL Product Line
The HTM/HTL product line includes a tool room mill and tool room lathe. These models are designed for easy access to the table or chuck and are popular in tool room, prototype and maintenance applications. There is a 30–inch X–travel mill and an 8–inch chuck lathe.
VM Product Line
The VM product line consists of moderately priced vertical machining centers for the entry–level market. The design premise of the machining center with a large work cube and a small footprint optimizes the use of available floor space. The VM line consists of five models in four sizes with X–axis (horizontal) travels of 18, 26, 40, and 50 inches.
VMX Product Line
The VMX product line consists of higher performing vertical machining centers aimed at manufacturers that require greater part accuracy. It is our flagship series of machining centers. The VMX line consists of 12 models in eight sizes with X–axis travels of 24, 26, 30, 42, 50, 60, 64, and 84 inches.
Five–Axis Product Line
The five–axis product line is targeted at manufacturers seeking to produce multi–sided parts or true five–axis in a single setup. Machines in this product line can yield significant productivity gains for manufacturers that previously had to process each side of a part separately. Additionally, investing in five–axis technology helps our customers to expand their customer base, as they are able to bid on more complex projects that require simultaneous five–axis operations. The five–axis product line consists of 18 models with three different configurations: swivel head, trunnion table, and cantilever.
HS Product Line
Due to the integral, motorized spindle
with a base speed of 18,000 rpm, the HS product line is desirable for the die and mold industry because of that industry’s
particular interest in the improvement of surface finish quality and the reduction of cycle time. Additionally, this product line
offers us the opportunity to expand our customer base to manufacturers that produce larger batches. The HS product line consists
of four models with X–axis travels of 24, 30, 42, and 60 inches.
| 5 |
BX Product Line
The BX product line is for customers that require higher accuracy parts as they are built with an extremely rigid double column design that offers superior vibration dampening and excellent thermal characteristics. Four models are available, two with 40–inch X–travel (a three–axis version and a five–axis version) as well as 53 and a 63–inch X–travel models.
HM/HMX Product Line
The HM product line offers customers moderately–priced horizontal machining centers designed for small lot sizes. Two models are available, one with a rotary table and one with a plain table. They both have X–travel of 67 inches. The HMX product line is beneficial to manufacturers entering production manufacturing versus small batch manufacturing. The HMX machines have expanded tool capacity, a comprehensive chip management system, a built–in pallet changer, and a box–in–box design supported at both the top and bottom to increase rigidity for long production runs and heavy cuts. The HMX product line consists of three models in three sizes with X–axis travels of 24, 32, and 41 inches.
HBMX Product Line
The HBMX product line is beneficial to manufacturers that build custom machinery and parts for a multitude of industries, such as packaging, pharmaceutical, automotive, energy, and medical. Additionally, boring mills are also used to repair and/or rebuild large components. The HBMX boring mill product line consists of four models with X–axis travels of 55, 79, 94, and 120 inches.
TM/TMM Product Line
The TM/TMM product line of slant–bed lathes (horizontal turning centers) is designed for entry–level job shops and contract manufacturers seeking efficient processing of small to medium lot sizes. There is one TM model in seven sizes, measured by chuck size: the TM6, TM8, TM10, TM12, TM18, TM18L, and TM18BB. The TM18BB big bore turning center targets the energy and aerospace industries because it has a larger chuck diameter and bigger bar capacity for larger parts. We added motorized tooling on the lathe turret to further enhance the capability of the TM turning centers and designated it as the TMM product line. These turning centers with live tooling allow our customers to complete a number of secondary milling, drilling and tapping operations while the part is still held in the chuck after the turning operations are complete, which provides significant productivity gains. The TMM product line consists of three models: TMM8, TMM10, and TMM12.
TMX Product Line
The TMX product line consists of high–performance turning centers. There are six models in two sizes. The TMX–MY models are equipped with an additional axis and motorized live tooling while the TMX–MYS models also have an additional spindle. These products are designed for customers that want to reduce part handling and complete complex components in a single set–up.
DCX Product Line
The double column DCX series includes five models in three sizes. These 2–meter, 3–meter, and 4–meter machining centers are designed to facilitate production of large parts and molds often required by the aerospace, energy and custom machinery industries.
New Product Lines
In fiscal 2018, we introduced the VCX600i and the VCX600HSi, two new cantilever five–axis models designed for larger parts that require more accuracy and speed. The new models feature high–speed 23.6 inch direct drive C–axis rotary tables, available in the standard model as well as a high–speed spindle version. A new 63–inch machine was also added to the BX Series. Additionally, Hurco upgraded its VMX Series machining centers and TM Series of lathes in fiscal 2018, with product improvements aimed at making these models stronger, faster and more flexible. New optional direct–drive spindles were also introduced for the VMX models in fiscal 2018. The VM Series also became available with faster spindle speeds, called Plus models.
| 6 |
Milltronics CNC Machine Tools
Our Milltronics line of CNC machine tools is designed for excellent value with more standard features for the price versus market leaders. We manufacture and sell these machine tools with fully integrated interactive computer control systems that are also compatible with G & M Code programs (generated from CAD/CAM software) and conversational visual aid programming. These straightforward and easy–to–use control systems are available in two versions, the Series 8200–B for tool room products and the more advanced Series 9000 offered on our new vertical machining centers and bridge mills.
The Milltronics portfolio consists of the following product lines:
VM General Purpose (GP) Product Line
The VM–GP product line consists of attractively–priced vertical machining centers designed for job shops, prototype, research and development and other general machining applications. These belt–driven models are 40–taper and available in four different sizes – all with the Series 9000 control. Customers can choose models with X–axis (horizontal) travels of 25, 30, 40 or 50 inches.
VM Inline Performance (IL) Product Line
The VM–IL product line consists of moderately–priced performance vertical machining centers for high–speed applications such as tool, die and mold, aerospace or medical machining. Featuring heavier castings, faster motion and inline spindles, these 40–taper machines include the Series 9000 control and are available in four sizes. Models include X–axis travels of 30, 42, 50 or 60 inches.
VM Extra Power (XP) Product Line
The VM–XP product line consists of moderately–priced vertical machining centers for more demanding metal removal applications such as castings or forgings. These 50–taper models are either gear driven, or heavy–duty belt driven and include the Series 9000 control. Customers can choose from three different models with X–axis travels of 43, 50 or 60 inches.
BR Product Line
The BR product line consists of high–speed bridge mills that are used in pattern shops and the aerospace industry in addition to job shops, due to the large table and travels that support a wide range of part sizes. BR machines have inline spindles and are available as six models in three sizes with X–axis travels of 100, 150, and 200 inches. BR machines offer the Series 8200–B control.
MM/MB/RH Product Line
Products with the MM/MB or RH designation are part of the tool room bed mill category, which are machines that do not have an enclosure, also referred to as open bed machines. Typical applications include general machining, job shops, prototype or maintenance and repair. Available with quill head or rigid head designs, there are six models in four sizes with X–axis travels of 30, 40, 60 and 78 inches. These easy–to–use machines feature the Series 8200–B control.
SL Product Line
The SL product line of slant–bed lathes (horizontal turning centers) is designed for entry–level job shops and contract manufacturers seeking efficient processing of small to medium lot sizes. There are three models with chuck sizes of 6, 8 and 10 inches. These compact machines feature the Series 9000 control.
ML Product Line
The ML product line consists of combination lathes that the customer can configure for either tool room or production applications with the option to add live tooling. There are 17 models available in a variety of thru hole sizes and in the following six swing–over bed diameters: 17, 19, 23, 27, 36, and 39.7 inches. These flexible machines feature the Series 8200–B control.
| 7 |
New Product Lines
In fiscal 2018, we introduced two new CNC slant bed lathes called the SL6–II and the SL10–II. These compact machines feature the 9000 Series control and are designed for job shops, short–run production or other general purpose machining applications. Milltronics also introduced a new version of the popular VM 50–inch machine with extended spindle nose to table. This machine is designed for special applications that require rotary tables with large swings.
Takumi CNC Machine Tools
Our Takumi machine tools feature industry standard CNC controls, including Fanuc®*, Siemens®, Mitsubishi® or Heidenhain®. Models include drill and tap machines; three–axis vertical machining centers with linear guides; three–axis vertical machining centers with box ways; high–speed, double column vertical machining centers; and heavy duty, double column and five–axis machining centers. The Takumi brand customer base includes manufacturers that opt for industrial controls. Generally, manufacturers who use industrial controls have production–oriented operations where they run medium to large batches of just a few different types of parts. Additionally, die and mold shops are another important market segment for the Takumi brand.
The Takumi portfolio consists of the following product lines:
VT Series
The VT Series includes one high–speed drill and tap machine. Model VT500 features fast tool change times and rapid spindle acceleration/deceleration. This three–axis machine is designed for high volume production applications such as automotive parts or electronics components.
VC Series
The VC Series vertical machining centers are fast, three–axis linear guide machining centers designed for customers doing batch or production work. The VC machines are available in two sizes with X–axis travels of 34 and 42 inches.
V Series
The V Series vertical machining centers are heavy duty, box way machines built for tough applications such as roughing cast iron. These three–axis, massive machines feature belt or geared spindles to provide maximum torque. The V Series product line includes eight models with X–axis travels of 39, 43, 47, 60, 70, 78, 86, and 126 inches.
H Series
Designed to produce parts that require high precision and superior surface finishes, H Series machines offer an extremely rigid and thermally stable double column design. These three–axis models feature high–speed direct drive or built–in HSK spindles with up to 20,000 rpm, and offer a 24,000 rpm spindle and 36,000 rpm spindle as options. The H Series product line consists of eight models in seven different sizes with X–axis travels of 30, 35, 40, 53, 63, 86, and 126 inches. These machines are targeted especially for die and mold customers as well as aerospace companies.
U Series
Designed with trunnion tables and swivel heads, these five–axis simultaneous machining centers offer versatility as well as save setup and process time. Most models are offered with double column structure for superior stability and performance. The U–Series product line consists of five models, four of which offer trunnion table sizes of 10, 16, 24 and 31.5 inches. One addition model, the UB, is equipped with B/C swivel head and HSK100, 12K built–in spindle. The UB’s double column design provides spacious X–axis travel of 126 inches.
*Fanuc® is a registered trademark of GE Fanuc Automation Americas, Inc. Siemens® is a registered trademark of Siemens AG. Mitsubishi® is a registered trademark of Mitsubishi Electric Corporation. Heidenhain® is a registered trademark of HEIDENHAIN CORPORATION, a wholly owned subsidiary of the German company DR. JOHANNES HEIDENHAIN GmbH.
| 8 |
G Series
Designed specifically for the machining of graphite or copper electrodes used in electrical discharge machining (EDM), G Series machines offer the same extremely rigid and thermally stable double column design of the H Series, featuring high–speed direct drive or built–in HSK spindles with up to 20,000 rpm. The G Series product line consists of two models with X–axis travels of 30 and 40 inches.
BC Series
The BC Series machine is a double column three–axis machining center designed for heavy cutting and applications that require high power and torque, such as mold and die. This model includes a 6,000 rpm geared–head design with X–axis travels of 82 inches.
New Products
In fiscal 2018, we introduced the SL slant–bed lathe series to the Takumi product line. These turning centers are equipped with box ways and designed for heavy cutting to provide superior part finishes. The SL Series includes three models: the SL200, SL250, and SL300.
Other Control Systems, Software and Accessories
The following machine tool computer control systems and software products are sold directly to end–users and/or to original equipment manufacturers.
Autobend®
Autobend® computer control systems are applied to metal bending press brake machines that form parts from sheet metal and steel plate. They consist of a microprocessor–based computer control and back gauge (an automated gauging system that determines where the bend will be made). We have manufactured and sold the Autobend® product line since 1968. We currently market two models of our Autobend® computer control systems for press brake machines, in combination with six different back gauges as retrofit units for installation on existing or new press brake machines.
Software Products
In addition to our standard computer control features, we offer software option products for part programming. These products are sold to users of our Hurco computerized machine tools equipped with our dual touch–screen or single touch–screen consoles featuring WinMax® control software. Each international division packages the options as appropriate for its market. The most common options include: Advanced Verification Graphics, Swept Surface, DXF Transfer, 3D DXF and Solid Model Import, UltiMonitor, UltiPocket with Helical Ramp Entry and Insert Pockets, Conversational Part and Tool Probing, Tool and Material Library, NC/Conversational Merge, Job List, Stream Load, Linear Thermal Compensation, Thread Repair, and Simultaneous Five–Axis Contouring.
The Advanced Verification Graphics option displays a picture of the rendered part on the screen of the control that can be viewed from any angle. The detail allows the customer to evaluate how the part is programmed to be machined before cutting commences, which eliminates the need to scrap expensive material.
Our Swept Surface software option simplifies programming of 3D contours and significantly reduces programming time.
The DXF Transfer software option increases operator productivity because it eliminates manual data entry of part features by transferring AutoCAD®* drawing files directly into our computer control or into our desktop programming software, WinMax® Desktop.
3D DXF and Solid Model Import automatically uses geometry from a 3D CAD model to easily create conversational programs for 2D and 3D parts or even 3+2 and 5–sided parts.
* AutoCAD® is a registered trademark of Autodesk, Inc., and/or its subsidiaries/ affiliates in the U.S. and/or other countries.
| 9 |
UltiMonitor is a web–based productivity, management and service tool that enables customers to monitor, inspect and receive notifications about their Hurco machines from any location where they can access the internet. Customers can transfer part designs, receive event notifications via email or text, access diagnostic data, monitor the machine via webcam and communicate with the machine operator.
UltiPocket with Helical Ramp Entry and Insert Pockets automatically calculates the tool path around islands, eliminating the arduous task of plotting these shapes. Islands can also be rotated, scaled and repeated.
Conversational Part and Tool Probing options permit the computerized dimensional measurement of machined parts and the associated cutting tools. This “on–machine” technique improves the throughput of the measurement process when compared to traditional “off–machine” approaches.
The Tool and Material Library option stores the tool and material information with the machine instead of storing it with each individual part program. The user enters the tool data and geometry one time and chooses the particular tool from the list when it is needed. Additionally, the library reads the part program and automatically locates the tool or displays an alert if the tool does not exist. In addition to saving time, the Tool and Material Library eliminates the need to enter information repeatedly and can prevent common tool crash conditions.
NC/Conversational Merge lets the user incorporate conversational features, such as tool probing, pattern operations, and scaling into existing G–Code programs.
Job List provides an intuitive way to group files together and run them sequentially without operator intervention, which promotes automation, lights–out machining, program stitching, file bundling, and adaptive processes.
Stream Load allows the user to run very large NC files without the need to upload the entire file into the control’s memory to avoid exceeding memory limits.
Linear Thermal Compensation is a feature that allows the user to specify corrections to compensate for the effects of thermal growth in high speed machining applications.
Thread Repair is a feature for turning applications that provides an efficient way to repair existing threads, which is especially beneficial for large pipes and other parts manufactured for the oil/energy sector.
Simultaneous Five–Axis Contouring software enables a five–axis machine to command motion concurrently on all axes. This allows the user to create continuous tool–paths along complex geometries with only a single machine/part setup, providing increased productivity along with the performance benefits of using shorter cutting tools. The sale of simultaneous five–axis contouring software is subject to government export licensing requirements.
3D Print Head
Hurco has designed and offers a 3D print head technology that allows a Hurco CNC machine to be used for 3D printing, which is advantageous for prototyping. It is used as an attachment to an existing machine and requires no external power supply.
LCM Machine Tool Components and Accessories
Based in Italy, LCM designs, manufactures and sells mechanical and electro–mechanical components and accessories for machine tools. LCM’s direct drive spindle, swivel head, and rotary torque table are used in our SRT line of five–axis machining centers to achieve simultaneous five–axis machining.
| 10 |
CNC Rotary Tables
LCM has five lines of CNC rotary tables for both horizontal and vertical–horizontal positioning. Customers can choose rotary tables with either hydraulic or pneumatic clamping systems. Additionally, LCM offers CNC rotary tables powered by either a torque motor or a high–precision mechanical transmission.
CNC Tilt Tables
LCM has seven lines of CNC tilting rotary tables, of which four lines are intended specifically for five–axis machining centers. Each of the seven lines is differentiated by the technology used for clamping (hydraulic or pneumatic) and by the type of transmission (either mechanical transmission or torque motor).
Swivel Heads and Electro–spindles
LCM has two primary lines of swivel heads that enable the spindle axis to be tilted with continuous motion and one line of electro–spindles (built–in motors for swivel heads). The two lines of swivel heads are differentiated by the type of transmission (either mechanical transmission or torque motor).
Parts and Service
Our service organization provides installation, warranty, operator training and customer support for our products on a worldwide basis. In the United States, our principal distributors have the primary responsibility for machine installation and warranty service and support for product sales. Our service organization also sells software options, computer control upgrades, accessories and replacement parts for our products. Our after–sales parts and service business strengthens our customer relationships and provides continuous information concerning the evolving requirements of end–users.
Manufacturing
Our computerized metal cutting machine tools are manufactured and assembled to our specifications primarily by our wholly–owned subsidiaries in Taiwan (Hurco Manufacturing Limited (“HML”)) and Waconia, Minnesota (Milltronics USA, Inc. (“Milltronics”)). HML and Milltronics conduct final assembly operations and are supported by a network of contract suppliers of components and sub–assemblies that manufacture components for our products. Our facility in Ningbo, China, focuses on the machining of castings to support HML’s production in Taiwan. The LCM line of electro–mechanical components and accessories for machine tools is designed and manufactured in Italy. Our facility in Indianapolis, Indiana, also conducts final assembly operations for certain Hurco VMX machines for the American market and manufactures certain electro–spindle components for LCM.
We have a contract manufacturing agreement for computer control systems with Hurco Automation, Ltd. (“HAL”), a Taiwanese company in which we have a 35% ownership interest. This company produces all of our computer control systems to our specifications, sources industry standard computer components and our proprietary parts, performs final assembly and conducts test operations.
We work closely with our subsidiaries, key component suppliers and HAL to ensure that their production capacity will be sufficient to meet the projected demand for our machine tool products. Many of the key components used in our machines can be sourced from multiple suppliers. However, any prolonged interruption of operations or significant reduction in the capacity or performance capability at any of our manufacturing facilities, or at any of our key component suppliers, could have a material adverse effect on our operations.
| 11 |
Marketing and Distribution
We principally sell our products through more than 173 independent agents and distributors throughout North and South America (the Americas), Europe and Asia. Although some distributors carry competitive products, we are the primary line for the majority of our distributors globally. We also have our own direct sales and service organizations in China, France, Germany, India, Italy, Poland, Singapore, South Africa, Taiwan, the United Kingdom and certain parts of the United States, which are among the world's principal machine tool consuming markets.
Approximately 90% of the worldwide demand for computerized machine tools and computer control systems is outside of the U.S. In fiscal 2018, approximately 71% of our revenues were derived from customers outside of the U.S. No single end–user or distributor of our products accounted for more than 5% of our total sales and service fees. The end–users of our products are precision tool, die and mold manufacturers, independent job shops, specialized short–run production applications within large manufacturing operations and manufacturing facilities that focus on medium to high run production wherein they run large batches of a few types of parts instead of small batches of many different parts. Industries served include aerospace, defense, medical equipment, energy, automotive/ transportation, electronics and computer industries.
We also sell our Autobend® computer control systems to original equipment manufacturers of new metal fabrication machine tools that integrate them with their own products prior to the sale of those products to their own customers, to retrofitters of used metal fabrication machine tools that integrate them with those machines as part of the retrofitting operation, and to end–users that have an installed base of metal fabrication machine tools, either with or without related computer control systems.
Demand
We believe demand for our products is driven by advances in industrial technology and the related demand for automated process improvements. Other factors affecting demand include:
| • | the need to continuously improve productivity and shorten cycle time; | |
| • |
an aging machine tool installed base which will require replacement with more advanced technology; | |
| • | the industrial development of emerging markets in Latin America, Asia and Eastern Europe; and | |
| • |
the declining supply of skilled machinists. |
Demand for our products is also highly dependent upon economic conditions and the general level of business confidence, as well as such factors as production capacity utilization and changes in governmental policies regarding tariffs, corporate taxation, fluctuations in foreign currencies, and other investment incentives.
Competition
We compete with many other machine tool producers in the United States and foreign countries. Most of our competitors are larger and have greater financial resources than our company. Major worldwide competitors include DMG Mori Seiki Co., Ltd., Mazak, Haas Automation, Inc., Hardinge Inc., Doosan, Okuma Machinery Works Ltd, Hyundai and Feeler.
Through our subsidiary LCM, we compete with manufacturers of machine tool components and accessories such as IBAG, Kessler, Peron Speed, GSA Technology Co., LTD and Duplomatic Automation.
We strive to compete by developing patentable software and other proprietary features that offer enhanced productivity, technological capabilities and ease of use. We offer our products in a range of prices and capabilities to target a broad potential market. We also believe that our competitiveness is aided by our reputation for reliability and quality, our strong international sales and distribution organization, and our extensive customer service organization.
| 12 |
Intellectual Property
We consider the majority of our products to be proprietary. Various features of our Hurco and Milltronics control systems and machine tools employ technologies covered by patents and trademarks that are material to our business. We also own additional patents covering new technologies that we have acquired or developed, and that we are planning to incorporate into our control systems or products in the future.
Employees
We had approximately 800 full–time employees at the end of fiscal 2018, none of whom are covered by a collective–bargaining agreement or represented by a union. We have experienced no employee–generated work stoppages or disruptions, and we consider our employee relations to be satisfactory.
Backlog
For information on orders and backlog, see Item 7. Management’s Discussion and Analysis of Financial Condition and Results of Operations.
Availability of Reports and Other Information
Our website can be found at www.hurco.com. We use this website as a means of disclosing pertinent information about the Company, free of charge, including:
| • | Annual Reports on Form 10–K, Quarterly Reports on Form 10–Q, proxy materials, Current Reports on Form 8–K and amendments to those reports filed or furnished pursuant to Section 13(a) or 15(d) of the Securities Exchange Act of 1934, as amended (the “Exchange Act”), as soon as reasonably practicable after we electronically file that material with or furnish it to the SEC; | |
| • | press releases on quarterly earnings, product announcements, legal developments and other material news that we may post from time to time; | |
| • | corporate governance information including our Corporate Governance Principles, Code of Business Conduct and Ethics, information concerning our Board of Directors and its committees, including the charters of the Audit Committee, Compensation Committee, Nominating and Governance Committee and other governance–related policies; and | |
| • |
opportunities to sign up for email alerts and RSS feeds to have information provided in real time. |
The information available on our website is not incorporated by reference in, or a part of, this or any other report we file with, or furnish to, the SEC.
| 13 |
Item 1A. RISK FACTORS
In this section we describe what we believe to be the material risks related to our business. The risks and uncertainties described below or elsewhere in this report are not the only ones to which we are exposed. Additional risks and uncertainties not presently known and/or risks we currently deem immaterial may also adversely affect our business and operations. If any of the developments included in the following risks were to occur, our business, financial condition, results of operations, cash flows or prospects could be materially adversely affected.
The cyclical nature of our business causes fluctuations in our operating results.
The machine tool industry is highly cyclical and changes in demand can occur abruptly in the geographic markets we serve. As a result of this cyclicality, we have experienced significant fluctuations in our sales, which, in periods of reduced demand, have adversely affected our results of operations and financial condition, which could re–occur in the future.
Uncertain global economic conditions may adversely affect overall demand.
We typically sell the majority of our larger high–performance VMX machines in Europe, which makes us particularly sensitive to economic and market conditions in that region. Economic uncertainty and business downturns in the U.S., European and Asian Pacific markets adversely affect our results of operations and financial condition.
Our international operations pose additional risks that may adversely impact sales and earnings.
During fiscal 2018, approximately 71% of our revenues were derived from sales to customers located outside of the U.S. In addition, our main manufacturing facilities are located outside of the U.S. Our international operations are subject to a number of risks, including:
| • | trade barriers; | |
| • | regional economic uncertainty; | |
| • | differing labor regulation; | |
| • | governmental expropriation; | |
| • | domestic and foreign customs and tariffs; | |
| • | current and changing regulatory environments affecting the importation and exportation of products and raw materials; | |
| • | difficulty in obtaining distribution support; | |
| • | difficulty in staffing and managing widespread operations; | |
| • | differences in the availability and terms of financing; | |
| • | political instability and unrest; | |
| • | negative or unforeseen consequences resulting from the introduction, termination, modification, or renegotiation of international trade agreements or treaties or the imposition of countervailing measures or anti–dumping duties or similar tariffs; | |
| • | changes in tax regulations and rates in foreign countries; and | |
| • | changes in the European Union and Asia may adversely affect business activity and economic conditions globally and could continue to contribute to instability in global financial and foreign exchange markets, as well as disrupt the free movement of goods, services and people between countries. |
Quotas, tariffs, taxes or other trade barriers could require us to change manufacturing sources, reduce prices, increase spending on marketing or product development, withdraw from or not enter certain markets or otherwise take actions that could be adverse to us. Also, in some foreign jurisdictions, we may be subject to laws limiting the right and ability of entities organized or operating therein to pay dividends or remit earnings to affiliated companies unless specified conditions are met. These factors may adversely affect our future operating results. The vast majority of our products are shipped from our manufacturing facility in Taiwan from the Port of Taichung to four ports of destination: Los Angeles, California; Tacoma, Washington; Venlo, the Netherlands; and Shanghai, China. Changes in customs requirements, as a result of national security or other constraints put upon these ports, may also have an adverse impact on our results of operations.
| 14 |
Additionally, we must comply with complex foreign and U.S. laws and regulations in a multitude of jurisdictions, such as the U.S. Foreign Corrupt Practices Act, the U.K. Bribery Act, other foreign laws prohibiting corrupt payments to governmental officials, and anti–competition regulations. Violations of these laws and regulations could result in fines and penalties, criminal sanctions, tariffs or duties, restrictions on our business conduct and on our ability to offer our products in one or more countries, and could also materially adversely affect our brand, our ability to attract and retain employees, our international operations, our business and our operating results. Although we have implemented policies and procedures designed to ensure compliance with these laws and regulations, there can be no assurance that our employees, contractors, or agents will not violate our policies.
We depend on limited sources for our products.
We depend on our wholly–owned subsidiaries, HML, Ningbo Hurco Machine Tool Co., Ltd. (“NHML”), Milltronics, and LCM, to produce our machine tools and electro–mechanical components and accessories in Taiwan, China, the U.S. and Italy, respectively. We also depend on our 35% owned affiliate, HAL, and other key third party suppliers to produce our computer control systems and key components, such as motors and drives for our machine tools. An unplanned interruption in manufacturing or supply, or significant increase in price from third party suppliers, would have a material adverse effect on our results of operations and financial condition. Such an interruption or increase in price could result from various factors, including a change in the political environment or a natural disaster, such as trade wars or tariffs, or an earthquake, typhoon, or tsunami. Also, any interruption in service by one of our key component suppliers, if prolonged, could have a material adverse effect on our results of operations and financial condition.
Fluctuations in the exchange rates between the U.S. Dollar and any of several foreign currencies can increase our costs and decrease our revenues.
Our sales to customers located outside of the U.S., which generated approximately 71% of our revenues in fiscal 2018, are invoiced and received in several foreign currencies, primarily the Euro, Pound Sterling and Chinese Yuan. Therefore, our results of operations and financial condition are affected by fluctuations in exchange rates between these currencies and the U.S. Dollar, both for purposes of actual conversion and for financial reporting purposes. In addition, we are exposed to exchange risk associated with our purchases of materials and components for our Taiwan manufacturing operations, which are primarily made in the New Taiwan Dollar and the Euro. We hedge a portion of our foreign currency exposure with the purchase of forward exchange contracts. These hedge contracts only mitigate the impact of changes in foreign currency exchange rates that occur during the term of the related contract period and carry risks of counter–party failure. There can be no assurance that our hedges will have their intended effects.
Our competitive position and prospects for growth may be diminished if we are unable to develop and introduce new and enhanced products on a timely basis that are accepted in the market.
The machine tool industry is subject to technological change, evolving industry standards, changing customer requirements, and improvements in and expansion of product offerings. Our ability to anticipate changes in technology, industry standards, customers’ requirements and competitors’ product offerings and to develop and introduce new and enhanced products on a timely basis that are accepted in the market, are significant factors in maintaining and improving our competitive position and growth prospects. If the technologies or standards used in our products become obsolete or fail to gain widespread commercial acceptance, our business would be materially adversely affected. Developments by others may render our products or technologies obsolete or noncompetitive.
| 15 |
We compete with larger companies that have greater financial resources, and our business could be harmed by competitors’ actions.
The markets in which our products are sold are extremely competitive and highly fragmented. In marketing our products, we compete with other manufacturers in terms of quality, reliability, price, value, delivery time, service and technological characteristics. We compete with a number of U.S., European and Asian competitors, most of which are larger and have substantially greater financial resources and some of which have been supported by governmental or financial institution subsidies and, therefore, may have competitive advantages over us. Our financial resources are limited compared to those of most of our competitors, making it challenging to remain competitive.
Fluctuations in the price of raw materials, especially steel and iron, could adversely affect our sales, costs and profitability.
We manufacture products with a high iron and steel content. The availability and price for these and other raw materials are subject to volatility due to worldwide supply and demand forces, speculative actions, inventory levels, exchange rates, production costs, anticipated or perceived shortages and tariffs or other trade restrictions. In some cases, those cost increases can be passed on to customers in the form of price increases; in other cases, they cannot. If the prices of raw materials increase and we are not able to charge our customers higher prices to compensate, our results of operations would be adversely affected.
Regulations related to “conflict minerals” may cause us to incur additional expenses and could limit the supply and increase the cost of certain metals used in manufacturing our products.
The SEC requires disclosure by public companies of specified minerals, known as conflict minerals, that are necessary to the functionality or production of products manufactured or contracted to be manufactured. Securities laws and/or SEC rules require a disclosure report to be filed annually with the SEC and require companies to perform due diligence and to disclose and report whether or not such minerals originate from the Democratic Republic of Congo or an adjoining country. Such laws or rules could affect sourcing at competitive prices and availability in sufficient quantities of certain minerals used in the manufacture of components that are incorporated into our products, including tin, tantalum, gold and tungsten. The number of suppliers that provide conflict–free minerals may be limited. In addition, there may be material costs associated with complying with the disclosure requirements, such as costs related to the due diligence process of determining the source of certain minerals used in our products, as well as costs of possible changes to products, processes, or sources of supply as a consequence of such verification activities. We may not be able to sufficiently verify the origins of the relevant minerals used in components manufactured by third parties through our due diligence procedures, which may harm our reputation. We may also encounter challenges to satisfy those customers that require that all of the components of our products be certified as conflict–free, which could place us at a competitive disadvantage if we are unable to do so.
Due to future changes in technology, changes in market demand, or changes in market expectations, portions of our inventory may become obsolete or excessive.
The technology within our products evolves, and we periodically bring new versions of our machines to market. The phasing out of an old product involves estimating the amount of inventory required to satisfy the final demand for those machines and to satisfy future repair part needs. Based on changing customer demand and expectations of delivery times for repair parts, we may find that we have either obsolete or excess inventory on hand. Because of unforeseen future changes in technology, market demand or competition, we might have to write off unusable inventory, which would adversely affect our results of operations.
Acquisitions could disrupt our operations and harm our operating results.
We may seek additional opportunities to expand our product offerings or the markets we serve by acquiring other companies, product lines, technologies and personnel. Acquisitions involve numerous risks, including the following:
|
|
• | difficulties integrating the operations, technologies, products, and personnel of an acquired company or being subjected to liability for the target’s pre–acquisition activities or operations as a successor in interest; |
| • | diversion of management’s attention from normal daily operations of the business; | |
| • | potential difficulties completing projects associated with in–process research and development; |
| 16 |
| • | difficulties entering markets in which we have no or limited prior experience, especially when competitors in such markets have stronger market positions; | |
| • | initial dependence on unfamiliar supply chains or relatively small supply partners; | |
| • | insufficient revenues to offset increased expenses associated with acquisitions; | |
| • | the potential loss of key employees of the acquired companies; and | |
| • | the potential for recording goodwill and intangible assets that later can be subject to impairment. |
Acquisitions may also cause us to:
| • | issue common stock that would dilute our current shareholders’ percentage ownership; | |
| • | assume or otherwise be subject to liabilities of an acquired company; | |
| • | record goodwill and non–amortizable intangible assets that will be subject to impairment testing on a regular basis and potential periodic impairment charges; | |
| • | incur amortization expenses related to certain intangible assets; | |
| • | incur large acquisition and integration costs, immediate write–offs, and restructuring and other related expenses; and | |
| • | become subject to litigation. |
Mergers and acquisitions are inherently risky. No assurance can be given that our acquisitions will be successful. Further, no assurance can be given that an acquisition will not adversely affect our business, operating results, or financial condition. Failure to manage and successfully integrate an acquisition could harm our business and operating results in a material way. Even when an acquired company has already developed and marketed products, there can be no assurance that enhancements to those products will be made in a timely manner or that pre–acquisition due diligence will identify all possible issues that might arise with respect to such products or the acquired business.
Risks related to new product development also apply to acquisitions. For additional information, please see the risk factor above entitled, “Due to future changes in technology, changes in market demand, or changes in market expectations, portions of our inventory may become obsolete or excessive.”
Assets may become impaired, requiring us to record a significant charge to earnings.
We review our assets, including intangible assets such as goodwill, for indications of impairment annually and when events or changes in circumstances indicate the carrying value may not be recoverable. We could be required to record a significant charge to earnings in our financial statements for the period in which any impairment of these assets is determined, which would adversely affect our results of operations for that period.
We may experience negative or unforeseen tax consequences.
We may experience negative or unforeseen tax consequences, which could materially adversely affect our results of operations. We review the probability of the realization of our net deferred tax assets each period based on forecasts of taxable income in both the U.S. and foreign jurisdictions. This review uses historical results, projected future operating results based upon approved business plans, eligible carryforward periods, tax–planning opportunities and other relevant considerations. Adverse changes in our profitability and financial outlook in the U.S. or foreign jurisdictions may require the creation of a valuation allowance to reduce our net deferred tax assets. Such changes could result in material non–cash expenses in the period in which the changes are made and could have a material adverse impact on our results of operations and financial condition. We also earn a significant amount of our operating income from outside the U.S., and any repatriation of funds representing earnings of foreign subsidiaries may significantly impact our effective tax rates.
We are subject to taxes in the U.S. and numerous foreign jurisdictions. Due to economic and political conditions, tax rates in various jurisdictions, including the U.S., may be subject to significant change. Our effective tax rates could be adversely affected by changes in the mix of earnings in countries with differing statutory tax rates, changes in the valuation of deferred tax assets and liabilities, or changes in tax laws or their interpretation, including tax laws in the U.S. Similarly, changes in tax laws or regulations, including those in the U.S., could negatively impact our effective tax rate and results of operations. A change in a statutory tax rate may result in the revaluation of our deferred tax assets and liabilities related to the relevant jurisdiction in which the new tax law is enacted, potentially resulting in a material expense or benefit recorded in our Consolidated Statements of Income for that period.
| 17 |
In December 2017, both houses of the U.S. Congress passed legislation that was approved and signed into law. This legislation could have a material benefit or material adverse impact on our effective tax rate, tax expense and cash flow. The Company has evaluated and recorded the aggregate impact of this passed legislation on our financial condition, cash flows and results of operations. Any benefits associated with lower U.S. corporate tax rates could be reduced or outweighed by other tax changes adverse to our business or operations, such as new or additional taxes imposed on earnings and/or reinvested earnings of our foreign subsidiaries. The aggregate impact of such legislation could have a material adverse impact on our cash flows and results of operations.
Our continued success depends on our ability to protect our intellectual property.
Our future success depends in part upon our ability to protect our intellectual property. We rely principally on nondisclosure agreements, other contractual arrangements, trade secret law, trademark registration and patents to protect our intellectual property. However, these measures may be inadequate to protect our intellectual property from infringement by others or prevent misappropriation of our proprietary rights. In addition, the laws of some foreign countries do not protect proprietary rights to the same extent as do U.S. laws. Our inability to protect our proprietary information and enforce our intellectual property rights through infringement proceedings could have a material adverse effect on our business, financial condition and results of operations.
The unanticipated loss of current members of our senior management team and other key personnel may adversely affect our operating results.
The unexpected loss of members of our senior management team or other key personnel could impair our ability to carry out our business plan. We believe that our future success will depend in part on our ability to attract and retain highly skilled and qualified personnel. The loss of senior management or other key personnel may adversely affect our operating results as we incur costs to replace the departed personnel and potentially lose opportunities in the transition of important job functions.
If our network and system security measures are breached and unauthorized access is obtained to our data, to our employees’, customers’ or vendors’ data, or to our critical information technology systems, we may incur legal and financial exposure and liabilities.
As part of our business, we store our data and certain data about our employees, customers and vendors in our information technology systems. If a third party gained unauthorized access to our data, including any data regarding our employees, customers or vendors, the security breach could expose us to risks, including loss of business, litigation and possible liability. Our security measures may be breached as a result of third–party action, including intentional misconduct by computer hackers, employee error, malfeasance or otherwise. Additionally, third parties may attempt to fraudulently induce employees or customers into disclosing sensitive information such as user names, passwords or other information to gain access to our customers' data or our data, including our intellectual property and other confidential business information, or our information technology systems. Although we work closely with industry recognized manufacturers supporting the security measures we have employed in an effort to keep our technology current with the ongoing threats, the techniques used to obtain unauthorized access, or to sabotage systems, change frequently, and therefore we may be unable to anticipate these techniques or to implement adequate preventative measures. Any security breach could result in: the unauthorized publication of our confidential business or proprietary information; the unauthorized release of employee, customer or vendor data and payment information; a loss of confidence by our customers; damage to our reputation; a disruption to our business; litigation and legal liability; and a negative impact on our future sales. In addition, the cost and operational consequences of implementing further data protection measures could be significant.
| 18 |
Item 1B. Unresolved Staff Comments
| None. |
Item 2. PROPERTIES
The following table sets forth the principal use, location, and size of each of our facilities:
| Principal Uses | Locations | Square Footage | ||||
| Corporate headquarters, design and engineering, product testing, sales and marketing, application engineering, customer service, manufacturing and assembly | Indianapolis, Indiana, U.S. | 165,000 | ||||
| Manufacturing, assembly, sales, | Taichung, Taiwan | 407,300 | ||||
| application engineering and customer | Waconia, Minnesota, U.S. | 72,500 | ||||
| service | Castell’Alfero, Italy | 32,300 | ||||
| Manufacturing | Ningbo, China | 31,000 | ||||
| Sales, application engineering and | High Wycombe, England | 42,200 | ||||
| customer service | Benoni, South Africa | 3,500 | ||||
| Paris, France | 12,800 | |||||
| Munich and Verl, Germany | 20,100 | |||||
| Milan, Italy | 13,800 | |||||
| Venlo, the Netherlands | 9,700 | |||||
| Toh Guan, Singapore | 3,900 | |||||
| Shanghai, Dongguan, Kunshan, China | 12,200 | |||||
| Chennai, Delhi, and Pune India | 11,000 | |||||
| Liegnitz, Poland | 2,900 | |||||
| Grand Rapids, Michigan, U.S. | 3,700 | |||||
| Los Angeles, California, U.S. | 11,400 | |||||
We own the Indianapolis facility and lease all other facilities. The leases have terms expiring at various dates ranging from January 2019 to December 2029. We believe that all of our facilities are well maintained and are adequate for our needs now and in the foreseeable future. We do not believe that we would experience any difficulty in replacing any of the present facilities if any of our leases were not renewed at expiration.
| 19 |
Item 3. LEGAL PROCEEDINGS
From time to time, we are involved in various claims and lawsuits arising in the normal course of business. Pursuant to applicable accounting rules, we accrue the minimum liability for each known claim when the estimated outcome is a range of possible loss and no one amount within that range is more likely than another. We maintain insurance policies for such matters, and we record insurance recoveries when we determine such recovery to be probable. We do not expect any of these claims, individually or in the aggregate, to have a material adverse effect on our consolidated financial position or results of operations. We believe that the ultimate resolution of claims for any losses will not exceed our insurance policy coverages.
Item 4. MINE SAFETY DISCLOSURES
None.
Executive Officers of the Registrant
Executive officers are appointed each year by the Board of Directors following the Annual Meeting of Shareholders to serve during the ensuing year and until their respective successors are elected and qualified. There are no family relationships between any of our executive officers or between any of them and any of the members of the Board of Directors.
The following information sets forth as of October 31, 2018, the name of each executive officer and his or her age, tenure as an officer, principal occupation and business experience:
| Name | Age | Position(s) with the Company | ||
| Michael Doar | 63 | Chairman of the Board and Chief Executive Officer | ||
| Gregory S. Volovic | 54 | President | ||
| Sonja K. McClelland | 47 | Executive Vice President, Secretary, Treasurer and Chief Financial Officer |
Michael Doar was elected Chairman of the Board and Chief Executive Officer on November 14, 2001. Mr. Doar had held various management positions with Ingersoll Milling Machine Company from 1989 until 2001. Mr. Doar has been a director of Hurco since 2000.
Gregory S. Volovic has been employed by us since March 2005 and was elected as our President in March 2013. Mr. Volovic previously held the position of Executive Vice President, Software and Engineering until October 2009. Prior to joining us, Mr. Volovic held various positions with Thomson, Inc. including Director of E–Business, Engineering, and Information Technology. Prior to that, Mr. Volovic was employed by Unisys Corporation.
Sonja K. McClelland has been employed by us since September 1996 and was elected as Vice President, Secretary, Treasurer and Chief Financial Officer in March 2014 and then Executive Vice President in March 2017. Ms. McClelland served as Corporate Accounting Manager from September 1996 to 1999, as Division Controller for Hurco USA from September 1999 to November 2004, and as our Corporate Controller and Assistant Secretary from November 2004 to March 2014. Prior to joining us, Ms. McClelland was employed for three years by an international public accounting firm.
| 20 |
PART II
Item 5. MARKET FOR THE REGISTRANT'S COMMON EQUITY, RELATED STOCKHOLDER MATTERS AND ISSUER PURCHASES OF EQUITY SECURITIES
Market Information
Our common stock is traded on the Nasdaq Global Select Market under the symbol “HURC”.
Holders
There were 105 holders of record of our common stock as of December 18, 2018.
Dividend Policy
We began declaring cash dividends on our common stock in the third quarter of fiscal 2013, and we expect to continue to declare dividends on a quarterly basis; however, the declaration and amount of any future cash dividends will be subject to the sole discretion of our Board of Directors and will depend upon many factors, including our results of operations, financial condition, capital requirements, regulatory and contractual restrictions, our business strategy and other factors deemed relevant by our Board of Directors.
Our payment of dividends is limited by our new credit agreement and our prior U.S. credit agreement, as further described in Item 7. Management’s Discussion and Analysis of Financial Condition and Results of Operations and in Note 4 of Notes to Consolidated Financial Statements.
Other Information
During the period covered by this report, we did not sell any equity securities that were not registered under the Securities Act of 1933, as amended.
The disclosure under the caption “Equity Compensation Plan Information at 2018 Fiscal Year End” in our 2019 proxy statement is incorporated by reference in Item 12. Security Ownership of Certain Beneficial Owners and Management and Related Stockholder Matters.
The performance graph information is included in Item 9B. Other Information.
| 21 |
Item 6. SELECTED FINANCIAL DATA
The Selected Financial Data presented below has been derived from our consolidated financial statements for the years indicated and should be read in conjunction with the consolidated financial statements and related notes set forth elsewhere herein and Item 7. Management’s Discussion and Analysis of Financial Condition and Results of Operations.
| Year Ended October 31, | ||||||||||||||||||||
| 2018 | 2017 | 2016 | 2015 | 2014 | ||||||||||||||||
| (In thousands, except per share amounts) | ||||||||||||||||||||
| Statement of Operations Data: | ||||||||||||||||||||
| Sales and service fees | $ | 300,671 | $ | 243,667 | $ | 227,289 | $ | 219,383 | $ | 222,303 | ||||||||||
| Gross profit | 91,806 | 70,564 | 70,440 | 69,091 | 68,612 | |||||||||||||||
| Selling, general and administrative expenses | 58,010 | 49,661 | 50,824 | 45,287 | 46,615 | |||||||||||||||
| Operating income | 33,796 | 20,903 | 19,616 | 23,804 | 21,997 | |||||||||||||||
| Other income (expense) | (1,300 | ) | (187 | ) | (731 | ) | (251 | ) | (636 | ) | ||||||||||
| Net income | 21,490 | 15,115 | 13,292 | 16,214 | 15,143 | |||||||||||||||
| Earnings per common share – diluted | $ | 3.15 | $ | 2.25 | $ | 1.99 | $ | 2.44 | $ | 2.30 | ||||||||||
| Weighted average common shares outstanding–diluted | 6,771 | 6,680 | 6,642 | 6,602 | 6,538 | |||||||||||||||
| Dividends declared per common share | $ | 0.43 | $ | 0.39 | $ | 0.35 | $ | 0.31 | $ | 0.26 | ||||||||||
| As of October 31, | ||||||||||||||||||||
| 2018 | 2017 | 2016 | 2015 | 2014 | ||||||||||||||||
| Balance Sheet Data: | (Dollars in thousands) | |||||||||||||||||||
| Current assets | $ | 281,435 | $ | 246,415 | $ | 218,381 | $ | 216,112 | $ | 208,691 | ||||||||||
| Current liabilities | 86,803 | 70,889 | 57,968 | 65,086 | 66,803 | |||||||||||||||
| Working capital | 194,632 | 175,526 | 160,413 | 151,026 | 141,888 | |||||||||||||||
| Current ratio | 3.2 | 3.5 | 3.8 | 3.3 | 3.1 | |||||||||||||||
| Total assets | 315,407 | 277,808 | 251,949 | 248,577 | 239,176 | |||||||||||||||
| Non-current liabilities | 5,751 | 3,834 | 8,506 | 8,923 | 7,728 | |||||||||||||||
| Total debt | 1,434 | 1,507 | 1,476 | 1,583 | 3,272 | |||||||||||||||
| Shareholders’ equity | 222,853 | 203,085 | 185,475 | 174,568 | 164,645 | |||||||||||||||
| * | Certain prior year amounts have been changed to conform to current year’s presentation. |
| 22 |
Item 7. MANAGEMENT'S DISCUSSION AND ANALYSIS OF FINANCIAL CONDITION AND RESULTS OF OPERATIONS
EXECUTIVE OVERVIEW
Hurco Companies, Inc. is an international, industrial technology company operating in a single segment. We design, manufacture and sell computerized (i.e., Computer Numeric Control, or CNC) machine tools, consisting primarily of vertical machining centers (mills) and turning centers (lathes), to companies in the metal cutting industry through a worldwide sales, service and distribution network. Although the majority of our computer control systems and software products are proprietary, they predominantly use industry standard personal computer components. Our computer control systems and software products are primarily sold as integral components of our computerized machine tool products. We also provide machine tool components, software options, control upgrades, accessories and replacement parts for our products, as well as customer service and training and applications support.
The following overview is intended to provide a brief explanation of the principal factors that have contributed to our recent financial performance. This overview is intended to be read in conjunction with the more detailed information included in our financial statements that appear elsewhere in this report.
The market for machine tools is international in scope. We have both significant foreign sales and significant foreign manufacturing operations. During fiscal 2018, approximately 55% of our revenues were attributable to customers in Europe, where we typically sell more of our higher–performance, higher–priced VMX series machines. Additionally, approximately 15% of our revenues were attributable to customers in the Asia Pacific region, where we encounter greater price pressures.
We have three brands of CNC machine tools in our product portfolio: Hurco is the premium brand focused on innovative technology. Milltronics is the general purpose brand with a simplified control and straightforward feature sets. Takumi is an industry standard brand with machines that are equipped with industry standard controls instead of the proprietary controls found on Hurco and Milltronics machines. Typically, manufacturing facilities that use industry standard controls focus on medium to high production, wherein they run large batches of a few types of parts instead of small batches of many different types of parts. The Takumi brand is also targeted to die and mold customers. In addition, through our wholly–owned subsidiary LCM, we produce machine tool components and accessories.
We principally sell our products through more than 173 independent agents and distributors throughout North and South America (the Americas), Europe and Asia. Although some distributors carry competitive products, we are the primary line for the majority of our distributors globally. We also have our own direct sales and service organizations in China, France, Germany, India, Italy, Poland, Singapore, South Africa, Taiwan, the United Kingdom and certain parts of the United States, which are among the world's principal machine tool consuming markets. The vast majority of our machine tools are manufactured to our specifications primarily by our wholly–owned subsidiary in Taiwan, Hurco Manufacturing Ltd. (“HML”). Machine castings and components to support HML’s production are manufactured at our wholly–owned subsidiary in Ningbo, China, Ningbo Hurco Machine Tool Co., Ltd. Components to support our SRT line of five–axis machining centers, such as the direct drive spindle, swivel head and rotary table, are manufactured by our wholly–owned subsidiary in Italy, LCM.
Our sales to foreign customers are denominated, and payments by those customers are made, in the prevailing currencies in the countries in which those customers are located (primarily the Euro, Pound Sterling and Chinese Yuan). Our product costs are incurred and paid primarily in the New Taiwan Dollar and the U.S. Dollar. Changes in currency exchange rates may have a material effect on our operating results and consolidated financial statements as reported under U.S. Generally Accepted Accounting Principles. For example, when the U.S. Dollar weakens in value relative to a foreign currency, sales made, and expenses incurred, in that currency when translated to U.S. Dollars for reporting in our financial statements, are higher than would be the case when the U.S. Dollar is stronger. In the comparison of our period–to–period results, we discuss the effect of currency translation on those results, which reflect translation to U.S. Dollars at exchange rates prevailing during the period covered by those financial statements.
| 23 |
Our high levels of foreign manufacturing and sales also expose us to cash flow risks due to fluctuating currency exchange rates. We seek to mitigate those risks through the use of derivative instruments – principally foreign currency forward exchange contracts.
Results of Operations
The following table presents, for the fiscal years indicated, selected items from the Consolidated Statements of Income expressed as a percentage of our worldwide sales and service fees and the year–to–year percentage changes in the dollar amounts of those items.
| Percentage of Revenues | Year–to–Year % Change | |||||||||||||||||||
| 2018 | 2017 | 2016 | Increase/Decrease | |||||||||||||||||
| ’18 vs. ’17 | ’17 vs. ’16 | |||||||||||||||||||
| Sales and service fees | 100 | % | 100 | % | 100 | % | 23 | % | 7 | % | ||||||||||
| Gross profit | 31 | % | 29 | % | 31 | % | 30 | % | 0 | % | ||||||||||
| Selling, general and administrative expenses | 19 | % | 20 | % | 22 | % | 17 | % | –2 | % | ||||||||||
| Operating income | 11 | % | 9 | % | 9 | % | 62 | % | 7 | % | ||||||||||
| Net income | 7 | % | 6 | % | 6 | % | 42 | % | 14 | % | ||||||||||
Fiscal 2018 Compared to Fiscal 2017
Sales and Service Fees. Sales and service fees for fiscal 2018 were $300.7 million, an increase of $57.0 million, or 23%, compared to fiscal 2017, and included a favorable currency impact of $10.5 million, or 4%, when translating foreign sales to U.S. Dollars for financial reporting purposes.
Net Sales and Service Fees by Geographic Region
The following table sets forth net sales and service fees by geographic region for the fiscal years ended October 31, 2018 and 2017 (in thousands):
| Fiscal Year Ended October 31, | Increase/Decrease | |||||||||||||||||||||||
| 2018 | 2017 | Amount | % | |||||||||||||||||||||
| Americas | $ | 90,902 | 30 | % | $ | 75,540 | 31 | % | $ | 15,362 | 20 | % | ||||||||||||
| Europe | 166,202 | 55 | % | 133,671 | 55 | % | 32,531 | 24 | % | |||||||||||||||
| Asia Pacific | 43,567 | 15 | % | 34,456 | 14 | % | 9,111 | 26 | % | |||||||||||||||
| Total | $ | 300,671 | 100 | % | $ | 243,667 | 100 | % | $ | 57,004 | 23 | % | ||||||||||||
Sales in the Americas for fiscal 2018 increased by 20% compared to fiscal 2017, due primarily to improved U.S. market conditions and increased demand from U.S. customers for the Hurco and Milltronics product lines. The increase in sales year–over–year was attributable to an increased sales volume of vertical milling and lathe machines from all product lines (Hurco, Milltronics and Takumi). European sales for fiscal 2018 increased by 24%, compared to fiscal 2017, and included a favorable currency impact of 7%, when translating foreign sales to U.S. Dollars for financial reporting purposes. The increase in European sales for fiscal 2018 resulted mainly from increased customer demand for Hurco and Takumi machines in Germany, France and the United Kingdom, as well as increased customer demand for electro–mechanical components and accessories manufactured by our wholly–owned subsidiary, LCM. Asian Pacific sales for fiscal 2018 increased by 26%, compared to fiscal 2017, and included a favorable currency impact of 3%, when translating foreign sales to U.S. Dollars for financial reporting purposes. The increase in Asian Pacific sales for fiscal 2018 was primarily attributable to increased customer demand for Hurco and Takumi machines in all Asian Pacific countries, particularly in China, the largest market for consumption of machines tools in the world.
| 24 |
Net Sales and Service Fees by Product Category
The following table sets forth net sales and service fees by product group and services for the fiscal years ended October 31, 2018 and 2017 (in thousands):
| Fiscal Year Ended October 31, | Increase/Decrease | |||||||||||||||||||||||
| 2018 | 2017 | Amount | % | |||||||||||||||||||||
| Computerized Machine Tools | $ | 261,710 | 87 | % | $ | 209,311 | 86 | % | $ | 52,399 | 25 | % | ||||||||||||
| Computer Control Systems and Software † | 2,870 | 1 | % | 2,324 | 1 | % | 546 | 23 | % | |||||||||||||||
| Service Parts | 27,501 | 9 | % | 24,255 | 10 | % | 3,246 | 13 | % | |||||||||||||||
| Service Fees | 8,590 | 3 | % | 7,777 | 3 | % | 813 | 10 | % | |||||||||||||||
| Total | $ | 300,671 | 100 | % | $ | 243,667 | 100 | % | $ | 57,004 | 23 | % | ||||||||||||
† Amounts shown do not include computer control systems and software sold as an integrated component of computerized machine systems.
Sales of computerized machine tools and computer control systems and software for fiscal 2018 increased by 25% and 23%, respectively, and each included a favorable currency impact of 4%, compared to fiscal 2017. The year–over–year increase in sales of computerized machine tools and computer control systems and software reflected increased machine sales across all three regions and product lines. Sales of service parts and service fees for fiscal 2018 increased by 13% and 10%, respectively, compared to fiscal 2017, due primarily to an increase in aftermarket sales and aftermarket service of Hurco products in North America, France and the United Kingdom.
Orders and Backlog. Orders for fiscal 2018 were a record $305.8 million, an increase of $45.2 million, or 17%, compared to fiscal 2017, and included a favorable currency impact of $13.8 million, or 5%, when translating foreign orders to U.S. Dollars.
The following table sets forth new orders booked by geographic region for the fiscal years ended October 31, 2018 and 2017 (dollars in thousands):
| Fiscal Year Ended October 31, | Increase/Decrease | |||||||||||||||||||||||
| 2018 | 2017 | Amount | % | |||||||||||||||||||||
| Americas | $ | 94,160 | 31 | % | $ | 85,070 | 33 | % | $ | 9,090 | 11 | % | ||||||||||||
| Europe | 170,366 | 56 | % | 137,622 | 53 | % | 32,744 | 24 | % | |||||||||||||||
| Asia Pacific | 41,319 | 13 | % | 37,917 | 14 | % | 3,402 | 9 | % | |||||||||||||||
| Total | $ | 305,845 | 100 | % | $ | 260,609 | 100 | % | $ | 45,236 | 17 | % | ||||||||||||
Orders in the Americas for fiscal 2018 increased by 11%, compared to fiscal 2017. The increase was largely attributable to improved customer demand for Hurco and Takumi vertical milling and lathe machines. European orders for fiscal 2018 increased by 24%, compared to fiscal 2017, and included a favorable currency impact of 9%, when translating foreign orders to U.S. Dollars. The year–over–year increase in European orders was largely driven by increased customer demand for Hurco and Takumi vertical milling and lathe machines in Germany and France, as well as increased demand for electro–mechanical components and accessories manufactured by LCM. Asian Pacific orders for fiscal 2018 increased by 9%, compared to fiscal 2017, and included a favorable currency impact of 3%, when translating foreign orders to U.S. Dollars. The year–over–year increase in Asian Pacific orders was largely due to increased customer demand for Hurco vertical milling machines in India, China and Southeast Asia.
| 25 |
Backlog at October 31, 2018 increased to $55.0 million compared to $52.0 million at October 31, 2017 primarily due to an increase in customer orders during fiscal 2018. We do not believe backlog is a useful measure of past performance or indicative of future performance. Backlog orders as of October 31, 2018 are expected to be fulfilled in fiscal 2019.
Gross Profit. Gross profit for fiscal 2018 was $91.8 million, or 31% of sales, compared to $70.6 million, or 29% of sales, for fiscal 2017. The year–over–year increase in gross profit as a percentage of sales reflected increased machine sales across all three regions and product lines and the favorable impact of foreign currency translation compared to the corresponding prior year period.
Operating Expenses. Selling, general and administrative expenses for fiscal 2018 were $58.0 million, or 19% of sales, compared to $49.7 million, or 20% of sales, in fiscal 2017, and included an unfavorable currency impact of $1.3 million, when translating foreign expenses to U.S. Dollars for financial reporting purposes. The year-over-year increase in selling, general and administrative expenses was driven by increased expenses for tradeshows, global sales and marketing, employee incentive compensation and the unfavorable impact of foreign currency translation compared to the corresponding prior year period.
Operating Income. Operating income for fiscal 2018 was $33.8 million, or 11% of sales, compared to $20.9 million, or 9% of sales, in fiscal 2017. The year-over-year increase in operating income was primarily attributable to increased machine sales across all three regions and product lines, and the favorable impact of foreign currency translation compared to the corresponding prior year period.
Other Income (Expense). Other income (expense) for fiscal 2018 increased by $1.1 million from fiscal 2017, due mainly to increased foreign currency losses experienced in 2018.
Provision for Income Taxes. Our effective tax rate for fiscal 2018 was 34%, compared to 27% for fiscal 2017. The year–over–year increase in the effective tax rate for fiscal 2018 was primarily attributable to one–time charges of $2.8 million related to the Tax Cuts and Jobs Act that was enacted in December 2017. The impact of these one–time charges increased the effective tax rate by approximately 39% for the first quarter of fiscal 2018. Excluding the impact of these charges, earnings per diluted share would have been $0.41 higher than the earnings per diluted share we reported for fiscal 2018.
Net Income. Net income for fiscal 2018 was $21.5 million, or $3.15 per diluted share, an increase of $6.4 million, or 42%, from fiscal 2017 net income of $15.1 million, or $2.25 per diluted share.
Fiscal 2017 Compared to Fiscal 2016
Sales and Service Fees. Sales and service fees for fiscal 2017 were $243.7 million, an increase of $16.4 million, or 7%, compared to fiscal 2016 and included a negative currency impact of $1.3 million, or 1%, when translating foreign sales to U.S. Dollars for financial reporting purposes.
Net Sales and Service Fees by Geographic Region
The following table sets forth net sales and service fees by geographic region for the fiscal years ended October 31, 2017 and 2016 (in thousands):
| Fiscal Year Ended October 31, | Increase/Decrease | |||||||||||||||||||||||
| 2017 | 2016 | Amount | % | |||||||||||||||||||||
| Americas | $ | 75,540 | 31 | % | $ | 74,386 | 33 | % | $ | 1,154 | 2 | % | ||||||||||||
| Europe | 133,671 | 55 | % | 124,070 | 54 | % | 9,601 | 8 | % | |||||||||||||||
| Asia Pacific | 34,456 | 14 | % | 28,833 | 13 | % | 5,623 | 20 | % | |||||||||||||||
| Total | $ | 243,667 | 100 | % | $ | 227,289 | 100 | % | $ | 16,378 | 7 | % | ||||||||||||
| 26 |
Sales in the Americas for fiscal 2017 increased by 2% compared to fiscal 2016 and reflected improved U.S. market conditions and demand from customers for all product lines (Hurco, Takumi and Milltronics) and in all regions of the country where our customers are located. European sales for fiscal 2017 increased by 8%, compared to fiscal 2016, and included a negative currency impact of 1%, when translating foreign sales to U.S. Dollars for financial reporting purposes. Excluding the negative impact of currency, the year–over–year increase in European sales for fiscal 2017 was driven primarily by increased sales of Hurco machines in the United Kingdom and Germany. Asian Pacific sales for fiscal 2017 increased by 20%, compared to fiscal 2016, primarily due to increased sales of Hurco and Takumi machines in all Asian Pacific countries where our customers are located, with China contributing the largest increase. Asian Pacific sales for fiscal 2017 included a favorable currency impact 1%, when translating foreign sales to U.S. Dollars for financial reporting purposes.
Net Sales and Service Fees by Product Category
The following table sets forth net sales and service fees by product group and services for the fiscal years ended October 31, 2017 and 2016 (in thousands):
| Fiscal Year Ended October 31, | Increase/Decrease | |||||||||||||||||||||||
| 2017 | 2016 | Amount | % | |||||||||||||||||||||
| Computerized Machine Tools | $ | 209,311 | 86 | % | $ | 195,618 | 86 | % | $ | 13,693 | 7 | % | ||||||||||||
| Computer Control Systems and Software † | 2,324 | 1 | % | 2,078 | 1 | % | 246 | 12 | % | |||||||||||||||
| Service Parts | 24,255 | 10 | % | 21,908 | 10 | % | 2,347 | 11 | % | |||||||||||||||
| Service Fees | 7,777 | 3 | % | 7,685 | 3 | % | 92 | 1 | % | |||||||||||||||
| Total | $ | 243,667 | 100 | % | $ | 227,289 | 100 | % | $ | 16,378 | 7 | % | ||||||||||||
† Amounts shown do not include computer control systems and software sold as an integrated component of computerized machine systems.
Sales of computerized machine tools and computer control systems and software for fiscal 2017 increased by 7% and 12%, respectively, compared to fiscal 2016, driven primarily by an increase in sales volume of Hurco machines in Europe, particularly the United Kingdom and Germany. Sales of service parts and service fees for fiscal 2017 increased by 11% and 1%, respectively, compared to fiscal 2016, due primarily to an increase in aftermarket sales of Hurco components in Germany.
Orders and Backlog. Orders for fiscal 2017 were $260.6 million, an increase of $41.4 million, or 19%, compared to fiscal 2016, and included a negative currency impact of $2.6 million, or 1%, when translating foreign orders to U.S. Dollars.
The following table sets forth new orders booked by geographic region for fiscal years ended October 31, 2017 and 2016 (dollars in thousands):
| Fiscal Year Ended October 31, | Increase/Decrease | |||||||||||||||||||||||
| 2017 | 2016 | Amount | % | |||||||||||||||||||||
| Americas | $ | 85,070 | 33 | % | $ | 70,944 | 32 | % | $ | 14,126 | 20 | % | ||||||||||||
| Europe | 137,622 | 53 | % | 121,519 | 56 | % | 16,103 | 13 | % | |||||||||||||||
| Asia Pacific | 37,917 | 14 | % | 26,759 | 12 | % | 11,158 | 42 | % | |||||||||||||||
| Total | $ | 260,609 | 100 | % | $ | 219,222 | 100 | % | $ | 41,387 | 19 | % | ||||||||||||
Orders in the Americas for fiscal 2017 increased by 20% compared to fiscal 2016 and reflected improved U.S. market conditions and demand from customers for all product lines (Hurco, Takumi and Milltronics) and in all regions of the country where our customers are located. European orders for fiscal 2017 increased by 13%, compared to fiscal 2016, driven primarily by increased demand for Hurco and Takumi vertical milling machines in Germany, the United Kingdom, and Italy. European orders for fiscal 2017 included a negative currency impact of 2%, when translating foreign orders to U.S. Dollars. Asian Pacific orders for fiscal 2017 increased by 42%, compared to fiscal 2016, driven primarily by increased demand for Hurco and Takumi machines in all Asian Pacific countries where our customers are located, with China contributing the largest increase. Asian Pacific orders for fiscal 2017 included a favorable currency impact of 1%, when translating foreign orders to U.S. Dollars.
| 27 |
Backlog at October 31, 2017 increased to $52.0 million compared to $32.3 million at October 31, 2016 primarily due to an increase in customer orders during fiscal 2017. We do not believe backlog is a useful measure of past performance or indicative of future performance.
Gross Profit. Gross profit for fiscal 2017 was $70.6 million, or 29% of sales, compared to $70.4 million, or 31% of sales, for fiscal 2016. The decrease in gross profit as a percentage of sales for fiscal 2017 primarily reflected the negative impact of foreign currency translation, compared to fiscal 2016, and a sales mix comprised of more entry–level machines, such as those under the Milltronics and Takumi brands, in price competitive geographic regions, such as the Americas and Asia Pacific.
Operating Expenses. Selling, general and administrative expenses for fiscal 2017 were $49.7 million, or 20% of sales, compared to $50.8 million, or 22% of sales, in fiscal 2016, and included a favorable currency impact of $0.2 million when translating foreign expenses to U.S. Dollars for financial reporting purposes.
Operating Income. Operating income for fiscal 2017 was $20.9 million, or 9% of sales, compared to $19.6 million, or 9% of sales, in fiscal 2016. The year–over–year increase in operating income was primarily attributable to a reduction in operating expenses associated with trade show expenses for the International Manufacturing Technology Show (“IMTS”) held in September 2016.
Other Income (Expense). Other income (expense) for fiscal 2017 decreased by $0.5 million from fiscal 2016 due mainly to lower foreign currency losses experienced in 2017.
Provision for Income Taxes. Our effective tax rate for fiscal 2017 was 27% in comparison to 30% for fiscal 2016. The decrease in the effective tax rate year–over–year was primarily due to changes in the geographic mix of income and loss among tax jurisdictions.
Net Income. Net income for fiscal 2017 was $15.1 million, or $2.25 per diluted share, an increase of $1.8 million, or 14%, from fiscal 2016 net income of $13.3 million, or $1.99 per diluted share.
Liquidity and Capital Resources
At October 31, 2018, we had cash and cash equivalents of $77.2 million compared to $66.3 million at October 31, 2017. The increase in cash and cash equivalents was primarily a result of an increase in net income, partially offset by increases in inventories and accounts payable year–over–year when excluding the negative impact of foreign currency of $1.0 million when translating foreign assets into U.S. Dollars for financial reporting purposes. Approximately 69% of our $77.2 million of cash and cash equivalents is held in the U.S. The balance is attributable to our foreign operations and is held in the local currencies of our various foreign entities, subject to fluctuations in currency exchange rates. We do not believe that the indefinite reinvestment of these funds offshore impairs our ability to meet our domestic working capital needs.
Working capital (including cash and cash equivalents) was $194.6 million at October 31, 2018 compared to $175.5 million at October 31, 2017. The increase in working capital was mostly driven by an increase in cash and inventories, partially offset by an increase in accounts payable. Inventories were $137.6 million at October 31, 2018, compared to $119.9 million at October 31, 2017. Inventory turns at October 31, 2018 were 1.6 compared to 1.5 turns at October 31, 2017.
Capital expenditures were $5.9 million in fiscal 2018 compared to $4.4 million in fiscal 2017. Capital expenditures for fiscal 2018 were primarily for software development costs, purchases of factory equipment for production facilities, and purchases of general software and equipment for selling facilities. We funded these expenditures with cash flows from operations.
| 28 |
In December 2012, we entered into a credit agreement (the “2012 Credit Agreement”), which was in effect through the scheduled maturity date of December 31, 2018, when it terminated. Effective as of December 31, 2018, we and our subsidiary Hurco B.V. entered into a new credit agreement (the “2018 Credit Agreement”) with Bank of America, N.A., as the lender. The 2018 Credit Agreement is described further below and in Note 4 of the Notes to Consolidated Financial Statements.
On December 6, 2016, we entered into a fourth amendment to the 2012 Credit Agreement to, among other things, increase the unsecured revolving credit facility from $12.5 million to $15.0 million, to increase the cash dividend allowance from $4.0 million per calendar year to $5.0 million per calendar year, and to extend the scheduled maturity date to December 31, 2018. The 2012 Credit Agreement, as amended, provided for the issuance of up to $5.0 million in letters of credit. We also amended the 2012 Credit Agreement to increase the minimum working capital and minimum tangible net worth requirements from $90.0 million to $105.0 million and $120.0 million to $125.0 million, respectively.
Borrowings under the 2012 Credit Agreement bore interest either at a LIBOR–based rate or a floating rate, in each case with an interest rate floor of 0.00%. The floating rate equaled the greatest of (a) a one month LIBOR–based rate plus 1.00% per annum, (b) the federal funds effective rate plus 0.50% per annum, (c) the prevailing prime rate, and (d) 0.00%. The rate we paid for the unutilized portion of the 2012 Credit Agreement was 0.05% per annum.
The 2012 Credit Agreement contained customary financial covenants, including covenants (1) restricting us from making certain investments, loans, advances and acquisitions (but permitting us to make investments in subsidiaries of up to $5.0 million), (2) requiring that we maintain a minimum working capital of $105.0 million, and (3) requiring that we maintain a minimum tangible net worth of $125.0 million. The 2012 Credit Agreement permitted us to pay cash dividends in an amount not to exceed $5.0 million per calendar year, so long as we were not in default before and after giving effect to such dividends.
The 2018 Credit Agreement provides for an unsecured revolving credit and letter of credit facility in a maximum aggregate amount of $40.0 million. The 2018 Credit Agreement provides that the maximum amount of outstanding letters of credit at any one time may not exceed $10.0 million, the maximum amount of outstanding loans made to our subsidiary Hurco B.V. at any one time may not exceed $20.0 million, and the maximum amount of all outstanding loans denominated in alternative currencies at any one time may not exceed $20.0 million.
Under the 2018 Credit Agreement, we and Hurco B.V. are borrowers, and certain of our other subsidiaries are guarantors. The scheduled maturity date of the 2018 Credit Agreement is December 31, 2020.
Borrowings under the 2018 Credit Agreement will bear interest at floating rates based on, at our option, either (i) a LIBOR–based rate, or other alternative currency–based rate approved by the lender, plus 0.75% per annum, or (ii) a base rate (which is the highest of (a) the federal funds rate plus 0.50%, (b) the prime rate or (c) the one month LIBOR–based rate plus 1.00%), plus 0.00% per annum. Outstanding letters of credit will carry an annual rate of 0.75%.
The 2018 Credit Agreement contains customary affirmative and negative covenants and events of default, including covenants (1) restricting us from making certain investments, loans, advances and acquisitions (but permitting us to make investments in subsidiaries of up to $10.0 million); (2) restricting us from making certain payments, including cash dividends, except that we may pay cash dividends as long as immediately before and after giving effect to such payment, the sum of the unused amount of the commitments under the 2018 Credit Agreement plus our cash on hand is not less than $10.0 million, and as long as we are not in default before and after giving effect to such dividend payments; (3) requiring that we maintain a minimum working capital of $125.0 million; and (4) requiring that we maintain a minimum tangible net worth of $170.0 million.
| 29 |
We may use the proceeds from advances under the 2018 Credit Agreement for general corporate purposes.
As of October 31, 2018, we had a £1.0 million revolving credit facility in the United Kingdom and a €1.5 million revolving credit facility in Germany. On February 16, 2017, we amended our credit facility in China to decrease the credit facility from 40.0 million Chinese Yuan to 20.0 million Chinese Yuan (approximately $2.9 million). On February 14, 2018, we renewed this facility with an expiration date of February 13, 2019. We had $1.4 million and $1.5 million of borrowings under our China credit facility as of October 31, 2018 and 2017, respectively. We had no other debt or borrowings under any of our other credit facilities at either of those dates. At October 31, 2018, we were in compliance with the covenants contained in all of our credit facilities and had $19.4 million of available borrowing capacity under our credit facilities in effect on that date.
In December 2018, in connection with our entry into the 2018 Credit Agreement, (1) using cash on hand, we repaid in full the $1.4 million outstanding under, and terminated, the China credit facility and (2) we terminated our United Kingdom credit facility. As of December 31, 2018, we retained the €1.5 million revolving credit facility in Germany and the $40 million revolving credit facility under 2018 Credit Agreement. As of December 31, 2018, there were no borrowings under any of our credit facilities and $41.7 million of available borrowing capacity thereunder.
We believe our cash position and borrowing capacity under our credit facilities provide adequate liquidity to fund our operations over the next twelve months and allow us to remain committed to our strategic plan of product innovation and targeted penetration of developing markets.
We continue to receive and review information on businesses and assets for potential acquisition, including intellectual property assets that are available for purchase.
Contractual Obligations and Commitments
The following is a table of contractual obligations and commitments as of October 31, 2018 (in thousands):
| Payments Due by Period | ||||||||||||||||||||
| Total | Less than 1 Year | 1–3 Years | 3–5 Years | More than 5 Years | ||||||||||||||||
| Short–term debt | $ | 1,434 | $ | 1,434 | $ | – | $ | – | $ | – | ||||||||||
| Operating leases | 9,859 | 3,504 | 3,863 | 2,180 | 312 | |||||||||||||||
| Other | 6,002 | – | 808 | 345 | 4,849 | |||||||||||||||
| Total | $ | 17,295 | $ | 4,938 | $ | 4,671 | $ | 2,525 | $ | 5,161 | ||||||||||
In addition to the contractual obligations and commitments disclosed above, we also have a variety of other obligations for the procurement of materials and services, none of which subject us to any material non–cancelable commitments. While some of these obligations arise under long–term supply agreements, we are not committed under these agreements to accept or pay for requirements that are not needed to meet our production needs. We have no material minimum purchase commitments or “take–or–pay” type agreements or arrangements. Unrecognized tax benefits in the amount of approximately $0.2 million, excluding any interest and penalties, have been excluded from the table above because we are unable to determine a reasonably reliable estimate of the timing of future payment.
We expect capital spending in fiscal 2019 to be approximately $15.3 million, which includes investments for software development, real estate development, factory equipment and production facilities, as well as general software and equipment for selling facilities. We expect to fund a large portion of these commitments with cash on hand and cash generated from operations.
| 30 |
Off Balance Sheet Arrangements
From time to time, our subsidiaries guarantee third party payment obligations in connection with the sale of machines to customers that use financing. We follow Financial Accounting Standards Board (“FASB”) guidance for accounting for guarantees (codified in Accounting Standards Codification (“ASC”) 460). As of October 31, 2018, we had 23 outstanding third party payment guarantees totaling approximately $0.6 million. The terms of these guarantees are consistent with the underlying customer financing terms. Upon shipment of a machine, the customer assumes the risk of ownership. The customer does not obtain title, however, until the customer has paid for the machine. A retention of title clause allows us to recover the machine if the customer defaults on the financing. We accrue liabilities under these guarantees at fair value, which amounts are insignificant.
Critical Accounting Policies and Estimates
Our discussion and analysis of financial condition and results of operations is based upon our consolidated financial statements, which have been prepared in accordance with U.S. Generally Accepted Accounting Principles. The preparation of financial statements in conformity with those accounting principles requires us to make judgments and estimates that affect the amounts reported in the consolidated financial statements and accompanying notes. Those judgments and estimates have a significant effect on the financial statements because they result primarily from the need to make estimates about the effects of matters that are inherently uncertain. Actual results could differ from those estimates. Our accounting policies, including those described below, are frequently evaluated as our judgment and estimates are based upon historical experience and on various other assumptions that are believed to be reasonable under the circumstances.
Revenue Recognition – We recognize revenue from sales of our machine tool systems upon delivery of the product to the customer or distributor, which is normally at the time of shipment, because persuasive evidence of an arrangement exists, delivery has occurred, the selling price is fixed and determinable and collectability is reasonably assured. Our computerized machine tools are general purpose computer–controlled machine tools that are typically used in stand–alone operations. Transfer of ownership and risk of loss are not contingent upon contractual customer acceptance. Prior to shipment, we test each machine to ensure the machine’s compliance with standard operating specifications.
Depending upon geographic location, after shipment, a machine may be installed at the customer’s facilities by a distributor, independent contractor or by one of our service technicians. In most instances where a machine is sold through a distributor, we have no installation involvement. If sales are direct or through sales agents, we will typically complete the machine installation, which consists of the reassembly of certain parts that were removed for shipping and the re–testing of the machine to ensure that it is performing within the standard specifications. We consider the machine installation process for our three–axis machines to be inconsequential and perfunctory. We allocate the transaction prices and recognize revenue associated with the installation process for our five–axis machines on a prorata basis over the period of the installation process.
Service fees from maintenance contracts are deferred and recognized in earnings on a pro rata basis over the term of the contract, and are generally sold on a stand–alone basis. Sales related to software upgrades are recognized when shipped in conformity with U.S. Generally Accepted Accounting Principles as promulgated by FASB guidance related to software revenue recognition that requires that at the time of shipment, persuasive evidence of an arrangement exists, delivery has occurred, the selling price is fixed and determinable and collectability is reasonably assured. The software does not require production, modification or customization.
Inventories – We determine at each balance sheet date how much, if any, of our inventory may ultimately prove to be either unsalable or unsalable at its carrying cost. Reserves are established to effectively adjust the carrying value of such inventory to lower of cost (first–in, first–out method) or net realizable value. To determine the appropriate level of valuation reserves, we evaluate current stock levels in relation to historical and expected patterns of demand for all of our products. We evaluate the need for changes to valuation reserves based on market conditions, competitive offerings and other factors on a regular basis.
| 31 |
Income Taxes – We account for income taxes and the related accounts under the asset and liability method. Deferred tax assets and liabilities are measured using enacted income tax rates in each jurisdiction in effect for the year in which the temporary differences are expected to be recovered or settled. These deferred tax assets are reduced by a valuation allowance, which is established when it is more likely than not that some portion or all of the deferred tax assets will not be realized. Our judgment regarding the realization of deferred tax assets may change due to future profitability and market conditions, changes in U.S. or foreign tax laws and other factors. These changes, if any, may require material adjustments to these deferred tax assets and an accompanying reduction or increase in net income in the period when such determinations are made.
The determination of our provision for income taxes requires judgment, the use of estimates and the interpretation and application of complex tax laws. Our provision for income taxes reflects a combination of income earned and taxed at the federal and state level in the U.S., as well as in various foreign jurisdictions.
In December 2017, the Tax Cuts and Jobs Act (the “Tax Reform Act”) was enacted. The Tax Reform Act, among other things, lowered the U.S. corporate tax rate from 35% to 21%, implemented a territorial tax system from a worldwide system and imposed a one–time tax on deemed repatriation of earnings of foreign subsidiaries.
As a result of the reduction in the federal corporate income tax rate, we were required to revalue our net deferred tax asset to account for the future impact of lower corporate tax rates on this deferred amount and record any change in the value of such asset as a one–time non–cash charge on our income statement. This resulted in additional expense of $0.6 million, which was recognized in fiscal 2018. Additionally, the Tax Reform Act required a transition tax on any net accumulated earnings and profits generated by foreign subsidiaries as of the two required measurement dates, November 2, 2017 and December 31, 2017 while providing for future tax–free repatriation of such earnings through a 100% dividends–received deduction. This resulted in a one–time transition tax on the deemed repatriation of net accumulated foreign earnings and profits of $2.2 million in fiscal 2018, for a total impact of $2.8 million. As such, as of December 31, 2017, all of the Company’s accumulated earnings and profits were deemed repatriated. We have not provided for any U.S. income taxes on the undistributed earnings of our foreign subsidiaries beginning January 1, 2018 based upon our determination that such earnings will be indefinitely reinvested abroad.
In addition to the risks to the effective tax rate described above, the future effective tax rate reflected in forward–looking statements is based on currently effective tax laws. Significant changes in those laws could materially affect these estimates.
We recognize uncertain tax positions when it is more likely than not that the tax position will be sustained upon examination by relevant taxing authorities, based on the technical merits of the position. The amount recognized is measured as the largest amount of benefit that is greater than 50 percent likely of being realized upon ultimate settlement.
Impairment of Long–Lived Assets – We are required periodically to review the recoverability of certain assets, including property, plant and equipment, intangible assets and goodwill, based on projections of anticipated future cash flows, including future profitability assessments of various product lines. We estimate cash flows using internal budgets based on recent sales data.
| 32 |
Capitalized Software Development Costs – Costs incurred to develop computer software products and significant enhancements to software features of existing products are capitalized as required by FASB guidance relating to accounting for the costs of computer software to be sold, leased, or otherwise marketed, and such capitalized costs are amortized over the estimated product life of the related software. The determination as to when in the product development cycle technological feasibility has been established, and the expected product life, require judgments and estimates by management and can be affected by technological developments, innovations by competitors and changes in market conditions affecting demand. We periodically review the carrying values of these assets and make judgments as to ultimate realization considering the above–mentioned risk factors.
Derivative Financial Instruments – Critical aspects of our accounting policy for derivative financial instruments that we designate as hedging instruments include conditions that require that critical terms of a hedging instrument are essentially the same as a hedged forecasted transaction. Another important element of our policy demands that formal documentation be maintained as required by FASB guidance relating to accounting for derivative instruments and hedging activities. Failure to comply with these conditions would result in a requirement to recognize changes in market value of hedge instruments in earnings. We routinely monitor significant estimates, assumptions, and judgments associated with derivative instruments, and compliance with formal documentation requirements.
Stock Compensation – We account for share–based compensation according to FASB guidance relating to share–based payments, which requires the measurement and recognition of compensation expense for all share–based awards made to employees and directors based on estimated fair values on the grant date. This guidance requires that we estimate the fair value of share–based awards on the date of grant and recognize as expense the value of the portion of the award that is ultimately expected to vest over the requisite service period.
| 33 |
Item 7A. Quantitative and Qualitative Disclosures About Market Risk
Interest Rate Risk
Interest on borrowings under our bank credit agreements are tied to prevailing domestic and foreign interest rates. At October 31, 2018, we had $1.4 million of borrowings under our China credit facility. We had no other debt or borrowings under any of our other credit facilities.
Foreign Currency Exchange Risk
In fiscal 2018, we derived approximately 70% of our revenues from customers located outside of the Americas. All of our computerized machine tools and computer control systems, as well as certain proprietary service parts, are sourced by our U.S.–based engineering and manufacturing division and re–invoiced to our foreign sales and service subsidiaries, primarily in their functional currencies.
Our products are sourced from foreign suppliers or built to our specifications by either our wholly–owned subsidiaries in Taiwan, the U.S., Italy and China or an affiliated contract manufacturer in Taiwan. Our purchases are predominantly in foreign currencies and in some cases our arrangements with these suppliers include foreign currency risk sharing agreements, which reduce (but do not eliminate) the effects of currency fluctuations on product costs. The predominant portion of the exchange rate risk associated with our product purchases relates to the New Taiwan Dollar and the Euro.
We enter into foreign currency forward exchange contracts from time to time to hedge the cash flow risk related to forecasted inter–company sales and purchases denominated in, or based on, foreign currencies (primarily the Euro, Pound Sterling, and New Taiwan Dollar). We also enter into foreign currency forward exchange contracts to protect against the effects of foreign currency fluctuations on receivables and payables denominated in foreign currencies. We do not speculate in the financial markets and, therefore, do not enter into these contracts for trading purposes.
Forward contracts for the sale or purchase of foreign currencies as of October 31, 2018, which are designated as cash flow hedges under FASB guidance related to accounting for derivative instruments and hedging activities, were as follows (in thousands, except weighted average forward rates):
| Notional Amount | Weighted Avg. | Contract Amount at Forward Rates in U.S. Dollars | ||||||||||||||||
| Forward | in Foreign | Forward | Contract | October 31, | ||||||||||||||
| Contracts | Currency | Rate | Date | 2018 | Maturity Dates | |||||||||||||
| Sale Contracts: | ||||||||||||||||||
| Euro | 28,650 | 1.2151 | 34,812 | 32,881 | Nov 2018 – Oct 2019 | |||||||||||||
| Sterling | 7,450 | 1.3519 | 10,071 | 9,587 | Nov 2018 – Oct 2019 | |||||||||||||
| Purchase Contracts: | ||||||||||||||||||
| New Taiwan Dollar | 1,049,000 | 29.208 | * | 35,914 | 34,306 | Nov 2018 – Oct 2019 | ||||||||||||
*New Taiwan Dollars per U.S. Dollar
| 34 |
Forward contracts for the sale or purchase of foreign currencies as of October 31, 2018, which were entered into to protect against the effects of foreign currency fluctuations on receivables and payables and are not designated as hedges under this guidance denominated in foreign currencies, were as follows (in thousands, except weighted average forward rates):
| Notional Amount | Weighted Avg. | Contract Amount at Forward Rates in U.S. Dollars | ||||||||||||||||
| Forward | in Foreign | Forward | Contract | October 31, | ||||||||||||||
| Contracts | Currency | Rate | Date | 2018 | Maturity Dates | |||||||||||||
| Sale Contracts: | ||||||||||||||||||
| Euro | 19,246 | 1.1611 | 22,347 | 21,945 | Nov 2018 – Jul 2019 | |||||||||||||
| South African Rand | 6,992 | 0.0667 | 466 | 464 | Apr 2019 | |||||||||||||
| Purchase Contracts: | ||||||||||||||||||
| New Taiwan Dollar | 1,159,421 | 30.5528 | * | 37,948 | 37,567 | Nov 2018 – Jan 2019 | ||||||||||||
* New Taiwan Dollars per U.S. Dollar
We are also exposed to foreign currency exchange risk related to our investment in net assets in foreign countries. To manage this risk, we entered into a forward contract with a notional amount of €3.0 million in November 2017. We designated this forward contract as a hedge of our net investment in Euro denominated assets. We selected the forward method under the FASB guidance related to the accounting for derivatives instruments and hedging activities. The forward method requires all changes in the fair value of the contract to be reported as a cumulative translation adjustment, net of tax, in Accumulated other comprehensive loss in the same manner as the underlying hedged net assets. This forward contract matured in November 2018 and we entered into a new forward contract for the same notional amount that is set to mature in November 2019. As of October 31, 2018, we had $652,000 of realized gains and $153,000 of unrealized gains, net of tax, recorded as cumulative translation adjustments in Accumulated other comprehensive loss, related to these forward contracts.
Forward contracts designated as net investment hedges under this guidance as of October 31, 2018 were as follows (in thousands, except weighted average forward rates):
| Notional Amount | Weighted Avg. | Contract Amount at Forward Rates in U.S. Dollars | ||||||||||||||||
| Forward Contracts | in Foreign Currency | Forward Rate | Contract Date | October 31, 2018 | Maturity Date | |||||||||||||
Sale Contracts: | ||||||||||||||||||
| Euro | 3,000 | 1.2095 | 3,629 | 3,397 | Nov 2018 | |||||||||||||
| 35 |
Management’s Annual Report on Internal Control over Financial Reporting
To the Shareholders and
Board of Directors
of Hurco Companies, Inc.
Management of Hurco Companies, Inc. (the “Company”) has assessed the effectiveness of the Company’s internal control over financial reporting as of October 31, 2018, based on criteria established in Internal Control–Integrated Framework issued by the Committee of Sponsoring Organizations of the Treadway Commission (2013 framework) (COSO). Management is responsible for the Company’s financial statements, for maintaining effective internal control over financial reporting, and for its assessment of the effectiveness of internal control over financial reporting.
Because of its inherent limitations, the Company’s internal control over financial reporting may not prevent or detect misstatements. Also, projections of any evaluation of effectiveness to future periods are subject to the risk that controls may become inadequate because of changes in conditions, or that the degree of compliance with the policies or procedures may deteriorate.
In management’s opinion, the Company’s internal control over financial reporting as of October 31, 2018, was effective based on the criteria specified above.
Our independent registered public accounting firm, RSM US LLP (“RSM”), which also audited our consolidated financial statements, audited the effectiveness of our internal control over financial reporting as of October 31, 2018. RSM has issued their attestation report, which is included in Part II, Item 8 of this Annual Report on Form 10–K.
| /s/ Michael Doar | |
| Michael Doar, | |
| Chairman and Chief Executive Officer | |
| /s/ Sonja K. McClelland | |
| Sonja K. McClelland | |
| Executive Vice President, Secretary, Treasurer and Chief Financial Officer | |
| Indianapolis, Indiana | |
| January 4, 2019 | |
| 36 |
Item 8. FINANCIAL STATEMENTS AND SUPPLEMENTARY DATA
Report of Independent Registered Public Accounting Firm
To the Shareholders
and Board of Directors
of Hurco Companies, Inc.
Opinion on the Financial Statements
We have audited the accompanying consolidated balance sheets of Hurco Companies, Inc. and its subsidiaries (the Company) as of October 31, 2018 and 2017, the related consolidated statements of income, comprehensive income, changes in shareholders’ equity and cash flows for the years then ended, and the related notes and schedule listed in Item 15(a) (collectively, the financial statements). In our opinion, the financial statements present fairly, in all material respects, the financial position of the Company as of October 31, 2018 and 2017, and the results of its operations and its cash flows for the years then ended in conformity with accounting principles generally accepted in the United States of America.
We have also audited, in accordance with the standards of the Public Company Accounting Oversight Board (United States) (PCAOB), the Company's internal control over financial reporting as of October 31, 2018, based on criteria established in Internal Control – Integrated Framework issued by the Committee of Sponsoring Organizations of the Treadway Commission in 2013, and our report dated January 4, 2019 expressed an unqualified opinion on the effectiveness of the Company's internal control over financial reporting.
Basis for Opinion
These financial statements are the responsibility of the Company’s management. Our responsibility is to express an opinion on the Company’s financial statements based on our audits. We are a public accounting firm registered with the PCAOB and are required to be independent with respect to the Company in accordance with U.S. federal securities laws and the applicable rules and regulations of the Securities and Exchange Commission and the PCAOB.
We conducted our audits in accordance with the standards of the PCAOB. Those standards require that we plan and perform the audits to obtain reasonable assurance about whether the financial statements are free of material misstatement, whether due to error or fraud. Our audits included performing procedures to assess the risks of material misstatement of the financial statements, whether due to error or fraud, and performing procedures that respond to those risks. Such procedures included examining, on a test basis, evidence regarding the amounts and disclosures in the financial statements. Our audits also included evaluating the accounting principles used and significant estimates made by management, as well as evaluating the overall presentation of the financial statements. We believe that our audits provide a reasonable basis for our opinion.
We have served as the Company's auditor since 2017.
| /s/ RSM US LLP | |
| Indianapolis, Indiana | |
| January 4, 2019 |
| 37 |
Report of Independent Registered Public Accounting Firm
To the Shareholders and
Board of Directors
of Hurco Companies, Inc.
We have audited the accompanying consolidated statements of income, comprehensive income, changes in shareholders’ equity and cash flows of Hurco Companies, Inc. for the year ended October 31, 2016. Our audit also included the financial statement schedule listed at Item 15(a) for the year ended October 31, 2016. These financial statements and schedule are the responsibility of the Company’s management. Our responsibility is to express an opinion on these financial statements and schedule based on our audit.
We conducted our audit in accordance with the standards of the Public Company Accounting Oversight Board (United States). Those standards require that we plan and perform the audit to obtain reasonable assurance about whether the financial statements are free of material misstatement. An audit includes examining, on a test basis, evidence supporting the amounts and disclosures in the financial statements. An audit also includes assessing the accounting principles used and significant estimates made by management, as well as evaluating the overall financial statement presentation. We believe that our audit provides a reasonable basis for our opinion.
In our opinion, the financial statements referred to above present fairly, in all material respects, the consolidated results of Hurco Companies, Inc.’s operations and its cash flows for the year ended October 31, 2016 in conformity with U.S. generally accepted accounting principles. Also, in our opinion, the related financial statement schedule for the year ended October 31, 2016, when considered in relation to the basic financial statements taken as a whole, presents fairly in all material respects the information set forth therein.
| /s/ Ernst & Young LLP | |
| Indianapolis, Indiana | |
| January 6, 2017, except for Note 15, as to which the date is January 5, 2018 | |
| 38 |
Report of Independent Registered Public Accounting Firm
To the Shareholders
and Board of Directors
of Hurco Companies, Inc.
Opinion on the Internal Control Over Financial Reporting
We have audited Hurco Companies, Inc.'s (the Company) internal control over financial reporting as of October 31, 2018, based on criteria established in Internal Control – Integrated Framework issued by the Committee of Sponsoring Organizations of the Treadway Commission in 2013. In our opinion, the Company maintained, in all material respects, effective internal control over financial reporting as of October 31, 2018, based on criteria established in Internal Control – Integrated Framework issued by the Committee of Sponsoring Organizations of the Treadway Commission in 2013.
We have also audited, in accordance with the standards of the Public Company Accounting Oversight Board (United States) (PCAOB), the consolidated balance sheets of the Company as of October 31, 2018 and 2017, the related consolidated statements of income, comprehensive income, changes in shareholders’ equity and cash flows, for the years then ended, and the related notes and schedules listed in Item 15(a) of the Company and our report dated January 4, 2019 expressed an unqualified opinion.
Basis for Opinion
The Company’s management is responsible for maintaining effective internal control over financial reporting and for its assessment of the effectiveness of internal control over financial reporting in the accompanying Management's Report on Internal Control over Financial Reporting. Our responsibility is to express an opinion on the Company’s internal control over financial reporting based on our audit. We are a public accounting firm registered with the PCAOB and are required to be independent with respect to the Company in accordance with U.S. federal securities laws and the applicable rules and regulations of the Securities and Exchange Commission and the PCAOB.
We conducted our audit in accordance with the standards of the PCAOB. Those standards require that we plan and perform the audit to obtain reasonable assurance about whether effective internal control over financial reporting was maintained in all material respects. Our audit included obtaining an understanding of internal control over financial reporting, assessing the risk that a material weakness exists, and testing and evaluating the design and operating effectiveness of internal control based on the assessed risk. Our audit also included performing such other procedures as we considered necessary in the circumstances. We believe that our audit provides a reasonable basis for our opinion.
Definition and Limitations of Internal Control Over Financial Reporting
A company's internal control over financial reporting is a process designed to provide reasonable assurance regarding the reliability of financial reporting and the preparation of financial statements for external purposes in accordance with generally accepted accounting principles. A company's internal control over financial reporting includes those policies and procedures that (1) pertain to the maintenance of records that, in reasonable detail, accurately and fairly reflect the transactions and dispositions of the assets of the company; (2) provide reasonable assurance that transactions are recorded as necessary to permit preparation of financial statements in accordance with generally accepted accounting principles, and that receipts and expenditures of the company are being made only in accordance with authorizations of management and directors of the company; and (3) provide reasonable assurance regarding prevention or timely detection of unauthorized acquisition, use or disposition of the company's assets that could have a material effect on the financial statements.
| 39 |
Because of its inherent limitations, internal control over financial reporting may not prevent or detect misstatements. Also, projections of any evaluation of effectiveness to future periods are subject to the risk that controls may become inadequate because of changes in conditions, or that the degree of compliance with the policies or procedures may deteriorate.
| /s/ RSM US LLP | |
| Indianapolis, Indiana | |
| January 4, 2019 |
| 40 |
CONSOLIDATED STATEMENTS OF INCOME
| Year Ended October 31, | ||||||||||||
| 2018 | 2017 | 2016 | ||||||||||
| (In thousands, except per share amounts) | ||||||||||||
| Sales and service fees | $ | 300,671 | $ | 243,667 | $ | 227,289 | ||||||
| Cost of sales and service | 208,865 | 173,103 | 156,849 | |||||||||
| Gross profit | 91,806 | 70,564 | 70,440 | |||||||||
| Selling, general and administrative expenses | 58,010 | 49,661 | 50,824 | |||||||||
| Operating income | 33,796 | 20,903 | 19,616 | |||||||||
| Interest expense | 100 | 91 | 72 | |||||||||
| Interest income | 189 | 41 | 40 | |||||||||
| Investment income | 339 | 138 | 149 | |||||||||
| Income from equity investments | 639 | 505 | 466 | |||||||||
| Other expense, net | 2,367 | 780 | 1,314 | |||||||||
| Income before income taxes | 32,496 | 20,716 | 18,885 | |||||||||
| Provision for income taxes | 11,006 | 5,601 | 5,593 | |||||||||
| Net income | $ | 21,490 | $ | 15,115 | $ | 13,292 | ||||||
| Income per common share – basic | $ | 3.19 | $ | 2.27 | $ | 2.01 | ||||||
| Weighted average common shares outstanding – basic | 6,700 | 6,615 | 6,569 | |||||||||
| Income per common share – diluted | $ | 3.15 | $ | 2.25 | $ | 1.99 | ||||||
| Weighted average common shares outstanding – diluted | 6,771 | 6,680 | 6,642 | |||||||||
| Dividends paid per share | $ | 0.43 | $ | 0.39 | $ | 0.35 | ||||||
The accompanying notes are an integral part of the consolidated financial statements.
| 41 |
CONSOLIDATED STATEMENTS OF COMPREHENSIVE INCOME
| Year Ended October 31, | ||||||||||||
| 2018 | 2017 | 2016 | ||||||||||
| (In thousands) | ||||||||||||
| Net Income | $ | 21,490 | $ | 15,115 | $ | 13,292 | ||||||
| Other comprehensive income (loss): | ||||||||||||
| Translation gain (loss) of foreign currency financial statements | (3,183 | ) | 4,916 | (1,441 | ) | |||||||
| (Gain) / loss on derivative instruments reclassified into operations, net of tax of $453, $(745), and $(906), respectively | 1,355 | (1,354 | ) | (1,647 | ) | |||||||
| Gain / (loss) on derivative instruments, net of tax of $52, $(390), and $787, respectively | 155 | (709 | ) | 1,431 | ||||||||
| Total other comprehensive income (loss) | (1,673 | ) | 2,853 | (1,657 | ) | |||||||
| Comprehensive income | $ | 19,817 | $ | 17,968 | $ | 11,635 | ||||||
The accompanying notes are an integral part of the consolidated financial statements.
| 42 |
CONSOLIDATED BALANCE SHEETS
| As of October 31, | ||||||||
| 2018 | 2017 | |||||||
| (In thousands, except share and per share data) | ||||||||
| ASSETS | ||||||||
| Current assets: | ||||||||
| Cash and cash equivalents | $ | 77,170 | $ | 66,307 | ||||
| Accounts receivable, less allowance for doubtful accounts of $1,027 in 2018 and $639 in 2017 | 54,414 | 50,094 | ||||||
| Inventories, net | 137,609 | 119,948 | ||||||
| Derivative assets | 3,085 | 596 | ||||||
| Prepaid assets | 7,332 | 7,913 | ||||||
| Other | 1,825 | 1,557 | ||||||
| Total current assets | 281,435 | 246,415 | ||||||
| Property and equipment: | ||||||||
| Land | 868 | 841 | ||||||
| Building | 7,352 | 7,352 | ||||||
| Machinery and equipment | 26,840 | 25,652 | ||||||
| Leasehold improvements | 3,801 | 3,503 | ||||||
| 38,861 | 37,348 | |||||||
| Less accumulated depreciation and amortization | (25,902 | ) | (25,167 | ) | ||||
| Total property and equipment, net | 12,959 | 12,181 | ||||||
| Non–current assets: | ||||||||
| Software development costs, less accumulated amortization | 7,452 | 6,226 | ||||||
| Goodwill | 2,377 | 2,440 | ||||||
| Intangible assets, net | 938 | 1,076 | ||||||
| Deferred income taxes | 2,234 | 2,339 | ||||||
| Investments and other assets, net | 8,012 | 7,131 | ||||||
| Total non–current assets | 21,013 | 19,212 | ||||||
| Total assets | $ | 315,407 | $ | 277,808 | ||||
| LIABILITIES AND SHAREHOLDERS’ EQUITY | ||||||||
| Current liabilities: | ||||||||
| Accounts payable | $ | 54,131 | $ | 45,127 | ||||
| Accounts payable–related parties | 3,387 | 2,511 | ||||||
| Accrued payroll and employee benefits | 14,032 | 11,210 | ||||||
| Accrued income taxes | 5,180 | 2,362 | ||||||
| Accrued expenses and other | 4,122 | 4,668 | ||||||
| Accrued warranty expenses | 2,497 | 1,772 | ||||||
| Derivative liabilities | 2,020 | 1,732 | ||||||
| Short–term debt | 1,434 | 1,507 | ||||||
| Total current liabilities | 86,803 | 70,889 | ||||||
| Non–current liabilities: | ||||||||
| Accrued tax liability | 2,194 | 117 | ||||||
| Deferred credits and other | 3,557 | 3,717 | ||||||
| Total non–current liabilities | 5,751 | 3,834 | ||||||
| Shareholders’ equity: | ||||||||
| Preferred stock: no par value per share, 1,000,000 shares authorized, no shares issued | – | – | ||||||
| Common stock: no par value, $.10 stated value per share, 12,500,000 shares authorized, 6,891,508 and 6,799,006 shares issued; and 6,723,160 and 6,641,197 shares outstanding, as of October 31, 2018 and October 31, 2017, respectively | 672 | 664 | ||||||
| Additional paid–in capital | 64,185 | 61,344 | ||||||
| Retained earnings | 167,859 | 149,267 | ||||||
| Accumulated other comprehensive loss | (9,863 | ) | (8,190 | ) | ||||
| Total shareholders’ equity | 222,853 | 203,085 | ||||||
| Total liabilities and shareholders’ equity | $ | 315,407 | $ | 277,808 | ||||
The accompanying notes are an integral part of the consolidated financial statements.
| 43 |
CONSOLIDATED STATEMENTS OF CASH FLOWS
| Year Ended October 31, | ||||||||||||
| 2018 | 2017 | 2016 | ||||||||||
| (In thousands) | ||||||||||||
| Cash flows from operating activities: | ||||||||||||
| Net income | $ | 21,490 | $ | 15,115 | $ | 13,292 | ||||||
| Adjustments to reconcile net income to net cash provided by (used for) operating activities, net of acquisitions: | ||||||||||||
| Provision for doubtful accounts | 388 | (25 | ) | (75 | ) | |||||||
| Deferred income taxes | (530 | ) | 1,108 | (225 | ) | |||||||
| Equity in income of affiliates | (639 | ) | (505 | ) | (466 | ) | ||||||
| Foreign currency (gain) loss | 755 | (851 | ) | 1,850 | ||||||||
| Unrealized (gain) loss on derivatives | 456 | (411 | ) | 393 | ||||||||
| Depreciation and amortization | 3,713 | 3,616 | 3,868 | |||||||||
| Stock–based compensation | 2,504 | 1,698 | 1,607 | |||||||||
| Change in assets and liabilities, net of acquisitions: | ||||||||||||
| (Increase) decrease in accounts receivable | (5,148 | ) | 563 | (8,141 | ) | |||||||
| (Increase) decrease in inventories | (20,386 | ) | 1,638 | (13,881 | ) | |||||||
| (Increase) decrease in prepaid expenses | 710 | 80 | 809 | |||||||||
| Increase (decrease) in accounts payable | 10,788 | 8,529 | (6,001 | ) | ||||||||
| Increase (decrease) in accrued expenses | 6,024 | 627 | (90 | ) | ||||||||
| Increase (decrease) in accrued tax liability | 2,061 | (844 | ) | – | ||||||||
| Net change in derivative assets and liabilities | (1,178 | ) | 964 | (245 | ) | |||||||
| Other | 4 | (930 | ) | 588 | ||||||||
| Net cash provided by (used for) operating activities | 21,012 | 30,372 | (6,717 | ) | ||||||||
| Cash flows from investing activities: | ||||||||||||
| Proceeds from sale of property and equipment | 180 | – | 264 | |||||||||
| Purchase of property and equipment | (3,537 | ) | (2,181 | ) | (1,972 | ) | ||||||
| Software development costs | (2,326 | ) | (2,264 | ) | (2,205 | ) | ||||||
| Other investments | 233 | 417 | – | |||||||||
| Acquisition of business | (1,156 | ) | – | – | ||||||||
| Net cash provided by (used for) investing activities | (6,606 | ) | (4,028 | ) | (3,913 | ) | ||||||
| Cash flows from financing activities: | ||||||||||||
| Proceeds from exercise of common stock options | 847 | 534 | – | |||||||||
| Dividends paid | (2,898 | ) | (2,590 | ) | (2,310 | ) | ||||||
| Taxes paid related to net settlement of restricted shares | (502 | ) | (295 | ) | (146 | ) | ||||||
| Net cash provided by (used for) financing activities | (2,553 | ) | (2,351 | ) | (2,456 | ) | ||||||
| Effect of exchange rate changes on cash and cash equivalents | (990 | ) | 1,097 | (934 | ) | |||||||
| Net increase (decrease) in cash and cash equivalents | 10,863 | 25,090 | (14,020 | ) | ||||||||
| Cash and cash equivalents at beginning of year | 66,307 | 41,217 | 55,237 | |||||||||
| Cash and cash equivalents at end of year | $ | 77,170 | $ | 66,307 | $ | 41,217 | ||||||
| Supplemental disclosures: | ||||||||||||
| Cash paid for: | ||||||||||||
| Interest | $ | 64 | $ | 66 | $ | 56 | ||||||
| Income taxes, net | $ | 6,172 | $ | 4,867 | $ | 4,328 | ||||||
The accompanying notes are an integral part of the consolidated financial statements.
| 44 |
CONSOLIDATED STATEMENTS OF CHANGES IN SHAREHOLDERS' EQUITY
| Common | Accumulated | |||||||||||||||||||||||
| Stock | Common | Additional | Other | |||||||||||||||||||||
| (In thousands, except shares | Shares | Stock | Paid–In | Retained | Comprehensive | |||||||||||||||||||
| outstanding) | Outstanding | Amount | Capital | Earnings | Loss | Total | ||||||||||||||||||
| Balances, October 31, 2015 | 6,551,718 | $ | 655 | $ | 57,539 | $ | 125,760 | $ | (9,386 | ) | $ | 174,568 | ||||||||||||
| Net income | – | – | – | 13,292 | – | 13,292 | ||||||||||||||||||
| Other comprehensive income (loss) | – | – | – | – | (1,657 | ) | (1,657 | ) | ||||||||||||||||
| Stock–based compensation expense | 21,385 | 2 | 1,605 | – | – | 1,607 | ||||||||||||||||||
| Tax benefit (expense) from stock option activities | – | – | (25 | ) | – | – | (25 | ) | ||||||||||||||||
| Dividends paid | – | – | – | (2,310 | ) | – | (2,310 | ) | ||||||||||||||||
| Balances, October 31, 2016 | 6,573,103 | $ | 657 | $ | 59,119 | $ | 136,742 | $ | (11,043 | ) | $ | 185,475 | ||||||||||||
| Net income | – | – | – | 15,115 | – | 15,115 | ||||||||||||||||||
| Other comprehensive income (loss) | – | – | – | – | 2,853 | 2,853 | ||||||||||||||||||
| Exercise of common stock options | 29,164 | 3 | 531 | – | – | 534 | ||||||||||||||||||
| Stock–based compensation expense | 38,930 | 4 | 1,694 | – | – | 1,698 | ||||||||||||||||||
| Dividends paid | – | – | – | (2,590 | ) | – | (2,590 | ) | ||||||||||||||||
| Balances, October 31, 2017 | 6,641,197 | $ | 664 | $ | 61,344 | $ | 149,267 | $ | (8,190 | ) | $ | 203,085 | ||||||||||||
| Net income | – | – | – | 21,490 | – | 21,490 | ||||||||||||||||||
| Other comprehensive income (loss) | – | – | – | – | (1,673 | ) | (1,673 | ) | ||||||||||||||||
| Exercise of common stock options | 41,680 | 4 | 843 | – | – | 847 | ||||||||||||||||||
| Stock-based compensation expense, net of taxes withheld for vested restricted shares | 40,283 | 4 | 1,998 | – | – | 2,002 | ||||||||||||||||||
| Dividends paid | – | – | – | (2,898 | ) | – | (2,898 | ) | ||||||||||||||||
| Balances, October 31, 2018 | 6,723,160 | $ | 672 | $ | 64,185 | $ | 167,859 | $ | (9,863 | ) | $ | 222,853 | ||||||||||||
The accompanying notes are an integral part of the consolidated financial statements.
| 45 |
NOTES TO CONSOLIDATED FINANCIAL STATEMENTS
| 1. | SUMMARY OF SIGNIFICANT ACCOUNTING POLICIES |
Consolidation. The consolidated financial statements include the accounts of Hurco Companies, Inc. (an Indiana corporation) and its wholly–owned subsidiaries. We have a 35% ownership interest in a Taiwan affiliate that is accounted for using the equity method. Our investment in that affiliate was approximately $4.0 million and $3.6 million as of October 31, 2018 and 2017, respectively. That investment is included in Investments and other assets, net on the accompanying Consolidated Balance Sheets. Intercompany accounts and transactions have been eliminated.
Reclassifications. Certain prior year amounts have been reclassified to conform to current year presentation. This reclassification has no impact on previously reported net income or shareholders’ equity.
Statements of Cash Flows. We consider all highly liquid investments with a stated maturity at the date of purchase of three months or less to be cash equivalents. Cash flows from hedges are classified consistent with the items being hedged.
Translation of Foreign Currencies. All balance sheet accounts of non–U.S. subsidiaries are translated at the exchange rate as of the end of the year and translation adjustments of foreign currency balance sheets are recorded as a component of Accumulated other comprehensive loss in shareholders' equity. Income and expenses are translated at the average exchange rates during the year. Cumulative foreign currency translation adjustments, net of gains related to our net investment hedges, as of October 31, 2018 were a net loss of $10.6 million and are included in Accumulated other comprehensive loss. Foreign currency transaction gains and losses are recorded as income or expense as incurred and are recorded in Other expense, net.
Hedging. We are exposed to certain market risks relating to our ongoing business operations, including foreign currency risk, interest rate risk and credit risk. We manage our exposure to these and other market risks through regular operating and financing activities. Currently, the only risk that we manage through the use of derivative instruments is foreign currency risk.
We operate on a global basis and are exposed to the risk that our financial condition, results of operations and cash flows could be adversely affected by changes in foreign currency exchange rates. To reduce the potential effects of foreign exchange rate movements on our net equity investment in one of our foreign subsidiaries, and the gross profit and net earnings of certain of our foreign subsidiaries, we enter into derivative financial instruments in the form of foreign exchange forward contracts with a major financial institution. We are primarily exposed to foreign currency exchange rate risk with respect to transactions and net assets denominated in Euros, Pounds Sterling, Indian Rupee, South African Rand, Singapore Dollars, Chinese Yuan, Polish Zloty, and New Taiwan Dollars.
We account for derivative instruments as either assets or liabilities and carry them at fair value. The accounting for changes in the fair value of a derivative depends on the intended use of the derivative and the resulting designation. For derivative instruments designated as a fair value hedge, the gain or loss is recognized in earnings in the period of change together with the offsetting loss or gain on the hedged item attributed to the risk being hedged. For a derivative instrument designated as a cash flow hedge, the effective portion of the derivative’s gain or loss is initially reported as a component of Accumulated other comprehensive loss in shareholders’ equity and subsequently reclassified into earnings when the hedged exposure affects earnings. The ineffective portion of the gain or loss is reported in earnings immediately.
For derivative instruments that are not designated as accounting hedges under the Derivatives and Hedging Topic of the Financial Accounting Standards Board (FASB guidance), changes in fair value are recognized in earnings in the period of change. We do not hold or issue derivative financial instruments for speculative trading purposes. We only enter into derivatives with one counterparty, which is among one of the largest U.S. banks (ranked by assets), in order to minimize credit risk and, to date, that counterparty has not failed to meet its financial obligations under such contracts.
| 46 |
HURCO COMPANIES, INC.
NOTES TO CONSOLIDATED FINANCIAL STATEMENTS – Continued
Derivatives Designated as Hedging Instruments
We enter into foreign currency forward exchange contracts periodically to hedge certain forecasted inter–company sales and purchases denominated in foreign currencies (the Pound Sterling, Euro and New Taiwan Dollar). The purpose of these instruments is to mitigate the risk that the U.S. Dollar net cash inflows and outflows resulting from sales and purchases denominated in foreign currencies will be adversely affected by changes in exchange rates. These forward contracts have been designated as cash flow hedge instruments, and are recorded in the Consolidated Balance Sheets at fair value in Derivative assets and Derivative liabilities. The effective portion of the gains and losses resulting from the changes in the fair value of these hedge contracts are deferred in Accumulated other comprehensive loss and recognized as an adjustment to Cost of sales and service in the period that the corresponding inventory sold that is the subject of the related hedge contract is recognized, thereby providing an offsetting economic impact against the corresponding change in the U.S. Dollar value of the inter–company sale or purchase being hedged. The ineffective portion of gains and losses resulting from the changes in the fair value of these hedge contracts is reported in Other expense, net immediately. We perform quarterly assessments of hedge effectiveness by verifying and documenting the critical terms of the hedge instrument and determining that forecasted transactions have not changed significantly. We also assess on a quarterly basis whether there have been adverse developments regarding the risk of a counterparty default.
We had forward contracts outstanding as of October 31, 2018, in Euros, Pounds Sterling and New Taiwan Dollars with set maturity dates ranging from November 2018 through October 2019. The contract amount at forward rates in U.S. Dollars at October 31, 2018 for Euros and Pounds Sterling was $32.9 million and $9.6 million, respectively. The contract amount at forward rates in U.S. Dollars for New Taiwan Dollars was $34.3 million at October 31, 2018. At October 31, 2018, we had approximately $156,000 of gains, net of tax, related to cash flow hedges deferred in Accumulated other comprehensive loss. Of this amount, $605,000 represented unrealized gains, net of tax, related to cash flow hedge instruments that remain subject to currency fluctuation risk. The majority of these deferred gains will be recorded as an adjustment to Cost of sales and service in periods through October 2019, in which the corresponding inventory that is the subject of the related hedge contract is sold, as described above.
We are exposed to foreign currency exchange risk related to our investment in net assets in foreign countries. To manage this risk, we entered into a forward contract with a notional amount of €3.0 million in November 2017. We designated this forward contract as a hedge of our net investment in Euro denominated assets. We selected the forward method under the FASB guidance related to the accounting for derivatives instruments and hedging activities. The forward method requires all changes in the fair value of the contract to be reported as a cumulative translation adjustment, net of tax, in Accumulated other comprehensive loss in the same manner as the underlying hedged net assets. This forward contract matured in November 2018 and we entered into a new forward contract for the same notional amount that is set to mature in November 2019. As of October 31, 2018, we had a realized gain of $652,000 and an unrealized gain of $153,000, net of tax, recorded as cumulative translation adjustments in Accumulated other comprehensive loss, related to these forward contracts.
Derivatives Not Designated as Hedging Instruments
We enter into foreign currency forward exchange contracts to protect against the effects of foreign currency fluctuations on receivables and payables denominated in foreign currencies. These derivative instruments are not designated as hedges under FASB guidance and, as a result, changes in their fair value are reported currently as Other expense, net in the Consolidated Statements of Income consistent with the transaction gain or loss on the related receivables and payables denominated in foreign currencies.
| 47 |
HURCO COMPANIES, INC.
NOTES TO CONSOLIDATED FINANCIAL STATEMENTS – Continued
We had forward contracts outstanding as of October 31, 2018, in Euros, South African Rand and New Taiwan Dollars with set maturity dates ranging from November 2018 through July 2019. The contract amounts at forward rates in U.S. Dollars at October 31, 2018 for Euros and South African Rand totaled $22.4 million. The contract amount at forward rates in U.S. Dollars for New Taiwan Dollars was $37.6 million at October 31, 2018.
Fair Value of Derivative Instruments
We recognize the fair value of derivative instruments as assets and liabilities on a gross basis on our Consolidated Balance Sheets. As of October 31, 2018 and October 31, 2017, all derivative instruments were recorded at fair value on the balance sheets as follows (in thousands):
| 2018 | 2017 | |||||||||||
| Balance Sheet | Fair | Balance Sheet | Fair | |||||||||
| Derivatives | Location | Value | Location | Value | ||||||||
| Designated as Hedging Instruments: | ||||||||||||
| Foreign exchange forward contracts | Derivative assets | $ | 2,654 | Derivative assets | $ | 305 | ||||||
| Foreign exchange forward contracts | Derivative liabilities | $ | 1,616 | Derivative liabilities | $ | 1,508 | ||||||
| Not Designated as Hedging Instruments: | ||||||||||||
| Foreign exchange forward contracts | Derivative assets | $ | 431 | Derivative assets | $ | 291 | ||||||
| Foreign exchange forward contracts | Derivative liabilities | $ | 404 | Derivative liabilities | $ | 224 | ||||||
Effect of Derivative Instruments on the Consolidated Balance Sheets, Statements of Changes in Shareholders’ Equity and Statements of Income
Derivative instruments had the following effects on our Consolidated Balance Sheets, Statements of Changes in Shareholders’ Equity and Statements of Income, net of tax, during the fiscal years ended October 31, 2018, 2017, and 2016 (in thousands):
| Amount of Gain (Loss) | Location of Gain (Loss) | Amount of Gain (Loss) | ||||||||||||||||||||||||
| Recognized in | Reclassified from | Reclassified from | ||||||||||||||||||||||||
| Other Comprehensive | Other Comprehensive | Other Comprehensive | ||||||||||||||||||||||||
| Derivatives | Income (Loss) | Income (Loss) | Income (Loss) | |||||||||||||||||||||||
| 2018 | 2017 | 2016 | 2018 | 2017 | 2016 | |||||||||||||||||||||
| Designated as Hedging Instruments: | ||||||||||||||||||||||||||
| (Effective Portion) | ||||||||||||||||||||||||||
| Foreign exchange forward contracts | Cost of sales | |||||||||||||||||||||||||
| – Intercompany sales/purchases | $ | 155 | $ | (709 | ) | $ | 1,431 | and service | $ | (1,355 | ) | $ | 1,354 | $ | 1,647 | |||||||||||
| Foreign exchange forward contract | ||||||||||||||||||||||||||
| – Net Investment | $ | 136 | $ | (96 | ) | $ | 28 | |||||||||||||||||||
We did not recognize any gains or losses as a result of hedges deemed ineffective during fiscal 2018. We recognized a gain of $18,000 during the fiscal year ended October 31, 2017 and a gain of $18,000 during the fiscal year ended October 31, 2016 as a result of contracts closed early that were deemed ineffective for financial reporting and did not qualify as cash flow hedges.
| 48 |
HURCO COMPANIES, INC.
NOTES TO CONSOLIDATED FINANCIAL STATEMENTS – Continued
We recognized the following gains and losses in our Consolidated Statements of Income during the fiscal years ended October 31, 2018, 2017, and 2016 on derivative instruments not designated as hedging instruments (in thousands):
| Location of Gain (Loss) | Amount of Gain (Loss) | |||||||||||||
| Derivatives | Recognized in Operations | Recognized in Operations | ||||||||||||
| 2018 | 2017 | 2016 | ||||||||||||
| Not Designated as Hedging Instruments: | ||||||||||||||
| Foreign exchange forward contracts | Other expense, net | $ | (963 | ) | $ | (1,001 | ) | $ | 536 | |||||
The following table presents the changes in the components of Accumulated other comprehensive loss, net of tax, for the fiscal years ended October 31, 2018 and 2017 (in thousands):
| Foreign | Cash | |||||||||||
| Currency | Flow | |||||||||||
| Translation | Hedges | Total | ||||||||||
| Balance, October 31, 2016 | $ | (12,325 | ) | $ | 1,282 | $ | (11,043 | ) | ||||
| Other comprehensive income (loss) before reclassifications | 4,916 | (709 | ) | 4,207 | ||||||||
| Reclassifications | – | (1,354 | ) | (1,354 | ) | |||||||
| Balance, October 31, 2017 | $ | (7,409 | ) | $ | (781 | ) | $ | (8,190 | ) | |||
| Other comprehensive income (loss) before reclassifications | (3,183 | ) | 155 | (3,028 | ) | |||||||
| Reclassifications | – | 1,355 | 1,355 | |||||||||
| Balance, October 31, 2018 | $ | (10,592 | ) | $ | 729 | $ | (9,863 | ) | ||||
Inventories. Inventories are stated at the lower of cost or net realizable value, with cost determined using the first–in, first–out method. Provisions are made to reduce excess or obsolete inventories to their estimated realizable value.
Property and Equipment. Property and equipment are carried at cost. Depreciation and amortization of assets are provided primarily under the straight–line method over the shorter of the estimated useful lives or the lease terms as follows:
| Number of Years | ||
| Land | Indefinite | |
| Building | 40 | |
| Machines | 7 – 10 | |
| Shop and office equipment | 3 – 7 | |
| Building & leasehold improvements | 3 – 40 |
Total depreciation and amortization expense recognized for property and equipment was $2.5 million for each of the fiscal years ended October 31, 2018, 2017 and 2016.
Revenue Recognition. We recognize revenue from sales of our machine tool systems upon delivery of the product to the customer or distributor, which is normally at the time of shipment, because persuasive evidence of an arrangement exists, delivery has occurred, the selling price is fixed and determinable and collectability is reasonably assured. Our computerized machine tools are general purpose computer controlled machine tools that are typically used in stand–alone operations. Transfer of ownership and risk of loss are not contingent upon contractual customer acceptance. Prior to shipment, we test each machine to ensure the machine’s compliance with standard operating specifications.
| 49 |
HURCO COMPANIES, INC.
NOTES TO CONSOLIDATED FINANCIAL STATEMENTS – Continued
Depending upon geographic location, after shipment, a machine may be installed at the customer’s facilities by a distributor, independent contractor or by one of our service technicians. In most instances where a machine is sold through a distributor, we have no installation involvement. If sales are direct or through sales agents, we will typically complete the machine installation, which consists of the reassembly of certain parts that were removed for shipping and the re–testing of the machine to ensure that it is performing within the standard specifications. We consider the machine installation process for our three–axis machines to be inconsequential and perfunctory. We allocate the transaction prices and recognize revenue associated with the installation process for our five–axis machines on a prorata basis over the period of the installation process.
Service fees from maintenance contracts are deferred and recognized in earnings on a prorata basis over the term of the contract, and are generally sold on a stand–alone basis.
Sales related to software upgrades are recognized when shipped in conformity with U.S. Generally Accepted Accounting Principles as promulgated by FASB guidance related to software revenue recognition that requires at the time of shipment, persuasive evidence of an arrangement exists, delivery has occurred, the selling price is fixed and determinable and collectability is reasonably assured. The software does not require production, modification or customization.
Allowance for Doubtful Accounts. The allowance for doubtful accounts is based on our best estimate of probable credit issues and historical experience. We perform credit evaluations of the financial condition of our customers. No collateral is required for sales made on open account terms. Concentrations of credit risk with respect to accounts receivable are limited due to the large number of customers comprising our customer base and their dispersion across many geographic areas. We consider trade accounts receivable to be past due when payment is not made by the due date as specified on the customer invoice, and we charge off uncollectible balances when all reasonable collection efforts have been exhausted.
Product Warranty. Expected future product warranty claims are recorded to expense when the product is sold. Product warranty estimates are established using historical information about the nature, frequency, and average cost of warranty claims. Warranty claims are influenced by factors such as new product introductions, technological developments, the competitive environment, and the costs of component parts. Actual payments for warranty claims could differ from the amounts estimated requiring adjustments to the liabilities in future periods. See Note 11 of Notes to Consolidated Financial Statements for further discussion of warranties.
Research and Development Costs. The costs associated with research and development programs for new products and significant product improvements, other than software development costs which are eligible for capitalization per FASB guidance, are expensed as incurred and are included in Selling, general and administrative expenses. Research and development expenses totaled $4.7 million, $4.2 million, and $4.9 million, in fiscal 2018, 2017, and 2016, respectively.
Software Development Costs. We sell software products that are essential to our machine tools. Costs incurred to develop computer software products and significant enhancements to software features of existing products to be sold or otherwise marketed are capitalized, after technological feasibility is established. Software development costs are amortized on a straight–line basis over the estimated product life of the related software, which ranges from three to five years. We capitalized costs of $2.3 million in fiscal 2018, $2.3 million in fiscal 2017, and $2.2 million in fiscal 2016 related to software development projects. Amortization expense for software development costs was $1.1 million, $1.0 million, and $1.2 million, for the fiscal years ended October 31, 2018, 2017, and 2016, respectively. Accumulated amortization at October 31, 2018 and 2017 was $18.5 million and $17.4 million, respectively.
| 50 |
HURCO COMPANIES, INC.
NOTES TO CONSOLIDATED FINANCIAL STATEMENTS – Continued
Estimated amortization expense for the remaining unamortized software development costs for the fiscal years ending October 31, is as follows (in thousands):
| Fiscal Year | Amortization Expense | |
| 2019 | 1,000 | |
| 2020 | 1,300 | |
| 2021 | 1,500 | |
| 2022 | 1,400 | |
| 2023 | 1,050 |
Goodwill and Intangible Assets. Goodwill and indefinite-lived intangibles arising from a business combination are not amortized and charged to expense over time. Instead, goodwill and indefinite-lived intangibles must be reviewed annually for impairment, or more frequently, if circumstances arise indicating potential impairment. This impairment review was most recently completed as of July 31, 2018. For goodwill, if the carrying amount of the reporting unit containing the goodwill exceeds the fair value of that reporting unit, an impairment loss is recognized to the extent the “implied fair value” of the reporting unit goodwill is less than the carrying amount of the goodwill. For indefinite-lived intangible assets, if the carrying amount exceeds the fair value, an impairment loss is recognized in an amount equal to that excess. Intangible assets that are determined to have a finite life are amortized over their estimated useful lives and are also subject to review for impairment, if indicators of impairment are identified.
There were no impairments recognized with respect to the carrying value of goodwill or intangible assets for the years ended October 31, 2018, 2017 or 2016.
As of October 31, 2018, the balances of intangible assets, other than goodwill, were as follows (in thousands):
| Weighted Average Amortization Period | Gross Intangible Assets | Accumulated Amortization | Net Intangible Assets | |||||||||||
| Tradenames and trademarks | indefinite | $ | 60 | $ | – | $ | 60 | |||||||
| Tradenames and trademarks | 13 years | 238 | (98 | ) | 140 | |||||||||
| Customer relationships | 15 years | 255 | (148 | ) | 107 | |||||||||
| Technology | 13 years | 692 | (284 | ) | 408 | |||||||||
| Patents | 6 years | 2,973 | (2,790 | ) | 183 | |||||||||
| Other | 8 years | 377 | (337 | ) | 40 | |||||||||
| Total | $ | 4,595 | $ | (3,657 | ) | $ | 938 | |||||||
As of October 31, 2017, the balances of intangible assets, other than goodwill, were as follows (in thousands):
| Weighted Average Amortization Period | Gross Intangible Assets | Accumulated Amortization | Net Intangible Assets | |||||||||||
| Tradenames and trademarks | indefinite | $ | 60 | $ | – | $ | 60 | |||||||
| Tradenames and trademarks | 13 years | 245 | (81 | ) | 164 | |||||||||
| Customer relationships | 15 years | 257 | (132 | ) | 125 | |||||||||
| Technology | 13 years | 713 | (239 | ) | 474 | |||||||||
| Patents | 6 years | 2,973 | (2,765 | ) | 208 | |||||||||
| Other | 8 years | 378 | (333 | ) | 45 | |||||||||
| Total | $ | 4,626 | $ | (3,550 | ) | $ | 1,076 | |||||||
| 51 |
HURCO COMPANIES, INC.
NOTES TO CONSOLIDATED FINANCIAL STATEMENTS – Continued
Intangible asset amortization expense was $107,000, $136,000, and $137,000 for fiscal 2018, 2017 and 2016, respectively. Annual intangible asset amortization expense is estimated to be $117,000 per year for fiscal years 2019 through 2023.
Impairment of Long–Lived Assets. Annually, or when there are indicators of impairment, we evaluate the carrying value of long–lived assets to be held and used, including property and equipment, software development costs and intangible assets, including goodwill, when events or circumstances warrant such a review. The carrying value of a long–lived asset (or group of assets) to be held and used is considered impaired when the anticipated separately identifiable undiscounted cash flows from such an asset (or group of assets) are less than the carrying value of the asset (or group of assets) in accordance with FASB guidance related to accounting for the impairment or disposal of long–lived assets.
Earnings Per Share. Basic earnings per share is calculated by dividing net income by the weighted–average number of common shares actually outstanding during the period. Diluted earnings per share assumes the issuance of additional shares of common stock upon exercise of all outstanding stock options and contingently issuable securities if the effect is dilutive, in accordance with the treasury stock method discussed in FASB guidance on “Earnings Per Share.”
The following table presents a reconciliation of our basic and diluted earnings per share computation:
| Fiscal Year Ended October 31, | ||||||||||||||||||||||||
| (in thousands, except per share amounts) | 2018 | 2017 | 2016 | |||||||||||||||||||||
| Basic | Diluted | Basic | Diluted | Basic | Diluted | |||||||||||||||||||
| Net income | $ | 21,490 | $ | 21,490 | $ | 15,115 | $ | 15,115 | $ | 13,292 | $ | 13,292 | ||||||||||||
| Undistributed earnings allocated to participating shares | (132 | ) | (132 | ) | (100 | ) | (100 | ) | (76 | ) | (76 | ) | ||||||||||||
| Net income applicable to common Shareholders | $ | 21,358 | $ | 21,358 | $ | 15,015 | $ | 15,015 | $ | 13,216 | $ | 13,216 | ||||||||||||
| Weighted average shares outstanding | 6,700 | 6,700 | 6,615 | 6,615 | 6,569 | 6,569 | ||||||||||||||||||
| Stock options and contingently issuable securities | – | 71 | – | 65 | – | 73 | ||||||||||||||||||
| 6,700 | 6,771 | 6,615 | 6,680 | 6,569 | 6,642 | |||||||||||||||||||
| Income per share | $ | 3.19 | $ | 3.15 | $ | 2.27 | $ | 2.25 | $ | 2.01 | $ | 1.99 | ||||||||||||
Income Taxes – We account for income taxes and the related accounts under the asset and liability method. Deferred tax assets and liabilities are measured using enacted income tax rates in each jurisdiction in effect for the year in which the temporary differences are expected to be recovered or settled. These deferred tax assets are reduced by a valuation allowance, which is established when it is more likely than not that some portion or all of the deferred tax assets will not be realized. Our judgment regarding the realization of deferred tax assets may change due to future profitability and market conditions, changes in U.S. or foreign tax laws and other factors. These changes, if any, may require material adjustments to these deferred tax assets and an accompanying reduction or increase in net income in the period when such determinations are made.
The determination of our provision for income taxes requires judgment, the use of estimates and the interpretation and application of complex tax laws. Our provision for income taxes reflects a combination of income earned and taxed at the federal and state level in the U.S., as well as in various foreign jurisdictions.
In December 2017, the Tax Cuts and Jobs Act (the “Tax Reform Act”) was enacted. The Tax Reform Act, among other things, lowered the U.S. corporate tax rate from 35% to 21%, implemented a territorial tax system from a worldwide system and imposed a one–time tax on deemed repatriation of earnings of foreign subsidiaries.
| 52 |
HURCO COMPANIES, INC.
NOTES TO CONSOLIDATED FINANCIAL STATEMENTS – Continued
As a result of the reduction in the federal corporate income tax rate, we were required to revalue our net deferred tax asset to account for the future impact of lower corporate tax rates on this deferred amount and record any change in the value of such asset as a one–time non–cash charge on its income statement. This resulted in additional expense of $0.6 million. Additionally, the Tax Reform Act required a transition tax on any net accumulated earnings and profits generated by foreign subsidiaries as of the two required measurement dates, November 2, 2017 and December 31, 2017 while providing for future tax–free repatriation of such earnings through a 100% dividends–received deduction. This resulted in a one–time transition tax on the deemed repatriation of net accumulated foreign earnings and profits of $2.2 million, for a total impact of $2.8 million. As such, as of December 31, 2017, all of the Company’s accumulated earnings and profits are deemed repatriated. We have not provided for any U.S. income taxes on the undistributed earnings of our foreign subsidiaries beginning January 1, 2018 based upon our determination that such earnings will be indefinitely reinvested abroad.
In addition to the risks to the effective tax rate described above, the future effective tax rate reflected in forward–looking statements is based on currently effective tax laws. Significant changes in those laws could materially affect these estimates.
We recognize uncertain tax positions when it is more likely than not that the tax position will be sustained upon examination by relevant taxing authorities, based on the technical merits of the position. The amount recognized is measured as the largest amount of benefit that is greater than 50 percent likely of being realized upon ultimate settlement.
Stock Compensation. We account for share–based compensation according to FASB guidance relating to share–based payments, which requires the measurement and recognition of compensation expense for all share–based awards made to employees and directors based on estimated fair values on the grant date. This guidance requires that we estimate the fair value of share–based awards on the date of grant and recognize as expense the value of the portion of the award that is ultimately expected to vest over the requisite service period.
Estimates. The preparation of financial statements in conformity with U.S. Generally Accepted Accounting Principles requires us to make estimates and assumptions that affect the reported amounts presented and disclosed in our consolidated financial statements. Significant estimates and assumptions in these consolidated financial statements require the exercise of judgment and are used for, but not limited to, allowance for doubtful accounts, estimates of future cash flows and other assumptions associated with goodwill, intangible and long–lived asset impairment tests, useful lives for depreciation and amortization, warranty programs, stock compensation, income taxes and deferred tax valuation allowances, and contingencies. Due to the inherent uncertainty involved in making estimates, actual results reported in future periods may be different from these estimates.
| 2. | BUSINESS OPERATIONS |
Nature of Business. We design, manufacture and sell computerized CNC machine tools, computer control systems and software products, machine tool components, software options, control upgrades, accessories and replacement parts for our products, as well as customer service and training and applications support, to companies in the metal cutting industry through a worldwide sales, service and distribution network. The machine tool industry is highly cyclical and changes in demand can occur abruptly in the geographic markets we serve. As a result of this cyclicality, we have experienced significant fluctuations in our sales, which, in periods of reduced demand, have adversely affected our results of operations and financial condition.
| 53 |
HURCO COMPANIES, INC.
NOTES TO CONSOLIDATED FINANCIAL STATEMENTS – Continued
The end market for our products consists primarily of precision tool, die and mold manufacturers, independent job shops, and specialized short–run production applications within large manufacturing operations. Industries served include: aerospace, defense, medical equipment, energy, automotive/transportation, electronics and computer industries. Our products are sold principally through more than 173 independent agents and distributors throughout the Americas, Europe and Asia. We also have our own direct sales and service organizations in China, France, Germany, India, Italy, Poland, Singapore, South Africa, Taiwan, the United Kingdom, and certain areas of the United States.
Credit Risk. We sell products to customers located throughout the world. We perform ongoing credit evaluations of customers and generally do not require collateral. Allowances are maintained for potential credit losses. Concentration of credit risk with respect to trade accounts receivable is limited due to the large number of customers and their dispersion across many geographic areas. Although a significant amount of trade receivables are with distributors primarily located in the United States, no single distributor or region represents a significant concentration of credit risk.
Manufacturing Risk. At present, our wholly–owned subsidiaries, Hurco Manufacturing Limited (“HML”), Ningbo Hurco Machine Tool Co., Ltd. (“NHML”) and Milltronics USA, Inc. (“Milltronics”) produce the vast majority of our machine tools for all three brands, Hurco, Milltronics and Takumi. In addition, we manufacture electro–mechanical components and accessories for machine tools through our wholly–owned subsidiary, LCM Precision Technology S.r.l. (“LCM”). HML, NHML, Milltronics and LCM manufacture their products in Taiwan, China, the U.S. and Italy, respectively. Any interruption in manufacturing at any of these locations would have an adverse effect on our financial operating results. Interruption in manufacturing at one of these locations could result from a change in the political environment or a natural disaster, such as trade wars or tariffs, or an earthquake, typhoon, or tsunami. Any interruption with one of our key suppliers may also have an adverse effect on our operating results and our financial condition.
| 3. | INVENTORIES |
Inventories as of October 31, 2018 and 2017 are summarized below (in thousands):
| 2018 | 2017 | |||||||
| Purchased parts and sub–assemblies | $ | 38,303 | $ | 33,045 | ||||
| Work–in–process | 22,786 | 20,008 | ||||||
| Finished goods | 76,520 | 66,895 | ||||||
| $ | 137,609 | $ | 119,948 | |||||
Finished goods inventory consigned to our distributors and agents throughout the Americas, Europe and Asia was $9.9 million and $12.1 million as of October 31, 2018 and 2017, respectively.
| 4. | CREDIT AGREEMENTS AND BORROWINGS |
On December 7, 2012, we entered into an agreement, which was subsequently amended on May 9, 2014, June 5, 2014, December 5, 2014 and December 6, 2016 (as amended, the “2012 Credit Agreement”) with JP Morgan Chase Bank, N.A. that provided us with an unsecured revolving credit and letter of credit facility. The 2012 Credit Agreement contained customary financial covenants, including covenants (1) restricting us from making certain investments, loans, advances and acquisitions (but permitting us to make investments in subsidiaries of up to $5.0 million), (2) requiring that we maintain a minimum working capital, and (3) requiring that we maintain a minimum tangible net worth. The 2012 Credit Agreement permitted us to pay certain cash dividends, so long as we were not in default under the 2012 Credit Agreement before and after giving effect to such dividends.
| 54 |
HURCO COMPANIES, INC.
NOTES TO CONSOLIDATED FINANCIAL STATEMENTS – Continued
Borrowings under our 2012 Credit Agreement bore interest either at a LIBOR–based rate or a floating rate, in each case with an interest rate floor of 0.00%. The floating rate equaled the greatest of (a) a one month LIBOR–based rate plus 1.00% per annum, (b) the federal funds effective rate plus 0.50% per annum, (c) the prevailing prime rate and (d) 0.00%. The rate we paid for that portion of the 2012 Credit Agreement which was not utilized is 0.05% per annum.
On December 6, 2016, we entered into a fourth amendment to our 2012 Credit Agreement to, among other things, increase the unsecured revolving credit facility from $12.5 million to $15.0 million, to increase the cash dividend allowance from $4.0 million per calendar year to $5.0 million per calendar year, and to extend the scheduled maturity date to December 31, 2018. The 2012 Credit Agreement, as amended, provided for the issuance of up to $5.0 million in letters of credit. We also amended the 2012 Credit Agreement to increase the minimum working capital and minimum tangible net worth requirements from $90.0 million to $105.0 million and $120.0 million to $125.0 million, respectively.
As of October 31, 2018, we had a £1.0 million revolving credit facility in the United Kingdom and a €1.5 million revolving credit facility in Germany. On February 16, 2017, we amended our credit facility in China to decrease the credit facility from 40.0 million Chinese Yuan to 20.0 million Chinese Yuan (approximately $2.9 million). On February 14, 2018, we renewed this facility with an expiration date of February 13, 2019. We had $1.4 million and $1.5 million of borrowings under our China credit facility as of October 31, 2018 and 2017, respectively. We had no other debt or borrowings under any of our other credit facilities at either of those dates. At October 31, 2018, we had $19.4 million of available borrowing capacity under our credit facilities in effect on that date.
Effective as of December 31, 2018, we and our subsidiary Hurco B.V. entered into a new credit agreement (the “2018 Credit Agreement”) with Bank of America, N.A., as the lender. The 2018 Credit Agreement replaced the 2012 Credit Agreement, which terminated on December 31, 2018. The 2018 Credit Agreement provides for an unsecured revolving credit and letter of credit facility in a maximum aggregate amount of $40.0 million. The 2018 Credit Agreement provides that the maximum amount of outstanding letters of credit at any one time may not exceed $10.0 million, the maximum amount of outstanding loans made to our subsidiary Hurco B.V. at any one time may not exceed $20.0 million, and the maximum amount of all outstanding loans denominated in alternative currencies at any one time may not exceed $20.0 million.
Under the 2018 Credit Agreement, we and Hurco B.V. are borrowers, and certain of our other subsidiaries are guarantors. The scheduled maturity date of the 2018 Credit Agreement is December 31, 2020.
Borrowings under the 2018 Credit Agreement will bear interest at floating rates based on, at our option, either (i) a LIBOR–based rate, or other alternative currency–based rate approved by the lender, plus 0.75% per annum, or (ii) a base rate (which is the highest of (a) the federal funds rate plus 0.50%, (b) the prime rate or (c) the one month LIBOR–based rate plus 1.00%), plus 0.00% per annum. Outstanding letters of credit will carry an annual rate of 0.75%.
The 2018 Credit Agreement contains customary affirmative and negative covenants and events of default, including covenants (1) restricting us from making certain investments, loans, advances and acquisitions (but permitting us to make investments in subsidiaries of up to $10.0 million); (2) restricting us from making certain payments, including cash dividends, except that we may pay cash dividends as long as immediately before and after giving effect to such payment, the sum of the unused amount of the commitments under the 2018 Credit Agreement plus our cash on hand is not less than $10.0 million, and as long as we are not in default before and after giving effect to such dividend payments; (3) requiring that we maintain a minimum working capital of $125.0 million; and (4) requiring that we maintain a minimum tangible net worth of $170.0 million.
| 55 |
HURCO COMPANIES, INC.
NOTES TO CONSOLIDATED FINANCIAL STATEMENTS – Continued
We may use the proceeds from advances under the 2018 Credit Agreement for general corporate purposes.
In December 2018, in connection with our entry into the 2018 Credit Agreement, (1) using cash on hand, we repaid in full the $1.4 million outstanding under, and terminated, the China credit facility and (2) we terminated our United Kingdom credit facility. As of December 31, 2018, we retained the €1.5 million revolving credit facility in Germany and the $40 million revolving credit facility under 2018 Credit Agreement. As of December 31, 2018, there were no borrowings under any of our credit facilities and $41.7 million of available borrowing capacity thereunder.
| 5. | FINANCIAL INSTRUMENTS |
Estimated Fair Value of Financial Instruments
FASB fair value guidance establishes a three–tier fair value hierarchy, which categorizes the inputs used in measuring fair value. These tiers include: Level 1, defined as observable inputs, such as quoted prices in active markets; Level 2, defined as inputs other than quoted prices in active markets that are either directly or indirectly observable; and Level 3, defined as unobservable inputs for which little or no market data exists, therefore requiring an entity to develop its own assumptions.
The carrying amounts for cash and cash equivalents approximate their fair values due to the short maturity of these instruments, and such instruments meet the Level 1 criteria of the three–tier fair value hierarchy discussed above. The carrying amount of short–term debt approximates fair value due to the variable rate of the interest and the short term nature of the instrument.
In accordance with this guidance, the following table represents the fair value hierarchy for our financial assets and liabilities measured at fair value as of October 31, 2018 and 2017 (in thousands):
| Assets | Liabilities | |||||||||||||||
| October 31, | October 31, | October 31, | October 31, | |||||||||||||
| 2018 | 2017 | 2018 | 2017 | |||||||||||||
| Level 1 | ||||||||||||||||
| Deferred compensation | $ | 1,723 | $ | 1,638 | $ | – | $ | – | ||||||||
| Level 2 | ||||||||||||||||
| Derivatives | $ | 3,085 | $ | 596 | $ | 2,020 | $ | 1,732 | ||||||||
Recurring Fair Value Measurements
Included in Level 1 assets are mutual fund investments under a nonqualified deferred compensation plan. We estimate the fair value of these investments on a recurring basis using market prices which are readily available.
Included as Level 2 fair value measurements are derivative assets and liabilities related to gains and losses on foreign currency forward exchange contracts entered into with a third party. We estimate the fair value of these derivatives on a recurring basis using foreign currency exchange rates obtained from active markets. Derivative instruments are reported in the accompanying consolidated financial statements at fair value. We have derivative financial instruments in the form of foreign currency forward exchange contracts as described in Note 1 of Notes
| 56 |
HURCO COMPANIES, INC.
NOTES TO CONSOLIDATED FINANCIAL STATEMENTS – Continued
to Consolidated Financial Statements in which the U.S. Dollar equivalent notional amount of these contracts was $145.2 million and $134.3 million at October 31, 2018 and 2017, respectively.
The fair value of the foreign currency forward exchange contracts and the related currency positions are subject to offsetting market risk resulting from foreign currency exchange rate volatility. The counterparty to the forward exchange contract is a substantial and creditworthy financial institution. We do not consider either the risk of counterparty non–performance or the economic consequences of counterparty non–performance as material risks.
| 6. | INCOME TAXES |
In December 2017, the Tax Reform Act was enacted. The Tax Reform Act, among other things, lowered the U.S. corporate tax rate from 35% to 21%, implemented a territorial tax system from a worldwide system and imposed a one–time tax on deemed repatriation of accumulated earnings and profits of foreign subsidiaries. In fiscal 2018, our U.S. taxable income was taxed at a 23% federal tax rate; thereafter, the 21% rate will apply. During fiscal 2018, we revalued our deferred tax assets to the lower statutory rate of 21%, which resulted in expense of $596,000. The transition tax, required by the Tax Reform Act was also recorded in fiscal 2018 based on current guidance and available information, adding $2.2 million to income tax expense. The transition tax is eligible to be paid in unequal installments over 8 years. We plan to make that election.
On December 22, 2017, the United States Securities and Exchange Commission (“SEC”) issued Staff Accounting Bulletin No. 118 (“SAB 118”), which provides guidance on accounting for the tax effects of the Tax Reform Act. In accordance with ASC Topic 740, Income Taxes, SAB 118 and available guidance from the SEC, FASB and the U.S. Treasury Department as of October 31, 2018, we have completed our accounting for the income tax effects of the Tax Reform Act with the exception of the provisions related to Global Intangible Low Taxed Income (“GILTI”) and Foreign Derived Intangible Income (“FDII”).
In the fiscal years set forth below, the provision for income taxes consisted of the following (in thousands):
| Year Ended October 31, | ||||||||||||
| 2018 | 2017 | 2016 | ||||||||||
| Current: | ||||||||||||
| U.S. taxes | $ | 6,333 | $ | 308 | $ | 1,362 | ||||||
| Foreign taxes | 5,203 | 4,185 | 4,456 | |||||||||
| 11,536 | 4,493 | 5,818 | ||||||||||
| Deferred: | ||||||||||||
| U.S. taxes | (326 | ) | 1,236 | (176 | ) | |||||||
| Foreign taxes | (204 | ) | (128 | ) | (49 | ) | ||||||
| (530 | ) | 1,108 | (225 | ) | ||||||||
| $ | 11,006 | $ | 5,601 | $ | 5,593 | |||||||
| 57 |
HURCO COMPANIES, INC.
NOTES TO CONSOLIDATED FINANCIAL STATEMENTS – Continued
A comparison of income tax expense at the U.S. statutory rate to the Company’s effective tax rate is as follows (dollars in thousands):
| Year Ended October 31, | ||||||||||||
| 2018 | 2017 | 2016 | ||||||||||
| Income before income taxes: | ||||||||||||
| Domestic | $ | 14,101 | $ | 5,477 | $ | 2,703 | ||||||
| Foreign | 18,395 | 15,239 | 16,182 | |||||||||
| $ | 32,496 | $ | 20,716 | $ | 18,885 | |||||||
| Tax rates: | ||||||||||||
| U.S. statutory rate | 23 | % | 34 | % | 34 | % | ||||||
| Effect of tax rate of international jurisdictions different than U.S. statutory rates | 2 | % | (5 | )% | (7 | )% | ||||||
| Valuation allowance | 0 | % | 1 | % | 3 | % | ||||||
| State taxes | 0 | % | 0 | % | 0 | % | ||||||
| Tax Credits | (1 | )% | (3 | )% | (2 | )% | ||||||
| Effect of Tax Rate Changes | 4 | % | 0 | % | 4 | % | ||||||
| Transition Tax | 7 | % | 0 | % | 0 | % | ||||||
| Other | (1 | )% | 0 | % | (2 | )% | ||||||
| Effective tax rate | 34 | % | 27 | % | 30 | % | ||||||
We have not provided for any U.S. income taxes on the undistributed earnings of our foreign subsidiaries beginning January 1, 2018 based upon our determination that such earnings will be indefinitely reinvested abroad. Additionally, the Tax Reform Act required a transition tax on any net accumulated earnings and profits generated by foreign subsidiaries as of the two required measurement dates, November 2, 2017 and December 31, 2017 while providing for future tax–free repatriation of such earnings through a 100% dividends–received deduction. As such, as of December 31, 2017, all of the Company’s accumulated earnings and profits were deemed repatriated.
Deferred income taxes are determined based on the difference between the amounts used for financial reporting purposes and tax bases of assets and liabilities using enacted tax rates in effect for the year in which the differences are expected to reverse. Deferred taxes are adjusted for changes in tax rates and tax laws when changes are enacted. Valuation allowances are recorded to reduce deferred tax assets when it is more likely than not that a tax benefit will not be realized.
As of October 31, 2018, we had deferred tax assets established for accumulated net operating loss carryforwards of $1.3 million, primarily related to state and foreign jurisdictions. We also have deferred tax assets for research and development tax credits of $0.7 million. We have established a valuation allowance against some of these carryforwards due to the uncertainty of their full realization. As of October 31, 2018 and 2017, the balance of this valuation allowance was $2.1 million and $2.3 million, respectively.
| 58 |
HURCO COMPANIES, INC.
NOTES TO CONSOLIDATED FINANCIAL STATEMENTS – Continued
Significant components of our deferred tax assets and liabilities at October 31, 2018 and 2017 were as follows (in thousands):
| October 31, | ||||||||
| 2018 | 2017 | |||||||
| Deferred Tax Assets: | ||||||||
| Accrued inventory reserves | $ | 1,325 | $ | 1,965 | ||||
| Accrued warranty expenses | 499 | 438 | ||||||
| Compensation related expenses | 2,644 | 2,952 | ||||||
| Net derivative instruments | – | 417 | ||||||
| Unrealized exchange gain/loss | 159 | – | ||||||
| Other accrued expenses | 170 | 187 | ||||||
| Net operating loss carryforwards | 1,316 | 1,722 | ||||||
| Other credit carryforwards | 686 | 517 | ||||||
| Other | 350 | 404 | ||||||
| 7,149 | 8,602 | |||||||
| Less: Valuation allowance – net operating loss and other credit carryforwards | (2,106 | ) | (2,282 | ) | ||||
| Deferred tax assets | 5,043 | 6,320 | ||||||
| Deferred Tax Liabilities: | ||||||||
| Net derivative instruments | (208 | ) | – | |||||
| Property and equipment and capitalized software development costs | (2,370 | ) | (3,241 | ) | ||||
| Unrealized exchange gain/loss | – | (116 | ) | |||||
| Other | (231 | ) | (624 | ) | ||||
| Net deferred tax assets | $ | 2,234 | $ | 2,339 | ||||
As of October 31, 2018, we had net operating losses carryforwards for international and U.S. income tax purposes of $6.1 million, of which $4.9 million will expire within 5 years beginning in fiscal 2019 and $1.2 million will expire between 5 and 20 years. We also had tax credits of $870,000 which will expire between years 2022 and 2029.
A reconciliation of the beginning and ending amount of unrecognized tax benefits, excluding the related accrual for interest or penalties, is as follows (in thousands):
| 2018 | 2017 | 2016 | ||||||||||
| Balance, beginning of year | $ | 1,101 | $ | 1,102 | $ | 1,034 | ||||||
| Additions based on tax positions related to the current year | 37 | 37 | 52 | |||||||||
| Additions (reductions) related to prior year tax positions | (945 | ) | (20 | ) | 19 | |||||||
| Reductions due to statute expiration | (18 | ) | (74 | ) | – | |||||||
| Other | 5 | 56 | (3 | ) | ||||||||
| Balance, end of year | $ | 180 | $ | 1,101 | $ | 1,102 | ||||||
The entire balance of the unrecognized tax benefits and related interest at October 31, 2018, if recognized, could affect the effective tax rate in future periods.
We recognize accrued interest and penalties related to unrecognized tax benefits as components of our income tax provision. As of October 31, 2018, the amount of interest accrued, reported in other liabilities, was approximately $25,000, which did not include the federal tax benefit of interest deductions. The statute of limitations with respect to unrecognized tax benefits will expire between July 2019 and July 2022.
| 59 |
HURCO COMPANIES, INC.
NOTES TO CONSOLIDATED FINANCIAL STATEMENTS – Continued
We file income tax returns in the U.S. federal jurisdiction and various states, local, and non–U.S. jurisdictions. Currently, our Germany subsidiary is under tax audit for the fiscal year 2013 to 2016.
A summary of open tax years by major jurisdiction is presented below:
| United States federal | Fiscal 2015 through the current period | |
| Germany¹ | Fiscal 2013 through the current period | |
| Taiwan | Fiscal 2015 through the current period |
¹ Includes federal as well as state, provincial or similar local jurisdictions, as applicable.
| 7. | EMPLOYEE BENEFITS |
We have defined contribution plans that include a majority of our employees, under which our matching contributions are primarily discretionary. The purpose of these plans is generally to provide additional financial security during retirement by providing employees with an incentive to save throughout their employment. Our contributions and related expense totaled $1.2 million, $1.1 million, and $1.1 million, for the fiscal years ended October 31, 2018, 2017 and 2016, respectively.
| 8. | STOCK–BASED COMPENSATION |
In March 2016, we adopted the Hurco Companies, Inc. 2016 Equity Incentive Plan (the “2016 Equity Plan”), which allows us to grant awards of stock options, stock appreciation rights, restricted stock, stock units and other stock–based awards. The 2016 Equity Plan replaced the Hurco Companies, Inc. 2008 Equity Incentive Plan (the “2008 Plan”) and is the only active plan under which equity awards may be made by us to our employees and non–employee directors. No further awards will be made under our 2008 Plan. The total number of shares of our common stock that may be issued pursuant to awards under the 2016 Equity Plan is 856,048, which includes 386,048 shares remaining available for future grants under the 2008 Plan as of March 10, 2016, the date our shareholders approved the 2016 Equity Plan.
The Compensation Committee of our Board of Directors has the authority to determine the officers, directors and key employees who will be granted awards under the 2016 Equity Plan; designate the number of shares subject to each award; determine the terms and conditions upon which awards will be granted; and prescribe the form and terms of award agreements. We have granted restricted shares and performance units under the 2016 Equity Plan that are currently outstanding, and we have granted stock options, restricted shares and performance shares under the 2008 Plan that are currently outstanding. No stock option may be exercised more than ten years after the date of grant or such shorter period as the Compensation Committee may determine at the date of grant. The market value of a share of our common stock, for purposes of the 2016 Equity Plan, is the closing sale price as reported by the Nasdaq Global Select Market on the date in question or, if not a trading day, on the last preceding trading date.
| 60 |
HURCO COMPANIES, INC.
NOTES TO CONSOLIDATED FINANCIAL STATEMENTS – Continued
A summary of the status of the options as of October 31, 2018, 2017 and 2016 and the related activity for the year is as follows:
| Shares Under | Weighted Average Grant | |||||||
| Option | Date Fair Value | |||||||
| Balance October 31, 2015 | 107,889 | $ | 20.25 | |||||
| Granted | – | – | ||||||
| Cancelled | – | – | ||||||
| Expired | – | – | ||||||
| Exercised | – | – | ||||||
| Balance October 31, 2016 | 107,889 | $ | 20.25 | |||||
| Granted | – | – | ||||||
| Cancelled | – | – | ||||||
| Expired | – | – | ||||||
| Exercised | (29,164 | ) | $ | 18.31 | ||||
| Balance October 31, 2017 | 78,725 | $ | 20.97 | |||||
| Granted | – | – | ||||||
| Cancelled | – | – | ||||||
| Expired | – | – | ||||||
| Exercised | (41,680 | ) | $ | 20.33 | ||||
| Balance October 31, 2018 | 37,045 | $ | 21.69 | |||||
The total intrinsic value of stock options exercised during the twelve months ended October 31, 2018, 2017 and 2016 was approximately $847,000, $771,000 and $0, respectively.
As of October 31, 2018, the total intrinsic value of outstanding stock options already vested and the intrinsic value of options that are outstanding and exercisable was $706,000. Stock options outstanding and exercisable on October 31, 2018, were as follows:
| Range of Exercise Prices Per Share | Shares Under Option | Weighted Average Exercise Price Per Share | Weighted Average Remaining Contractual Life in Years | |||||||||||
| Outstanding and Exercisable | ||||||||||||||
| 18.13 | 3,738 | 18.13 | 1.5 | |||||||||||
| 21.45 | 21,748 | 21.45 | 3.1 | |||||||||||
| 23.30 | 11,559 | 23.30 | 4.1 | |||||||||||
| $ | 18.13 – 23.30 | 37,045 | $ | 21.69 | 3.3 | |||||||||
On March 15, 2018, the Compensation Committee granted a total of 9,114 shares of time–based restricted stock to our non–employee directors. The restricted shares vest in full one year from the date of grant provided the recipient remains on the board of directors through that date. The grant date fair value of the restricted shares was based on the closing sales price of our common stock on the grant date, which was $46.05 per share.
On January 3, 2018, the Compensation Committee determined the degree to which the long–term incentive compensation arrangement approved for the fiscal 2015–2017 performance period was attained, and the resulting payout level relative to the target amount for each of the metrics that were established by the Compensation Committee in 2015. As a result, the Compensation Committee determined that a total of 23,299 performance shares were earned by our executive officers, which performance shares vested on January 3, 2018. The vesting date fair value of the performance shares was based on the closing sales price of our common stock on the vesting date, which was $42.20 per share. All related stock–based compensation cost for these vested performance shares was expensed accordingly during the three–year performance period ended October 31, 2017.
| 61 |
HURCO COMPANIES, INC.
NOTES TO CONSOLIDATED FINANCIAL STATEMENTS – Continued
On January 3, 2018, the Compensation Committee also approved a long–term incentive compensation arrangement for our executive officers in the form of restricted shares and performance stock units (“PSUs”) under the 2016 Equity Plan, which will be payable in shares of our common stock if earned and vested. The awards were 25% time–based vesting and 75% performance–based vesting. The three–year performance period for the PSUs is fiscal 2018 through fiscal 2020.
On that date, the Compensation Committee granted a total of 14,810 shares of time–based restricted stock to our executive officers. The restricted shares vest in thirds over three years from the date of grant provided the recipient remains employed through that date. The grant date fair value of the restricted shares was based upon the closing sales price of our common stock on the date of grant, which was $42.20 per share.
On January 3, 2018, the Compensation Committee also granted a total target number of 21,891 PSUs to our executive officers designated as “PSU – TSR”. These PSUs were weighted as approximately 40% of the overall 2018 executive long–term incentive compensation arrangement and will vest and be paid based upon the total shareholder return of our common stock over the three–year period of fiscal 2018–2020, relative to the total shareholder return of the companies in a specified peer group over that period. Participants will have the ability to earn between 50% of the target number of the PSUs – TSR for achieving threshold performance and 200% of the target number of the PSUs – TSR for achieving maximum performance. The grant date fair value of the PSUs – TSR was $45.68 per PSU and was calculated using the Monte Carlo approach.
On January 3, 2018, the Compensation Committee also granted a total target number of 20,734 PSUs to our executive officers designated as “PSU – ROIC”. These PSUs were weighted as approximately 35% of the overall 2018 executive long–term incentive compensation arrangement and will vest and be paid based upon the achievement of pre–established goals related to our average return on invested capital over the three–year period of fiscal 2018–2020. Participants will have the ability to earn between 50% of the target number of the PSUs –ROIC for achieving threshold performance and 200% of the target number of the PSUs – ROIC for achieving maximum performance. The grant date fair value of the PSUs – ROIC was based on the closing sales price of our common stock on the grant date, which was $42.20 per share.
On November 15, 2017, the Compensation Committee granted a total of 2,364 shares of time–based restricted stock to our non–executive employees. The restricted shares vest in thirds over three years from the date of grant provided the recipient remains employed through that date. The grant date fair value of the restricted shares was based upon the closing sales price of our common stock on the date of grant, which was $42.30 per share.
On March 9, 2017, the Compensation Committee granted a total of 14,920 shares of time–based restricted stock to our non–employee directors. The restricted shares vest in full one year from the date of grant provided the recipient remains on the board of directors through that date. The grant date fair value of the restricted shares was based on the closing sales price of our common stock on the grant date, which was $26.80 per share.
On January 5, 2017, the Compensation Committee determined the degree to which the long–term incentive compensation arrangement approved for the fiscal 2014–2016 performance period was attained, and the resulting payout level relative to the target amount for each of the metrics that were established by the Compensation Committee in 2014. As a result, the Compensation Committee determined that a total of 30,683 performance shares were earned by our executive officers, which performance shares vested on January 5, 2017. The vesting date fair value of the performance shares was based on the closing sales price of our common stock on the vesting date, which was $33.90 per share. All related stock–based compensation cost for these vested performance shares was expensed accordingly during the three–year performance period ended October 31, 2016.
| 62 |
HURCO COMPANIES, INC.
NOTES TO CONSOLIDATED FINANCIAL STATEMENTS – Continued
On January 5, 2017, the Compensation Committee also approved a long–term incentive compensation arrangement for our executive officers in the form of restricted shares and PSUs under the 2016 Equity Plan, which will be payable in shares of our common stock if earned and vested. The awards were 25% time–based vesting and 75% performance–based vesting. The three–year performance period for the PSUs is fiscal 2017 through fiscal 2019.
On that date, the Compensation Committee granted a total of 14,747 shares of time–based restricted stock to our executive officers. The restricted shares vest in thirds over three years from the date of grant provided the recipient remains employed through that date. The grant date fair value of the restricted shares was based upon the closing sales price of our common stock on the date of grant, which was $33.90 per share.
On January 5, 2017, the Compensation Committee also granted a total target number of 18,496 PSUs to our executive officers designated as “PSU – TSR”. These PSUs were weighted as approximately 40% of the overall 2017 executive long–term incentive compensation arrangement and will vest and be paid based upon the total shareholder return of our common stock over the three–year period of fiscal 2017–2019, relative to the total shareholder return of the companies in a specified peer group over that period. Participants will have the ability to earn between 50% of the target number of the PSUs – TSR for achieving threshold performance and 200% of the target number of the PSUs – TSR for achieving maximum performance. The grant date fair value of the PSUs – TSR was $43.25 per PSU and was calculated using the Monte Carlo approach.
On January 5, 2017, the Compensation Committee also granted a total target number of 20,647 PSUs to our executive officers designated as “PSU – ROIC”. These PSUs were weighted as approximately 35% of the overall 2017 executive long–term incentive compensation arrangement and will vest and be paid based upon the achievement of pre–established goals related to our average return on invested capital over the three–year period of fiscal 2017–2019. Participants will have the ability to earn between 50% of the target number of the PSUs – ROIC for achieving threshold performance and 200% of the target number of the PSUs – ROIC for achieving maximum performance. The grant date fair value of the PSUs – ROIC was based on the closing sales price of our common stock on the grant date, which was $33.90 per share.
On March 10, 2016, the Compensation Committee granted a total of 9,170 shares of time–based restricted stock to our non–employee directors under the 2016 Equity Plan. The restricted shares vest in full one year from the date of grant provided the recipient remains on the board of directors through that date. The grant date fair value of the restricted shares was based on the closing sales price of our common stock on the grant date which was $30.52 per share.
On January 4, 2016, the Compensation Committee approved a long–term incentive compensation arrangement for our executive officers in the form of restricted shares and performance shares awarded under the 2008 Plan. The awards were 25% time–based vesting and 75% performance–based vesting. The three–year performance period is fiscal 2016 through fiscal 2018.
On that date, the Compensation Committee granted a total of 17,684 shares of time–based restricted stock to our executive officers. The restricted shares vest in thirds over three years from the date of grant provided the recipient remains employed through that date. The grant date fair value of the restricted shares was based upon the closing sales price of our common stock on the date of grant which was $26.04 per share.
On January 4, 2016, the Compensation Committee also granted a total target number of 24,023 performance shares to our executive officers designated as “Performance Shares – TSR”. The shares were weighted as 40% of the overall long–term incentive compensation arrangement and will vest and be paid based upon the total shareholder return of our common stock over a three–year period, relative to the total shareholder return of the companies in a specified peer group over that period. Participants will have the ability to earn between 50% of the target number of shares for achieving threshold performance and 200% of the target number of shares for achieving maximum performance. The grant date fair value of the Performance Shares – TSR was $30.67 per share and was calculated using the Monte Carlo approach.
| 63 |
HURCO COMPANIES, INC.
NOTES TO CONSOLIDATED FINANCIAL STATEMENTS – Continued
On January 4, 2016, the Compensation Committee also granted a total target number of 24,759 performance shares to our executive officers designated as “Performance Shares – ROIC”. These shares were weighted as 35% of the overall long–term incentive compensation arrangement and will vest and be paid based upon the achievement of pre–established goals related to our average return on invested capital over the three–year period. Participants will have the ability to earn between 50% of the target number of shares for achieving threshold performance and 200% of the target number of shares for achieving maximum performance. The grant date fair value of the Performance Shares – ROIC was based on the closing sales price of our common stock on the grant date which was $26.04 per share.
A reconciliation of the Company’s restricted stock, performance share and PSU activity and related information is as follows:
| Number | Weighted Average Grant | |||||||
| of Shares | Date Fair Value | |||||||
| Unvested at October 31, 2017 | 157,809 | $ | 32.05 | |||||
| Shares or units granted | 68,913 | 43.82 | ||||||
| Shares or units vested | (40,283 | ) | 30.20 | |||||
| Shares or units cancelled | (6,385 | ) | 33.67 | |||||
| Shares withheld | (11,706 | ) | 32.19 | |||||
| Unvested at October 31, 2018 | 168,348 | $ | 37.24 | |||||
During fiscal 2018, 2017, and 2016, we recorded approximately $2.5 million, $1.7 million and $1.6 million, respectively, of stock–based compensation expense related to grants under the 2008 Plan and the 2016 Equity Plan. As of October 31, 2018, there was an estimated $2.9 million of total unrecognized stock–based compensation cost that we expect to recognize by the end of the first quarter of fiscal 2021.
| 9. | RELATED PARTY TRANSACTIONS |
As of October 31, 2018, we owned approximately 35% of the outstanding shares of a Taiwanese–based contract manufacturer, Hurco Automation, Ltd. (“HAL”). HAL’s scope of activities includes the design, manufacture, sales and distribution of industrial automation products, software systems and related components, including control systems and components produced under contract for sale exclusively to us. We are accounting for this investment using the equity method. The investment of $4.0 million and $3.6 million at October 31, 2018 and 2017, respectively, is included in Investments and other assets, net on the Consolidated Balance Sheets. Purchases of controls from HAL amounted to $11.3 million, $10.0 million and $9.9 million in fiscal 2018, 2017 and 2016, respectively. Sales of control component parts to HAL were $197,000, $139,000 and $623,000 for the fiscal years ended October 31, 2018, 2017 and 2016, respectively. Trade payables to HAL were $3.4 million and $2.5 million at October 31, 2018 and 2017, respectively. Trade receivables from HAL were $68,000 and $30,000 at October 31, 2018 and 2017, respectively.
| 64 |
HURCO COMPANIES, INC.
NOTES TO CONSOLIDATED FINANCIAL STATEMENTS – Continued
Summary unaudited financial information for HAL’s operations and financial condition is as follows (in thousands):
| 2018 | 2017 | 2016 | ||||||||||
| Net Sales | $ | 17,841 | $ | 15,800 | $ | 13,948 | ||||||
| Gross Profit | 2,944 | 2,457 | 2,240 | |||||||||
| Operating Income | 1,534 | 1,037 | 952 | |||||||||
| Net Income | 1,845 | 1,320 | 1,323 | |||||||||
| Current Assets | $ | 12,870 | $ | 11,310 | $ | 10,238 | ||||||
| Non–current Assets | 4,579 | 4,440 | 3,733 | |||||||||
| Current Liabilities | 4,666 | 3,916 | 2,572 | |||||||||
| 10. | CONTINGENCIES AND LITIGATION |
We are involved in various claims and lawsuits arising in the normal course of business. Pursuant to applicable accounting rules, we accrue the minimum liability for each known claim when the estimated outcome is a range of possible loss and no one amount within that range is more likely than another. We maintain insurance policies for such matters, and we record insurance recoveries when we determine such recovery to be probable. We do not expect any of these claims, individually or in the aggregate, to have a material adverse effect on our consolidated financial position or results of operations. We believe that the ultimate resolution of claims for any losses will not exceed our insurance policy coverages.
| 11. | GUARANTEES AND PRODUCT WARRANTIES |
From time to time, our subsidiaries guarantee third party payment obligations in connection with the sale of machines to customers that use financing. We follow FASB guidance for accounting for guarantees (codified in ASC 460). As of October 31, 2018, we had 23 outstanding third party payment guarantees totaling approximately $0.6 million. The terms of these guarantees are consistent with the underlying customer financing terms. Upon shipment of a machine, the customer assumes the risk of ownership. The customer does not obtain title, however, until it has paid for the machine. A retention of title clause allows us to recover the machine if the customer defaults on the financing. We accrue liabilities under these guarantees at fair value, which amounts are insignificant.
We provide warranties on our products with respect to defects in material and workmanship. The terms of these warranties are generally one year for machines and shorter periods for service parts. We recognize a reserve with respect to this obligation at the time of product sale, with subsequent warranty claims recorded against the reserve. The amount of the warranty reserve is determined based on historical trend experience and any known warranty issues that could cause future warranty costs to differ from historical experience. A reconciliation of the changes in our warranty reserve is as follows (in thousands):
| 2018 | 2017 | 2016 | ||||||||||
| Balance, beginning of year | $ | 1,772 | $ | 1,523 | $ | 2,186 | ||||||
| Provision for warranties during the year | 4,121 | 3,379 | 2,715 | |||||||||
| Charges to the accrual | (3,326 | ) | (3,203 | ) | (3,349 | ) | ||||||
| Impact of foreign currency translation | (68 | ) | 73 | (29 | ) | |||||||
| Balance, end of year | $ | 2,499 | $ | 1,772 | $ | 1,523 | ||||||
| 65 |
HURCO COMPANIES, INC.
NOTES TO CONSOLIDATED FINANCIAL STATEMENTS – Continued
The increase in our warranty reserve from fiscal 2017 to fiscal 2018 was primarily due to an increase in the number of machines under warranty resulting from increased sales volume. The increase in our warranty reserve from fiscal 2016 to fiscal 2017 was primarily due to an increase in unit sales volume, as well as an increase in average warranty cost per machine as our product mix of machines under warranty shifted to more complex, higher–performance machines.
| 12. | OPERATING LEASES |
We lease facilities, certain equipment and vehicles under operating leases that expire at various dates through 2025. Future payments required under operating leases as of October 31, 2018, are summarized as follows (in thousands):
| 2019 | $ | 3,504 | ||
| 2020 | 2,320 | |||
| 2021 | 1,543 | |||
| 2022 | 1,312 | |||
| 2023 and thereafter | 1,180 | |||
| Total | $ | 9,859 |
Lease expense for the fiscal years ended October 31, 2018, 2017, and 2016 was $4.5 million, $4.4 million, and $4.5 million, respectively.
| 13. | QUARTERLY FINANCIAL INFORMATION (Unaudited) |
| First | Second | Third | Fourth | |||||||||||||
| Quarter | Quarter | Quarter | Quarter | |||||||||||||
| 2018 (In thousands, except per share data) | ||||||||||||||||
| Sales and service fees | $ | 68,444 | $ | 70,424 | $ | 78,752 | $ | 83,051 | ||||||||
| Gross profit | 20,121 | 19,313 | 24,521 | 27,851 | ||||||||||||
| Gross profit margin | 29 | % | 27 | % | 31 | % | 34 | % | ||||||||
| Selling, general and administrative expenses | 12,966 | 13,320 | 15,160 | 16,564 | ||||||||||||
| Operating income | 7,155 | 5,993 | 9,361 | 11,287 | ||||||||||||
| Provision for income taxes | 4,500 | 1,656 | 2,511 | 2,339 | ||||||||||||
| Net income | 2,937 | 3,751 | 6,500 | 8,302 | ||||||||||||
| Income per common share – basic | $ | 0.44 | $ | 0.55 | $ | 0.96 | $ | 1.24 | ||||||||
| Income per common share – diluted | $ | 0.43 | $ | 0.55 | $ | 0.95 | $ | 1.22 | ||||||||
| First | Second | Third | Fourth | |||||||||||||
| Quarter | Quarter | Quarter | Quarter | |||||||||||||
| 2017 (In thousands, except per share data) | ||||||||||||||||
| Sales and service fees | $ | 48,744 | $ | 58,222 | $ | 60,770 | $ | 75,931 | ||||||||
| Gross profit | 12,586 | 17,068 | 17,540 | 23,370 | ||||||||||||
| Gross profit margin | 26 | % | 29 | % | 29 | % | 31 | % | ||||||||
| Selling, general and administrative expenses | 11,167 | 11,714 | 12,395 | 14,385 | ||||||||||||
| Operating income | 1,419 | 5,354 | 5,145 | 8,985 | ||||||||||||
| Provision for income taxes | 543 | 1,467 | 1,353 | 2,238 | ||||||||||||
| Net income | 879 | 3,646 | 3,888 | 6,702 | ||||||||||||
| Income per common share – basic | $ | 0.13 | $ | 0.55 | $ | 0.58 | $ | 1.01 | ||||||||
| Income per common share – diluted | $ | 0.13 | $ | 0.54 | $ | 0.58 | $ | 1.00 | ||||||||
| 66 |
HURCO COMPANIES, INC.
NOTES TO CONSOLIDATED FINANCIAL STATEMENTS – Continued
| 14. | SEGMENT INFORMATION |
We operate in a single segment: industrial automation equipment. We design, manufacture and sell computerized (i.e., Computer Numeric Control) machine tools, consisting primarily of vertical machining centers (mills) and turning centers (lathes), to companies in the metal cutting industry through a worldwide sales, service and distribution network. Although the majority of our computer control systems and software products are proprietary, they predominantly use industry standard personal computer components. Our computer control systems and software products are primarily sold as integral components of our computerized machine tool products. We also provide machine tool components, software options, control upgrades, accessories and replacement parts for our products, as well as customer service and training and applications support.
We principally sell our products through more than 173 independent agents and distributors throughout the Americas, Europe and Asia. Our line is the primary line for the majority of our distributors globally even though some may carry competitive products. We also have our own direct sales and service organizations in China, France, Germany, India, Italy, Poland, Singapore, South Africa, Taiwan, the United Kingdom, and certain areas of the United States, which are among the world's principal machine tool consuming countries. During fiscal 2018, no distributor accounted for more than 5% of our sales and service fees. In fiscal 2018, approximately 71% of our revenues were from customers located outside of the U.S. and no single end–user of our products accounted for more than 5% of our total sales and service fees.
The following table sets forth the contribution of each of our product groups to our total sales and service fees during each of the past three fiscal years (in thousands):
Net Sales and Service Fees by Product Category
| Year ended October 31, | ||||||||||||
| 2018 | 2017 | 2016 | ||||||||||
| Computerized Machine Tools | $ | 261,710 | $ | 209,311 | $ | 195,618 | ||||||
| Computer Control Systems and Software † | 2,870 | 2,324 | 2,078 | |||||||||
| Service Parts | 27,501 | 24,255 | 21,908 | |||||||||
| Service Fees | 8,590 | 7,777 | 7,685 | |||||||||
| Total | $ | 300,671 | $ | 243,667 | $ | 227,289 | ||||||
| † | Amounts shown do not include computer control systems and software sold as an integrated component of computerized machine systems. |
| 67 |
HURCO COMPANIES, INC.
NOTES TO CONSOLIDATED FINANCIAL STATEMENTS – Continued
The following table sets forth revenues by geographic area, based on customer location, for each of the past three fiscal years (in thousands):
Revenues by Geographic Area
| Year Ended October 31, | ||||||||||||
| 2018 | 2017 | 2016 | ||||||||||
| United States of America | $ | 87,231 | $ | 70,912 | $ | 70,630 | ||||||
| Canada | 2,915 | 3,801 | 3,881 | |||||||||
| Central & South Americas | 2,194 | 1,844 | 1,950 | |||||||||
| Total Americas | 92,340 | 76,557 | 76,461 | |||||||||
| Germany | 62,346 | 48,786 | 44,411 | |||||||||
| United Kingdom | 34,216 | 28,019 | 25,313 | |||||||||
| Italy | 16,691 | 13,416 | 12,947 | |||||||||
| France | 15,815 | 13,917 | 13,787 | |||||||||
| Other Europe | 32,034 | 27,583 | 27,150 | |||||||||
| Total Europe | 161,102 | 131,721 | 123,608 | |||||||||
| China | 27,748 | 22,456 | 16,644 | |||||||||
| Other Asia Pacific | 17,937 | 10,238 | 8,989 | |||||||||
| Total Asia Pacific | 45,685 | 32,694 | 25,633 | |||||||||
| Other Foreign | 1,544 | 2,695 | 1,587 | |||||||||
| Grand Total | $ | 300,671 | $ | 243,667 | $ | 227,289 | ||||||
Long–lived tangible assets, net by geographic area, were (in thousands):
| As of October 31, | ||||||||||||
| 2018 | 2017 | 2016 | ||||||||||
| United States of America | $ | 8,375 | $ | 7,599 | $ | 7,846 | ||||||
| Foreign countries | 6,617 | 6,185 | 5,911 | |||||||||
| $ | 14,992 | $ | 13,784 | $ | 13,757 | |||||||
Net assets by geographic area were (in thousands):
| As of October 31, | ||||||||||||
| 2018 | 2017 | 2016 | ||||||||||
| Americas | $ | 96,348 | $ | 86,432 | $ | 84,040 | ||||||
| Europe | 74,558 | 70,536 | 60,861 | |||||||||
| Asia Pacific | 51,947 | 46,117 | 40,574 | |||||||||
| $ | 222,853 | $ | 203,085 | $ | 185,475 | |||||||
| 68 |
HURCO COMPANIES, INC.
NOTES TO CONSOLIDATED FINANCIAL STATEMENTS – Continued
15. NEW ACCOUNTING PRONOUNCEMENTS
Recently Adopted Accounting Pronouncements:
In March 2016, the FASB issued Accounting Standards Update (“ASU”) No. 2016–09, Compensation – Stock Compensation (Topic 718), which simplifies several areas of accounting for share–based compensation arrangements, including income tax consequences, classification of awards as either equity or liabilities, and classification on the statement of cash flows. ASU 2016–09 is effective for our fiscal year 2018, including interim periods within the fiscal year. Early adoption is permitted. We elected to early adopt the new guidance in the fourth quarter of fiscal 2017 which required us to reflect any adjustments as of November 1, 2016, the beginning of the annual period that includes the interim period of adoption. Upon adoption, excess tax benefits or deficiencies from share–based award activity are reflected in the consolidated statements of income as a component of the provision for income taxes, whereas they previously were recognized in equity. We also elected to account for forfeitures as they occur, rather than estimate expected forfeitures. The adoption of ASU 2016–09 resulted in a net cumulative–effect adjustment of a $0.2 million increase to retained earnings as of November 1, 2017, mostly related to the recognition of the previously unrecognized excess tax benefits using the modified retrospective method. The previously unrecognized excess tax effects were recorded as a reduction to tax liability or an increase to deferred tax asset.
We adopted the aspects of the standard affecting the cash flow presentation retrospectively, and accordingly, to conform to the current year presentation, we reclassified $146,000 of employee taxes paid for withheld shares under operating activities to financing activities for the years ended October 31, 2016 on our consolidated statements of cash flows.
In August 2014, the FASB issued ASU No. 2014–15, Disclosure of Uncertainties about an Entity’s Ability to Continue as a Going Concern, which requires management to evaluate whether there is substantial doubt about an entity’s ability to continue as a going concern and provide related footnote disclosures. ASU No. 2014–15 was effective for our fiscal year 2018, including interim periods within the fiscal year. As such, we adopted this standard in the first quarter of fiscal 2018. This standard did not have a significant effect on our accounting policies or on our consolidated financial statements and related disclosures.
In July 2015, the FASB issued ASU No. 2015–11, Inventory (Topic 330): Simplifying the Measurement of Inventory, which requires companies to measure inventory at the lower of cost and net realizable value, versus the lower of cost or market. Net realizable value is the estimated selling price in the ordinary course of business, less reasonably predictable costs of completion, disposal, and transportation. ASU 2015–11 was effective for our fiscal year 2018, with early adoption permitted and to be applied prospectively. As such, we adopted this standard in the first quarter of fiscal 2018 on a prospective basis. This standard did not have a significant effect on our accounting policies or on our consolidated financial statements and related disclosures. For additional information, see Note 3: Inventories.
In August 2016, the FASB issued ASU No. 2016–15, Statement of Cash Flows (Topic 230): Classification of Certain Cash Receipts and Cash Payments. This standard is intended to address eight classification issues related to the statement of cash flows to reduce diversity in practice in how certain transactions are classified. ASU 2016–15 is effective for our fiscal year 2019, with early adoption permitted. This standard requires adoption based upon a retrospective transition method. We elected to early adopt this standard in the first quarter of fiscal 2018. This standard did not have a significant effect on our accounting policies or on our consolidated financial statements and related disclosures.
| 69 |
HURCO COMPANIES, INC.
NOTES TO CONSOLIDATED FINANCIAL STATEMENTS – Continued
New Accounting Pronouncements:
Between May 2014 and December 2016, the FASB issued ASU No. 2014–09, Revenue from Contracts with Customers (Topic 606), and various related updates, establishing a single comprehensive model for entities to use in accounting for revenue arising from contracts with customers. This standard provides a five–step analysis in determining when and how revenue is recognized. The new model will require revenue recognition to depict the transfer of promised goods or services to customers in an amount that reflects the consideration a company expects to receive in exchange for those goods or services and will supersede most of the existing revenue recognition guidance, including industry–specific guidance. We have the option of applying this new standard retrospectively to each prior period presented (“full retrospective approach”) or retrospectively with the cumulative effect recognized in retained earnings as of the date of adoption (“modified retrospective approach”). Topic 606 was effective for us beginning November 1, 2018 and we adopted it on that date using the modified retrospective approach. Our evaluation of our contracts subject to this standard is complete and the application of Topic 606 to these contracts did not have a material impact on our consolidated financial statements at initial implementation. We are also evaluating the new disclosures required by Topic 606 to determine what additional information will need to be disclosed.
Between February 2016 and July 2018, the FASB issued ASU No. 2016–02, Leases (Topic 842), and various related updates, which establish a comprehensive new lease accounting model. ASU 2016–02 clarifies the definition of a lease, requires a dual approach to lease classification similar to current lease classifications, and requires lessees to recognize leases on the balance sheet as a lease liability with a corresponding right–of–use asset for leases with a lease–term of more than twelve months. ASU 2016–02 is effective for our fiscal year 2020, including interim periods within the fiscal year, and requires modified retrospective application. Early adoption is permitted. We are assessing the impact this new accounting guidance will have on our consolidated financial statements and disclosures.
In August 2017, the FASB issued ASU No. 2017–12, Derivatives and Hedging (Topic 815) Targeted Improvements to Accounting for Hedging Activities, which simplifies the application of hedge accounting and enables companies to better portray the economics of their risk management activities in their financial statements. ASU 2017–12 is effective for our fiscal year 2020, including interim periods within the fiscal year, and requires modified retrospective application. Early adoption is permitted. We do not anticipate that the adoption of this ASU will have a material impact on our consolidated financial statements and disclosures.
In February 2018, the FASB issued ASU No. 2018–02, Income Statement – Reporting Comprehensive Income (Topic 220): Reclassification of Certain Tax Effects from Accumulated Other Comprehensive Income, which will allow a reclassification from accumulated other comprehensive income to retained earnings for the tax effects resulting from the Tax Reform Act that are stranded in accumulated other comprehensive income. This standard also requires certain disclosures about stranded tax effects. This ASU, however, does not change the underlying guidance that requires that the effect of a change in tax laws or rates be included in income from continuing operations. ASU 2018–02 will be effective for our fiscal year 2020, with the option to early adopt at any time prior to the effective date. It must be applied either in the period of adoption or retrospectively to each period in which the effect of the change in the U.S. federal corporate income tax rate in the Tax Reform Act is recognized. We are assessing the impact this new accounting guidance will have on our consolidated financial statements and disclosures.
| 70 |
HURCO COMPANIES, INC.
NOTES TO CONSOLIDATED FINANCIAL STATEMENTS – Continued
In February 2018, the FASB issued ASU No. 2018–03, Technical Corrections and Improvements to Financial Instruments–Overall (Subtopic 825–10): Recognition and Measurement of Financial Assets and Financial Liabilities, which clarifies the guidance in ASU No. 2016–01, Financial Instruments – Overall (Subtopic 825–10) on certain issues related to financial instruments including, among other things, forward contracts and presentation requirements. ASU 2018–03 will be effective for our fiscal year 2019, including interim periods within the fiscal year. We are assessing the impact this new accounting guidance will have on our consolidated financial statements and disclosures.
Between May 2017 and June 2018, the FASB issued ASU No. 2017–09 and ASU No. 2018–07, Compensation – Stock Compensation (Topic 718), to include share–based payments issued to nonemployees for goods or services, as well to provide clarity and to reduce diversity in practice and cost and complexity when applying the guidance in Topic 718. These updates include guidance on determining which changes to the terms and conditions of share–based payment awards require a company to apply modification accounting under Topic 718 and to align the accounting for share–based payments to nonemployees and employees. These updates are effective for our fiscal year 2019. Early adoption is permitted, including adoption in any interim period. We do not expect that the adoption of these updates will have a material effect on our consolidated financial statements and disclosures.
There have been no other significant changes in the Company’s critical accounting policies and estimates during the fiscal year ended October 31, 2018.
| 71 |
Item 9. Changes in and Disagreements with Accountants on Accounting and Financial Disclosure
None.
Item 9A. CONTROLS AND PROCEDURES
Under the supervision and with the participation of management, including our Chief Executive Officer and Chief Financial Officer, we carried out an evaluation of the effectiveness of the design and operation of our disclosure controls and procedures as of October 31, 2018, pursuant to Rule 13a–15(b) under the Securities Exchange Act of 1934, as amended. Based upon that evaluation, our management, including the Chief Executive Officer and Chief Financial Officer, concluded that our disclosure controls and procedures were effective as of the evaluation date.
There have been no changes in our internal control over financial reporting that occurred during the fourth quarter of the fiscal year ended October 31, 2018 that have materially affected, or are reasonably likely to materially affect, our internal control over financial reporting.
The attestation report of our independent registered public accounting firm on our internal control over financial reporting is included in this report under Item 8. Financial Statements and Supplementary Data. Our management’s annual report on internal control over financial reporting is included in this report immediately preceding Item 8.
| 72 |
Item 9B. OTHER INFORMATION
Effective as of December 31, 2018, we and our subsidiary Hurco B.V. entered into a new credit agreement (the “2018 Credit Agreement”) with Bank of America, N.A., as the lender.
The 2018 Credit Agreement provides for an unsecured revolving credit and letter of credit facility in a maximum aggregate amount of $40.0 million. The 2018 Credit Agreement provides that the maximum amount of outstanding letters of credit at any one time may not exceed $10.0 million, the maximum amount of outstanding loans made to our subsidiary Hurco B.V. at any one time may not exceed $20.0 million, and the maximum amount of all outstanding loans denominated in alternative currencies at any one time may not exceed $20.0 million.
Under the 2018 Credit Agreement, we and Hurco B.V. are borrowers, and certain of our other subsidiaries are guarantors. The scheduled maturity date of the 2018 Credit Agreement is December 31, 2020.
Borrowings under the 2018 Credit Agreement will bear interest at floating rates based on, at our option, either (i) a LIBOR–based rate, or other alternative currency–based rate approved by the lender, plus 0.75% per annum, or (ii) a base rate (which is the highest of (a) the federal funds rate plus 0.50%, (b) the prime rate or (c) the one month LIBOR–based rate plus 1.00%), plus 0.00% per annum. Outstanding letters of credit will carry an annual rate of 0.75%.
The 2018 Credit Agreement contains customary affirmative and negative covenants and events of default, including covenants (1) restricting us from making certain investments, loans, advances and acquisitions (but permitting us to make investments in subsidiaries of up to $10.0 million); (2) restricting us from making certain payments, including cash dividends, except that we may pay cash dividends as long as immediately before and after giving effect to such payment, the sum of the unused amount of the commitments under the 2018 Credit Agreement plus our cash on hand is not less than $10.0 million, and as long as we are not in default before and after giving effect to such dividend payments; (3) requiring that we maintain a minimum working capital of $125.0 million; and (4) requiring that we maintain a minimum tangible net worth of $170.0 million.
We may use the proceeds from advances under the 2018 Credit Agreement for general corporate purposes.
In the ordinary course of business, the lender under the 2018 Credit Agreement and its affiliates have provided, and may in the future provide, investment banking, commercial banking, cash management, foreign exchange or other financial services to us for which they have received, and may in the future receive, compensation.
The foregoing description of the 2018 Credit Agreement does not purport to be complete and is qualified in its entirety by reference to the full text of the 2018 Credit Agreement, which is filed as Exhibit 10.1 to this report and is incorporated herein by reference.
In addition, effective December 31, 2018, the date we entered into the 2018 Credit Agreement, the Credit Agreement, dated as of December 7, 2012, as amended, among us, the lenders party thereto and JP Morgan Chase Bank, N.A., including all related documents, was terminated and is of no further force or effect except with respect to any obligations and provisions that survive the termination thereof.
During the fourth quarter of fiscal 2018, the Audit Committee of the Board of Directors did not engage our independent registered public accounting firm to perform any new non–audit services. This disclosure is made pursuant to Section 10A(i)(2) of the Securities Exchange Act of 1934, as amended, as added by Section 202 of the Sarbanes–Oxley Act of 2002.
| 73 |
The graph below matches the cumulative 5–Year total return of holders of Hurco Companies, Inc.'s common stock with the cumulative total returns of the Russell 2000 index, the NASDAQ Global Select index and a customized peer group of seventeen companies that includes: Ampco–Pittsburgh Corporation, DMC Global Inc., Douglas Dynamics Inc., The Eastern Company, Electro Scientific Industries Inc., FARO Technologies Inc., Graham Corporation, Kadant Inc., Key Tronic Corporation, L. S. Starrett Company, Nanometrics Incorporated, Novanta Inc., PDF Solutions Inc., Proto Labs Inc., QAD Inc., Sun Hydraulics Corporation (doing business as Helios Technologies) and Transcat Inc. The graph assumes that the value of the investment in our common stock, in each index, and in the peer group (including reinvestment of dividends) was $100 on 10/31/2013 and tracks it through 10/31/2018.
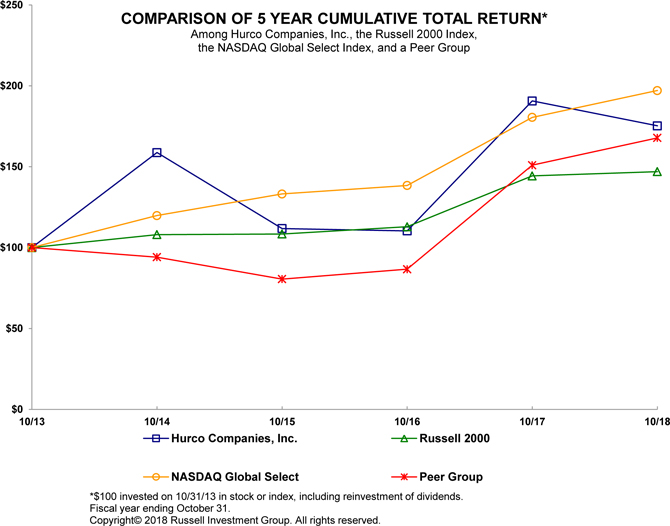
| 10/13 | 10/14 | 10/15 | 10/16 | 10/17 | 10/18 | |||||||||||||||||||
| Hurco Companies, Inc. | 100.00 | 158.75 | 111.79 | 110.34 | 190.67 | 175.27 | ||||||||||||||||||
| Russell 2000 | 100.00 | 108.06 | 108.43 | 112.89 | 144.32 | 147.00 | ||||||||||||||||||
| NASDAQ Global Select | 100.00 | 119.83 | 133.19 | 138.44 | 180.51 | 197.13 | ||||||||||||||||||
| Peer Group | 100.00 | 94.13 | 80.55 | 86.64 | 150.97 | 167.83 | ||||||||||||||||||
The stock price performance included in this graph is not necessarily indicative of future stock price performance.
| 74 |
PART III
| Item 10. | DIRECTORS, EXECUTIVE OFFICERS AND CORPORATE GOVERNANCE |
The information required by this item is incorporated herein by reference to the definitive proxy statement for our 2019 annual meeting of shareholders except that the information required by Item 10 regarding our executive officers is included herein under a separate caption at the end of Part I.
| Item 11. | EXECUTIVE COMPENSATION |
The information required by this item is incorporated herein by reference to the definitive proxy statement for our 2019 annual meeting of shareholders.
| Item 12. | SECURITY OWNERSHIP OF CERTAIN BENEFICIAL OWNERS AND MANAGEMENT AND RELATED STOCKHOLDER MATTERS |
The information required by this item is incorporated herein by reference to the definitive proxy statement for our 2019 annual meeting of shareholders.
| Item 13. | CERTAIN RELATIONSHIPS AND RELATED TRANSACTIONS, AND DIRECTOR INDEPENDENCE |
The information required by this item is incorporated herein by reference to the definitive proxy statement for our 2019 annual meeting of shareholders.
| Item 14. | PRINCIPal ACCOUNtant FEES AND SERVICES |
The information required by this item is incorporated herein by reference to the definitive proxy statement for our 2019 annual meeting of shareholders.
| 75 |
PART IV
| Item 15. | Exhibits AND Financial Statement Schedules |
| (a) | 1. | Financial Statements. The following consolidated financial statements of the Company are included herein under Item 8 of Part II: |
All other financial statement schedules are omitted because they are not applicable or the required information is included in the consolidated financial statements or notes thereto.
| (b) | Exhibits |
Exhibits being filed with this Form 10–K or incorporated herein by reference are listed on page 78.
| Item 16. | FORM 10–K SUMMARY |
None
| 76 |
Schedule II – Valuation and Qualifying Accounts and Reserves
for the Years Ended October 31, 2018, 2017 and 2016
(Dollars in thousands)
| Description | Balance at Beginning of Period | Charged to/ (Recovered from) Costs and Expenses | Charged to Other Accounts | Deductions | Balance at End of Period | |||||||||||||||
| Allowance for doubtful accounts for the year ended: | ||||||||||||||||||||
| October 31, 2018 | $ | 639 | $ | 394 | $ | – | $ | 6 | (1) | $ | 1,027 | |||||||||
| October 31, 2017 | $ | 664 | $ | 46 | $ | – | $ | 71 | (1) | $ | 639 | |||||||||
| October 31, 2016 | $ | 739 | $ | (15 | ) | $ | – | $ | 60 | (1) | $ | 664 | ||||||||
| Income tax valuation allowance for the year ended: | ||||||||||||||||||||
| October 31, 2018 | $ | 2,282 | $ | 253 | $ | – | $ | 429 | $ | 2,106 | ||||||||||
| October 31, 2017 | $ | 2,067 | $ | 515 | $ | – | $ | 300 | $ | 2,282 | ||||||||||
| October 31, 2016 | $ | 1,485 | $ | 587 | $ | – | $ | 5 | $ | 2,067 | ||||||||||
(1) Receivable write–offs.
| 77 |
EXHIBITS INDEX
Exhibits Filed. The following exhibits are filed with this report:
Exhibits Incorporated by Reference. The following exhibits are incorporated into this report:
| 78 |
| * | The indicated exhibit is a management contract, compensatory plan or arrangement required to be listed by Item 601 of Regulation S–K. |
| 79 |
SIGNATURES
Pursuant to the requirements of Section 13 or 15(d) of the Securities Exchange Act of 1934, the Registrant has duly caused this Report to be signed on its behalf by the undersigned, thereunto duly authorized, this 4th day of January, 2019.
| HURCO COMPANIES, INC. | ||
| By: | /s/ Sonja K. McClelland | |
| Sonja K. McClelland | ||
| Executive Vice President, Secretary, Treasurer and | ||
| Chief Financial Officer | ||
| 80 |
Pursuant to the requirements of the Securities Exchange Act of 1934, this report has been signed below by the following persons on behalf of the Registrant and in the capacities and on the dates indicated:
| Signature and Title(s) | Date | |
| /s/ Michael Doar | January 4, 2019 | |
| Michael Doar, Chairman, | ||
| Chief Executive Officer | ||
| of Hurco Companies, Inc. | ||
| (Principal Executive Officer) | ||
| /s/ Sonja K. McClelland | January 4, 2019 | |
| Sonja K. McClelland | ||
| Executive Vice President, | ||
| Secretary, Treasurer and | ||
| Chief Financial Officer | ||
| of Hurco Companies, Inc. | ||
|
(Principal Financial Officer and Principal Accounting Officer) |
||
| /s/ Thomas A. Aaro | January 4, 2019 | |
| Thomas A. Aaro, Director | ||
| /s/ Robert W. Cruickshank | January 4, 2019 | |
| Robert W. Cruickshank, Director | ||
| /s/ Timothy J. Gardner | January 4, 2019 | |
| Timothy J. Gardner, Director | ||
| /s/ Jay C. Longbottom | January 4, 2019 | |
| Jay C. Longbottom, Director | ||
| /s/ Andrew Niner | January 4, 2019 | |
| Andrew Niner, Director | ||
| /s/ Richard Porter | January 4, 2019 | |
| Richard Porter, Director | ||
| /s/ Janaki Sivanesan | January 4, 2019 | |
| Janaki Sivanesan, Director |
| 81 |