Attached files
| file | filename |
|---|---|
| EX-99.1 - EXHIBIT 99.1 - Cornerstone Building Brands, Inc. | a2018q4exh991.htm |
| 8-K - 8-K - Cornerstone Building Brands, Inc. | ncs201812198-k.htm |
Our Mission & Vision NCI Fiscal 4Q Supplemental Presentation December 19, 2018
Forward-looking Statements Certain statements and information in this presentation may constitute forward-looking statements within the meaning of the Private Securities LitigationOurReform Act of 1995. The words “believe,” “anticipate,” “plan,” “intend,” “foresee,” “guidance,” “potential,” “expect,” “should,” “will” “continue,” “could,”Mission“estimate,” “forecast,” “goal,”& “may,”Vision“objective,” “predict,” “projection,” or similar expressions are intended to identify forward- looking statements (including those contained in certain visual depictions) in this presentation. These forward-looking statements reflect the Company's current expectations and/or beliefs concerning future events. The Company believes the information, estimates, forecasts and assumptions on which these statements are based are current, reasonable and complete. Our expectations with respect to the fourth quarter of fiscal 2018 that are contained in this presentation are forward looking statements based on management’s best estimates as of the date of this presentation with respect to future results. However, the forward-looking statements in this presentation are subject to a number of risks and uncertainties that may cause the Company's actual performance to differ materially from that projected in such statements. Among the factors that could cause actual results to differ materially include, but are not limited to, risks and uncertainties relating to industry cyclicality and seasonality and adverse weather conditions; challenging economic conditions affecting the nonresidential construction industry; volatility in the United States (“U.S.”) economy and abroad, generally, and in the credit markets; changes in laws or regulations; the effects of certain external domestic or international factors that we may not be able to control, including war, civil conflict, terrorism, natural disasters and public health issues; our ability to obtain financing on acceptable terms; recognition of goodwill or asset impairment charges; commodity price volatility and/or limited availability of raw materials, including steel; retention and replacement of key personnel; enforcement and obsolescence of our intellectual property rights; costs and liabilities related to compliance with environmental laws and environmental clean-ups; competitive activity and pricing pressure in our industry; volatility of the Company’s stock price; our ability to make strategic acquisitions accretive to earnings; our ability to carry out our restructuring plans and to fully realize the expected cost savings; volatility in energy prices; the adoption of climate change legislation; breaches of our information system security measures; damage to our major information management systems; necessary maintenance or replacements to our enterprise resource planning technologies; potential personal injury, property damage or product liability claims or other types of litigation; compliance with certain laws related to our international business operations; the effect of tariffs on steel imports; the cost and difficulty associated with integrating and combining the businesses of NCI and Ply Gem Parent LLC (“Ply Gem”); potential write-downs or write-offs, restructuring and impairment or other charges required in connection with the merger of Ply Gem with and into the Company with the Company continuing in its existence as a Delaware corporation; substantial governance and other rights held by our sponsor investors; the effect on our common stock price caused by transactions engaged in by our sponsor investors, our directors or executives; our substantial indebtedness and our ability to incur substantially more indebtedness; limitations that our debt agreements place on our ability to engage in certain business and financial transactions; the effect of increased interest rates on our ability to service our debt. See also the “Risk Factors” in the Company's Annual Report on Form 10-K for the fiscal year ended October 28, 2018, and other risks described in documents subsequently filed by the Company from time to time with the Securities and Exchange Commission, which identify other important factors, though not necessarily all such factors, that could cause future outcomes to differ materially from those set forth in the forward- looking statements. The Company expressly disclaims any obligation to release publicly any updates or revisions to these forward-looking statements, whether as a result of new information, future events, or otherwise. 2
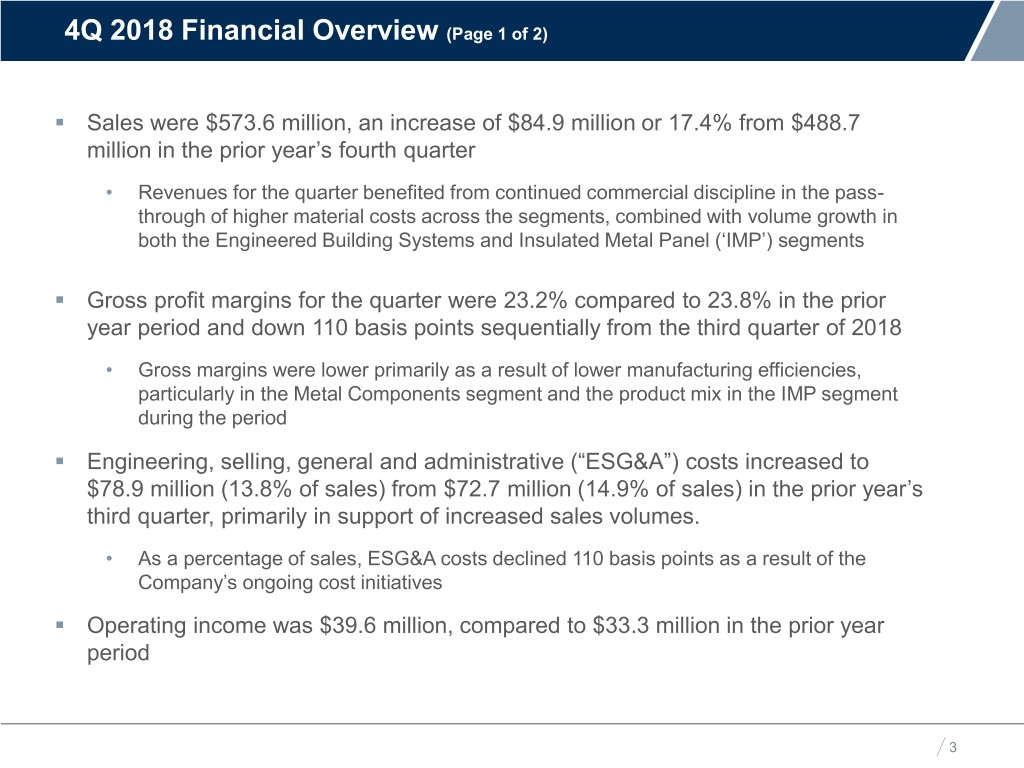
4Q 2018 Financial Overview (Page 1 of 2) Our. Sales Mission were $573.6 million, & anVision increase of $84.9 million or 17.4% from $488.7 million in the prior year’s fourth quarter • Revenues for the quarter benefited from continued commercial discipline in the pass- through of higher material costs across the segments, combined with volume growth in both the Engineered Building Systems and Insulated Metal Panel (‘IMP’) segments . Gross profit margins for the quarter were 23.2% compared to 23.8% in the prior year period and down 110 basis points sequentially from the third quarter of 2018 • Gross margins were lower primarily as a result of lower manufacturing efficiencies, particularly in the Metal Components segment and the product mix in the IMP segment during the period . Engineering, selling, general and administrative (“ESG&A”) costs increased to $78.9 million (13.8% of sales) from $72.7 million (14.9% of sales) in the prior year’s third quarter, primarily in support of increased sales volumes. • As a percentage of sales, ESG&A costs declined 110 basis points as a result of the Company’s ongoing cost initiatives . Operating income was $39.6 million, compared to $33.3 million in the prior year period 3
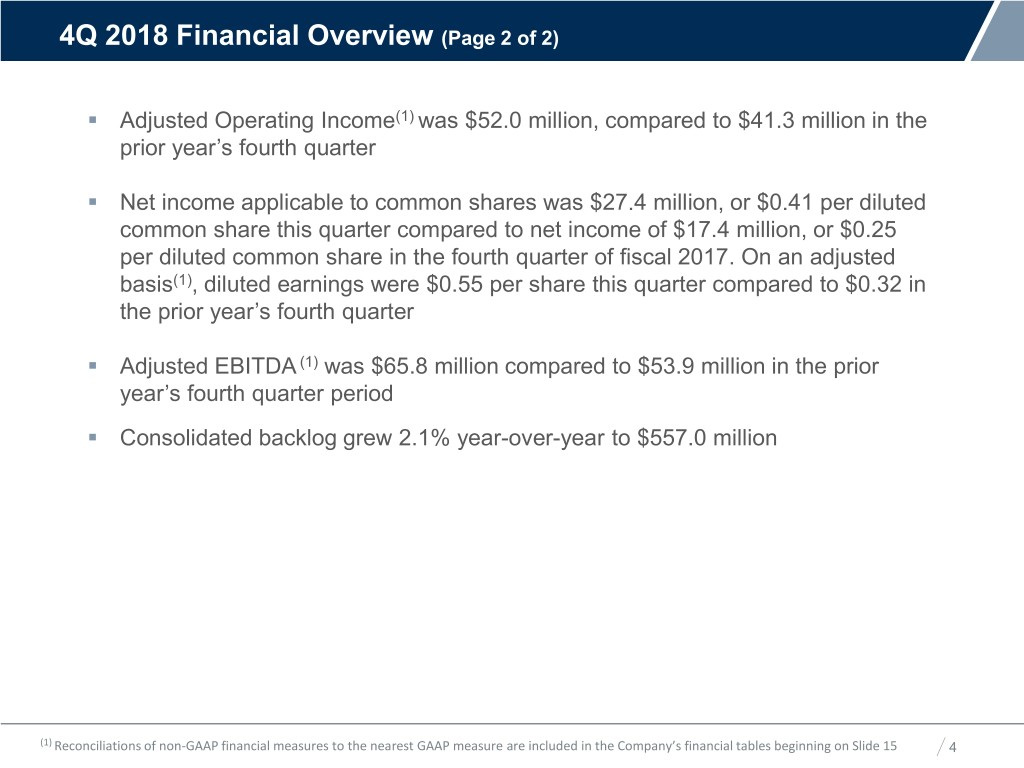
4Q 2018 Financial Overview (Page 2 of 2) Our. Adjusted Mission Operating & Income Vision(1) was $52.0 million, compared to $41.3 million in the prior year’s fourth quarter . Net income applicable to common shares was $27.4 million, or $0.41 per diluted common share this quarter compared to net income of $17.4 million, or $0.25 per diluted common share in the fourth quarter of fiscal 2017. On an adjusted basis(1), diluted earnings were $0.55 per share this quarter compared to $0.32 in the prior year’s fourth quarter . Adjusted EBITDA (1) was $65.8 million compared to $53.9 million in the prior year’s fourth quarter period . Consolidated backlog grew 2.1% year-over-year to $557.0 million (1) Reconciliations of non-GAAP financial measures to the nearest GAAP measure are included in the Company’s financial tables beginning on Slide 15 4
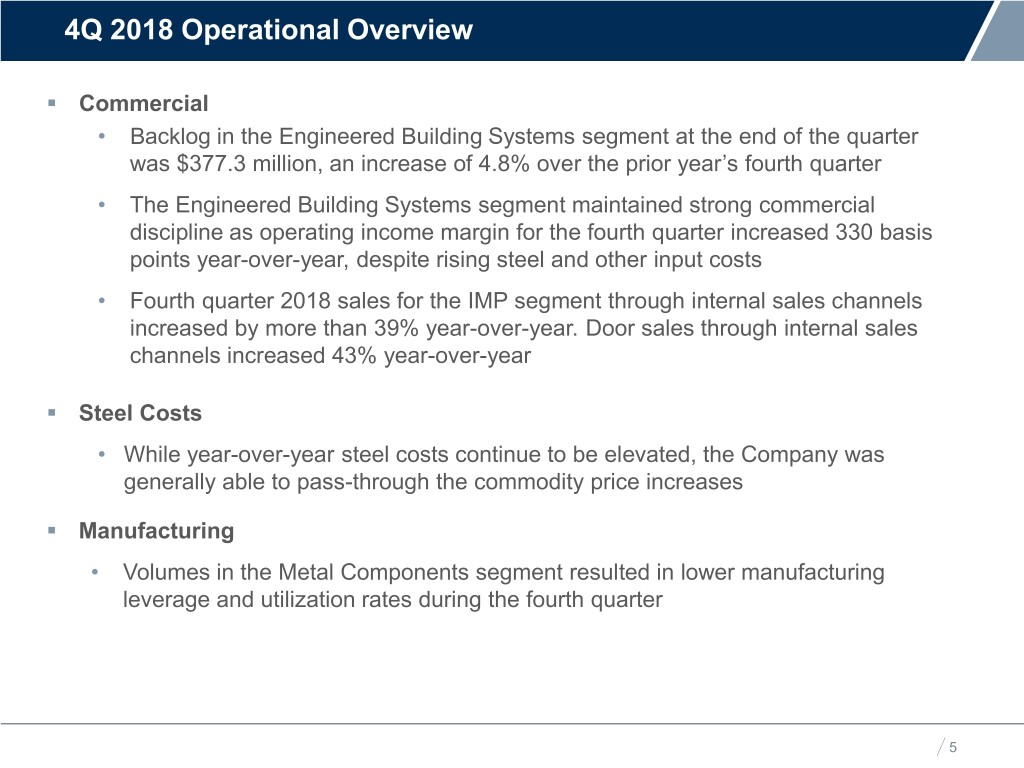
4Q 2018 Operational Overview Our. Commercial Mission & Vision • Backlog in the Engineered Building Systems segment at the end of the quarter was $377.3 million, an increase of 4.8% over the prior year’s fourth quarter • The Engineered Building Systems segment maintained strong commercial discipline as operating income margin for the fourth quarter increased 330 basis points year-over-year, despite rising steel and other input costs • Fourth quarter 2018 sales for the IMP segment through internal sales channels increased by more than 39% year-over-year. Door sales through internal sales channels increased 43% year-over-year . Steel Costs • While year-over-year steel costs continue to be elevated, the Company was generally able to pass-through the commodity price increases . Manufacturing • Volumes in the Metal Components segment resulted in lower manufacturing leverage and utilization rates during the fourth quarter 5
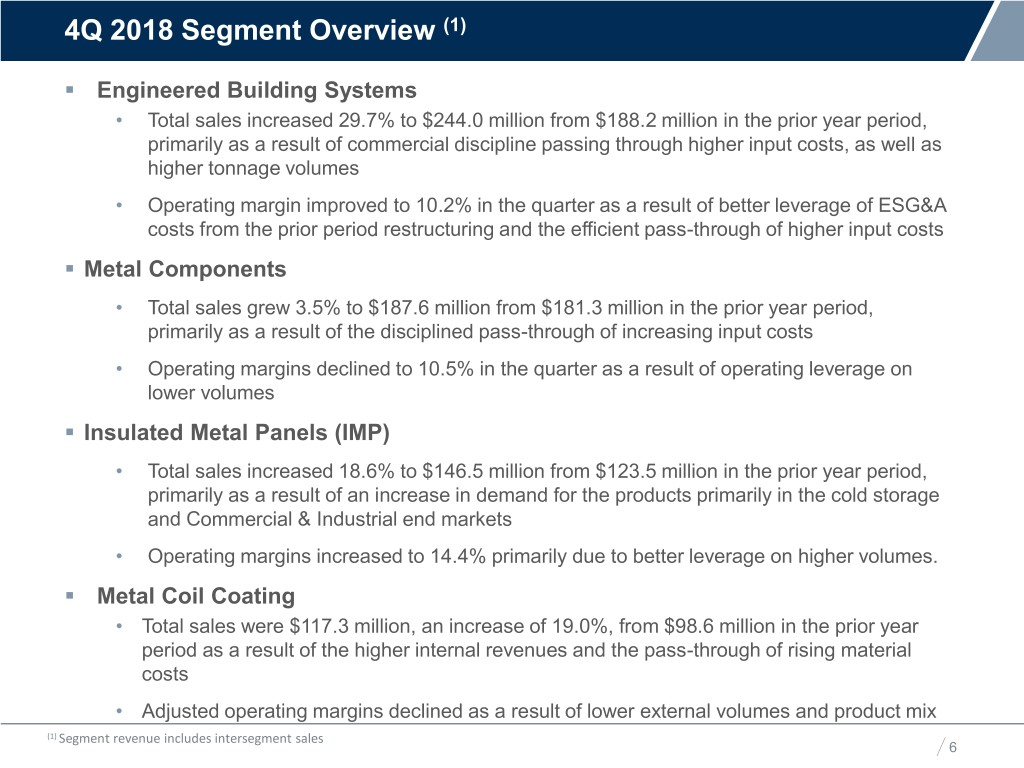
4Q 2018 Segment Overview (1) . Engineered Building Systems Our• MissionTotal sales increased & 29.7% Vision to $244.0 million from $188.2 million in the prior year period, primarily as a result of commercial discipline passing through higher input costs, as well as higher tonnage volumes • Operating margin improved to 10.2% in the quarter as a result of better leverage of ESG&A costs from the prior period restructuring and the efficient pass-through of higher input costs . Metal Components • Total sales grew 3.5% to $187.6 million from $181.3 million in the prior year period, primarily as a result of the disciplined pass-through of increasing input costs • Operating margins declined to 10.5% in the quarter as a result of operating leverage on lower volumes . Insulated Metal Panels (IMP) • Total sales increased 18.6% to $146.5 million from $123.5 million in the prior year period, primarily as a result of an increase in demand for the products primarily in the cold storage and Commercial & Industrial end markets • Operating margins increased to 14.4% primarily due to better leverage on higher volumes. . Metal Coil Coating • Total sales were $117.3 million, an increase of 19.0%, from $98.6 million in the prior year period as a result of the higher internal revenues and the pass-through of rising material costs • Adjusted operating margins declined as a result of lower external volumes and product mix (1) Segment revenue includes intersegment sales 6
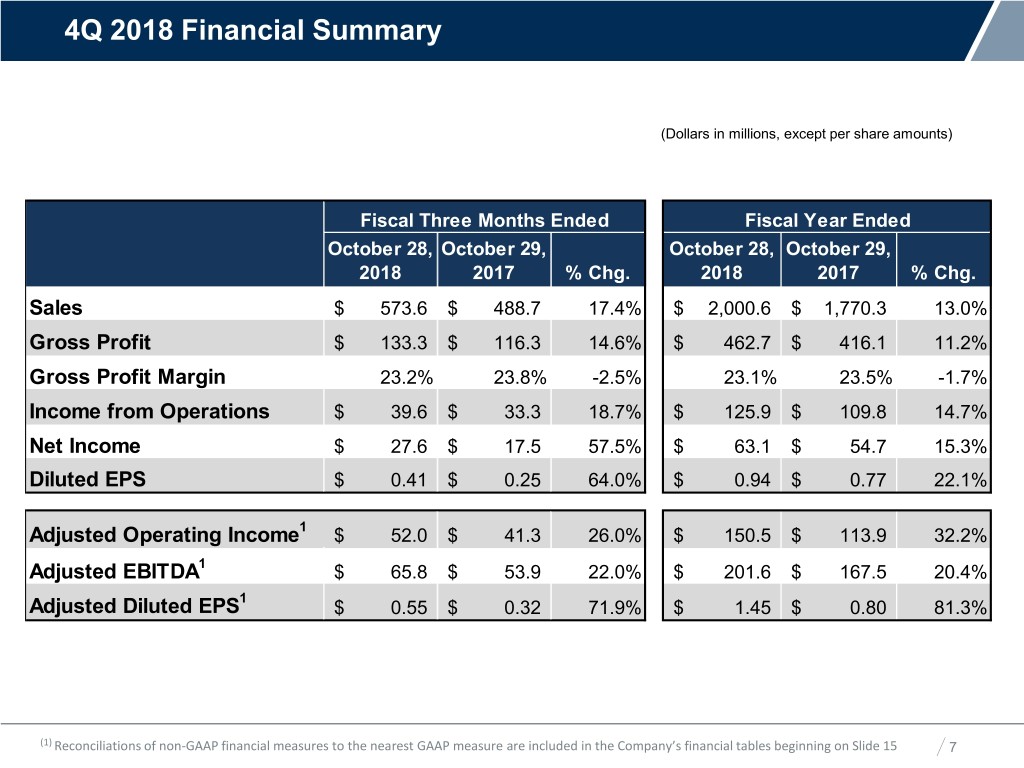
4Q 2018 Financial Summary Our Mission & Vision (Dollars in millions, except per share amounts) Fiscal Three Months Ended Fiscal Year Ended October 28, October 29, October 28, October 29, 2018 2017 % Chg. 2018 2017 % Chg. Sales $ 573.6 $ 488.7 17.4% $ 2,000.6 $ 1,770.3 13.0% Gross Profit $ 133.3 $ 116.3 14.6% $ 462.7 $ 416.1 11.2% Gross Profit Margin 23.2% 23.8% -2.5% 23.1% 23.5% -1.7% Income from Operations $ 39.6 $ 33.3 18.7% $ 125.9 $ 109.8 14.7% Net Income $ 27.6 $ 17.5 57.5% $ 63.1 $ 54.7 15.3% Diluted EPS $ 0.41 $ 0.25 64.0% $ 0.94 $ 0.77 22.1% Adjusted Operating Income1 $ 52.0 $ 41.3 26.0% $ 150.5 $ 113.9 32.2% Adjusted EBITDA1 $ 65.8 $ 53.9 22.0% $ 201.6 $ 167.5 20.4% 1 Adjusted Diluted EPS $ 0.55 $ 0.32 71.9% $ 1.45 $ 0.80 81.3% (1) Reconciliations of non-GAAP financial measures to the nearest GAAP measure are included in the Company’s financial tables beginning on Slide 15 7

4Q 2018 Sales and Volumes – by Segment (Dollars in millions) Our Mission & Vision Engineered Building Systems Metal Components Insulated Metal Panels Metal Coil Coating % Vol. % Vol. % Vol. 1 1 1 4Q-'18 4Q-'17 % Chg. Chg. 4Q-'18 4Q-'17 % Chg. Chg. 4Q-'18 4Q-'17 % Chg. 4Q-'18 4Q-'17 % Chg. Chg. Third-Party $ 231.3 $ 178.2 29.8% 12.5% Third-Party $ 171.8 $ 155.2 10.7% -2.5% Third-Party $ 120.9 $ 105.1 15.0% Third-Party $ 49.7 $ 50.3 -1.1% -31.2% Internal 12.7 10.0 27.3% 22.6% Internal 15.9 26.1 -39.2% -29.7% Internal 25.6 18.5 38.6% Internal 67.6 48.3 40.0% -3.8% Total Sales $ 244.0 $ 188.2 29.7% 13.3% Total Sales $ 187.6 $ 181.3 3.5% -7.5% Total Sales $ 146.5 $ 123.5 18.6% Total Sales $ 117.3 $ 98.6 19.0% -17.9% Engineered Building Metal Components Insulated Metal Panels Metal Coil Coating Systems $300.0 $200.0 $160.0 $140.0 $180.0 $140.0 $120.0 $250.0 $160.0 $120.0 $140.0 $100.0 $200.0 $100.0 $120.0 $80.0 $150.0 $100.0 $80.0 $60.0 $80.0 $60.0 $100.0 $60.0 $40.0 $40.0 $40.0 $50.0 $20.0 $20.0 $20.0 $- $- $- $- 4Q-'18 4Q-'17 4Q-'18 4Q-'17 4Q-'18 4Q-'17 4Q-'18 4Q-'17 Third-Party Internal Third-Party Internal Third-Party Internal Third-Party Internal Consolidated 3rd Party Revenue Consolidated 3rd Party Revenue 4Q 2018 4Q 2017 Metal Coil Metal Coil Coating Coating 9% 10% Insulated Insulated Metal Panels Metal Panels 21% 22% Engineered Building Engineered Building Metal Syste ms Systems Metal 36% Components 40% Components 30% 32% (1) Calculated as the year-over-year change in the tonnage volumes shipped. 8
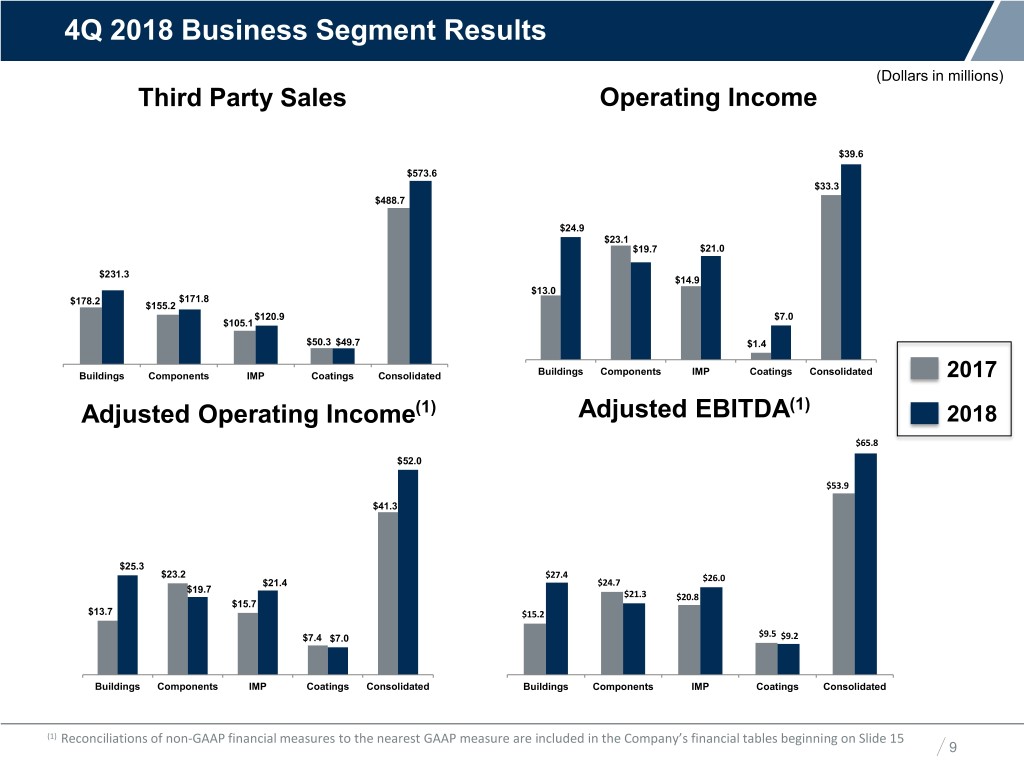
4Q 2018 Business Segment Results (Dollars in millions) Our MissionThird Party Sales & Vision Operating Income $39.6 $573.6 $33.3 $488.7 $24.9 $23.1 $19.7 $21.0 $231.3 $14.9 $13.0 $171.8 $178.2 $155.2 $120.9 $7.0 $105.1 $50.3 $49.7 $1.4 Buildings Components IMP Coatings Consolidated Buildings Components IMP Coatings Consolidated 2017 Adjusted Operating Income(1) Adjusted EBITDA(1) 2018 $65.8 $52.0 $53.9 $41.3 $25.3 $23.2 $27.4 $26.0 $21.4 $24.7 $19.7 $21.3 $20.8 $15.7 $13.7 $15.2 $9.5 $7.4 $7.0 $9.2 Buildings Components IMP Coatings Consolidated Buildings Components IMP Coatings Consolidated (1) Reconciliations of non-GAAP financial measures to the nearest GAAP measure are included in the Company’s financial tables beginning on Slide 15 9
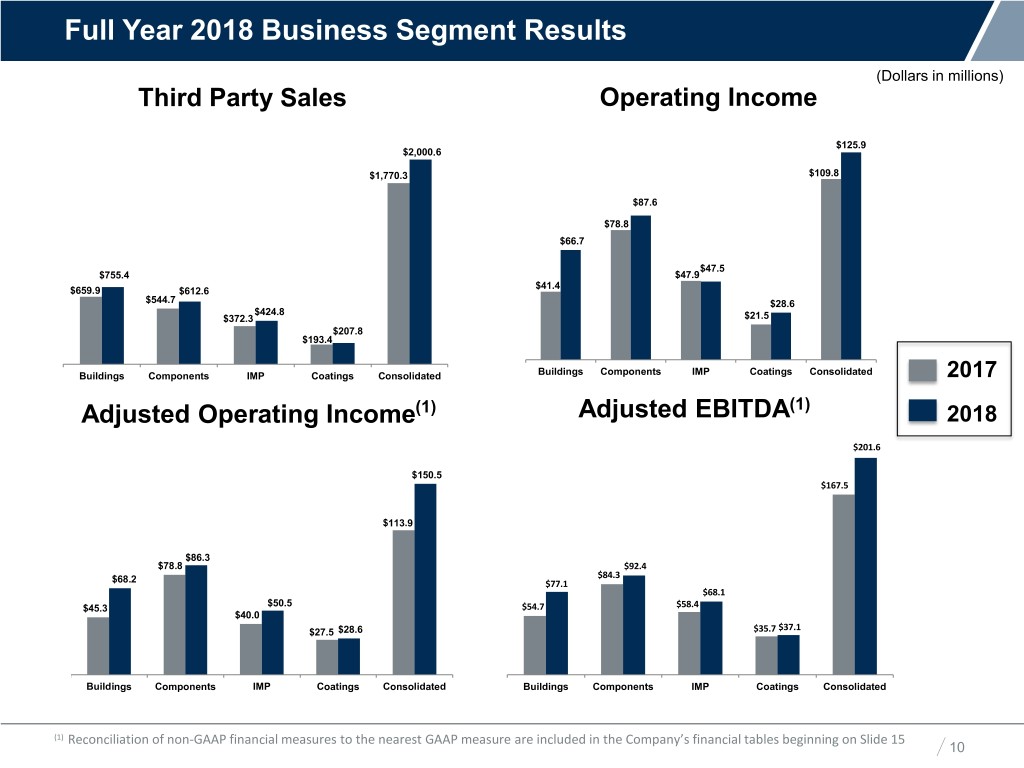
Full Year 2018 Business Segment Results (Dollars in millions) Our MissionThird Party Sales & Vision Operating Income $125.9 $2,000.6 $1,770.3 $109.8 $87.6 $78.8 $66.7 $47.5 $755.4 $47.9 $41.4 $659.9 $612.6 $544.7 $28.6 $424.8 $372.3 $21.5 $207.8 $193.4 Buildings Components IMP Coatings Consolidated Buildings Components IMP Coatings Consolidated 2017 Adjusted Operating Income(1) Adjusted EBITDA(1) 2018 $201.6 $150.5 $167.5 $113.9 $86.3 $78.8 $92.4 $84.3 $68.2 $77.1 $68.1 $50.5 $58.4 $45.3 $54.7 $40.0 $37.1 $27.5 $28.6 $35.7 Buildings Components IMP Coatings Consolidated Buildings Components IMP Coatings Consolidated (1) Reconciliation of non-GAAP financial measures to the nearest GAAP measure are included in the Company’s financial tables beginning on Slide 15 10
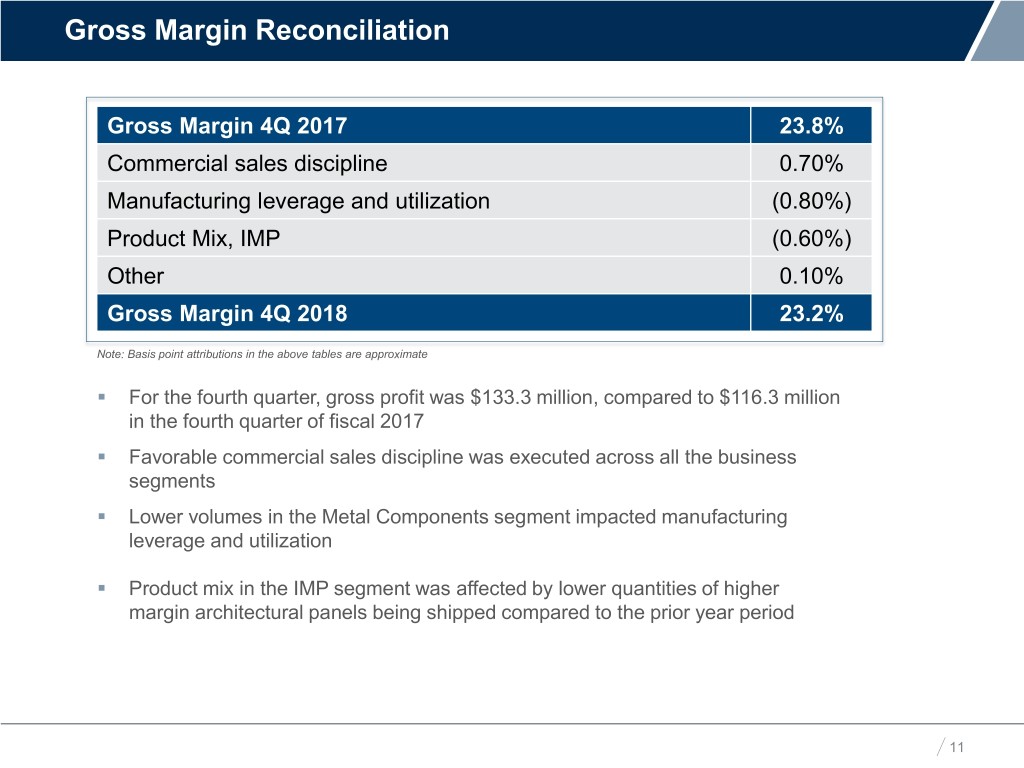
Gross Margin Reconciliation OurGross Mission Margin 4Q 2017 & Vision 23.8% Commercial sales discipline 0.70% Manufacturing leverage and utilization (0.80%) Product Mix, IMP (0.60%) Other 0.10% Gross Margin 4Q 2018 23.2% Note: Basis point attributions in the above tables are approximate . For the fourth quarter, gross profit was $133.3 million, compared to $116.3 million in the fourth quarter of fiscal 2017 . Favorable commercial sales discipline was executed across all the business segments . Lower volumes in the Metal Components segment impacted manufacturing leverage and utilization . Product mix in the IMP segment was affected by lower quantities of higher margin architectural panels being shipped compared to the prior year period 11
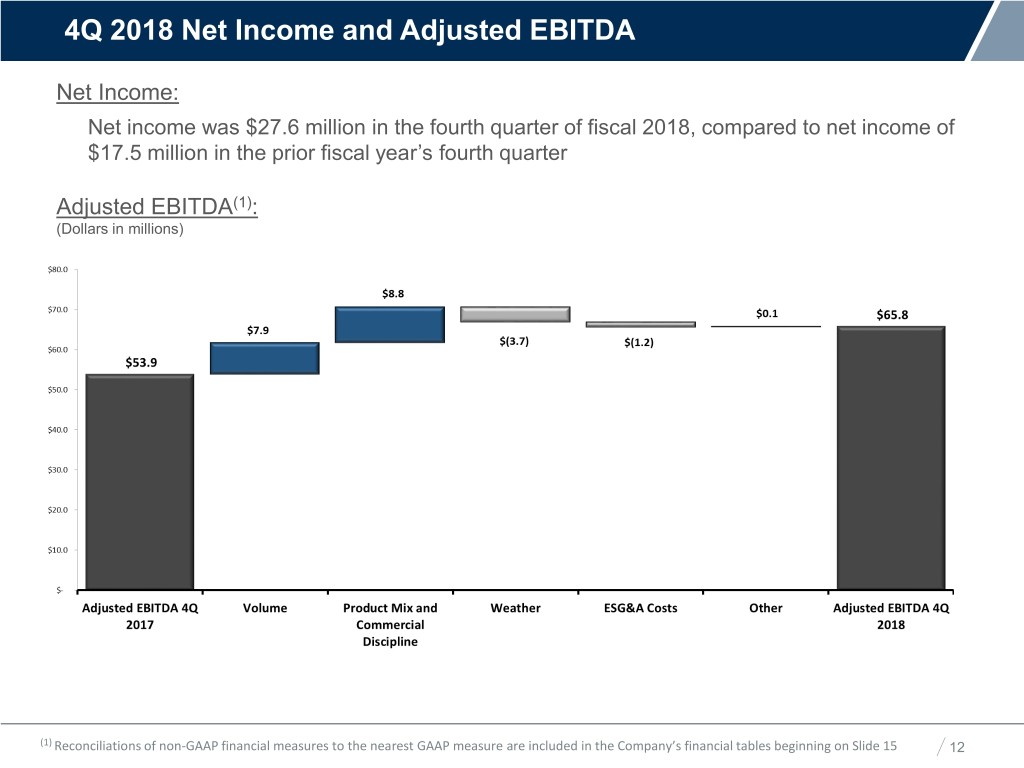
4Q 2018 Net Income and Adjusted EBITDA Net Income: OurNet incomeMission was $27.6 million& Vision in the fourth quarter of fiscal 2018, compared to net income of $17.5 million in the prior fiscal year’s fourth quarter Adjusted EBITDA(1): (Dollars in millions) (1) Reconciliations of non-GAAP financial measures to the nearest GAAP measure are included in the Company’s financial tables beginning on Slide 15 12
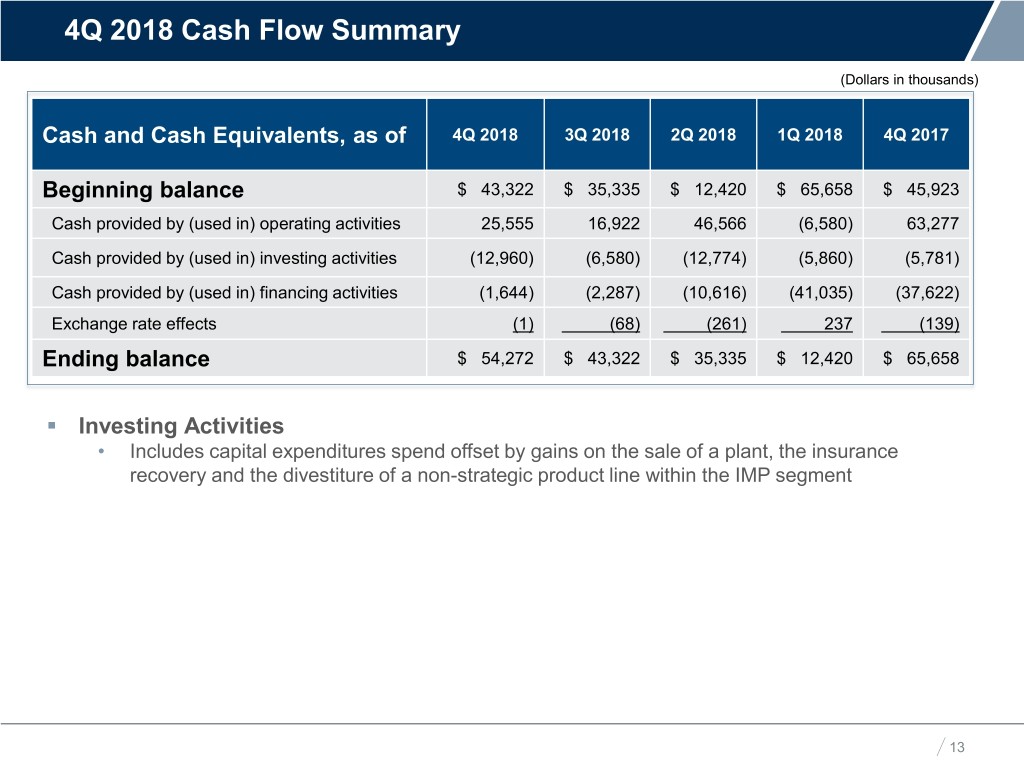
4Q 2018 Cash Flow Summary (Dollars in thousands) Our Mission & Vision Cash and Cash Equivalents, as of 4Q 2018 3Q 2018 2Q 2018 1Q 2018 4Q 2017 Beginning balance $ 43,322 $ 35,335 $ 12,420 $ 65,658 $ 45,923 Cash provided by (used in) operating activities 25,555 16,922 46,566 (6,580) 63,277 Cash provided by (used in) investing activities (12,960) (6,580) (12,774) (5,860) (5,781) Cash provided by (used in) financing activities (1,644) (2,287) (10,616) (41,035) (37,622) Exchange rate effects (1) (68) (261) 237 (139) Ending balance $ 54,272 $ 43,322 $ 35,335 $ 12,420 $ 65,658 . Investing Activities • Includes capital expenditures spend offset by gains on the sale of a plant, the insurance recovery and the divestiture of a non-strategic product line within the IMP segment 13
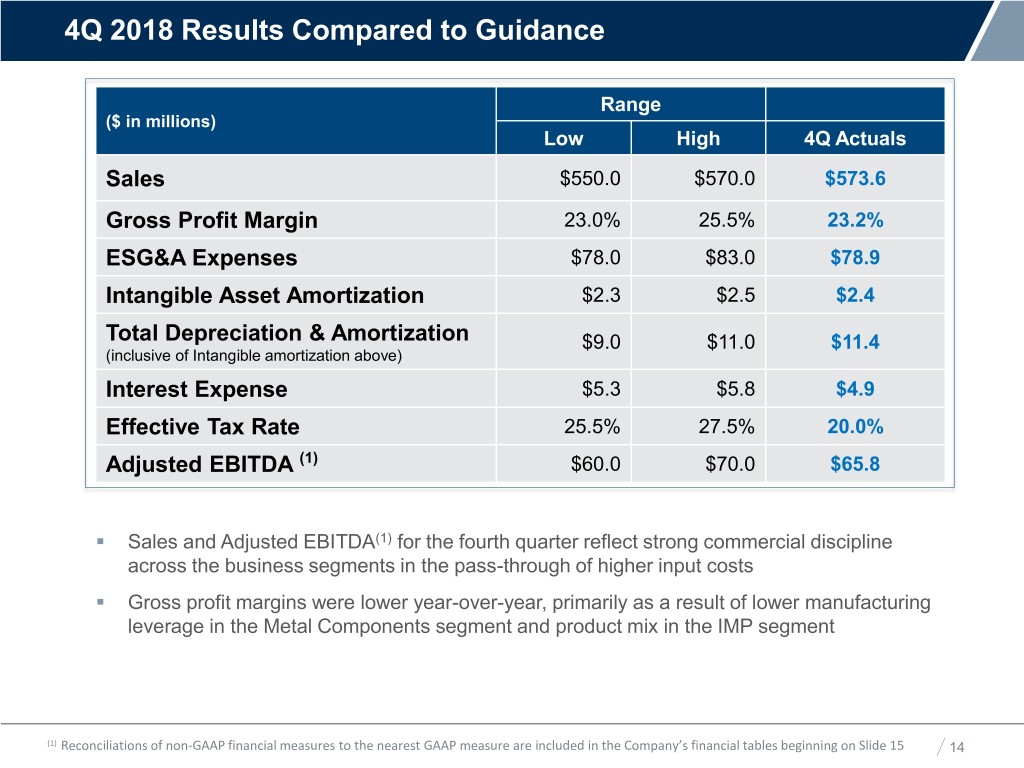
4Q 2018 Results Compared to Guidance Range Our($ inMissionmillions) & Vision Low High 4Q Actuals Sales $550.0 $570.0 $573.6 Gross Profit Margin 23.0% 25.5% 23.2% ESG&A Expenses $78.0 $83.0 $78.9 Intangible Asset Amortization $2.3 $2.5 $2.4 Total Depreciation & Amortization $9.0 $11.0 $11.4 (inclusive of Intangible amortization above) Interest Expense $5.3 $5.8 $4.9 Effective Tax Rate 25.5% 27.5% 20.0% Adjusted EBITDA (1) $60.0 $70.0 $65.8 . Sales and Adjusted EBITDA(1) for the fourth quarter reflect strong commercial discipline across the business segments in the pass-through of higher input costs . Gross profit margins were lower year-over-year, primarily as a result of lower manufacturing leverage in the Metal Components segment and product mix in the IMP segment (1) Reconciliations of non-GAAP financial measures to the nearest GAAP measure are included in the Company’s financial tables beginning on Slide 15 14
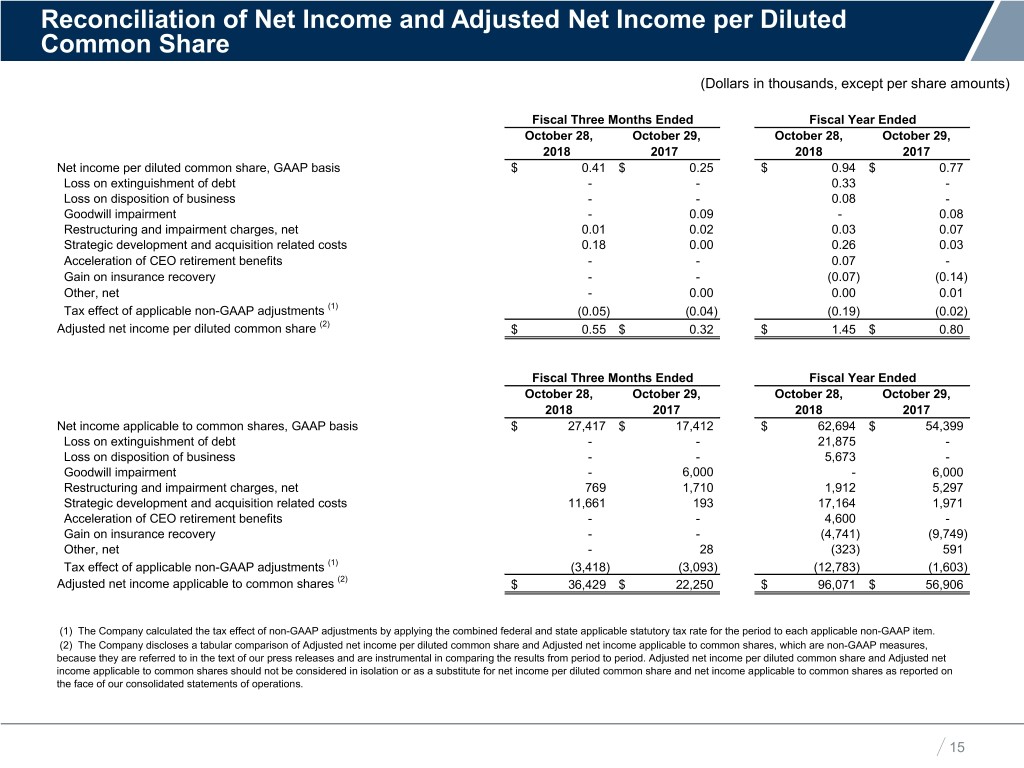
Reconciliation of Net Income and Adjusted Net Income per Diluted Common Share (Dollars in thousands, except per share amounts) Our Mission & Vision Fiscal Three Months Ended Fiscal Year Ended October 28, October 29, October 28, October 29, 2018 2017 2018 2017 Net income per diluted common share, GAAP basis $ 0.41 $ 0.25 $ 0.94 $ 0.77 Loss on extinguishment of debt - - 0.33 - Loss on disposition of business - - 0.08 - Goodwill impairment - 0.09 - 0.08 Restructuring and impairment charges, net 0.01 0.02 0.03 0.07 Strategic development and acquisition related costs 0.18 0.00 0.26 0.03 Acceleration of CEO retirement benefits - - 0.07 - Gain on insurance recovery - - (0.07) (0.14) Other, net - 0.00 0.00 0.01 Tax effect of applicable non-GAAP adjustments (1) (0.05) (0.04) (0.19) (0.02) (2) Adjusted net income per diluted common share $ 0.55 $ 0.32 $ 1.45 $ 0.80 Fiscal Three Months Ended Fiscal Year Ended October 28, October 29, October 28, October 29, 2018 2017 2018 2017 Net income applicable to common shares, GAAP basis $ 27,417 $ 17,412 $ 62,694 $ 54,399 Loss on extinguishment of debt - - 21,875 - Loss on disposition of business - - 5,673 - Goodwill impairment - 6,000 - 6,000 Restructuring and impairment charges, net 769 1,710 1,912 5,297 Strategic development and acquisition related costs 11,661 193 17,164 1,971 Acceleration of CEO retirement benefits - - 4,600 - Gain on insurance recovery - - (4,741) (9,749) Other, net - 28 (323) 591 Tax effect of applicable non-GAAP adjustments (1) (3,418) (3,093) (12,783) (1,603) (2) Adjusted net income applicable to common shares $ 36,429 $ 22,250 $ 96,071 $ 56,906 #DIV/0! #DIV/0! (1) The Company calculated the tax effect of non-GAAP adjustments by applying the combined federal and state applicable statutory tax rate for the period to each applicable non-GAAP item. (2) The Company discloses a tabular comparison of Adjusted net income per diluted common share and Adjusted net income applicable to common shares, which are non-GAAP measures, because they are referred to in the text of our press releases and are instrumental in comparing the results from period to period. Adjusted net income per diluted common share and Adjusted net income applicable to common shares should not be considered in isolation or as a substitute for net income per diluted common share and net income applicable to common shares as reported on the face of our consolidated statements of operations. 15

Business Segments (Page 1 of 2) (Dollars in thousands) Our MissionFiscal & Three Vision Months Ended Fiscal Year Ended October 28, October 29, October 28, October 29, 2018 2017 2018 2017 % of % of % of % of Total Total % Total Total % Sales Sales Change Sales Sales Change Total Sales Engineered Building Systems $ 243,997 35 $ 188,183 32 29.7% $ 798,299 33 $ 693,980 32 15.0% Metal Components 187,635 27 181,288 30 3.5% 689,344 29 636,661 30 8.3% Insulated Metal Panels 146,466 21 123,542 21 18.6% 504,413 21 441,404 21 14.3% Metal Coil Coating 117,323 17 98,550 17 19.0% 417,296 17 368,880 17 13.1% Total sales 695,421 100 591,563 100 17.6% 2,409,352 100 2,140,925 100 12.5% Less: Intersegment sales (121,787) 18 (102,837) 17 18.4% (408,775) 17 (370,647) 17 10.3% Total net sales $ 573,634 82 $ 488,726 83 17.4% $ 2,000,577 83 $ 1,770,278 83 13.0% % of % of % of % of External Sales Sales Sales Sales Sales Engineered Building Systems $ 231,315 40 $ 178,222 36 29.8% $ 755,353 38 $ 659,863 37 14.5% Metal Components 171,759 30 155,183 32 10.7% 612,645 31 544,669 31 12.5% Insulated Metal Panels 120,852 21 105,064 22 15.0% 424,762 21 372,304 21 14.1% Metal Coil Coating 49,708 9 50,257 10 -1.1% 207,817 10 193,442 11 7.4% Total extermal sales $ 573,634 100 $ 488,726 100 17.4% $ 2,000,577 100 $ 1,770,278 100 13.0% % of % of % of % of Operating Income Sales Sales Sales Sales Engineered Building Systems $ 24,859 10 $ 13,043 7 90.6% $ 66,689 8 $ 41,388 6 61.1% Metal Components 19,734 11 23,119 13 -14.6% 87,593 13 78,768 12 11.2% Insulated Metal Panels 21,025 14 14,895 12 41.2% 47,495 9 47,932 11 -0.9% Metal Coil Coating 6,962 6 1,419 1 390.6% 28,588 7 21,459 6 33.2% Corporate (33,015) - (19,150) - 72.4% (104,445) - (79,767) - 30.9% Total operating income $ 39,565 7 $ 33,326 7 18.7% $ 125,920 6 $ 109,780 6 14.7% 16
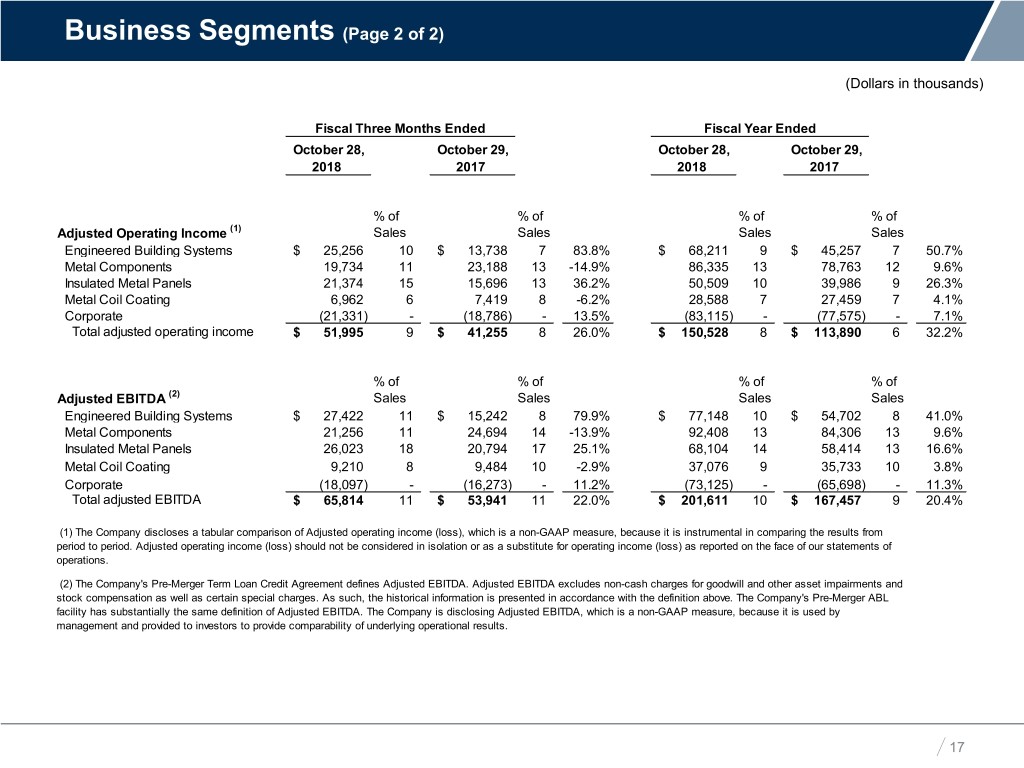
Business Segments (Page 2 of 2) (Dollars in thousands) Our Mission &Fiscal ThreeVision Months Ended Fiscal Year Ended October 28, October 29, October 28, October 29, 2018 2017 2018 2017 % of % of % of % of Adjusted Operating Income (1) Sales Sales Sales Sales Engineered Building Systems $ 25,256 10 $ 13,738 7 83.8% $ 68,211 9 $ 45,257 7 50.7% Metal Components 19,734 11 23,188 13 -14.9% 86,335 13 78,763 12 9.6% Insulated Metal Panels 21,374 15 15,696 13 36.2% 50,509 10 39,986 9 26.3% Metal Coil Coating 6,962 6 7,419 8 -6.2% 28,588 7 27,459 7 4.1% Corporate (21,331) - (18,786) - 13.5% (83,115) - (77,575) - 7.1% Total adjusted operating income $ 51,995 9 $ 41,255 8 26.0% $ 150,528 8 $ 113,890 6 32.2% % of % of % of % of Adjusted EBITDA (2) Sales Sales Sales Sales Engineered Building Systems $ 27,422 11 $ 15,242 8 79.9% $ 77,148 10 $ 54,702 8 41.0% Metal Components 21,256 11 24,694 14 -13.9% 92,408 13 84,306 13 9.6% Insulated Metal Panels 26,023 18 20,794 17 25.1% 68,104 14 58,414 13 16.6% Metal Coil Coating 9,210 8 9,484 10 -2.9% 37,076 9 35,733 10 3.8% Corporate (18,097) - (16,273) - 11.2% (73,125) - (65,698) - 11.3% Total adjusted EBITDA $ 65,814 11 $ 53,941 11 22.0% $ 201,611 10 $ 167,457 9 20.4% (1) The Company discloses a tabular comparison of Adjusted operating income (loss), which is a non-GAAP measure, because it is instrumental in comparing the results from period to period. Adjusted operating income (loss) should not be considered in isolation or as a substitute for operating income (loss) as reported on the face of our statements of operations. (2) The Company's Pre-Merger Term Loan Credit Agreement defines Adjusted EBITDA. Adjusted EBITDA excludes non-cash charges for goodwill and other asset impairments and stock compensation as well as certain special charges. As such, the historical information is presented in accordance with the definition above. The Company's Pre-Merger ABL facility has substantially the same definition of Adjusted EBITDA. The Company is disclosing Adjusted EBITDA, which is a non-GAAP measure, because it is used by management and provided to investors to provide comparability of underlying operational results. 17
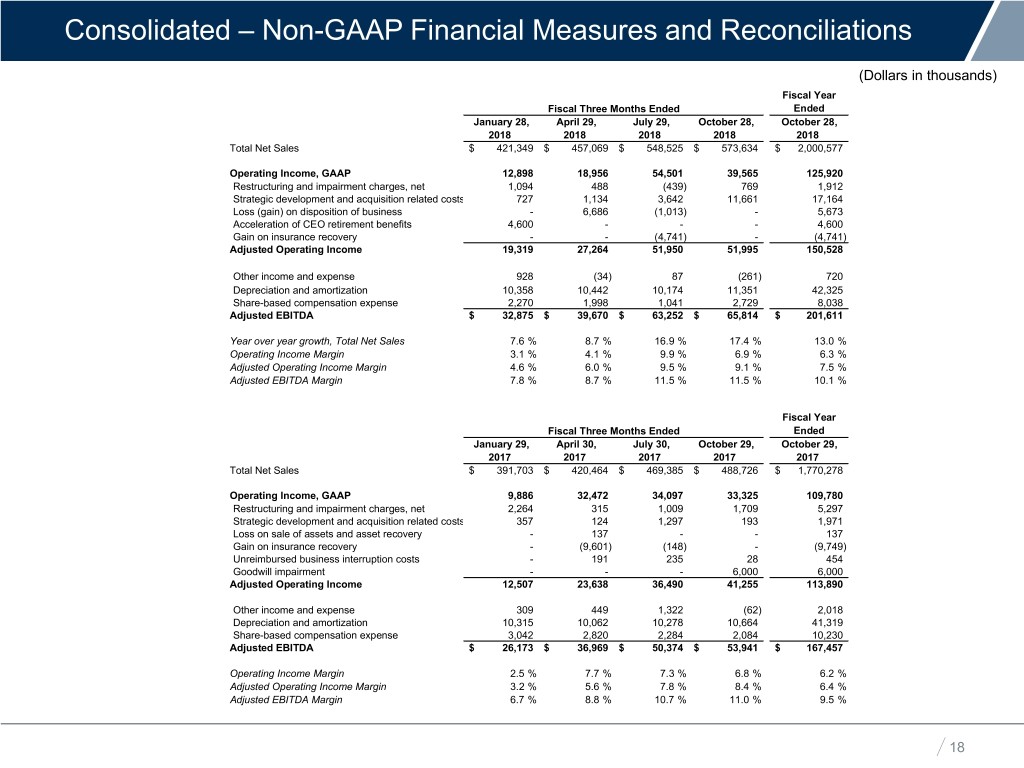
Consolidated – Non-GAAP Financial Measures and Reconciliations (Dollars in thousands) Fiscal Year Fiscal Three Months Ended Ended Our Mission & VisionJanuary 28, April 29, July 29, October 28, October 28, 2018 2018 2018 2018 2018 Total Net Sales $ 421,349 $ 457,069 $ 548,525 $ 573,634 $ 2,000,577 Operating Income, GAAP 12,898 18,956 54,501 39,565 125,920 Restructuring and impairment charges, net 1,094 488 (439) 769 1,912 Strategic development and acquisition related costs 727 1,134 3,642 11,661 17,164 Loss (gain) on disposition of business - 6,686 (1,013) - 5,673 Acceleration of CEO retirement benefits 4,600 - - - 4,600 Gain on insurance recovery - - (4,741) - (4,741) Adjusted Operating Income 19,319 27,264 51,950 51,995 150,528 Other income and expense 928 (34) 87 (261) 720 Depreciation and amortization 10,358 10,442 10,174 11,351 42,325 Share-based compensation expense 2,270 1,998 1,041 2,729 8,038 Adjusted EBITDA $ 32,875 $ 39,670 $ 63,252 $ 65,814 $ 201,611 Year over year growth, Total Net Sales 7.6 % 8.7 % 16.9 % 17.4 % 13.0 % Operating Income Margin 3.1 % 4.1 % 9.9 % 6.9 % 6.3 % Adjusted Operating Income Margin 4.6 % 6.0 % 9.5 % 9.1 % 7.5 % Adjusted EBITDA Margin 7.8 % 8.7 % 11.5 % 11.5 % 10.1 % Fiscal Year Fiscal Three Months Ended Ended January 29, April 30, July 30, October 29, October 29, 2017 2017 2017 2017 2017 Total Net Sales $ 391,703 $ 420,464 $ 469,385 $ 488,726 $ 1,770,278 Operating Income, GAAP 9,886 32,472 34,097 33,325 109,780 Restructuring and impairment charges, net 2,264 315 1,009 1,709 5,297 Strategic development and acquisition related costs 357 124 1,297 193 1,971 Loss on sale of assets and asset recovery - 137 - - 137 Gain on insurance recovery - (9,601) (148) - (9,749) Unreimbursed business interruption costs - 191 235 28 454 Goodwill impairment - - - 6,000 6,000 Adjusted Operating Income 12,507 23,638 36,490 41,255 113,890 Other income and expense 309 449 1,322 (62) 2,018 Depreciation and amortization 10,315 10,062 10,278 10,664 41,319 Share-based compensation expense 3,042 2,820 2,284 2,084 10,230 Adjusted EBITDA $ 26,173 $ 36,969 $ 50,374 $ 53,941 $ 167,457 Operating Income Margin 2.5 % 7.7 % 7.3 % 6.8 % 6.2 % Adjusted Operating Income Margin 3.2 % 5.6 % 7.8 % 8.4 % 6.4 % Adjusted EBITDA Margin 6.7 % 8.8 % 10.7 % 11.0 % 9.5 % 18
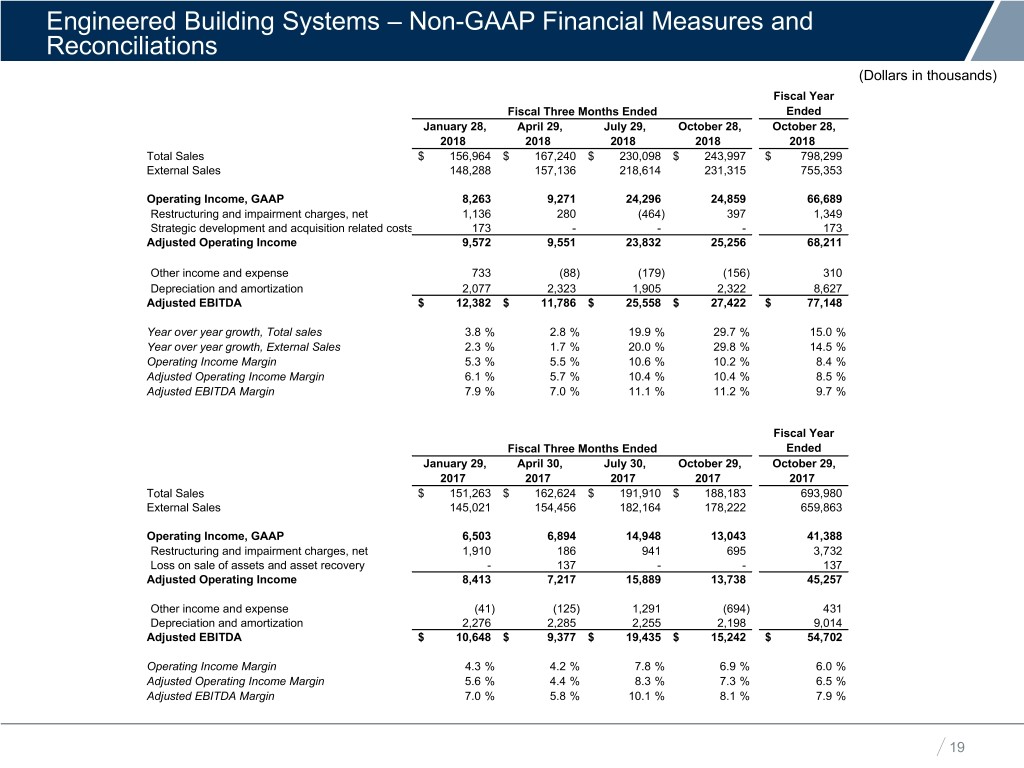
Engineered Building Systems – Non-GAAP Financial Measures and Reconciliations (Dollars in thousands) Fiscal Year Our Fiscal Three Months Ended Ended Mission & VisionJanuary 28, April 29, July 29, October 28, October 28, 2018 2018 2018 2018 2018 Total Sales $ 156,964 $ 167,240 $ 230,098 $ 243,997 $ 798,299 External Sales 148,288 157,136 218,614 231,315 755,353 Operating Income, GAAP 8,263 9,271 24,296 24,859 66,689 Restructuring and impairment charges, net 1,136 280 (464) 397 1,349 Strategic development and acquisition related costs 173 - - - 173 Adjusted Operating Income 9,572 9,551 23,832 25,256 68,211 Other income and expense 733 (88) (179) (156) 310 Depreciation and amortization 2,077 2,323 1,905 2,322 8,627 Adjusted EBITDA $ 12,382 $ 11,786 $ 25,558 $ 27,422 $ 77,148 Year over year growth, Total sales 3.8 % 2.8 % 19.9 % 29.7 % 15.0 % Year over year growth, External Sales 2.3 % 1.7 % 20.0 % 29.8 % 14.5 % Operating Income Margin 5.3 % 5.5 % 10.6 % 10.2 % 8.4 % Adjusted Operating Income Margin 6.1 % 5.7 % 10.4 % 10.4 % 8.5 % Adjusted EBITDA Margin 7.9 % 7.0 % 11.1 % 11.2 % 9.7 % Fiscal Year Fiscal Three Months Ended Ended January 29, April 30, July 30, October 29, October 29, 2017 2017 2017 2017 2017 Total Sales $ 151,263 $ 162,624 $ 191,910 $ 188,183 693,980 External Sales 145,021 154,456 182,164 178,222 659,863 Operating Income, GAAP 6,503 6,894 14,948 13,043 41,388 Restructuring and impairment charges, net 1,910 186 941 695 3,732 Loss on sale of assets and asset recovery - 137 - - 137 Adjusted Operating Income 8,413 7,217 15,889 13,738 45,257 Other income and expense (41) (125) 1,291 (694) 431 Depreciation and amortization 2,276 2,285 2,255 2,198 9,014 Adjusted EBITDA $ 10,648 $ 9,377 $ 19,435 $ 15,242 $ 54,702 Operating Income Margin 4.3 % 4.2 % 7.8 % 6.9 % 6.0 % Adjusted Operating Income Margin 5.6 % 4.4 % 8.3 % 7.3 % 6.5 % Adjusted EBITDA Margin 7.0 % 5.8 % 10.1 % 8.1 % 7.9 % 19
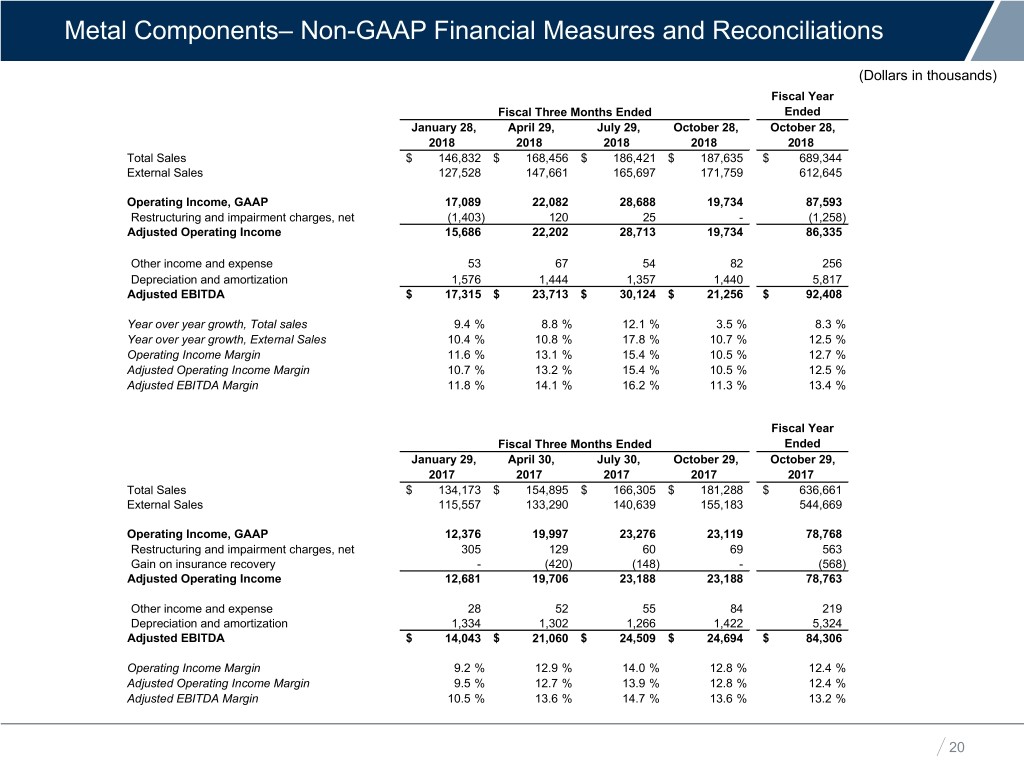
Metal Components– Non-GAAP Financial Measures and Reconciliations (Dollars in thousands) Fiscal Year Our Fiscal Three Months Ended Ended Mission & VisionJanuary 28, April 29, July 29, October 28, October 28, 2018 2018 2018 2018 2018 Total Sales $ 146,832 $ 168,456 $ 186,421 $ 187,635 $ 689,344 External Sales 127,528 147,661 165,697 171,759 612,645 Operating Income, GAAP 17,089 22,082 28,688 19,734 87,593 Restructuring and impairment charges, net (1,403) 120 25 - (1,258) Adjusted Operating Income 15,686 22,202 28,713 19,734 86,335 Other income and expense 53 67 54 82 256 Depreciation and amortization 1,576 1,444 1,357 1,440 5,817 Adjusted EBITDA $ 17,315 $ 23,713 $ 30,124 $ 21,256 $ 92,408 Year over year growth, Total sales 9.4 % 8.8 % 12.1 % 3.5 % 8.3 % Year over year growth, External Sales 10.4 % 10.8 % 17.8 % 10.7 % 12.5 % Operating Income Margin 11.6 % 13.1 % 15.4 % 10.5 % 12.7 % Adjusted Operating Income Margin 10.7 % 13.2 % 15.4 % 10.5 % 12.5 % Adjusted EBITDA Margin 11.8 % 14.1 % 16.2 % 11.3 % 13.4 % Fiscal Year Fiscal Three Months Ended Ended January 29, April 30, July 30, October 29, October 29, 2017 2017 2017 2017 2017 Total Sales $ 134,173 $ 154,895 $ 166,305 $ 181,288 $ 636,661 External Sales 115,557 133,290 140,639 155,183 544,669 Operating Income, GAAP 12,376 19,997 23,276 23,119 78,768 Restructuring and impairment charges, net 305 129 60 69 563 Gain on insurance recovery - (420) (148) - (568) Adjusted Operating Income 12,681 19,706 23,188 23,188 78,763 Other income and expense 28 52 55 84 219 Depreciation and amortization 1,334 1,302 1,266 1,422 5,324 Adjusted EBITDA $ 14,043 $ 21,060 $ 24,509 $ 24,694 $ 84,306 Operating Income Margin 9.2 % 12.9 % 14.0 % 12.8 % 12.4 % Adjusted Operating Income Margin 9.5 % 12.7 % 13.9 % 12.8 % 12.4 % Adjusted EBITDA Margin 10.5 % 13.6 % 14.7 % 13.6 % 13.2 % 20
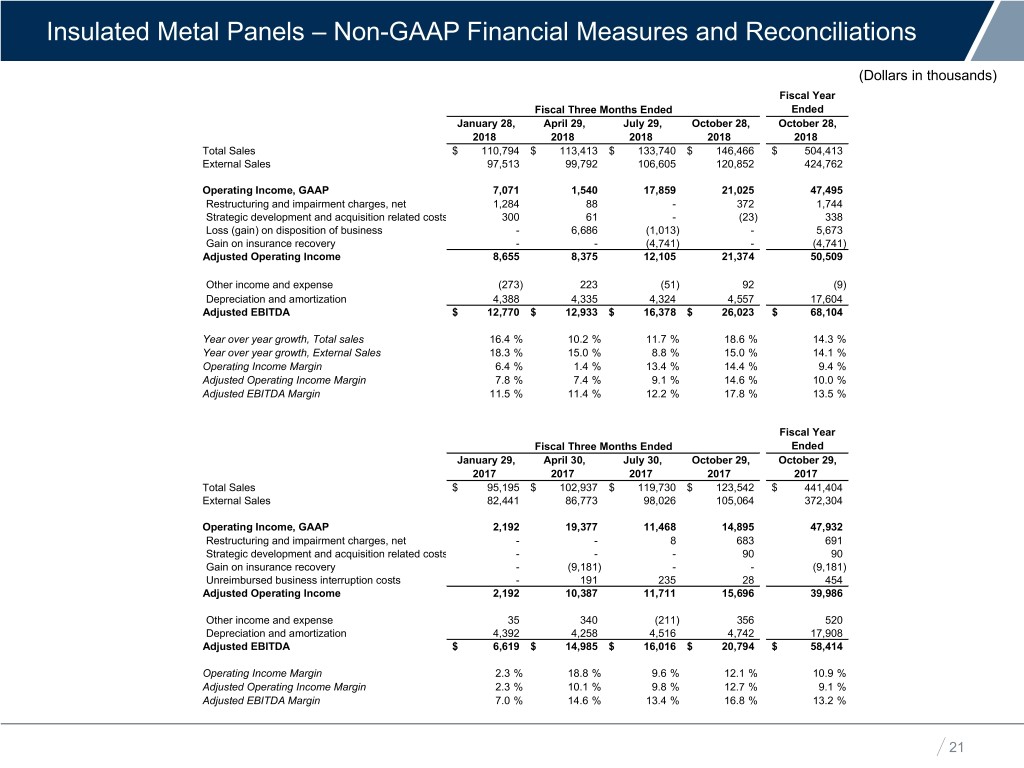
Insulated Metal Panels – Non-GAAP Financial Measures and Reconciliations (Dollars in thousands) Fiscal Year Fiscal Three Months Ended Ended Our Mission & VisionJanuary 28, April 29, July 29, October 28, October 28, 2018 2018 2018 2018 2018 Total Sales $ 110,794 $ 113,413 $ 133,740 $ 146,466 $ 504,413 External Sales 97,513 99,792 106,605 120,852 424,762 Operating Income, GAAP 7,071 1,540 17,859 21,025 47,495 Restructuring and impairment charges, net 1,284 88 - 372 1,744 Strategic development and acquisition related costs 300 61 - (23) 338 Loss (gain) on disposition of business - 6,686 (1,013) - 5,673 Gain on insurance recovery - - (4,741) - (4,741) Adjusted Operating Income 8,655 8,375 12,105 21,374 50,509 Other income and expense (273) 223 (51) 92 (9) Depreciation and amortization 4,388 4,335 4,324 4,557 17,604 Adjusted EBITDA $ 12,770 $ 12,933 $ 16,378 $ 26,023 $ 68,104 Year over year growth, Total sales 16.4 % 10.2 % 11.7 % 18.6 % 14.3 % Year over year growth, External Sales 18.3 % 15.0 % 8.8 % 15.0 % 14.1 % Operating Income Margin 6.4 % 1.4 % 13.4 % 14.4 % 9.4 % Adjusted Operating Income Margin 7.8 % 7.4 % 9.1 % 14.6 % 10.0 % Adjusted EBITDA Margin 11.5 % 11.4 % 12.2 % 17.8 % 13.5 % Fiscal Year Fiscal Three Months Ended Ended January 29, April 30, July 30, October 29, October 29, 2017 2017 2017 2017 2017 Total Sales $ 95,195 $ 102,937 $ 119,730 $ 123,542 $ 441,404 External Sales 82,441 86,773 98,026 105,064 372,304 Operating Income, GAAP 2,192 19,377 11,468 14,895 47,932 Restructuring and impairment charges, net - - 8 683 691 Strategic development and acquisition related costs - - - 90 90 Gain on insurance recovery - (9,181) - - (9,181) Unreimbursed business interruption costs - 191 235 28 454 Adjusted Operating Income 2,192 10,387 11,711 15,696 39,986 Other income and expense 35 340 (211) 356 520 Depreciation and amortization 4,392 4,258 4,516 4,742 17,908 Adjusted EBITDA $ 6,619 $ 14,985 $ 16,016 $ 20,794 $ 58,414 Operating Income Margin 2.3 % 18.8 % 9.6 % 12.1 % 10.9 % Adjusted Operating Income Margin 2.3 % 10.1 % 9.8 % 12.7 % 9.1 % Adjusted EBITDA Margin 7.0 % 14.6 % 13.4 % 16.8 % 13.2 % 21
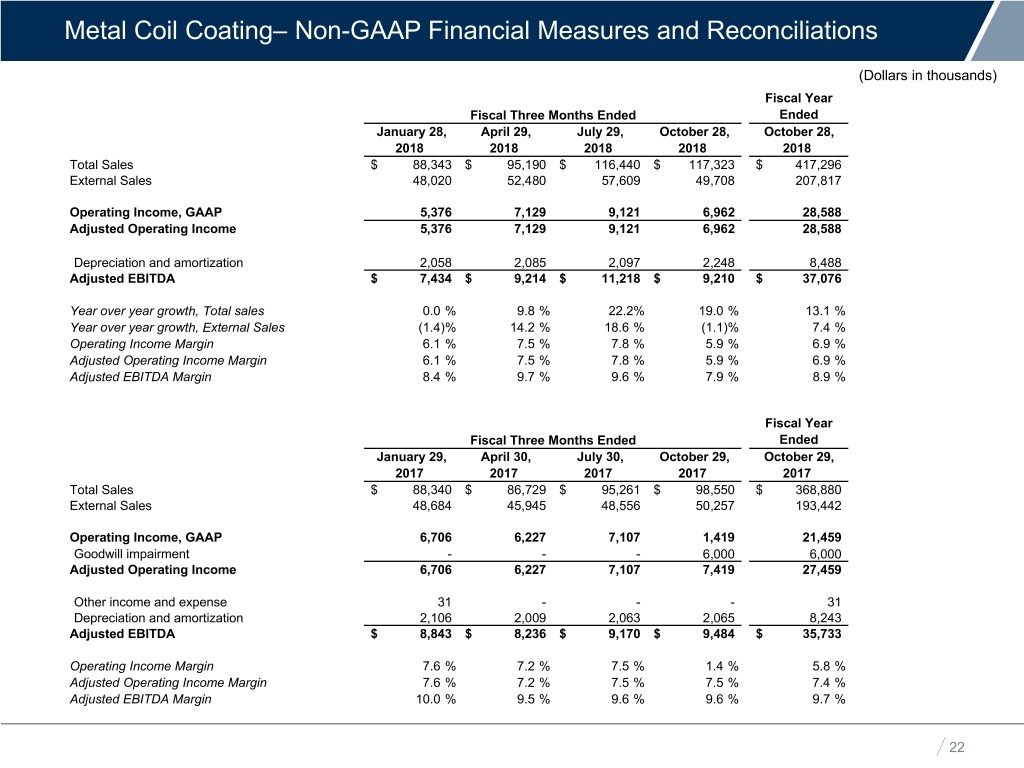
Metal Coil Coating– Non-GAAP Financial Measures and Reconciliations (Dollars in thousands) Fiscal Year Our Mission & VisionFiscal Three Months Ended Ended January 28, April 29, July 29, October 28, October 28, 2018 2018 2018 2018 2018 Total Sales $ 88,343 $ 95,190 $ 116,440 $ 117,323 $ 417,296 External Sales 48,020 52,480 57,609 49,708 207,817 Operating Income, GAAP 5,376 7,129 9,121 6,962 28,588 Adjusted Operating Income 5,376 7,129 9,121 6,962 28,588 Depreciation and amortization 2,058 2,085 2,097 2,248 8,488 Adjusted EBITDA $ 7,434 $ 9,214 $ 11,218 $ 9,210 $ 37,076 Year over year growth, Total sales 0.0 % 9.8 % 22.2% 19.0 % 13.1 % Year over year growth, External Sales (1.4)% 14.2 % 18.6 % (1.1)% 7.4 % Operating Income Margin 6.1 % 7.5 % 7.8 % 5.9 % 6.9 % Adjusted Operating Income Margin 6.1 % 7.5 % 7.8 % 5.9 % 6.9 % Adjusted EBITDA Margin 8.4 % 9.7 % 9.6 % 7.9 % 8.9 % Fiscal Year Fiscal Three Months Ended Ended January 29, April 30, July 30, October 29, October 29, 2017 2017 2017 2017 2017 Total Sales $ 88,340 $ 86,729 $ 95,261 $ 98,550 $ 368,880 External Sales 48,684 45,945 48,556 50,257 193,442 Operating Income, GAAP 6,706 6,227 7,107 1,419 21,459 Goodwill impairment - - - 6,000 6,000 Adjusted Operating Income 6,706 6,227 7,107 7,419 27,459 Other income and expense 31 - - - 31 Depreciation and amortization 2,106 2,009 2,063 2,065 8,243 Adjusted EBITDA $ 8,843 $ 8,236 $ 9,170 $ 9,484 $ 35,733 Operating Income Margin 7.6 % 7.2 % 7.5 % 1.4 % 5.8 % Adjusted Operating Income Margin 7.6 % 7.2 % 7.5 % 7.5 % 7.4 % Adjusted EBITDA Margin 10.0 % 9.5 % 9.6 % 9.6 % 9.7 % 22
Our Mission & Vision K. DARCEY MATTHEWS Vice President, Investor Relations E: darcey.matthews@ncigroup.com 281.897.7785 ncibuildingsystems.com
