Attached files
| file | filename |
|---|---|
| EX-32.2 - EXHIBIT 32.2 - DATAWATCH CORP | tv508536_ex32-2.htm |
| EX-32.1 - EXHIBIT 32.1 - DATAWATCH CORP | tv508536_ex32-1.htm |
| EX-31.2 - EXHIBIT 31.2 - DATAWATCH CORP | tv508536_ex31-2.htm |
| EX-31.1 - EXHIBIT 31.1 - DATAWATCH CORP | tv508536_ex31-1.htm |
| EX-23.1 - EXHIBIT 23.1 - DATAWATCH CORP | tv508536_ex23-1.htm |
| EX-21.1 - EXHIBIT 21.1 - DATAWATCH CORP | tv508536_ex21-1.htm |
UNITED STATES
SECURITIES AND EXCHANGE COMMISSION
WASHINGTON, D.C. 20549
FORM 10-K
| x | ANNUAL
REPORT PURSUANT TO SECTION 13 OR 15(d) OF THE SECURITIES EXCHANGE ACT OF 1934
FOR THE FISCAL YEAR ENDED SEPTEMBER 30, 2018 OR |
| ¨ | TRANSITION
REPORT PURSUANT TO SECTION 13 OR 15(d) OF THE SECURITIES EXCHANGE ACT OF 1934
FOR THE TRANSITION PERIOD FROM TO |
COMMISSION FILE NUMBER: 000-19960
DATAWATCH CORPORATION
(Exact name of registrant as specified in its charter)
| DELAWARE | 02-0405716 | |
| (State or Other Jurisdiction of | (I.R.S. Employer | |
| Incorporation or Organization) | Identification No.) |
4 CROSBY DRIVE
BEDFORD, MASSACHUSETTS 01730
(978) 441-2200
(Address and telephone number of principal executive office)
SECURITIES REGISTERED PURSUANT TO SECTION 12(b) OF THE ACT:
| Common Stock $0.01 par value per share | NASDAQ CAPITAL MARKET | ||
| (Title of each class) | (Name of Exchange on which Registered) |
SECURITIES REGISTERED PURSUANT TO SECTION 12(g) OF THE ACT: NONE
Indicate by check mark if the registrant is a well-known seasoned issuer, as defined in Rule 405 of the Securities Act. Yes ¨ No x
Indicate by check mark if the registrant is not required to file reports pursuant to Section 13 or Section 15(d) of the Act. Yes ¨ No x
Indicate by check mark whether the registrant (1) has filed all reports required to be filed by Section 13 or 15(d) of the Securities Exchange Act of 1934 during the preceding 12 months (or for such shorter period that the registrant was required to file such reports), and (2) has been subject to such filing requirements for the past 90 days. Yes x No ¨
Indicate by check mark whether the registrant has submitted electronically every Interactive Data File required to be submitted pursuant to Rule 405 of Regulation S-T during the preceding 12 months (or for such shorter period that the registrant was required to submit such files). Yes x No ¨
Indicate by check mark if disclosure of delinquent filers pursuant to Item 405 of Regulation S-K is not contained herein, and will not be contained, to the best of registrant’s knowledge, in definitive proxy or information statements incorporated by reference in Part III of this Form 10-K or any amendment to this Form 10-K. ¨
Indicate by check mark whether the registrant is a large accelerated filer, an accelerated filer, a non-accelerated filer or a smaller reporting company. See the definitions of “large accelerated filer”, “accelerated filer,” “smaller reporting company” and “emerging growth company” in Rule 12b-2 of the Exchange Act.
Large accelerated filer ¨ Accelerated filer x
Non-accelerated filer ¨
Smaller reporting company ¨ Emerging Growth Company ¨
If an emerging growth company, indicate by check mark if the registrant has elected not to use the extended transition period for complying with any new or revised financial accounting standards provided pursuant to Section 13(a) of the Exchange Act. ¨
Indicate by check mark whether the registrant is a shell company (as defined in Exchange Act Rule 12b-2).Yes ¨ No x
The aggregate market value of voting stock held by non-affiliates of the registrant, based on the closing price of the registrant’s common stock on March 31, 2018, the last business day of the Company’s most recently completed second fiscal quarter, as reported by the NASDAQ Capital Market was $91,645,305.
The number of shares of the registrant’s common stock, $0.01 par value, outstanding as of December 6, 2018 was 12,815,227.
Documents Incorporated By Reference
Registrant intends to file a definitive Proxy Statement pursuant to Regulation 14A within 120 days of the end of the fiscal year ended September 30, 2018. Portions of such Proxy Statement are incorporated by reference in Part III of this report.
DATAWATCH CORPORATION
ANNUAL REPORT ON FORM 10-K
TABLE OF CONTENTS
| 2 |
AGREEMENT TO BE ACQUIRED BY ALTAIR
On November 5, 2018, we announced an agreement to be acquired by an entity affiliated with Altair Engineering Inc. (together with its affiliates, “Altair”) pursuant to an Agreement and Plan of Merger (the “Merger Agreement”), dated as of November 5, 2018, by and among Datawatch, Dallas Merger Sub, Inc., a Delaware corporation (“Purchaser”) and Altair, pursuant to which, among other things, Purchaser has completed a tender offer (the “Offer”) to purchase all of the outstanding shares (the “Shares”) of Datawatch common stock, $0.01 par value, at a price of $13.10 per share, without interest and subject to any required withholding taxes (the “Offer Price”). Subject to the satisfaction or waiver of the remaining conditions set forth in the Merger Agreement, Purchaser will merge with and into Datawatch (the “Merger”, and together with the Offer, the “Transactions”) without a meeting or vote of the stockholders of Datawatch in accordance with Section 251(h) of the General Corporation Law of the State of Delaware (the “DGCL”), with Datawatch continuing as the surviving corporation in the Merger as a subsidiary of Altair. At the effective time of the Merger (the “Effective Time”), any Shares not purchased pursuant to the Offer (other than Shares (i) owned by stockholders who are entitled to demand and properly demand appraisal in accordance with Section 262 of the DGCL in connection with the Merger, (ii) then owned by Datawatch or owned both at the commencement of the Offer and at the Effective Time by any wholly owned subsidiary of Datawatch and (iii) irrevocably accepted for purchase in the Offer or owned both at the commencement of the Offer and at the Effective Time by Altair, Purchaser or any other wholly owned subsidiary of Altair) will be automatically converted into the right to receive the Offer Price, net to the seller in cash, without interest and less any applicable withholding taxes.
Consummation of the Merger is subject to various conditions set forth in the Merger Agreement, including, but not limited to the receipt of required approvals, waivers and consents, and other conditions set forth in Annex I to the Merger Agreement. The Merger is not subject to any financing condition.
GENERAL
Datawatch Corporation (NASDAQ-CM: DWCH) (“Datawatch”, “We”, “Us”, “Our”) is a leading provider of self-service data preparation and visual data discovery software. Datawatch began offering self-service data preparation solutions more than 25 years ago to help companies unlock data from multiple sources so that it can be used for analytic tasks. Since then, the sources and variety of data – as well as its volume – have grown significantly and are predicted to continue to grow, posing greater challenges for businesses that depend on accessing data to derive business insights. Today, Datawatch focuses on delivering software that enables users to uncover valuable insights that improve both business outcomes and user productivity. With Datawatch software, businesses can quickly access, prepare and blend structured data from relational databases, enterprise applications, big data systems, etc. along with semi-structured sources like XML, HTML, enterprise reports, PDF files and EDI streams. Additionally, real-time streaming data can be leveraged into visually rich analytic applications to dynamically discover key factors that impact their business operations. Organizations of many sizes and in many different industries use Datawatch products, including 99 of the Fortune 100. Datawatch is headquartered in Bedford, Massachusetts, with offices in New York, Toronto, London, Stockholm, Singapore, and Manila, and with partners and customers in more than 100 countries worldwide.
Datawatch is a Delaware corporation, formed in 1986, with executive offices located at 4 Crosby Drive, Bedford, MA 01730 and our telephone number is (978) 441-2200. Periodic reports, proxy statements and other information are available to the public, free of charge, on our website, www.datawatch.com, as soon as reasonably practicable after they have been filed with the SEC and through the SEC’s website, www.sec.gov. Such reports, proxy statements and other information may be obtained by visiting the Public Reference Room of the SEC at 100 F Street, N.E., Washington, DC 20549 or by calling the SEC at 1-800-SEC-0330.
| 3 |
OUR MARKET
Datawatch’s self-service data analytics platform is a critical component of the business analytics software market. Within the broader Big Data and analytics software market, Datawatch’s solutions are focused on the business intelligence and analytic tools and analytic data integration markets.
We sell and compete within the data preparation, predictive analytics and visualization markets, which are each emerging and fast-growing segments of the overall business analytics space. Over the past several years, the business analytics market has evolved from large systems implemented and managed by IT, to more agile, self-service systems owned and operated by business functions. Datawatch’s products are ideal for any combination of users, from single business analyst, to team, to entire enterprise, enabling organizations to respond rapidly to business needs with comprehensive data analysis.
Self-service data preparation addresses the needs of business users who are creating and analyzing data without IT intervention. Analysts must access, clean and blend data from a wide variety of systems before it can be visualized. It is estimated that up to 80% of user time is spent preparing data rather than analyzing that data, diminishing analyst productivity. Because so much time is dedicated to preparing data, it is estimated that only 12% of an organization’s data is used in business decision-making. Datawatch products enhance productivity by enabling customers to solve difficult and time-consuming data preparation challenges with simple drag-and-drop, or mouse clicks. Datawatch also facilitates and enables IT’s data governance needs by centralizing and controlling access to data and curated data assets. Furthermore, Datawatch solutions can be deployed at any scale across an entire enterprise, on premise as well as in ‘the cloud.’
The visual data discovery market continues to evolve with new requirements that make Datawatch’s solutions more relevant. While ease of use remains a critical factor in the adoption of visualization technologies, successful platforms today must also offer users the ability to develop visualizations and acquire, prepare, automate and manage any source of data used in visual data discovery applications. Datawatch’s extensive experience in these areas, as well as other growing outlets such as social media, enables users to attain high value results for many mission critical purposes. For example, the increased use of NoSQL data and other multi-structured sources, coupled with the desire for a more manageable and governed deployment of visualization solutions, are also driving additional changes in industries such as capital markets, government, retail, and telecommunications.
OUR PRODUCTS
The Datawatch product family enables businesses to maximize the ability to analyze all of their information assets, regardless of the form in which that data exists. Moreover, the Datawatch Monarch product family spans the needs from a single user working at a desktop through a workgroup, team or business unit and can scale all the way to an enterprise-wide platform server delivering prepared data to thousands of users, internal and external. With high levels of governance controls embedded in the Datawatch product family, decisions about which users can access what data and integration with other platforms, such as Tableau Server, IBM Watson Analytics or a data warehouse, are simple. Datawatch Monarch and Swarm self-service data preparation solutions are the first step in unlocking value from data contained in a wide variety of sources. Datawatch Panopticon enables real-time visualization of streaming data for fast data analysis. Datawatch Angoss solutions enables citizen data scientists to build predictive models in an easy graphical user interface, requiring no coding or scripting.
Our principal product line of solutions includes the following:
| 4 |
Datawatch Monarch™ — Access and Prepare Data from Virtually Any Source
Datawatch Monarch is a self-service data preparation tool that allows users to explore, manipulate and merge new data sources quickly and easily. With Datawatch Monarch, users can bring all the data that is needed to manage a business to life, whether that information is stored in structured sources like databases, or in less conventional places like unstructured or semi-structured content including PDF files, reports, EDI or HTML files.
Monarch Server extends the data preparation capabilities of Monarch to provide a comprehensive, enterprise-wide solution. Models created with Monarch on the desktop can be stored and shared on a centrally managed server that runs on premise. Data preparation tasks can be fully automated and prepared data delivered to all users and systems. Monarch Server puts data acquisition, preparation and distribution on autopilot. With a visual process designer to quickly orchestrate automation flows, users can execute processes on a predetermined schedule or as new information becomes available. Prepared data is instantly delivered to users via email or a web portal, and other systems like data warehouses and analytics tools can be loaded with fresh data.
Datawatch Swarm™ – A New Team-Driven Approach to Analytics
Datawatch Swarm is a new-generation browser-based platform offering team-driven data preparation and a centralized data marketplace to speed collaboration and drive data governance across the enterprise. The platform invites broad participation across the organization, and the features of controlled collaboration and governance reduce the burden on IT at the same time they increase the agility for end users to manipulate the data without compromising its integrity. Furthermore, the powerful data socialization tools provide better data discovery and enable users to automate and reuse models and curated data sets.
Datawatch Panopticon™ — Visually Design, Discover and Explore New Insights
Datawatch Panopticon is designed for situations where fast data analysis is critical to a business. It allows users to quickly start asking questions to see hidden patterns, spot problems and identify missed opportunities without programming or scripting. Our in-memory analytics engine enables on-the-fly aggregations and intuitive navigation and integration of data from virtually any data source. With a simple drag-and-drop interface, users can set up hierarchies and filters in their dashboards to make it easier to spot outliers and to see how different subsets of data correlate with each other. Datawatch Panopticon provides a range of specialized visualizations designed specifically to make analyzing streaming data, time series data and historical data, more meaningful. Integrated data preparation capabilities and pre-built connectors make it simple to access and combine information from any data source, including data streams from message brokers and complex event processing engines. Products in the Panopticon family include Datawatch Panopticon Designer and Datawatch Panopticon Server.
Datawatch Angoss – Powerful Predictive Analytics & Data Science Platform
Datawatch Angoss solutions enable organizations to make forward-thinking decisions with confidence using patented, Predictive Analytics and Machine Learning techniques. The visual and guided experience and auto-code generation allows individuals of all skill levels to quickly and easily utilize all phases of the data science cycle – from data transformation and profiling to modeling and deployment. With a user interface that can convey information to individuals of any technical aptitude and a diverse portfolio of code languages, the platform enables transparency in communication and collaboration over advanced analytic results.
OUR SERVICES
Datawatch complements its core products with a range of services and information to ensure successful deployment and usage of our self-service data preparation, predictive analytics and visual data discovery software. This includes educational services for customers and partners implementing and learning about the platform, maintenance and support, and professional services to provide in-depth technical assistance for software implementations.
| 5 |
Educational Services
Datawatch educational services offers easily accessed training opportunities to customers and partners to support the knowledge and skills development they need to optimize their investment in Datawatch’s self-service data preparation, visual data discovery and predictive analytics software. Datawatch offers an array of live and virtual classroom instruction, including private onsite classes, as well as live customer training sessions in different locations where users can learn from each other as well as Datawatch. Courses include training on all aspects of our software, from beginning model building basics to the deployment of sophisticated dashboards sourced from data harvested by our platform. In addition, Datawatch provides white papers, tutorials, webinars, data sheets, videos and other resources to assist customers in better utilizing our software.
Professional Services
To optimize rapid time-to-value, the Datawatch professional services team supports customers and partners with more in-depth technical consulting and best practices about our platform, including advanced modeling, application design, implementation and configuration and process optimization.
Customer Support
As part of their purchase of a perpetual license to Datawatch’s software platform, Datawatch’s customers obtain one year of software maintenance and support and have the option to annually renew their maintenance agreements. These annual maintenance agreements provide customers with software updates on a when-and-if available basis, maintenance releases and patches, and access to telephone support services. The maintenance agreement also allows access to an on-line user forum where experienced users from around the world can share their tips and tricks. Customers who purchase a subscription license receive the same support and benefits as perpetual license customers for the term of their contract.
MARKETING, SALES AND DISTRIBUTION STRATEGY
We market and sell our products and services through our direct sales force, a distribution channel and an indirect sales channel comprised of a global partner network. Our direct sales force consists of professional sales and pre-sales personnel who typically have several years of experience selling and demonstrating enterprise software solutions. Our distribution channel is predominantly for our Datawatch Monarch product and consists of a single tier reselling network. Our global partner network brings significant technological and industry expertise, as well as added geographic presence, that enable us to reach customer organizations around the world. These indirect sales channels often help to shorten sales cycles with prospective customers.
Our global partner network includes system integrators, technology alliance partners and strategic, geographic and product-specific resellers. Resellers are typically authorized to sell licenses, implement and, in some instances, provide first line support for our software products. System integrators, technology alliance partners, implementation partners and referral partners may also sell licenses and provide complementary skills, domain or industry experience, as well as expanded local, national or global geographic coverage.
Our global partner network also includes original equipment manufacturer (“OEM”) partners and value-added reseller (“VAR”) partners who use our technologies as embedded or bundled add-on features in their products and services. Typically, OEM and VAR partners include software companies, SaaS vendors and information providers. More broadly, this category includes any organization seeking to leverage Datawatch products to access and analyze semi-structured and unstructured data for use in an existing or new product or in a service offering. We support these business relationships with development and business resources to ensure that Datawatch products are optimized and certified for leading technology platforms, allowing our customers to benefit from these expanded solutions with seamless integration. Selected partners include organizations such as Tableau, IBM, Sage, Baker Tilly and Dell.
We support our global partner network in three primary ways:
| · | enabling partners through sales training, demonstration training, technical support and education; |
| · | marketing with and for partners through lead generation programs, customer marketing and awareness; and, |
| 6 |
| · | positioning and selling Datawatch products with effective sales tools and sales support. |
As of September 30, 2018, our global partner network was comprised of nearly 100 partners worldwide. No one partner or customer accounted for more than 10% of our total revenue for the year ended September 30, 2018 or 2016. One partner accounted for 12% of total revenue for the year ended September 30, 2017.
Our software products are sold under warranty against certain defects in material and workmanship. If necessary, we would provide for the estimated cost of warranties based on specific warranty claims and claim history. However, we have never incurred significant expense under our product or service warranties. As a result, we believe our exposure related to these warranty agreements is minimal. Accordingly, we have no liabilities recorded for warranty claims as of September 30, 2018 and 2017.
Our go-to-market approach includes a blend of expanding our penetration within existing customers and securing new customers through a ‘land and expand’ sales model. Our marketing efforts are focused on generating qualified sales leads for our direct sales force and our global partners, increasing brand awareness, communicating our positioning in the market and promoting product advantages. We rely on a variety of marketing initiatives to achieve our goals. In addition, we work closely with our global partners on co-marketing and lead generation initiatives to broaden our marketing reach.
Our revenues from outside of the United States primarily reflect sales through the direct sales force of our wholly-owned subsidiaries, Angoss Software Corporation, which is located in Canada, Angoss Software Limited, which is located in the United Kingdom, Datawatch International Limited, which is located in the United Kingdom, and its subsidiaries which are located in Germany, Singapore and Australia, and Datawatch AB, which is located in Sweden, as well as through international resellers. Such international sales represented 20%, 17% and 14% of our total revenue for fiscal 2018, 2017 and 2016, respectively. Further geographic information is included in Note 9, “Segment Information and Revenue by Geographic Location,” to our accompanying consolidated financial statements.
OUR RESEARCH AND DEVELOPMENT OPERATIONS
We are committed to leading our sector in innovation, as evidenced by our recent launch of next generation Monarch Swarm as well as updated releases of both Monarch Server and Panopticon. We believe that timely development of new products and enhancements to our existing products are essential in a dynamic market to respond to new customer challenges and new types of data. We intend to continue to invest significant amounts in research and product development to ensure that our products meet our customers’ current and future demands as well as to take advantage of evolving technology trends.
Our product managers work closely with developers, whether independent or in-house, to define product specifications. The initial concept for a product originates from this cooperative effort. The developer is generally responsible for coding the development project. Our product managers maintain close technical control over the products, giving us the freedom to designate which modifications and enhancements are most important and when they should be implemented. The product managers and staff work in parallel with developers to produce printed documentation, on-line help files, tutorials and installation software. In some cases, we may subcontract a portion of this work on a project basis to third-party suppliers under contracts. Our personnel also perform extensive quality assurance testing for all products and coordinate external beta test programs.
Datawatch products have been developed through in-house software development, by offshore software development companies hired under contract or by acquisition. We maintain source code and full product control for these products.
Our total engineering and product development expense was $11.4 million, $8.9 million and $8.2 million for fiscal years 2018, 2017 and 2016, respectively.
| 7 |
OUR COMPETITION
Datawatch’s self-service data preparation, predictive analytics and visual data discovery software competes within the broad and highly competitive business analytics market and specifically the data visualization market. While we believe that there is no single competitor that addresses the full range of capabilities of our software, we face competition from several companies that are offering, or soon may offer, products that compete with portions or aspects of our software.
Competitors can be classified into four broad categories:
| · | Large software companies, including suppliers of traditional business intelligence products that provide one or more capabilities that are competitive with our products, such as IBM, Microsoft, SAS, Oracle and SAP. |
| · | New and emerging vendors focused more specifically on data preparation, such as Informatica, Alteryx, Paxata and Trifacta. |
| · | Business analytics vendors focused on real-time visualization, such as First Derivatives and Zoomdata. |
| · | Independent vendors that focus on extracting specific data formats or sources such as machine data, data in content management systems, EDI, XBRL, HTML and PDFs. These competitors include Splunk, Actuate (Xenos) and Informatica, among others. |
We believe that generally, we compete favorably with respect to these companies and competitive offerings; however, some current and potential competitors have advantages over us, including:
| · | longer operating histories, |
| · | significantly greater financial, technical, marketing or other resources, |
| · | stronger brand and business user recognition, and |
| · | broader global distribution and presence. |
Competition in our industry is likely to intensify as current competitors expand their product lines and as new competitors enter the market.
OUR EMPLOYEES
As of September 30, 2018, we had 188 full-time and 1 part-time employees, including 74 engaged in marketing and sales; 36 engaged in product consulting, training and technical support; 55 engaged in product management, development and quality assurance; and 24 providing general, administrative, accounting, IT and software production and warehousing functions.
OTHER BUSINESS CONSIDERATIONS
Product Protection
We rely on a combination of patents, trade secrets, copyright and trademark laws, nondisclosure and other contractual agreements and technical measures to protect our rights to such proprietary technology. With respect to patents, on June 30, 2015, we applied with the United States Patent and Trademark Office (USPTO) for U.S. patent protection of our proprietary systems and methods for automatically generating tables using auto-generated templates. This application is currently pending. Moreover, on January 12, 2016, we applied with the USPTO for U.S. patent protection of our proprietary systems and methods for generating tables from print-ready digital source documents. A first patent (U.S. Patent No. 9,703,706) was issued in this case on July 11, 2017, and a continuation application is pending. In addition, we may from time to time apply for additional patents with the USPTO to protect other proprietary systems and methods of our technology. Despite these precautions, unauthorized parties may attempt to copy aspects of our products or to obtain and use information that we regard as proprietary. We believe that, because of the rapid pace of technological change in the software industry, the legal protections for our products are less significant than the knowledge, ability and experience of our employees and developers, the frequency of product enhancements and the timeliness and quality of our support services. We believe that none of our products, trademarks, and other proprietary rights infringes on the proprietary rights of third parties, but there can be no assurance that third parties will not assert infringement claims against us in the future.
| 8 |
Backlog
Our software products are generally shipped within three business days of receipt of an order. Accordingly, we do not believe that backlog for our product is a meaningful indicator of future business. We do maintain a backlog of services commitments primarily related to Datawatch Monarch Server and Datawatch Report Manager On-Demand business. While this services backlog will provide future revenue to Datawatch, we believe that it is not a meaningful indicator of future business.
We do not provide forecasts of our future financial performance. However, from time to time, information provided by us or statements made by our employees may contain “forward looking” information that involves risks and uncertainties. In particular, statements contained in this Annual Report on Form 10-K that are not historical facts (including, but not limited to statements contained in “Item 7. Management’s Discussion and Analysis of Financial Condition and Results of Operations” of Part II of this Annual Report on Form 10-K relating to liquidity and capital resources) may constitute forward looking statements and are made under the safe harbor provisions of The Private Securities Litigation Reform Act of 1995. We caution readers not to place undue reliance on any such forward looking statements, which speak only as of the date they are made. We disclaim any obligation, except as specifically required by law and the rules of the Securities and Exchange Commission, to publicly update or revise any such statements to reflect any change in our expectations or in events, conditions or circumstances on which any such statements may be based, or that may affect the likelihood that actual results will differ from those set forth in the forward-looking statements. Our actual results of operations and financial condition have varied and may in the future vary significantly from those stated in any forward looking statements. Factors that may cause such differences include, without limitation, the risks, uncertainties and other information discussed below and within this Annual Report on Form 10-K, as well as the accuracy of our internal estimates of revenue and operating expense levels. The following discussion of our risk factors should be read in conjunction with the financial statements contained herein and related notes thereto. Such factors, among others, may have a material adverse effect upon our business, results of operations and financial condition.
Risks Related to Our Agreement to be Acquired by Altair
The pendency of our agreement to be acquired by Altair could have an adverse effect on our business.
On November 5, 2018, we announced an agreement to be acquired by an entity affiliated with Altair Engineering Inc. (together with its affiliates, “Altair”) pursuant to an Agreement and Plan of Merger (the “Merger Agreement”), dated as of November 5, 2018, by and among Datawatch, Dallas Merger Sub, Inc., a Delaware corporation (“Purchaser”) and Altair, pursuant to which, among other things, Purchaser has completed a tender offer (the “Offer”) to purchase all of the outstanding shares (the “Shares”) of Datawatch common stock, $0.01 par value, at a price of $13.10 per share, without interest and subject to any required withholding taxes (the “Offer Price”). Subject to the satisfaction or waiver of the remaining conditions set forth in the Merger Agreement, Purchaser will merge with and into Datawatch (the “Merger”, and together with the Offer, the “Transactions”) without a meeting or vote of the stockholders of Datawatch in accordance with Section 251(h) of the General Corporation Law of the State of Delaware (the “DGCL”), with Datawatch continuing as the surviving corporation in the Merger as a subsidiary of Altair. At the effective time of the Merger (the “Effective Time”), any Shares not purchased pursuant to the Offer (other than Shares (i) owned by stockholders who are entitled to demand and properly demand appraisal in accordance with Section 262 of the DGCL in connection with the Merger, (ii) then owned by Datawatch or owned both at the commencement of the Offer and at the Effective Time by any wholly owned subsidiary of Datawatch and (iii) irrevocably accepted for purchase in the Offer or owned both at the commencement of the Offer and at the Effective Time by Altair, Purchaser or any other wholly owned subsidiary of Altair) will be automatically converted into the right to receive the Offer Price, net to the seller in cash, without interest and less any applicable withholding taxes.
| 9 |
Consummation of the Merger is subject to various conditions set forth in the Merger Agreement, including, but not limited to the receipt of required approvals, waivers and consents, and other conditions set forth in Annex I to the Merger Agreement. The Merger is not subject to any financing condition.
The announcement and pendency of the acquisition by Altair could cause disruption in the business, including experiencing (i) the potential loss or disruption of commercial relationships prior to the completion of the Transactions, or (ii) a potential negative effect on our ability to retain management, sales and other key personnel as a result of the announcement of the Transactions.
The Merger Agreement generally requires us to operate our business in the ordinary course of business pending consummation of the Merger, but includes certain contractual restrictions on the conduct of our business. In addition, the pendency of the acquisition by Altair and the completion of the conditions to consummation of the Offer and the Merger could divert the time and attention of our management.
All of the matters described above, alone or in combination, could materially and adversely affect our business, financial condition, results of operations and stock price.
The failure to complete the Transactions with Altair could adversely affect our business.
We cannot provide assurance that our pending acquisition by Altair will be completed. If the Transactions are not completed, the share price of our common stock may drop to the extent that the current market price of our common stock reflects an assumption that the Transactions will be completed. On November 2, 2018, the last business day before the announcement of the Transactions, our stock’s closing price was $9.69. On November 5, 2018, following the announcement of the Transactions, our stock’s closing price was $13.09.
Our ability to consummate the Transactions may be affected by any of the following:
| · | fewer than 50 percent of the Shares then outstanding being tendered into the Offer; |
| · | the occurrence of events or circumstances constituting a “material adverse effect” on the Company; and |
| · | the failure to satisfy any of the other closing conditions by the end date specified in the Merger Agreement. |
There can be no assurance that our business or our financial condition will not be adversely affected, as compared to the condition prior to the announcement of the Transactions, if the Transactions are not consummated.
Risks Relating to our Business
A Weak Global Economy and Softening in the Computer Software Market May Result in Decreased Revenues or Lower Revenue Growth Rates
The growth and profitability of our business depends on the overall demand for computer software and services, particularly in the financial services markets and other markets in which we compete. Tighter credit and negative financial news that may result from challenging economic conditions worldwide and in the U.S. have an adverse effect on capital spending by corporations, including the demand for computer software. Because our sales are primarily to major corporate customers, poor economic conditions may soften the demand for computer software and services which may result in decreased revenues, lower revenue growth rates and reduced profitability. In addition, a weak global economy may result in longer sales cycles, reduced, deferred or cancelled orders, or greater than anticipated uncollectible accounts receivables. In a weakened economy, we cannot be assured that we will be able to effectively promote future growth in our software and services revenues or operate profitably.
| 10 |
Our Dependence on our Principal Products, our Failure to Develop Enhanced or New Products and our Concentration of Customers within the Financial Sector May Have a Material Adverse Effect on our Business, Financial Condition or Results of Operations
Our future financial performance will depend in part on the successful introduction of new and enhanced versions of these products and development of new versions of these and other products and subsequent customer acceptance of such new and enhanced products. We are primarily dependent on our ability to successfully market and sell our self-service data preparation and visual data discovery products. Currently customers in the financial sector, and particularly in capital markets, comprise a significant portion of our customer base. Any factor adversely affecting the financial sector and capital markets in particular could adversely affect sales of our products within such sector, which could have a material adverse effect on us.
Fluctuations in Quarterly Operating Results Could Have a Material Adverse Effect on our Business, Financial Condition or Results of Operations
Our future operating results could vary substantially from quarter-to-quarter because of uncertainties and/or risks associated with such matters as current economic conditions, technological change, competition, delays in the introduction of new products or product enhancements, and market acceptance of those new products and product enhancements, and general market trends. In addition, as we focus on increasing enterprise sales to large customers, the timing of significant orders may cause fluctuations in quarterly operating results. Large enterprise sales arrangements often involve multiple elements and may require more complex accounting than the sales transactions we have entered into in the past, which also makes projecting future operating results more difficult. Historically, we have operated with minimal backlog of orders because our software products are generally shipped as orders are received. As a result, sales in any quarter are substantially dependent on orders booked and shipped in that quarter. Further, any increases in sales under our subscription sales model or cloud-enabled offering could result in decreased revenues over the short term. Because our staffing and operating expenses are based on anticipated revenue levels and a high percentage of our costs are fixed in the short-term, small variations in the timing of revenues can cause significant variations in operating results from quarter-to-quarter. In addition, at September 30, 2018, we had $5.3 million of unrecognized compensation costs related to RSUs, which are expected to be recognized over a weighted-average period of 2.03 years, which costs will have a negative effect on our profitability on a GAAP reporting basis. Because of these factors, we believe that period-to-period comparisons of our results of operations are not necessarily meaningful and should not be relied upon as indications of future performance. We can give no assurance that we will not experience such variations in operating results in the future or that such variations will not have a material adverse effect on our business, financial condition or results of operations.
The Sales Cycle for our Enterprise Products is Long and Unpredictable, Particularly with Respect to Large Customers, and our Sales Efforts Require Considerable Time and Expense
Our operating results may fluctuate, in part, because of the resource intensive nature of our sales efforts, the length and variability of the sales cycle of our enterprise software licensing offerings and the short-term difficulty in adjusting our operating expenses. Our operating results depend in part on sales to large customers and conversions of users that have downloaded the desktop version of our Datawatch Monarch software into enterprise customers. The length of our sales cycle, from initial evaluation to delivery of and payment for the software license, varies substantially from customer to customer. It is difficult to predict exactly when, or even if, we will make a sale with a potential customer or if a user that has licensed desktop versions of our Datawatch Monarch software will upgrade to a larger server license. As a result, large individual sales may, in some cases, occur in quarters subsequent to those we anticipate, or not at all. The loss or delay of one or more large transactions in a quarter could impact our operating results for that quarter and any future quarters for which revenue from that transaction is delayed. As a result of these factors, it is difficult for us to forecast our revenues accurately in any quarter. Because a substantial portion of our expenses are relatively fixed in the short-term, our operating results will suffer if revenues fall below our expectations in a particular quarter, which could cause the price of our common stock to decline.
| 11 |
If we are Unable to Attract New Customers and Expand Sales to Existing Customers, our Growth Could be Slower than we Expect and our Business May Be Harmed.
Our future growth depends in part upon increasing our customer base. Our ability to achieve significant growth in revenues in the future will depend, in large part, upon the effectiveness of our marketing efforts, both domestically and internationally, and our ability to attract new customers. If we fail to attract new customers and maintain and expand those customer relationships, our revenues will grow more slowly than expected and our business operations and financial results will be harmed.
Our future growth also depends upon expanding sales of our products to and renewing license and maintenance agreements with existing customers. In particular, part of our sales strategy is to leverage our desktop Monarch data preparation product to drive enterprise sales of our managed analytics platform. In order for us to improve our operating results, it is important that our existing customers make additional significant purchases of our products. If our customers do not purchase additional licenses or capabilities, our revenues may grow more slowly than expected, may not grow at all or may decline. Our customers’ renewal rates may decline or fluctuate as a result of a number of factors, including their satisfaction or dissatisfaction with our products or services, our pricing or pricing structure, the pricing or capabilities of products or services offered by our competitors, the effects of economic conditions, or reductions in our customers’ spending levels. If our customers do not renew their agreements with us, or renew on terms less favorable to us, our revenues may decline and our business operations and financial results may be harmed.
The Markets for our Self-Service Data Preparation, Data Visualization and Predictive Analytics Products May Not Grow at the Level We Anticipate
Because the markets for our self-service data preparation, visual data discovery and predictive analytics products are evolving, it is difficult to predict customer adoption and renewal rates, customer demand for our enterprise software licenses, the size and growth rate of these markets, the entry of competitive products or the success of existing competitive products. Any expansion in our markets depends on a number of factors, including the cost, performance and perceived value associated with such software licenses. If the markets for our enterprise software licenses do not achieve widespread adoption or there is a reduction in demand for software in these markets caused by a lack of customer acceptance, technological challenges, competing technologies and products, decreases in corporate spending, weakening economic conditions, or otherwise, it could result in reduced customer orders, reduced renewal rates or decreased revenues, any of which would adversely affect our business operations and financial results.
Dependence on New Product Introductions and New Product Delays or Defects Could Have a Material Adverse Effect on our Business
The markets for data preparation, visual data discovery and predictive analytics products are evolving rapidly. Growth in our business depends in substantial part on the continuing introduction of new products, to address the emerging needs of this market. The length of product life cycles depends in part on end-user demand for new or additional functionality in our products and our ability to update our products to meet such demands. If we fail to accurately anticipate the demand for, or encounter any significant delays in developing or introducing, new products or additional functionality in our products, there could be a material adverse effect on our business. Our product life cycles can also be affected if suppliers of software systems with which we interact introduce new or changed functionality within their products. Our failure to anticipate the introduction of additional functionality in products developed by such suppliers could have a material adverse effect on our business. In addition, our competitors may introduce products with more features and lower prices than our products. Such increase in competition could adversely affect the life cycles of our products, which in turn could have a material adverse effect on our business.
Software products, whether developed internally or licensed from third parties, may contain undetected errors or failures when first introduced or as new versions are released. There can be no assurance that, despite testing by us and by current and potential end-users, errors will not be found in new products after commencement of commercial shipments, resulting in loss of or delay in market acceptance. Any failure by us to anticipate or respond adequately to changes in technology and customer preferences, or any significant delays in product development or introduction, could have a material adverse effect on our business.
| 12 |
A Significant Percentage of our Total Revenue is Subject to Risks Associated with International Sales
In the years ended September 30, 2018, 2017 and 2016, international sales accounted for 20%, 17% and 14%, respectively, of our total revenue. We anticipate that international sales will continue to account for a significant percentage of our total revenue. A significant portion of our total revenue will therefore be subject to risks associated with international sales, including deterioration of international economic conditions, unexpected changes in legal and regulatory requirements, changes in tariffs, currency exchange rates and other import or export controls, political and economic instability, possible effects of war and acts of terrorism, difficulties in accounts receivable collection, difficulties in managing distributors or representatives, difficulties in staffing and managing international operations, difficulties in protecting our intellectual property overseas, seasonality of sales and potentially adverse foreign tax consequences.
On June 23, 2016, the United Kingdom held a referendum in which United Kingdom voters approved an exit from the European Union commonly referred to as “Brexit”. The announcement of Brexit caused significant volatility in global stock markets and currency exchange rate fluctuations that resulted in the strengthening of the U.S. dollar against foreign currencies in which we conduct business. The formal process for United Kingdom leaving the European Union began in March 2017, when the United Kingdom served notice to the European Council under Article 50 of the Treaty of Lisbon. The long-term nature of the United Kingdom’s relationship with the European Union is unclear and there is considerable uncertainty when any relationship will be agreed and implemented. The long term effects of Brexit will depend on any agreements the United Kingdom makes to retain access to European Union markets either during a transitional period or more permanently. The measures could potentially disrupt the markets we serve and may cause our customers to closely monitor their costs and reduce their spending budget on our products and services. In addition, Brexit could lead to legal uncertainty and potentially divergent national laws and regulations as the United Kingdom determines which European Union laws to replace or replicate. Given the lack of comparable precedent, it is unclear what financial, trade and legal implications the withdrawal of the United Kingdom from the European Union would have and how such withdrawal would affect us. Adverse consequences such as deterioration in economic conditions, volatility in currency exchange rates, and prohibitive laws and regulations could have a negative impact on our business, operating results, and financial condition.
Any future acquisitions made by us will be subject to a number of related costs and challenges that could have a material adverse effect on our business and results of operations.
We have recently completed an acquisition of Angoss Software Corporation. Achieving the anticipated benefits of an acquisition depends upon whether the integration of the acquired business, products or technology is accomplished efficiently and effectively. In addition, successful acquisitions generally require, among other things, integration of product offerings, manufacturing operations and coordination of sales and marketing efforts. These difficulties can become more challenging due to the need to coordinate geographically separated organizations, the complexities of the technologies being integrated, and the necessities of integrating personnel with disparate business backgrounds and combining different corporate cultures. The integration of operations following an acquisition also requires the dedication of management resources, which may distract attention from our day-to-day business and may disrupt key marketing or sales efforts. Our inability to successfully integrate any of our acquisitions could harm our business. The existing products previously sold by entities we have acquired may be of a lesser quality than our products or could contain errors that produce incorrect results on which users rely or cause failure or interruption of systems or processes that could subject us to liability claims that could have a material adverse effect on our operating results or financial position. Furthermore, products acquired in connection with acquisitions may not gain acceptance in our markets, and we may not achieve the anticipated or desired benefits of such transactions.
Future Acquisitions May be Difficult to Integrate, Disrupt our Business, Dilute Stockholder Value or Divert Management Attention
In the future, we could acquire additional products, technologies or businesses, or enter into joint venture arrangements, for the purpose of complementing or expanding our business and to address the need to develop new products. Integrating the operations of an acquired company, product or business successfully or otherwise realizing the anticipated benefits of an acquisition, including additional revenue opportunities, involves a number of challenges and risks. The failure to meet these integration challenges could seriously harm our results of operations, and the market price of our common stock may decline as a result. Realizing the benefits of an acquisition will depend in part on the integration of technology, operations, personnel and sales activity of the two companies. These integration activities are complex and time-consuming, and we may encounter unexpected difficulties or incur unexpected costs, including:
| 13 |
| · | challenges in combining product offerings, including integration of the underlying technology, and sales and marketing activities; |
| · | our inability to achieve the cost savings and operating synergies anticipated in the transaction, which would prevent us from achieving the positive earnings gains expected as a result of the transaction; |
| · | diversion of management attention from ongoing business concerns to integration matters; |
| · | difficulties in consolidating and rationalizing information technology platforms and administrative infrastructures; |
| · | complexities in managing a larger and more geographically dispersed company than before the completion of transaction; |
| · | difficulties in the assimilation of personnel and the integration of two business cultures; |
| · | challenges in demonstrating to our customers and to customers of the acquired company that the transaction will not result in adverse changes in product and technology offerings, customer service standards or business focus; and |
| · | possible cash flow interruption or loss of revenue as a result of change of ownership transitional matters. |
Changes in accounting principles and guidance could result in unfavorable accounting charges or effects.
We prepare our consolidated financial statements in accordance with accounting principles generally accepted in the United States. These principles are subject to interpretation by the Securities and Exchange Commission and various bodies formed to create and interpret appropriate accounting principles and guidance. A change in these principles or guidance, or in their interpretations, may have a material effect on our reported results, as well as our processes and related controls, and may retroactively affect previously reported results. For example, during May 2014, the Financial Accounting Standards Board (“FASB”) issued Accounting Standards Update (“ASU”) No. 2014-09, Revenue from Contracts with Customers (Topic 606). We adopted Topic 606 using the full retrospective transition method when it became effective for us on October 1, 2018. See Note 1 to our accompanying consolidated financial statements for information about Topic 606.
Any Future Impairments of Our Assets Could Negatively Impact Our Results of Operations.
Non-amortizing intangible assets, including goodwill, are tested for impairment annually or whenever events or changes in circumstances indicate that the carrying value may not be recoverable. An impairment test is also required for other long-lived assets if events or changes in circumstances indicate that the carrying value may not be recoverable. Examples of events or changes in circumstances indicating that the carrying value of such intangible assets may not be recoverable could include a significant adverse long term outlook; unanticipated competition or the introduction of disruptive technology; failure of an anticipated product or product line; testing for recoverability in accordance with the FASB Accounting Standards Codification (“ASC”) 360-10 Impairment or Disposal of Long-Lived Assets; loss of key personnel; or a more-likely-than-not expectation that a significant portion of the company will be sold or otherwise disposed of. Any future impairment of goodwill, other intangible assets, or other long-lived assets, and the performance issues underlying any such impairment, could have a negative impact on our profitability and financial results.
If Material Weaknesses or Other Deficiencies are Discovered in our Internal Accounting Procedures, our Stock Price May be Adversely Affected
Section 404 of the Sarbanes-Oxley Act requires that management report annually on the effectiveness of our internal control over financial reporting and identify any material weaknesses in our internal control and financial reporting environment. If management identifies any material weaknesses, their correction could require remedial measures which could be costly and time-consuming. In addition, the presence of material weaknesses could result in financial statement errors which in turn could require us to restate our financial statements. Any identification by us or our independent registered public accounting firm of material weaknesses, even if quickly remedied, could damage investor confidence in the accuracy and completeness of our financial reports, which could affect our stock price and potentially subject us to litigation.
| 14 |
The continuous process of maintaining and adapting our internal controls and complying with Section 404 is expensive and time-consuming, and requires significant management attention. We cannot be sure that our internal control measures will continue to provide adequate control over our financial processes and reporting and ensure compliance with Section 404. Any failure by us to comply with Section 404 could subject us to a variety of administrative sanctions and harm our reputation, which could reduce our stock price.
We Face Significant Competition in the Software Industry
Our self-service data preparation, visual data discovery and predictive analytics products compete with those of other companies in the Big Data and business analytics markets. These markets are highly competitive and include companies such as Tableau Software, TIBCO Spotfire (a subsidiary of TIBCO Software Inc.), Qlik Technologies, Inc., Informatica, Alteryx, Paxata, Trifacta, RapidMiner, KNIME and First Derivatives, as well as larger technology companies such as IBM, SAP, MicroStrategy, Inc., SAS and Oracle. Many of these competitors have longer operating histories, greater name recognition and/or substantially greater financial, marketing and technological resources than we do. No assurance can be given that our business will have the resources required to compete successfully in the future. In addition, many of these competitors have strong relationships with current and potential customers and extensive knowledge of the business analytics industry. As a result, they may be able to respond more quickly to new or emerging technologies and changes in customer requirements. If we are unable to compete successfully against current and future competitors, the business, results of operations and financial condition of the combined business would be harmed. In addition, competitive pressures or other factors may result in significant price erosion that could have a material adverse effect on our business, financial condition, results of operations, or cash flows.
Maintaining and enhancing the Datawatch brand and our reputation is critical to our relationships with our customers and channel partners and to our ability to attract new customers and channel partners. We believe that the importance of our brand recognition and reputation will continue to increase as competition in our market increases. The failure to maintain or enhance our brand recognition or reputation would likely adversely affect our business and results of operations.
Our Success is Dependent on Proprietary Software Technology
Our success is dependent upon proprietary software technology. We rely on a combination of patents, trade secrets, copyright and trademark laws, nondisclosure and other contractual agreements and technical measures to protect our rights to such proprietary technology. With respect to patents, on June 30, 2015, we applied with the United States Patent and Trademark Office (USPTO) for U.S. patent protection of our proprietary systems and methods for automatically generating tables using auto-generated templates. This application is currently pending. Moreover, on January 12, 2016, we applied with the USPTO for U.S. patent protection of our proprietary systems and methods for generating tables from print-ready digital source documents. A first patent (U.S. Patent No. 9,703,706) was issued in this case on July 11, 2017, and a continuation application is pending. Despite such precautions, there can be no assurance that such steps will be adequate to deter misappropriation of such technology.
Our Use of Open Source Software Could Negatively Affect our Ability to Sell our Products and Subject us to Possible Litigation.
We use open source software in our products and expect to continue to use open source software in the future. We may face claims from others claiming ownership of, or seeking to enforce the terms of, an open source license, including by demanding release of the open source software, derivative works or our proprietary source code that was developed using such software. These claims could also result in litigation, require us to purchase costly licenses or require us to devote additional research and development resources to change our products, any of which would have a negative effect on our business and operating results. In addition, if the license terms for the open source code change, we may be forced to re-engineer our products or incur additional costs. Finally, we cannot assure that we have incorporated additional open source software in our products in a manner that is consistent with our current policies and procedures.
| 15 |
We May be Subject to Intellectual Property Rights Claims by Third Parties, Which are Extremely Costly to Defend, Could Require us to Pay Significant Damages and Could Limit our Ability to use Certain Technologies.
Companies in the software and technology industries, including some of our current and potential competitors, own large numbers of patents, copyrights, trademarks and trade secrets and frequently enter into litigation based on allegations of infringement or other violations of intellectual property rights. We may receive notices that claim we have misappropriated, misused or infringed other parties’ intellectual property rights, and, to the extent we gain greater market visibility, we face a higher risk of being the subject of intellectual property infringement claims, which is not uncommon with respect to the business analytics software market.
There may be third-party intellectual property rights, including issued or pending patents that cover significant aspects of our technologies or business methods. Any intellectual property claims, with or without merit, could be very time-consuming, could be expensive to settle or litigate and could divert our management’s attention and other resources. These claims could subject us to significant liability for damages, potentially including treble damages if we are found to have willfully infringed patents or copyrights. Such claims could also result in our having to stop using technology found to be in violation of a third party’s rights or to seek a license to use such technology, which may not be available on reasonable terms or may require us to pay significant royalties, increasing our operating expenses. As a result, we may need to develop alternative non-infringing technology, which could require significant effort and expense. If we cannot license or develop technology for any infringing aspect of our business, we would be forced to limit or stop sales of our software and may be unable to compete effectively. Any of these outcomes would adversely affect our business operations and financial results.
Government Regulation of the Internet and e-commerce and of the International Exchange of Certain Technologies is Subject to Possible Unfavorable Changes, and our Failure to Comply with Applicable Regulations Could Harm our Business and Operating Results
As Internet commerce continues to evolve, increasing regulation by federal, state or foreign governments becomes more likely. For example, increased regulation is likely in the area of data privacy, and laws and regulations applying to the solicitation, collection, processing or use of personal or consumer information could affect our customers’ ability to use and share data, potentially reducing demand for our products and services. In addition, taxation of products and services provided over the Internet or other charges by government agencies or by private organizations for accessing the Internet may also be imposed. Any regulation imposing greater fees for Internet use or restricting the exchange of information over the Internet could result in reduced growth or a decline in the use of the Internet and could diminish the viability of our Internet-based services, which could harm our business and operating results.
Risks associated with data privacy issues, including evolving laws and regulations and associated compliance efforts, may adversely impact our business
The laws and regulations relating to personal data constantly evolve, as federal, state and foreign governments continue to adopt new measures addressing data privacy and processing (including collection, storage, transfer, disposal and use) of personal data. Moreover, the interpretation and application of many existing or recently enacted privacy and data protection laws and regulations in the European Union, the U.S. and elsewhere are uncertain and fluid, and it is possible that such laws and regulations may be interpreted or applied in a manner that is inconsistent with our existing data management practices or the features of our products and services. Any such new laws or regulations, any changes to existing laws and regulations and any such interpretation or application may affect demand for our products and services, impact our ability to effectively transfer data across borders in support of our business operations, or increase the cost of providing our products and services. Additionally, any actual or perceived breach of such laws or regulations may subject us to claims and may lead to administrative, civil, or criminal liability, as well as reputational harm to our Company and its employees. We could also be required to fundamentally change our business activities and practices, or modify our products and services, which could have an adverse effect on our business.
In the U.S., various laws and regulations apply to the collection, processing, transfer, disposal, unauthorized disclosure and security of personal data. For example, data protection laws passed by most states within the U.S. require notification to users when there is a security breach for personal data. Additionally, the Federal Trade Commission (FTC) and many state attorneys general are interpreting federal and state consumer protection laws as imposing standards for the online collection, use, transfer and security of data. The U.S. Congress and state legislatures, along with federal regulatory authorities have recently increased their attention to matters concerning personal data, and this may result in new legislation which could increase the cost of compliance. In addition to government regulation, privacy advocacy and industry groups may propose new and different self-regulatory standards that either legally or contractually apply to us or our clients.
| 16 |
In the European Union, some of our operations are subject to the European Union’s General Data Protection Regulation (GDPR), which took effect from May 25, 2018. The GDPR introduces a number of new obligations for subject companies and we will need to continue dedicating financial resources and management time to GDPR compliance in the coming months. The GDPR enhances the obligations placed on companies that control or process personal data including, for example, expanded disclosures about how personal data is to be used, new mechanisms for obtaining consent from data subjects, new controls for data subjects with respect to their personal data (including by enabling them to exercise rights to erasure and data portability), limitations on retention of personal data and mandatory data breach notifications. Additionally, the GDPR places companies under new obligations relating to data transfers and the security of the personal data they process. The GDPR provides that supervisory authorities in the European Union may impose administrative fines for certain infringements of the GDPR of up to EUR 20,000,000 or 4% of an undertaking’s total, worldwide, annual turnover of the preceding financial year, whichever is higher. Individuals who have suffered damage as a result of a subject company’s non-compliance with the GDPR also have the right to seek compensation from such company. Given the breadth of the GDPR, compliance with its requirements is likely to continue to require significant expenditure of resources on an ongoing basis, and there can be no assurance that the measures we have taken for the purposes of compliance will be successful in preventing breach of the GDPR. Given the potential fines, liabilities and damage to our reputation in the event of an actual or perceived breach of the GDPR, such a breach may have an adverse effect on our business and operations.
Outside of the U.S. and the European Union, many jurisdictions have adopted or are adopting new data privacy laws that may impose further onerous compliance requirements, such as data localization, which prohibits companies from storing outside the jurisdiction data relating to resident individuals. The proliferation of such laws within the jurisdictions in which we operate may result in conflicting and contradictory requirements, particularly in relation to evolving technologies such as cloud computing. Any failure to successfully navigate the changing regulatory landscape could result in legal liability or impairment to our reputation in the marketplace, which could have a material adverse effect on our business, results of operations and financial condition.
Privacy-related claims or lawsuits initiated by governmental bodies, customers or other third parties, whether meritorious or not, could be time consuming, result in costly regulatory proceedings, litigation, penalties and fines, or require us to change our business practices, sometimes in expensive ways, or other potential liabilities. Unfavorable publicity regarding our privacy practices could injure our reputation, harm our ability to keep existing customers or attract new customers or otherwise adversely affect our business, assets, revenue, brands and reputation.
We May Not be Able to Hire and Retain Highly Skilled Employees, Which Could Affect our Ability to Compete Effectively Because our Business is Technology-Based
Qualified personnel are in great demand throughout the software industry. Our success depends, in large part, upon our ability to attract, train, motivate and retain highly skilled employees, particularly technical personnel and product development and professional services personnel, sales and marketing personnel and other senior personnel. Our failure to attract and retain the highly trained technical personnel that are integral to our product development, professional services and sales and marketing teams may limit the rate at which we can generate sales and develop new products or product enhancements. We have hired a number of key executives during the past three years, including key executives in sales, marketing, finance and human resources functions. A loss of these personnel or other changes in key management could have a material adverse effect on our business, operating results and financial condition.
| 17 |
Evolving Regulation of Corporate Governance and Public Disclosure May Result in Additional Expenses and Continuing Uncertainty
Changing laws, regulations and standards relating to corporate governance and public disclosure, including the Dodd-Frank Wall Street Reform and Consumer Protection Act of 2010, the Sarbanes-Oxley Act of 2002 and related SEC regulations as well as the listing standards of the NASDAQ Stock Market, have created and are continuing to create uncertainty for public companies. We continually evaluate and monitor developments with respect to new and proposed rules and cannot predict or estimate the amount of the additional costs incurred or the timing of such costs. These new or changed laws, regulations and standards are subject to varying interpretations, in many cases due to their lack of specificity, and as a result, their application in practice may evolve over time as new guidance is provided by regulatory and governing bodies. This could result in continuing uncertainty regarding compliance matters and higher costs necessitated by ongoing revisions to disclosure and governance practices. We are committed to maintaining high standards of corporate governance and public disclosure. As a result, we have invested resources to comply with evolving laws, regulations and standards. This investment has resulted and may continue to result in increased general and administrative expenses and a diversion of management time and attention from revenue-generating activities to compliance activities. If our efforts to comply with new or changed laws, regulations and standards differ from the activities intended by regulatory or governing bodies due to ambiguities related to practice, regulatory authorities may initiate legal proceedings against us and we may be harmed.
The Failure of Indirect Distribution Channels Could Have a Material Adverse Effect on our Operating Results
We sell a significant portion of our products through distributors, value-added resellers, OEMs and other business partners, none of which are under our direct control. Sales to indirect distribution channels accounted for 37%, 36% and 35%, of total sales for fiscal years 2018, 2017 and 2016, respectively. No one partner or customer accounted for more than 10% of our total revenue for the year ended September 30, 2018. The loss of major distributors or resellers of our products, or a significant decline in their sales, could have a material adverse effect on our operating results. We actively seek to develop new distributor and reseller relationships on the basis of their business credentials and their ability to add value through expertise in specific vertical markets or application programming expertise, although there can be no assurance that we will be able to attract or retain qualified distributors or resellers or that the distributors or resellers will be able to effectively sell our products. In addition, we may rely on resellers to provide post-sales service and support, and any deficiencies in such service and support could adversely affect our business.
Our Subscription Sales Model for our Enterprise Products Could Result in Decreased or Delayed Revenues and Cash Flows
We sell our enterprise products through the sale of perpetual licenses and through a subscription pricing model. The subscription pricing model allows customers to use our products at a lower initial cost of software acquisition when compared to the more traditional perpetual license sale. Although the subscription sales model is designed to increase the number of enterprise solutions sold and also reduce dependency on short-term sales by building a recurring revenue stream, it introduces increased risks for us primarily associated with the timing of revenue recognition and reduced cash flows. Currently, the subscription model delays revenue recognition when compared to the typical perpetual license sale and could result in decreased revenue for solutions sold under the model if we experience a high percentage of subscription cancellations following the first 12 months of the subscription. Further, as amounts due from customers are invoiced annually over the life of the subscription, there are delayed cash flows from subscription sales when compared to perpetual license sales. Upon adoption of Topic 606, revenue for performance obligations will generally be recognized as they are satisfied. See Note 1 to our accompanying consolidated financial statements for information about Topic 606.
If our Security Measures are Breached or Other Unauthorized Access to Customer Data is Otherwise Obtained, our Software May be Perceived as not being Secure, Customers May Reduce the Use of or Stop Using our Software, and we May Incur Significant Liabilities
Our software, when installed on our customer’s premises, may involve the storage and transmission of customer data, and security breaches could result in the loss of this information, litigation, indemnity obligations and other liability. While we have taken steps to protect the confidential information that we have access to, including confidential information we may obtain through our customer support services or customer usage of our products, we do not have the ability to monitor or review the content that our customers store, and therefore, we have no direct control over the substance of that content. Therefore, if customers use our software for the transmission or storage of personally identifiable information and our security measures are breached as a result of third-party action, employee error, malfeasance or otherwise, our reputation could be damaged, our business may suffer, and we could incur significant liability. Because techniques used to obtain unauthorized access or sabotage systems change frequently and generally are not identified until they are launched against a target, we may be unable to anticipate these techniques or to implement adequate preventative measures. Further, while we have taken steps to maintain compliance with laws and regulations relating to privacy and data security, including the adoption of internationally recognized standards of data protection and security, the loss, retention or misuse of certain information and/or alleged violations of such laws and regulations may expose us to significant liability. Any or all of these issues could negatively impact our ability to attract new customers and increase engagement by existing customers, cause existing customers to elect to not renew their subscriptions, or subject us to third-party lawsuits, regulatory fines or other action or liability, thereby adversely affecting our financial results.
| 18 |
We May Require Additional Capital to Grow our Business, and Our Financing Arrangements Expose us to Interest Rate and Default Risk
Our business may require additional capital to operate and expand. Over the past few years, we have relied upon cash generated from operations and debt financing to satisfy our capital needs and finance growth. If we determine in the future to make significant investments in our business, including by acquiring assets or businesses from third parties, we may attempt to raise additional funds by securing additional debt financing or selling equity securities in either the public or the private markets. As the financial markets change and new regulations come into effect, the cost of acquiring financing and the methods of financing may change. We may not be able to obtain additional debt or equity financing on favorable terms, if at all. If we raise additional equity financing, our security holders may experience significant dilution of their ownership interests and the value of shares of our common stock could decline. If we engage in debt financing, we may be required to accept terms that restrict our ability to incur additional indebtedness, force us to maintain specified liquidity or other ratios or restrict our ability to make acquisitions. Our inability to do any of the foregoing could reduce our ability to compete successfully and adversely affect our results of operations. Changes in our credit rating or other market factors may increase our interest expense or other costs of capital, or capital may not be available to us on acceptable terms to fund our needs.
Catastrophic Events May Adversely Affect Our Business
Our company is a highly automated business which relies on our network infrastructure and enterprise applications, internal technology systems and website for development, marketing, operational, support and sales activities. A disruption or failure of these systems in the event of a major storm, earthquake, fire, telecommunications failure, cyber-attack, terrorist attack or other catastrophic event could cause system interruptions, reputational harm, delays in our product development and loss of critical data and could affect our ability to sell and deliver products and services and other critical functions of our business.
Risks Relating to an Investment in our Common Stock
The Market Price of our Stock Has Been and May Continue to Be Volatile
The market price of our common stock has been, and may continue to be, volatile. Our stock price may be adversely affected by many factors, including:
| · | failure to consummate the transactions contemplated by the Merger Agreement with Altair; |
| · | actual or anticipated fluctuations in our operating results; |
| · | increased competition; |
| · | general market conditions; |
| · | announcements of technical innovations; |
| · | announcements related to the Board’s review of strategic alternatives to increase shareholder value; |
| · | new products or services offered by us, our suppliers or our competitors; |
| · | expenses or other difficulties associated with assimilating companies acquired by us; |
| · | changes in the mix of sales channels; |
| · | the timing of significant customer orders; |
| · | changes in estimates or recommendations by securities analysts of our future financial performance, failure to obtain analyst coverage of our common stock or our failure to achieve analyst earnings estimates; |
| · | the issuance of additional shares to obtain financing or for acquisitions; |
| 19 |
| · | our compliance with SEC and NASDAQ rules and regulations, including the Sarbanes-Oxley Act of 2002; |
| · | trading volume of our common stock; |
| · | the timing of stock sales under 10b5-1 plans or otherwise by our shareholders in the future; and |
| · | political instability, natural disasters, war and/or events of terrorism. |
Even though we do not presently provide forecasts of our future financial performance, any shortfall in revenue or earnings from the levels anticipated by securities analysts or investors could have an immediate and significant adverse effect on the market price of our common stock in any given period. In addition, the stock market has from time to time experienced extreme price and volume fluctuations, which have particularly affected the market price for many high technology companies and which, on occasion, have appeared to be unrelated to the operating performance of such companies. Finally, to maintain our stock listing with NASDAQ, we must be in compliance with NASDAQ Marketplace Rules. If we are not able to maintain compliance with these rules, and if our common stock does not qualify for, or is subsequently delisted from, the NASDAQ Capital Market, investors may have difficulty converting their investment into cash efficiently. The price of our common stock and the ability of holders to sell such stock would be adversely affected.
Because We do Not Expect to Pay Dividends on Our Common Stock, Stockholders Will Benefit from an Investment in our Common Stock Only if it Appreciates in Value
We have never paid cash dividends on our common stock and have no present intention to pay any dividends in the future. We intend to use all available cash and liquid assets in the development of our business. Any future determination about the payment of dividends will be made at the discretion of our board of directors and will depend upon our earnings, if any, our capital requirements, our operating and financial conditions and on such other factors as our board of directors may deem relevant. As a result, the success of an investment in our common stock will depend upon any future appreciation in its value. There is no guarantee that our common stock will appreciate in value or even maintain the price at which stockholders have purchased their shares.
Sales of a Substantial Number of Shares of Our Common Stock in the Public Market by Us or by Existing Stockholders, or the Perception that they may Occur, Could Cause our Stock Price to Decline.
Insiders presently hold a significant percentage of our stock, and our shares are thinly traded in the public market. Sales of substantial amounts of our common stock by us or by our stockholders, announcements of the proposed sales of substantial amounts of our common stock or the perception that substantial sales may be made, could cause the market price of our common stock to decline. We may issue additional shares of our common stock in follow-on offerings to raise additional capital or in connection with acquisitions or corporate alliances and we plan to issue additional shares to our employees and directors in connection with their services to us. Any issuance of additional common stock will dilute the ownership interest of existing common shareholders. All of the currently outstanding shares of our common stock are freely tradable under federal and state securities laws, except for shares held by our employees, directors, officers and certain greater than five percent shareholders, which may be subject to volume limitations. Sales of a substantial number of shares of our common stock in the public market could occur at any time and could reduce the market price of our common stock.
We Can Issue Shares of Preferred Stock that May Adversely Affect the Rights of Holders of Our Common Stock
Our certificate of incorporation authorizes us to issue up to 1,000,000 shares of preferred stock with designations, rights, and preferences determined from time to time by our board of directors. Accordingly, our board of directors is empowered, without stockholder approval, to issue preferred stock with dividend, liquidation, conversion, voting or other rights superior to those of holders of our common stock. For example, an issuance of shares of preferred stock could:
| · | adversely affect the voting power of the holders of our common stock; |
| · | make it more difficult for a third party to gain control of us; |
| · | discourage bids for our common stock at a premium; |
| · | limit or eliminate any payments that the holders of our common stock could expect to receive upon our liquidation; or |
| 20 |
| · | otherwise adversely affect the market price or our common stock. |
If Securities or Industry Analysts Publish Research or Reports About Our Business, or if they Change their Recommendations Regarding Our Stock, the Price of Our Stock and Trading Volume Could Decline
The trading market for our common stock is influenced by the research reports and opinions that are published about our business. If the analysts that cover us fail to publish reports in a regular manner, we could lose visibility in the financial markets, which could cause a significant and prolonged decline in our stock price due to lack of investor awareness. Furthermore, if one or more analysts downgrade our stock or comment negatively about our prospects or the prospects of other companies operating in our industry, our stock price could decline significantly.
Our Governing Documents and Delaware Law may Discourage the Potential Acquisition of Our Business and Adversely Affect the Rights of our Common Stock
Our certificate of incorporation and bylaws contain provisions that may make the acquisition of our company more difficult without the approval of our board of directors. In addition, we are subject to anti-takeover provisions of Delaware law. These provisions may deter or discourage takeover attempts and other changes in control of us not approved by our board of directors. If potential acquirers are deterred, you may lose an opportunity to profit from a possible acquisition premium in our stock price.
Item 1B. UNRESOLVED STAFF COMMENTS
Not applicable.
Datawatch is currently headquartered in 20,360 square feet of leased office space in Bedford, Massachusetts pursuant to a lease agreement executed on June 23, 2015. The lease expires in December 2022. The aggregate rent expense for the remaining term of the lease is $2.1 million. In addition to rent, the lease requires us to pay certain taxes, insurance and operating costs related to the leased facility based on our pro-rata share of such costs.
We also maintain sales and development offices in the U.S., and international sales, administrative and development offices in Canada, the U.K. and Sweden. In addition, we maintain a software development and testing facility in the Philippines.
We are occasionally involved in legal proceedings and other claims arising out of our operations in the normal course of business. We are not party to any litigation that we believe will have a material adverse effect on our consolidated financial condition, results of operations or cash flows.
Item 4. MINE SAFETY DISCLOSURES
Not applicable.
| 21 |
Item 5. MARKET FOR THE REGISTRANT’S COMMON EQUITY AND RELATED SHAREHOLDER MATTERS AND ISSUER PURCHASES OF EQUITY SECURITIES
Market Information
Our common stock is listed and traded on the NASDAQ Capital Market under the symbol DWCH. The range of high and low closing prices during each fiscal quarter for the last two fiscal years is set forth below:
| For the Year Ended | Common Stock | |||||||
| September 30, 2018 | High ($) | Low ($) | ||||||
| 4th Quarter | 13.70 | 9.75 | ||||||
| 3rd Quarter | 9.95 | 8.25 | ||||||
| 2nd Quarter | 11.80 | 8.20 | ||||||
| 1st Quarter | 12.55 | 8.65 | ||||||
| For the Year Ended | Common Stock | |||||||
| September 30, 2017 | High ($) | Low ($) | ||||||
| 4th Quarter | 11.55 | 9.05 | ||||||
| 3rd Quarter | 9.40 | 7.10 | ||||||
| 2nd Quarter | 8.55 | 5.50 | ||||||
| 1st Quarter | 7.65 | 5.30 | ||||||
Holders
There were 65 shareholders of record as of December 6, 2018. We believe that the number of beneficial holders of common stock is 1,630. The last reported sale of our common stock on December 6, 2018 was at $13.08.
Dividends
We have not paid any cash dividends and it is anticipated that none will be declared in the foreseeable future. We intend to retain future earnings, if any, to provide funds for the operation, development and expansion of our business.
Equity Plan Information
The following table provides information about the Common Stock that may be issued upon the exercise of options, warrants and rights under all of our existing equity compensation plans as of September 30, 2018 and 2017, including the Company’s Third Amended and Restated 2011 Equity Compensation and Incentive Plan (the “2011 Plan”). The 2011 Plan has previously been approved by our stockholders.
| 22 |
| Number of | Weighted | |||||||||||
| Securities to be | average exercise | Number of | ||||||||||
| issued upon | price of | securities | ||||||||||
| exercise of | outstanding | remaining | ||||||||||
| outstanding | options, | available | ||||||||||
| options, warrants | warrants and | for future | ||||||||||
| Plan Category | and rights(1) | rights(2) | issuance | |||||||||
| Equity compensation plans approved by security holders | 985,540 | $ | 12.92 | 262,674 | ||||||||
| (1) | These shares were granted under the 2011 Plan. As of September 30, 2018, 262,674 shares remained available for grant under the 2011 Plan. |
| (2) | Weighted-average exercise prices do not include restricted stock units as these do not contain exercise prices. |
Stock Performance Graph
The following graph compares the yearly change in the cumulative total stockholder return on the Company’s Common Stock during the period from September 30, 2013 through September 30, 2018, with the cumulative total return on (i) an SIC Index that includes all organizations in the Company’s Standard Industrial Classification (SIC) Code 7372-Prepackaged Software (the “SIC Code Index”) and (ii) the Media General Market Weighted Nasdaq Index Return (the “Nasdaq Market Index”). The comparison assumes that $100 was invested on October 1, 2013 in the Company’s Common Stock and in each of the foregoing indices and assumes reinvestment of dividends, if any.
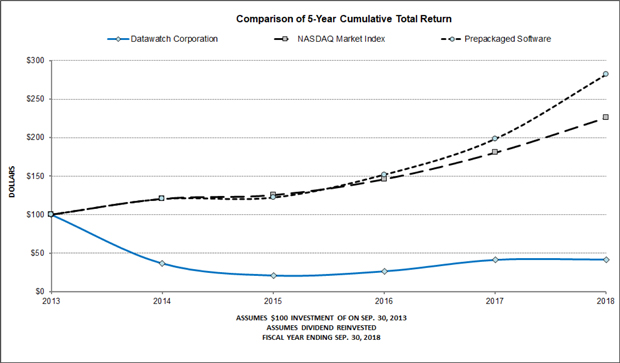
The stock price performance shown on the graph and in the table above is not necessarily indicative of future price performance. Information used in the graph and table was obtained from Zacks Investment Research, a source believed to be reliable, but the Company is not responsible for any errors or omissions in such information.
| 23 |
Item 6. SELECTED CONSOLIDATED FINANCIAL DATA
The following table sets forth selected consolidated financial data for the periods indicated. The selected consolidated financial data for and as of the end of the years in the five-year period ended September 30, 2018 are derived from our consolidated financial statements. The information set forth below should be read in conjunction with “Management’s Discussion and Analysis of Financial Condition and Results of Operations” and the Consolidated Financial Statements and notes which appear elsewhere in this Annual Report on Form 10-K.
| Statements of Operations Data: | ||||||||||||||||||||
| Years Ended September 30, | 2018 | 2017 | 2016 | 2015 | 2014 | |||||||||||||||
| (In thousands, except per share data) | ||||||||||||||||||||
| Revenue | $ | 41,678 | $ | 36,263 | $ | 30,462 | $ | 30,221 | $ | 35,087 | ||||||||||
| Costs and Expenses | 50,773 | 41,033 | 43,591 | 82,663 | 56,752 | |||||||||||||||
| Loss from Operations | (9,095 | ) | (4,770 | ) | (13,129 | ) | (52,442 | ) | (21,665 | ) | ||||||||||
| Net Loss | $ | (9,252 | ) | $ | (3,993 | ) | $ | (14,632 | ) | $ | (49,787 | ) | $ | (22,383 | ) | |||||
| Net Loss per Common Share: | ||||||||||||||||||||
| Basic | $ | (0.74 | ) | $ | (0.33 | ) | $ | (1.24 | ) | $ | (4.38 | ) | $ | (2.24 | ) | |||||
| Diluted | $ | (0.74 | ) | $ | (0.33 | ) | $ | (1.24 | ) | $ | (4.38 | ) | $ | (2.24 | ) | |||||
| Balance Sheet Data: | ||||||||||||||||||||
| September 30, | 2018 | 2017 | 2016 | 2015 | 2014 | |||||||||||||||
| (In thousands) | ||||||||||||||||||||
| Total Assets | $ | 61,684 | $ | 50,405 | $ | 48,431 | $ | 58,931 | $ | 103,597 | ||||||||||
| Working Capital | $ | 3,120 | $ | 23,362 | $ | 23,524 | $ | 31,328 | $ | 44,876 | ||||||||||
| Long-term Obligations | $ | 9,814 | $ | 692 | $ | 766 | $ | 461 | $ | 1,238 | ||||||||||
| Shareholders’ Equity | $ | 26,517 | $ | 32,529 | $ | 33,958 | $ | 45,542 | $ | 90,910 | ||||||||||
Item 7. MANAGEMENT’S DISCUSSION AND ANALYSIS OF FINANCIAL CONDITION AND RESULTS OF OPERATIONS
The following discussion and analysis is qualified by reference to, and should be read in conjunction with, our consolidated financial statements which appear elsewhere in this Annual Report on Form 10-K.
GENERAL
Introduction
We are engaged in the design, development, marketing, distribution and support of business computer software primarily for the self-service data preparation, predictive analytics and visual data discovery markets to allow organizations to access, analyze and visualize information in a more meaningful fashion. The Datawatch platform is an enterprise solution that bridges the gap between the ease-of-use and agility that business users demand and the scalability, automation and governance needed by IT.
| 24 |
We offer our enterprise products through perpetual licenses and subscription pricing models. Subscription terms generally run 12 months. Commencing 90 days prior to the subscription expiration date, the Company will seek subscription renewals contracts. The subscription arrangement includes software, maintenance and unspecified future upgrades including major version upgrades. During fiscal years 2018, 2017 and 2016, subscription revenues were $8.6 million, $4.2 million and $2.4 million, respectively.
Key Events
Pending Acquisition by Altair
On November 5, 2018, we announced an agreement to be acquired by an entity affiliated with Altair Engineering Inc. (together with its affiliates, “Altair”) pursuant to an Agreement and Plan of Merger (the “Merger Agreement”), dated as of November 5, 2018, by and among Datawatch, Dallas Merger Sub, Inc., a Delaware corporation (“Purchaser”) and Altair, pursuant to which, among other things, Purchaser has completed a tender offer (the “Offer”) to purchase all of the outstanding shares (the “Shares”) of Datawatch common stock, $0.01 par value, at a price of $13.10 per share, without interest and subject to any required withholding taxes (the “Offer Price”). Subject to the satisfaction or waiver of the remaining conditions set forth in the Merger Agreement, Purchaser will merge with and into Datawatch (the “Merger”, and together with the Offer, the “Transactions”) without a meeting or vote of the stockholders of Datawatch in accordance with Section 251(h) of the General Corporation Law of the State of Delaware (the “DGCL”), with Datawatch continuing as the surviving corporation in the Merger as a subsidiary of Altair. At the effective time of the Merger (the “Effective Time”), any Shares not purchased pursuant to the Offer (other than Shares (i) owned by stockholders who are entitled to demand and properly demand appraisal in accordance with Section 262 of the DGCL in connection with the Merger, (ii) then owned by Datawatch or owned both at the commencement of the Offer and at the Effective Time by any wholly owned subsidiary of Datawatch and (iii) irrevocably accepted for purchase in the Offer or owned both at the commencement of the Offer and at the Effective Time by Altair, Purchaser or any other wholly owned subsidiary of Altair) will be automatically converted into the right to receive the Offer Price, net to the seller in cash, without interest and less any applicable withholding taxes.
Consummation of the Merger is subject to various conditions set forth in the Merger Agreement, including, but not limited to the receipt of required approvals, waivers and consents, and other conditions set forth in Annex I to the Merger Agreement. The Merger is not subject to any financing condition.
Completed Acquisition of Angoss Software Corporation
On January 30, 2018, we acquired Angoss Software Corporation, an Ontario corporation (“Angoss”), by purchasing all of its outstanding capital stock from its current stockholders for $24.6 million in cash, adjusted for net indebtedness and variance from target working capital (the “Angoss Acquisition”). Of this payment, $0.1 million was determined to be post-combination compensation expense. Excluding this amount, the purchase consideration from the Angoss Acquisition totaled $24.6 million. The share purchase agreement contains usual and customary representations and warranties, covenants and indemnification provisions. The acquisition augments Datawatch’s Monarch data intelligence offering with expanded capabilities that enable data scientists to perform predictive and prescriptive analytics in a wide variety of enterprise applications.
| 25 |
On January 24, 2018, we entered into a new credit facility with a bank (the “2018 Loan Facility”). The credit facility includes a $10 million term loan and a $5 million revolving line of credit, secured by substantially all of the assets of Datawatch, excluding intellectual property. The term loan, which was used to fund a portion of the Angoss Acquisition, bears interest at the prime rate plus 1%, is repayable based on a 48-month amortization schedule, matures on January 24, 2021, and is subject to prepayment penalties. The line of credit, intended to be used for working capital and general corporate purposes, bears interest at the prime rate plus 0.5% and is due and payable on January 24, 2020.
CRITICAL ACCOUNTING POLICIES
In the preparation of financial statements and other financial data, management applies certain accounting policies to transactions that, depending on judgments made by management, can result in different outcomes. In order for a reader to understand the following information regarding our financial performance and condition, an underlying understanding of those accounting policies is important. Certain of those policies are comparatively more important to our financial results and condition than others. The policies that we believe are most important for a reader’s understanding of the financial information provided in this report are described below.
Business Combinations
We allocate the fair value of purchase consideration to the tangible assets acquired, liabilities assumed and intangible assets acquired based on their estimated fair values. The excess of the fair value of purchase consideration over the fair values of these identifiable assets and liabilities is recorded as goodwill. When determining the fair values of assets acquired and liabilities assumed, management makes significant estimates and assumptions, especially with respect to intangible assets.
Critical estimates in valuing certain intangible assets include, but are not limited to, future expected cash flows from customer relationships and acquired developed technology and discount rates. Management’s estimates of fair value are based upon assumptions believed to be reasonable, but which are inherently uncertain and unpredictable and, as a result, actual results may differ materially from estimates. Other estimates associated with the accounting for acquisitions may change as additional information becomes available regarding the assets acquired and liabilities assumed.
Revenue Recognition
We license our software products directly to end-users and indirectly to end-users, through value-added resellers and strategic partners. Sales to indirect distribution channels accounted for 37%, 36% and 35%, of total sales for fiscal years 2018, 2017 and 2016, respectively. Revenue from the sale of software products is generally recognized at the time of shipment, provided there are no uncertainties surrounding product acceptance, the fee is fixed or determinable, collectability is reasonably assured, persuasive evidence of the arrangement exists and there are no significant obligations remaining. Our software product offerings do not require customization and can be installed and used by customers on their own with little or no configuration required. Multi-user licenses marketed by us are sold as a right to use the number of licenses, and the license fee revenue is recognized upon delivery of the software.
Our software products are generally sold in multiple element arrangements which may include software licenses, professional services, educational services and customer support. In such multiple element arrangements, we apply the residual method in determining revenue to be allocated to the software license. In applying the residual method, we deduct from the sale proceeds the vendor specific objective evidence (“VSOE”) of fair value of the professional services, educational services and customer support in determining the residual value of the software license. The VSOE of fair value of the professional services, educational services and customer support is based on the amounts charged for these elements when sold separately. Professional services include advanced modeling, application design, implementation and configuration and process optimization with revenue recognized as the services are performed. These services are generally delivered on a time and materials basis, are billed as the work is performed, and do not involve modification or customization of the software or any other unusual acceptance clauses or terms. Customer support is typically provided under a maintenance agreement which provides technical support and rights to unspecified software maintenance updates and bug fixes on a when-and-if available basis. Revenue from customer support services is deferred and recognized ratably over the period of support (generally one year). Such deferred amounts are recorded as part of deferred revenue in the accompanying consolidated balance sheets.
Certain deals related to Angoss products contain unbilled receivables, fixed price services and multi-year contract term licenses with significant and incremental discounts. We do not have VSOE in software bundled arrangements involving fixed price services, which results in revenue being deferred and recognized ratably over the longest contractual period. Additionally, we may enter into multi-year contracts with customers that include a discount on future renewal options that is significant and incremental to the initial arrangement. A portion of the fee is deferred as a result of the significant and incremental discount and is recognized as revenue proportionally as future renewals are delivered or as the discount expires.
| 26 |
We also license our enterprise software using a subscription model. At the time a customer enters into a binding agreement to purchase a subscription, the customer is invoiced annually in advance and an account receivable and deferred revenue are recorded. Beginning on the date the software is installed at the customer site and available for use by the customer, and provided that all other criteria for revenue recognition are met, the deferred revenue amount is recognized ratably over the period the service is provided. The subscription arrangement includes software, maintenance and unspecified future upgrades including major version upgrades on a when-and-if available basis. The Company typically charges the same price for the initial subscription and the renewal term. Prior to the adoption of Topic 606, we recognized revenue from subscription licenses ratably over the term of the agreement. With the adoption of Topic 606 on October 1, 2018, revenue for performance obligations are now generally recognized as they are satisfied. Therefore, revenue from the subscription license performance obligation is recognized upon delivery. Revenue from maintenance includes two performance obligations, upgrades and customer support, and is recognized on a straight-line basis over the contractual term. See Note 1 to our accompanying consolidated financial statements for information about Topic 606.
Our software products are sold under warranty against certain defects in material and workmanship for a period of 30 days from the date of purchase. We also offer a 30 day money-back guarantee on our Datawatch Monarch product sold directly to end-users.
Allowance for Bad Debts
We maintain allowances for doubtful accounts for estimated losses resulting from the inability of customers to make required payments. We analyze accounts receivable and the composition of the accounts receivable aging, historical bad debts, customer creditworthiness, current economic trends, foreign currency exchange rate fluctuations and changes in customer payment terms when evaluating the adequacy of the allowance for doubtful accounts. Based upon the analysis and estimates of the collectability of our accounts receivable, we record an increase in the allowance for doubtful accounts when the prospect of collecting a specific account receivable becomes doubtful. Actual results could differ from the allowances for doubtful accounts recorded, and this difference may have a material effect on our financial position and results of operations. Our allowance for doubtful accounts was $0.1 million for both September 30, 2018 and 2017.
Income Taxes
We have deferred tax assets primarily related to net operating loss carryforwards and tax credits that expire at different times through 2038 or have an unlimited carryforward. At September 30, 2018, we had U.S. federal tax loss carryforwards of approximately $58 million, expiring at various dates through 2038, including approximately $0.2 million resulting from an acquisition undertaken during 2004 which are subject to additional annual limitations as a result of the changes in ownership, and had approximately $30.3 million in state tax loss carryforwards, which also expire at various dates through 2038. We have federal research and development credits of approximately $1.3 million that begin to expire beginning in 2021 and state credits of approximately $0.8 million that expire at various dates through 2033. We also have Canada ITC credits of $0.8 million which expire at various dates through 2037 and Canada foreign tax credits of $16,000 which expire at various dates through 2027. In addition, we have the following foreign net operating loss carryforwards: U.K. losses of approximately $12.9 million with no expiration date, Australia losses of approximately $3.3 million with no expiration date, Germany losses of approximately $1.9 million with no expiration date, Singapore losses of approximately $2.7 million with no expiration date, Sweden losses of approximately $11.9 million with no expiration, and Canada losses of $3.7 million that expire at various dates through 2038. The Company has a Canada net capital loss carryforward of $0.3 million with no expiration.
Significant judgment is required in determining our provision for income taxes, the carrying value of deferred tax assets and liabilities and the valuation allowance recorded against net deferred tax assets. Factors such as future reversals of deferred tax assets and liabilities, projected future taxable income, changes in enacted tax rates and the period over which our deferred tax assets will be recoverable are considered in making these determinations. We do not believe the deferred tax assets in all of our jurisdictions are more likely than not to be realized and therefore a full valuation allowance has been provided against the deferred tax assets in the U.S., U.K., Australia, Canada, Germany, and Sweden at September 30, 2018 and in the U.S., U.K., Australia, Germany, Singapore, and Sweden at September 30, 2017. Management evaluates the realizability of the deferred tax assets quarterly and, if current economic conditions change or future results of operations are better than expected, future assessments may result in us concluding that it is more likely than not that all or a portion of the deferred tax assets are realizable. If this conclusion were reached, the valuation allowance against deferred tax assets would be reduced resulting in a tax benefit being recorded for financial reporting purposes. Total net deferred tax assets subject to the full valuation allowance were approximately $27.8 million as of September 30, 2018.
| 27 |
We follow the accounting guidance for uncertain tax positions. The comprehensive model addresses the financial statement recognition, measurement, presentation and disclosure of uncertain tax positions taken or expected to be taken in income tax returns. In accordance with these requirements, we first determine whether a tax authority would “more likely than not” sustain our tax position if it were to audit the position with full knowledge of all the relevant facts and other information. For those tax positions that meet this threshold, we measure the amount of tax benefit based on the largest amount of tax benefit that we have a greater than 50% chance of realizing in a final settlement with the relevant authority. Those tax positions failing to qualify for initial recognition are recognized in the first interim period in which they meet the more likely than not standard, or are resolved through negotiation or litigation with the taxing authority, or upon expiration of the statute of limitations. We maintain a cumulative risk portfolio relating to all of our uncertainties in income taxes in order to perform this analysis, but the evaluation of our tax positions requires significant judgment and estimation in part because, in certain cases, tax law is subject to varied interpretation, and whether a tax position will ultimately be sustained may be uncertain. The actual outcome of our tax positions, if significantly different from our estimates, could materially impact the financial statements.
During the fiscal year ended September 30, 2015, the Swedish tax authorities began an audit of our subsidiary in Sweden. In February 2017, there was a decision of the Swedish tax authorities claiming that there had been a transfer of certain intellectual property assets by our Swedish subsidiary resulting in a tax liability of approximately $9 million. We have appealed the Swedish tax authority’s decision to the Swedish administrative court and we are awaiting a date for the oral hearing before the court. We have not made a reserve on our financial statements for any taxes that may become due as we believe that it is more likely than not that we will prevail in court.
At October 1, 2016, we had a cumulative tax liability of approximately $0.2 million related to U.S. and foreign tax exposure. During the fiscal year ended September 30, 2017, we decreased our uncertain tax liability by approximately $30,000 due to the statute of limitations expiring and the effective settlement of uncertain tax liabilities. During the fiscal year ended September 30, 2018, we decreased our uncertain tax liability by approximately $25,000 due to the statute of limitation expiring and increased by $0.1 million for U.S. tax exposures. This results in a cumulative tax liability of approximately $0.2 million at September 30, 2018. These amounts have been recorded in other long-term liabilities in our accompanying consolidated balance sheets.
The Company recognizes interest accrued related to unrecognized tax benefits and penalties as income tax expense. Related to the unrecognized tax benefits noted above, the Company accrued penalties of $6,500 and interest of $5,000 during 2018 and in total, as of September 30, 2018, has recognized a liability for penalties of $6,500 and interest of $5,000. The Company did not accrue interest or penalties as of September 30, 2017.
Goodwill and Intangible Assets
Goodwill represents the excess of the purchase price over the fair value of identifiable net assets of acquired businesses. Indefinite-lived intangibles are intangible assets whose useful lives are indefinite in that their lives extend beyond the foreseeable horizon – that is, there is no foreseeable limit on the period of time over which they are expected to contribute to the cash flows of the reporting entity. We account for these items in accordance with ASC 350 Intangibles- Goodwill and Other, under which goodwill and intangible assets having indefinite lives are not amortized but instead are reviewed annually, or more frequently as a result of an event or change in circumstances, for possible impairment with impaired assets written down to fair value.
We review goodwill and indefinite lived intangible assets annually during the fourth quarter and more frequently if events and circumstances indicate that the asset may be impaired, such as a significant reduction in cash flows associated with the asset. Should the fair value of our long-lived assets decline because of reduced operating performance, market declines, or other indicators of impairment, a charge to operations for impairment may be necessary. We did not record any impairment charges during fiscal 2018, 2017 or 2016.
We evaluate our intangible assets for impairment whenever events or changes in circumstances indicate that the carrying amount of such assets may not be recoverable. In evaluating potential impairment of these assets, we specifically consider whether any indicators of impairment are present, including, but not limited to:
• whether there has been a significant adverse change in the business climate that affects the value of an asset;
• whether there has been a significant change in the extent or manner in which an asset is used; and
• whether there is an expectation that the asset will be sold or disposed of before the end of its originally estimated useful life.
If indicators of impairment are present, we compare the estimated undiscounted cash flows that the specific asset is expected to generate to its carrying value. The key assumptions of the cash flow model involve significant subjectivity. If such assets are considered to be impaired, the impairment recognized is measured by the amount by which the carrying amount of the asset exceeds its fair value.
| 28 |
Intangible asset amounts amortized to sales and marketing expense totaled $0.7 million, $0.1 million and $0.2 million for fiscal 2018, 2017 and 2016, respectively. There was no amortization of intangible assets to general and administrative expense for fiscal 2018 or 2017. Intangible asset amounts amortized to general and administrative expense totaled $20,000 for fiscal year 2016.
Share-Based Compensation
We recognize share-based compensation expense in accordance with U.S. generally accepted accounting principles which require that all share-based awards, including grants of employee stock options and restricted stock units, be recognized in the financial statements based on their fair value at date of grant.
We recognize the fair value of share-based awards over the requisite service period of the individual awards, which generally equals the vesting period. For the fiscal year ended September 30, 2018, we recorded share-based compensation expense of $3.0 million, all of which relates to RSUs.
We periodically grant awards of restricted stock units (“RSUs”) to our non-employee directors and employees on a discretionary basis pursuant to our stock compensation plans. Each RSU entitles the holder to receive, at the end of each vesting period, a specified number of shares of our common stock. Each RSU typically vests at the rate of 33.33% on each of the first through third anniversaries of the grant date.
At September 30, 2018, we had $5.3 million of unrecognized compensation costs related to RSUs, which is expected to be recognized over a weighted-average period of 2.03 years. At September 30, 2018, we had no unrecognized compensation costs related to options.
OVERVIEW
We believe that we have the opportunity to become the leading provider of data intelligence solutions, which include self-service data preparation, fast analytics and predictive analytics. Among our current challenges in realizing that opportunity are the development of a robust channel of distribution partners, finding new customers to capitalize on the self-service data preparation opportunity and expanding license revenue with our largest existing Monarch and data visualization customers.
Our total revenue for fiscal 2018 was $41.7 million, a 15% increase from revenue of $36.3 million in fiscal 2017. Our cash and cash equivalent balance at the end of fiscal 2018 decreased $16.7 million to $13.7 million as compared to the end of fiscal year 2017.
Sales execution
Total revenue increased by $5.4 million, or 15%, compared to the fiscal year 2017. Of the increase in total revenue, license revenue increased $4.7 million, or 23%, compared to fiscal year 2017. In addition, our deferred revenue balance increased by $8.7 million from $11.6 million as of the end of fiscal 2017 to $20.3 million as of the end of fiscal 2018. Of the total deferred revenue increase, deferred license revenue increased by $6.7 million, or 235%, from the end of fiscal 2017. Our subscription bookings continued to increase year-over-year. During fiscal 2018, subscription bookings increased $5.7 million, or 113%, over fiscal 2017 to $10.7 million. We recognized $8.6 million in subscription license revenue during fiscal 2018, representing a 105% increase compared to subscription license revenue of $4.2 million during fiscal 2017.
RESULTS OF OPERATIONS
The following table sets forth certain statements of operations data as a percentage of total revenues for the periods indicated. The data has been derived from our accompanying consolidated financial statements. The operating results for any period should not be considered indicative of the results expected for any future period.
| 29 |
| Years Ended | ||||||||||||
| September 30, | ||||||||||||
| 2018 | 2017 | 2016 | ||||||||||
| REVENUE: | ||||||||||||
| Software licenses | 60 | % | 55 | % | 50 | % | ||||||
| Maintenance | 37 | 40 | 46 | |||||||||
| Professional services | 3 | 5 | 4 | |||||||||
| Total revenues | 100 | % | 100 | % | 100 | % | ||||||
| COSTS AND EXPENSES: | ||||||||||||
| Cost of software licenses | 3 | % | 5 | % | 9 | % | ||||||
| Cost of maintenance and services | 9 | 6 | 7 | |||||||||
| Sales and marketing | 54 | 53 | 68 | |||||||||
| Engineering and product development | 27 | 25 | 27 | |||||||||
| General and administrative | 28 | 24 | 32 | |||||||||
| Total costs and expenses | 121 | % | 113 | % | 143 | % | ||||||
| LOSS FROM OPERATIONS | (21 | )% | (13 | )% | (43 | )% | ||||||
| Interest expense | (1 | )% | - | % | - | % | ||||||
| Other income | - | 2 | - | |||||||||
| Foreign currency transaction loss | - | - | - | |||||||||
| LOSS FROM OPERATIONS BEFORE INCOME TAXES | (22 | )% | (11 | )% | (43 | )% | ||||||
| Income tax (expense) benefit | - | - | (5 | ) | ||||||||
| NET LOSS | (22 | )% | (11 | )% | (48 | )% | ||||||
Fiscal Year Ended September 30, 2018 as Compared to
Fiscal Year Ended September 30, 2017
Total Revenues
| Years Ended | ||||||||||||||||
| September 30, | Increase | Percentage | ||||||||||||||
| 2018 | 2017 | (Decrease) | Change | |||||||||||||
| Software licenses | $ | 24,759 | $ | 20,051 | $ | 4,708 | 23 | % | ||||||||
| Maintenance | 15,588 | 14,473 | 1,115 | 8 | ||||||||||||
| Professional services | 1,331 | 1,739 | (408 | ) | (23 | ) | ||||||||||
| Total revenue | $ | 41,678 | $ | 36,263 | $ | 5,415 | 15 | % | ||||||||
| 30 |
Software license revenue. Software license revenue increased $4.7 million compared with software license revenue for fiscal year 2017. Subscription and perpetual license revenue increased $4.4 million and $0.2 million, respectively, in fiscal year 2018. We have observed the continued growth of our deferred revenue related to subscription software, which we believe will translate into software license revenue in future quarters. The main driver of increased subscription revenue was from the Angoss Acquisition which contributed $2.9 million in subscription revenue for fiscal year 2018.
Maintenance revenue. Maintenance revenue increased $1.1 million compared to fiscal year 2017. Maintenance revenue from renewal business increased $0.8 million and revenue from new business increased $0.3 million in fiscal year 2018. The renewal rate for fiscal year 2018 was consistent with fiscal year 2017 at 85%.
Professional services. Professional services decreased $0.4 million compared to fiscal year 2017. Both consulting and training revenue decreased over fiscal year 2017. The major driver of this decline was the Panopticon business which was higher in fiscal year 2017 as compared to fiscal year 2018.
Total Costs and Expenses
| Years Ended | ||||||||||||||||
| September 30, | Increase | Percentage | ||||||||||||||
| 2018 | 2017 | (Decrease) | Change | |||||||||||||
| Cost of software licenses | $ | 1,298 | $ | 1,895 | $ | (597 | ) | (32 | )% | |||||||
| Cost of maintenance and services | 3,622 | 2,349 | 1,273 | 54 | ||||||||||||
| Sales and marketing | 22,597 | 19,124 | 3,473 | 18 | ||||||||||||
| Engineering and product development | 11,421 | 8,888 | 2,533 | 28 | ||||||||||||
| General and administrative | 11,835 | 8,777 | 3,058 | 35 | ||||||||||||
| Total costs and expenses | $ | 50,773 | $ | 41,033 | $ | 9,740 | 24 | % | ||||||||
Cost of software licenses. The $0.6 million decrease in costs of software licenses was driven by a decrease in amortization expense as a result of certain intangible assets that became fully amortized during the first half of fiscal 2017.
Cost of maintenance and services. The $1.3 million increase was primarily driven by an increase in compensation and benefits related expenses resulting from an increase in headcount from the Angoss Acquisition.
Sales and marketing expenses. The $3.5 million increase in sales and marketing expenses was primarily driven by an increase in sales expense of $2.0 million and an increase in marketing expense of $1.5 million. The increased sales expense was primarily driven by a $1.4 million increase in compensation and benefits related expenses, which was driven by an increase in headcount from the Angoss Acquisition. Additionally, there was a $0.6 million increase in amortization of intangibles acquired as part of the Angoss Acquisition, a $0.2 million increase in software related expenses and a $0.1 million increase in rent expense. This was offset by a $0.3 million decrease in outside consulting expenses. The increase in marketing expense was driven by $0.7 million increase in advertising, lead generation, and trade show expenses, a $0.6 million increase in compensation and benefits expense due to an increase in headcount and a $0.3 million increase in consulting expenses. This was offset by a $0.1 million decrease in public relations expense.
Engineering and product development expenses. The $2.5 million increase was primarily driven by a $1.3 million increase in compensation and benefits related expense and a $1.2 million increase in outside consulting and software expense. The increase in compensation and benefits related expenses was driven by an increase in headcount from the Angoss Acquisition and an increase in stock compensation expense. The increase in outside consulting and software expense was driven by Swarm product development.
| 31 |
General and administrative expenses. The $3.1 million increase was driven by a $2.0 million increase in professional services expense, a $0.8 million increase in compensation and benefits related expenses, a $0.3 million increase in software related expenses and a $0.1 increase in insurance expense offset by a $0.1 million decrease in severance expense. The increase in professional services expense was primarily attributable to legal and accounting services related to the Angoss Acquisition. The increase in compensation and benefits related expenses were driven by increased headcount, stock compensation and recruiting efforts. The increase in software related expenses were driven by the purchase of software and subscriptions.
Other income (expense)
| Years Ended | ||||||||||||||||
| September 30, | Increase | Percentage | ||||||||||||||
| 2018 | 2017 | (Decrease) | Change | |||||||||||||
| Interest expense | $ | (399 | ) | $ | - | $ | (399 | ) | - | % | ||||||
| Other income | $ | 57 | $ | 808 | $ | (751 | ) | (93 | )% | |||||||
| Foreign currency transaction gain (loss) | $ | 174 | $ | (49 | ) | $ | (223 | ) | 455 | % | ||||||
Interest expense. Interest expense for the year ending September 30, 2018 totaling $0.4 million was incurred as a result of the 2018 Loan Facility.
Other income. The $0.8 million in other income from fiscal year 2017 was primarily driven by the receipt of a settlement payment of $0.7 million, net of legal expenses of $0.2 million, from a stockholder related to such stockholder’s short-swing stock trading profits. No similar events occurred in fiscal year 2018.
Foreign currency transactions gain (loss). The foreign currency gain (loss) for the fiscal years 2018 and 2017 was attributable to fluctuation of foreign currencies in which we transact. The foreign currency gain in fiscal year 2018 was primarily driven by our Canadian subsidiary.
Income tax benefit
| Years Ended | ||||||||||||||||
| September 30, | Percentage | |||||||||||||||
| 2018 | 2017 | (Decrease) | Change | |||||||||||||
| Income tax benefit | $ | 11 | $ | 18 | $ | (7 | ) | (39 | )% | |||||||
Income tax benefit. Income tax benefit for the year ended September 30, 2018 was $11,000 compared to an income tax benefit of approximately $18,000 for the year ended September 30, 2017. The income tax benefit for fiscal year 2018 was comprised of a Federal provision of $20,000, a state tax provision of approximately $24,000, a foreign benefit of approximately $38,000 and benefit for uncertain tax positions relative to U.S. and foreign taxes of approximately $20,000.
Fiscal Year Ended September 30, 2017 as Compared to
Fiscal Year Ended September 30, 2016
Total Revenues
| Years Ended | ||||||||||||||||
| September 30, | Percentage | |||||||||||||||
| 2017 | 2016 | Increase | Change | |||||||||||||
| Software licenses | $ | 20,051 | $ | 15,219 | $ | 4,832 | 32 | % | ||||||||
| Maintenance | 14,473 | 13,915 | 558 | 4 | ||||||||||||
| Professional services | 1,739 | 1,328 | 411 | 31 | ||||||||||||
| Total revenue | $ | 36,263 | $ | 30,462 | $ | 5,801 | 19 | % | ||||||||
| 32 |
Software license revenue. Software license revenue increased $4.8 million compared with software license revenue for fiscal year 2016. Perpetual license revenue increased $3.1 million in fiscal year 2017 and subscription revenue increased $1.7 million in fiscal year 2017. Subscription renewals were the major driver of fiscal year 2017 subscription increase compared to fiscal year 2016. The subscription renewal rate increased from 53% in fiscal year 2016 to 76% in fiscal year 2017, which contributed $1.2 million to the subscription revenue increase. We have observed the continued growth of our deferred revenue related to subscription software, which we believe will translate into software license revenue in future quarters. Total deferred revenue at September 30, 2017 increased $1.7 million from our total deferred revenue at September 30, 2016, primarily due to the increase in deferred license revenue, which increased 43% from $2.0 million at September 30, 2016 to $2.9 million at September 30, 2017.
Maintenance revenue. Maintenance revenue increased $0.5 million compared to fiscal year 2016. Maintenance revenue from renewal business increased $0.4 million and revenue from new business increased $0.1 million in fiscal year 2017. The renewal rate for fiscal year 2017 was 85% compared to 74% in fiscal year 2016.
Professional services. Professional services increased $0.4 million compared to fiscal year 2016. Both consulting and training increased significantly over fiscal year 2016. Both increased by roughly 30% compared to fiscal year 2016. The major driver of this growth was the Panopticon business which increased over 200% compared to fiscal year 2016.
Total Costs and Expenses
| Years Ended | ||||||||||||||||
| September 30, | Increase | Percentage | ||||||||||||||
| 2017 | 2016 | (Decrease) | Change | |||||||||||||
| Cost of software licenses | $ | 1,895 | $ | 2,828 | $ | (933 | ) | (33 | )% | |||||||
| Cost of maintenance and services | 2,349 | 2,177 | 172 | 8 | ||||||||||||
| Sales and marketing | 19,124 | 20,783 | (1,659 | ) | (8 | ) | ||||||||||
| Engineering and product development | 8,888 | 8,167 | 721 | 9 | ||||||||||||
| General and administrative | 8,777 | 9,636 | (859 | ) | (9 | ) | ||||||||||
| Total costs and expenses | $ | 41,033 | $ | 43,591 | $ | (2,558 | ) | (6 | )% | |||||||
Cost of software licenses. The $0.9 million decrease in costs of software licenses was driven by a decrease in amortization expense as a result of certain intangible assets that became fully amortized during the first half of fiscal 2017.
Cost of maintenance and services. The $0.2 million increase was primarily driven by an increase in expense related to third party consulting as a result of outsourcing services for specific customer contracts.
| 33 |
Sales and marketing expenses. The $1.7 million decrease in sales and marketing expenses was primarily driven by a decrease in marketing expense of $2.5 million, offset by an increase in sales expense of $0.8 million. The decrease in marketing expenses was driven by cost cutting measures designed to steadily reduce our expense run-rate. As a result, there was a $1.3 million decrease in advertising, tradeshows, and lead generation costs, a $0.3 million decrease in marketing related consulting costs, a $0.2 million decrease in public relations costs, and a $0.1 million decrease in website related costs. Additionally, there was a $0.4 million reduction of share-based compensation expenses and a $0.2 million reduction in salary related expenses. The reduction of share-based compensation expenses was driven by the absence of share-based compensation expense related to several prior grants of stock awards, which had high fair values, and became fully vested during the fourth quarter of fiscal 2016. The increased sales expense was primarily driven by a $2.3 million increase in commissions, which was driven by the increases in revenue compared to fiscal 2016. This was offset by a $0.9 million decrease in salary and recruiting related expense, $0.2 million decrease in rent expense, a $0.2 million decrease in outside consulting expenses, and a $0.1 million decrease in both severance and IP amortization related expenses. The decrease in salary and recruiting related expense was driven by workforce reductions. The decrease in rent expense was a result of an elimination of sales offices in the United Kingdom and Singapore.
Engineering and product development expenses. The $0.7 million increase was primarily driven by a $0.4 million increase in outside consulting and software expense, a $0.2 million increase in bonus expense, a $0.1 million increase in share-based compensation expense, and a $0.1 million increase in severance expense. This was offset by a $0.1 million decrease in salary and benefits related expenses. The increase in outside consulting and software expense was driven by Swarm product development. The increase in bonus expense was driven by the achievement of targeted revenue objectives for fiscal 2017. The increase in severance expense and decrease in salary and benefits related expenses were driven by workforce reductions primarily related to resources focused on legacy products.
General and administrative expenses. The $0.9 million decrease was driven by a $0.9 million decrease in outside legal and consulting services, a $0.3 million decrease in share-based compensation expense, a $0.1 million decrease in facility related expenses, a $0.1 million decrease in software related expenses offset by $0.3 million increase in bonus expense and a $0.2 million increase in severance expense. The decrease in legal and consulting services expenses was a result of these expenses being unusually high during fiscal 2016 due to the contested election of directors at our 2016 annual shareholders meeting. The decrease in share-based compensation expense and increase in severance expense was a result of a decrease in headcount. The increase in bonus expense was driven by the achievement of target revenue objectives for fiscal 2017.
Other income (expense)
| Years Ended | ||||||||||||||||
| September 30, | Increase | Percentage | ||||||||||||||
| 2017 | 2016 | (Decrease) | Change | |||||||||||||
| Other income | $ | 808 | $ | 44 | $ | 764 | 1,736 | % | ||||||||
| Foreign currency transaction loss | $ | (49 | ) | $ | (74 | ) | $ | (25 | ) | 34 | % | |||||
Other income. The $0.8 million increase was primarily driven by the receipt of a settlement payment of $0.7 million, net of legal expenses of $0.2 million, from a stockholder related to such stockholder’s short-swing stock trading profits.
Foreign currency transactions loss. The foreign currency loss for the fiscal years 2017 and 2016 was attributable to fluctuation of the British pound sterling and other foreign currencies in which we transact.
Income tax (expense) benefit
| Years Ended | ||||||||||||||||
| September 30, | Percentage | |||||||||||||||
| 2017 | 2016 | Increase | Change | |||||||||||||
| Income tax (expense) benefit | $ | 18 | $ | (1,473 | ) | $ | 1,491 | 101 | % | |||||||
| 34 |
Income tax (expense) benefit. Income tax benefit for the year ended September 30, 2017 was $18,000 compared to an income tax provision of approximately $1.5 million for the year ended September 30, 2016. The income tax benefit for fiscal year 2017 was comprised of a state tax provision of approximately $9,000, and benefit for uncertain tax positions relative to U.S. and foreign taxes of approximately $27,000. The income tax provision for fiscal year 2016 was comprised of a state tax provision of approximately $10,000, a foreign tax provision of approximately $1.6 million, and a benefit for uncertain tax positions relative to U.S., state, and foreign taxes of approximately $0.1 million.
OFF BALANCE SHEET ARRANGEMENTS, CONTRACTUAL OBLIGATIONS AND CONTINGENT LIABILITIES AND COMMITMENTS
We lease various facilities and equipment in the U.S. and overseas under non-cancelable operating leases that expire through 2022. The lease agreements generally provide for the payment of minimum annual rentals, pro rata share of taxes, and maintenance expenses. Rental expense for all operating leases was $1.1 million, $1.0 million, and $1.1 million for fiscal years 2018, 2017, and 2016, respectively. Certain of our facility leases include options to renew.
On June 23, 2015, we entered into a facility lease in Bedford, MA for our corporate headquarters. The lease is for 20,360 square feet commencing January 2016 and ending December 2022 with a straight-line monthly rent expense of $42,000. In conjunction with entering into the lease, we were required to deposit $0.2 million into a restricted cash account as collateral for a Letter of Credit, which is included under the caption “Other long-term assets” in our consolidated balance sheet for the fiscal year ended September 30, 2017. The collateral was released during fiscal year 2018. At September 30, 2018 and 2017, deferred rent totaled $0.3 million which is included under the caption “Other long-term liabilities” in our consolidated balance sheets, for the years ended September 30, 2018 and 2017.
As of September 30, 2018, our contractual obligations include minimum rental commitments under non-cancelable operating leases and other long-term liabilities related to uncertain tax positions as follows (in thousands):
| Less than | 1 – 2 | 3 – 5 | More than | |||||||||||||||||
| Contractual Obligations: | Total | 1 Year | Years | Years | 5 Years | |||||||||||||||
| Operating lease obligations | $ | 3,318 | $ | 980 | $ | 793 | $ | 1,545 | $ | - | ||||||||||
| Other long-term liabilities | $ | 448 | $ | - | $ | - | $ | - | $ | 448 | ||||||||||
Royalty expense included in cost of software licenses was $0.5 million, $0.6 million and $0.7 million for the years ended September 30, 2018, 2017 and 2016, respectively.
Our software products are sold under warranty against certain defects in material and workmanship for a period of 30 days from the date of purchase. If necessary, we would provide for the estimated cost of warranties based on specific warranty claims and claim history. However, we have never incurred significant expense under our product or service warranties. As a result, we believe our exposure related to these warranty agreements is minimal. Accordingly, there are no liabilities recorded for warranty claims as of September 30, 2018.
We enter into indemnification agreements in the ordinary course of business. Pursuant to these agreements, we generally agree to indemnify, hold harmless, and reimburse the indemnified party for losses suffered or incurred by the indemnified party, generally our customers, in connection with any patent, copyright or other intellectual property infringement claim by any third party with respect to our products. The term of these indemnification agreements is generally perpetual. The maximum potential amount of future payments we could be required to make under these indemnification agreements is unlimited. We have never incurred costs to defend lawsuits or settle claims related to these indemnification agreements. As a result, we believe our exposure related to these agreements is minimal. Accordingly, we have no liabilities recorded for these potential obligations as of September 30, 2018.
Certain of our agreements also provide for the performance of services at customer sites. These agreements may contain indemnification clauses, whereby we will indemnify the customer from any and all damages, losses, judgments, costs and expenses for acts of our employees or subcontractors resulting in bodily injury or property damage. The maximum potential amount of future payments we could be required to make under these indemnification agreements is unlimited; however, we have general and umbrella insurance policies that would enable us to recover a portion of any amounts paid. We have never incurred costs to defend lawsuits or settle claims related to these indemnification agreements. As a result, we believe our exposure related to these agreements is minimal. Accordingly, we have no liabilities recorded for these potential obligations as of September 30, 2018.
| 35 |
As permitted under Delaware law, we have agreements with our directors whereby we will indemnify them for certain events or occurrences while the director is, or was, serving at our request in such capacity. The term of the director indemnification period is for the later of ten years after the date that the director ceases to serve in such capacity and the final termination of proceedings against the director as outlined in the indemnification agreement. The maximum potential amount of future payments we could be required to make under these indemnification agreements is unlimited; however, our director and officer insurance policy would enable us to recover a portion of any future amounts paid. As a result of our insurance policy coverage, we believe our exposure related to these indemnification agreements is minimal. Accordingly, we have no liabilities recorded for these potential obligations as of September 30, 2018.
LIQUIDITY AND CAPITAL RESOURCES
We believe that our current cash balances and cash generated from operations will be sufficient to meet our cash needs for working capital and anticipated capital expenditures for at least the next twelve months. At September 30, 2018, we had $13.7 million of cash and cash equivalents as compared to $30.5 million as of September 30, 2017, a decrease of $16.8 million. $5.0 million of cash and cash equivalents at September 30, 2018 was located in foreign banks.
At September 30, 2018, we had working capital of $3.1 million as compared to $23.4 million as of September 30, 2017. If we anticipate additional cash requirements to fund growth or the acquisition of additional complementary technology or businesses, we may seek additional financing by issuing equity or obtaining credit facilities to fund such requirements. There can be no assurance that we will be able to issue additional equity or obtain a new or expanded credit facility at attractive prices or rates, or at all.
We had a net loss of $9.3 million, $4.0 million and $14.6 million for the fiscal years ended September 30, 2018, 2017 and 2016, respectively. During the fiscal years ended September 30, 2018 and 2016, $0.6 million and $6.3 million of cash was used by our operating activities, respectively. During the fiscal year ended September 30, 2017, $2.3 million of cash was provided by our operating activities. During fiscal year 2018, the main use of cash in operations was net loss adjusted for depreciation and amortization and share-based compensation expense as well as the increase in deferred revenue and decrease in unbilled accounts receivable and prepaid expenses and other long-term assets, offset by an increase in accounts receivable and a decrease in accounts payable, accrued expenses and other liabilities. During fiscal year 2017, the main provider of cash from operations was net loss adjusted for depreciation and amortization and share-based compensation expense as well as the increase in accounts payable, accrued expenses and deferred revenue, offset by a decrease in accounts receivable and prepaid expenses and other assets. During fiscal year 2016, the main use of cash in operations was net loss adjusted for depreciation and amortization, share-based compensation expense and deferred income taxes as well as the increase in prepaid expenses and other assets, offset by an increase in accounts payable, accrued expenses and other liabilities and deferred revenue.
Net cash used in investing activities for the years ended September 30, 2018, 2017 and 2016 was $24.7 million, $0.3 million, and $1.0 million, respectively. Net cash used in investing activities for the fiscal year ended September 30, 2018 was primarily related to the Angoss Acquisition as well as the purchase of property and equipment. Net cash used in investing activities for the years ended September 30, 2017 and 2016 was related to the purchase of property and equipment.
Net cash provided by financing activities for the year ended September 30, 2018 of $8.8 million was primarily related to the borrowings under the 2018 Loan Facility to partially fund the Angoss Acquisition and cash received from stock option exercises. Net cash provided by financing activities for the years ended September 30, 2017 and 2016 of $0.4 million and $0.1 million, respectively, was related to the proceeds from the issuance of common stock upon the exercise of outstanding stock options previously awarded under equity compensation plans.
We believe that our current operations have not been materially impacted by the effects of inflation.
| 36 |
RECENT ACCOUNTING PRONOUNCEMENTS
In January 2017, the FASB issued ASU 2017-04, Intangibles-Goodwill And Other (Topic 350): Simplifying The Test For Goodwill Impairment, in an effort to simplify the subsequent measurement of goodwill and the associated procedures to determine fair value. The guidance eliminates Step 2 from the goodwill impairment test. Instead, an entity should perform its annual, or interim, goodwill impairment test by comparing the fair value of the reporting unit with its carrying amount, and recognize an impairment charge for the amount by which the carrying amount exceeds the reporting unit’s fair value, not to exceed the total amount of goodwill allocated to the reporting unit. This guidance is effective for fiscal years beginning after December 15, 2019, including interim periods within that reporting period. The adoption of this guidance is not expected to have a material impact on our financial statements, unless we have an impairment.
In June 2016, the FASB issued ASU 2016-13, Financial Instruments – Credit Losses (Topic 326): Measurement of Credit Losses on Financial Instruments, which requires entities to estimate all expected credit losses for certain types of financial instruments, including trade receivables, held at the reporting date based on historical experience, current conditions, and reasonable and supportable forecasts. The updated guidance also expands the disclosure requirements to enable users of financial statements to understand the entity’s assumptions, models and methods for estimating expected credit losses. This guidance is effective for fiscal years beginning after December 15, 2019, including interim periods within that reporting period. Early adoption is permitted. The Company is in the process of evaluating the potential impacts of this new guidance on the Company’s consolidated financial statements and related disclosures.
In March 2016, the FASB issued ASU 2016-09, Improvements to Employee Share-Based Payment Accounting, which is intended to simplify various aspects of how share-based payments are accounted for and presented in financial statements. The standard is effective prospectively for fiscal years, and interim periods within those fiscal years, beginning after December 15, 2017, with early adoption permitted. The Company elected to adopt the pronouncement on a prospective basis starting from the first quarter of the fiscal year ended September 30, 2018. As a result of the adoption of ASU 2016-09, we recognize the impact of forfeitures when they occur with no adjustment for estimated forfeitures and recognize excess tax benefits as a reduction of income tax expense regardless of whether the benefit reduces income taxes payable. At September 30, 2017, the Company had approximately $7.6 million of Federal and state net operating loss carryovers related to excess stock compensation. The Company has increased its net operating loss deferred tax asset with a corresponding increase to its valuation allowance.
In February 2016, the FASB issued ASU 2016-02, Leases (Topic 842), which requires lessees to recognize, on the balance sheet, leases with a lease terms of greater than twelve months as a right-of-use asset and a lease liability. The standard is effective for fiscal years beginning after December 15, 2018. The Company is currently evaluating the effect that the standard will have on the Company’s consolidated financial statements and related disclosures.
In May 2014, the FASB issued ASU 2014-09, Revenue from Contracts with Customers (Topic 606). The ASU is the result of a joint project by the FASB and the International Accounting Standards Board (“IASB”) to clarify the principles for recognizing revenue and to develop a common revenue standard for GAAP and International Financial Reporting Standards (“IFRS”) that would: remove inconsistencies and weaknesses, provide a more robust framework for addressing revenue issues, improve comparability of revenue recognition practices across entities, jurisdictions, industries, and capital markets, improve disclosure requirements and resulting financial statements, and simplify the presentation of financial statements. The core principle of the new guidance is that an entity should recognize revenue to depict the transfer of promised goods or services to customers in an amount that reflects the consideration to which the entity expects to be entitled in exchange for those goods or services. The ASU was initially effective for annual reporting periods beginning after December 15, 2016. On July 9, 2015, the FASB voted to delay the effective date of the new revenue standard by one year, but to permit entities to choose to adopt the standard as of the original effective date.
The Company has adopted the full retrospective model on October 1, 2018. Quarterly results in the 2019 fiscal year and comparative prior periods will be compliant with ASC Topic 606, with the Annual Report on Form 10-K for the year ended September 30, 2019 being the first such Annual Report issued in compliance with ASC Topic 606.
| 37 |
The Company has substantially completed the implementation of ASC 606 and has identified the necessary changes to its policies, processes, systems, and controls. However, due to the complex nature of the Company’s arrangements and recent updates to interpretive guidance, the Company has not yet completed all of its internal control procedures.
Based upon the work performed to date, the Company expects to record a cumulative-effect adjustment as of September 30, 2016 to increase retained earnings by approximately $3.1 million which includes a $1.7 million increase due to the acceleration of subscription revenue, a $1.1 million increase due to deferred commission expense as a result of certain commissions being paid that have been deemed to be incremental in obtaining new contracts and are amortized over the estimated customer life and a $0.3 million increase due to estimated royalties being recorded in the period in which they were earned. We expect to fully disclose the impacts of the new standard in connection with our 10-Q filing for the first fiscal quarter of 2019.
The Company expects the following impacts:
| · | Currently, we recognize revenue from subscription licenses ratably over the term of the agreement. Subscription licenses currently include a maintenance element. A portion of the arrangement consideration will be allocated from the subscription to the maintenance obligation based on the relative stand-alone selling price. The adoption of the new revenue standard will result in revenue for performance obligations recognized as they are satisfied. Therefore, revenue from the subscription license performance obligation is expected to be recognized upon delivery. Revenue from maintenance includes two performance obligations, upgrades and customer support, and is expected to be recognized on a straight-line basis over the contractual term. |
| · | Currently, the Company allocates revenue to licenses under the residual method when it has Vendor Specific Objective Evidence (“VSOE”) for the remaining undelivered elements, which allocates any future credits or significant discounts entirely to the license. The adoption of ASC 606 will result in future credits, significant discounts, and material rights under ASC 606, generally allocated to all performance obligations based upon their relative selling price. Under ASC 606, additional license revenue from the reallocation of such arrangement considerations will be recognized when control is transferred to the client, which is generally upon delivery of the license. |
| · | Additionally, we do not have VSOE in software bundled arrangements involving fixed price services, which results in revenue being deferred and recognized ratably over the longest contractual performance period. The adoption of the new revenue standard eliminates the requirement for VSOE and replaces it with the concept of a stand-alone selling price. Once the transaction price is allocated to each of the performance obligations based on their relative stand-alone selling prices, we can recognize revenue as the performance obligations are delivered, either at a point in time or over time. Under the new revenue standard, fixed price consulting revenue will be recognized over time based on the input method that reflects the Company’s performance on the contract. This will result in the acceleration of consulting revenue when compared to the current practice of ratable recognition over the longest contractual service period for consulting when there is a lack of VSOE. |
| · | Under our current revenue recognition policy, we recognize royalty revenue in the period in which we receive royalty reports, which is typically in the quarter immediately following the quarter in which sales of royalty-bearing products occurred. Under the new standard, we will be required to make estimates of royalties earned in the current period and record royalty revenue based on those estimates. |
| · | We have also assessed accounting for incremental costs to obtain a contract and costs incurred in fulfilling a contract. We currently believe the most significant change to be accounting for commissions, as these incremental costs will be capitalized and will be amortized over a period of time which could extend beyond the initial contract term. |
| · | There will be a corresponding effect on taxes in relation to all of the above impacts. |
| · | We note that our internal control framework did not materially change upon adoption of the provisions of Topic 606 and the related cost guidance under ASC 340, but rather that existing internal controls were modified and augmented, as necessary, to consider our new revenue recognition policy that went into effect October 1, 2018. We have developed internal controls to ensure that we adequately evaluate our contracts and accurately restate our prior-period operating results under ASC 606. |
| 38 |
The Company has considered all other recently issued accounting pronouncements and does not believe the adoption of such pronouncements will have a material impact on its consolidated financial statements.
Item 7(A). QUANTITATIVE AND QUALITATIVE DISCLOSURES ABOUT MARKET RISK
Derivative Financial Instruments, Other Financial Instruments, and Derivative Commodity Instruments
At September 30, 2018, we did not participate in or hold any derivative financial instruments or commodity instruments and we did not hold any investment securities that possess significant market risk.
Primary Market Risk Exposures
Our primary market risk exposure is foreign currency exchange rate risk. International revenues and expenses are generally transacted by our foreign subsidiaries and are denominated in local currency. 20%, 17% and 14% of our revenues for fiscal 2018, 2017 and 2016, respectively, were from our foreign subsidiaries. In addition, 23%, 21% and 19% of our operating expenses for fiscal year 2018, 2017 and 2016 respectively, were from our foreign subsidiaries.
We are exposed to foreign currency exchange rate risk inherent in conducting business globally in several currencies, of which the most significant to our operations have historically been the Canadian Dollar and British Pound. Our exposure to currency exchange rate fluctuations has been and is expected to continue to be modest due to the fact that the operations of our international subsidiaries are almost exclusively conducted in their respective local currencies, and dollar advances to our international subsidiaries, if any, are usually considered to be of a long-term investment nature. Accordingly, the majority of currency movements are reflected in our other comprehensive income (loss). Foreign currency translation losses arising during fiscal years 2018 and 2017 were $0.1 million and $34,000, respectively. Foreign currency translation gains arising during fiscal year 2016 were $0.1 million. There are, however, certain situations where we will invoice customers in currencies other than our own. Such gains or losses from operating activity, whether realized or unrealized, are reflected in foreign currency transaction (losses) gains in the accompanying consolidated statements of operations for fiscal years 2018, 2017 and 2016 were gains of $0.2 million, losses of $49,000, and losses of $0.1 million, respectively.
| 39 |
Item 8. FINANCIAL STATEMENTS AND SUPPLEMENTARY DATA
The following consolidated financial statements and the related notes thereto of Datawatch Corporation and the Report of Independent Registered Public Accounting Firm thereon are filed as part of this Annual Report on Form 10-K.
| REPORT OF INDEPENDENT REGISTERED PUBLIC ACCOUNTING FIRM | 41 |
| CONSOLIDATED FINANCIAL STATEMENTS AS OF SEPTEMBER 30, 2018 AND 2017 AND FOR EACH OF THE THREE YEARS IN THE PERIOD ENDED SEPTEMBER 30, 2018: | |
| Consolidated Balance Sheets | 43 |
| Consolidated Statements of Operations | 44 |
| Consolidated Statements of Comprehensive Loss | 45 |
| Consolidated Statements of Shareholders’ Equity | 46 |
| Consolidated Statements of Cash Flows | 47 |
| Notes to Consolidated Financial Statements | 48 |
| 40 |
REPORT OF INDEPENDENT REGISTERED PUBLIC ACCOUNTING FIRM
To the Shareholders and the Board of Directors of Datawatch Corporation and Subsidiaries
Opinions on the Financial Statements and Internal Control Over Financial Reporting
We have audited the accompanying consolidated balance sheets of Datawatch Corporation and subsidiaries (the "Company") as of September 30, 2018 and 2017 and the related consolidated statements of operations, comprehensive loss, shareholders' equity and cash flows for each of the years in the three-year period ended September 30, 2018, and the related notes (collectively, the "financial statements"). We also have audited the Company’s internal control over financial reporting as of September 30, 2018, based on criteria established in Internal Control - Integrated Framework issued by the Committee of Sponsoring Organizations of the Treadway Commission in 2013.
In our opinion, the financial statements referred to above present fairly, in all material respects, the financial position of the Company as of September 30, 2018 and 2017, and the results of its operations and its cash flows for each of the years in the three-year period ended September 30, 2018, in conformity with accounting principles generally accepted in the United States of America. Also in our opinion, the Company maintained, in all material respects, effective internal control over financial reporting as of September 30, 2018, based on criteria established in Internal Control - Integrated Framework issued by the Committee of Sponsoring Organizations of the Treadway Commission in 2013.
Basis for Opinions
The Company's management is responsible for these financial statements, for maintaining effective internal control over financial reporting, and for its assessment of the effectiveness of internal control over financial reporting, included in the accompanying Management’s Report on Internal Control over Financial Reporting. Our responsibility is to express an opinion on the Company's financial statements and an opinion on the Company's internal control over financial reporting based on our audits. We are a public accounting firm registered with the Public Company Accounting Oversight Board ("United States") ("PCAOB") and are required to be independent with respect to the Company in accordance with U.S. federal securities laws and the applicable rules and regulations of the Securities and Exchange Commission and the PCAOB.
We conducted our audits in accordance with the standards of the PCAOB. Those standards require that we plan and perform the audits to obtain reasonable assurance about whether the financial statements are free of material misstatement, whether due to error or fraud, and whether effective internal control over financial reporting was maintained in all material respects.
Our audits of the financial statements included performing procedures to assess the risks of material misstatement of the financial statements, whether due to error or fraud, and performing procedures that respond to those risks. Such procedures included examining, on a test basis, evidence regarding the amounts and disclosures in the financial statements. Our audits also included evaluating the accounting principles used and significant estimates made by management, as well as evaluating the overall presentation of the financial statements. Our audit of internal control over financial reporting included obtaining an understanding of internal control over financial reporting, assessing the risk that a material weakness exists, and testing and evaluating the design and operating effectiveness of internal control based on the assessed risk. Our audits also included performing such other procedures as we considered necessary in the circumstances. We believe that our audits provide a reasonable basis for our opinions.
| 41 |
Definition and Limitations of Internal Control Over Financial Reporting
A company's internal control over financial reporting is a process designed to provide reasonable assurance regarding the reliability of financial reporting and the preparation of financial statements for external purposes in accordance with generally accepted accounting principles. A company's internal control over financial reporting includes those policies and procedures that (1) pertain to the maintenance of records that, in reasonable detail, accurately and fairly reflect the transactions and dispositions of the assets of the company; (2) provide reasonable assurance that transactions are recorded as necessary to permit preparation of financial statements in accordance with generally accepted accounting principles, and that receipts and expenditures of the company are being made only in accordance with authorizations of management and directors of the company; and (3) provide reasonable assurance regarding prevention or timely detection of unauthorized acquisition, use or disposition of the company's assets that could have a material effect on the financial statements.
Because of its inherent limitations, internal control over financial reporting may not prevent or detect misstatements. Also, projections of any evaluation of effectiveness to future periods are subject to the risk that controls may become inadequate because of changes in conditions, or that the degree of compliance with the policies or procedures may deteriorate.
/s/ RSM US LLP
Boston, MA
December 13, 2018
We have served as the Company’s auditor since 2013.
| 42 |
CONSOLIDATED BALANCE SHEETS
(In thousands, except share amounts)
| September 30, | September 30, | |||||||
| 2018 | 2017 | |||||||
| ASSETS | ||||||||
| CURRENT ASSETS: | ||||||||
| Cash and cash equivalents | $ | 13,735 | $ | 30,451 | ||||
| Accounts receivable, net of allowance for doubtful accounts of $93 and $60 as of September 30, 2018 and September 30, 2017, respectively | 9,802 | 7,306 | ||||||
| Unbilled accounts receivable | 2,805 | - | ||||||
| Prepaid expenses and other current assets | 2,131 | 2,789 | ||||||
| Total current assets | 28,473 | 40,546 | ||||||
| Property and equipment, net | 1,047 | 1,064 | ||||||
| Acquired intellectual property, net | 3,743 | 887 | ||||||
| Other intangible assets, net | 4,775 | 969 | ||||||
| Goodwill and indefinite-lived intangible assets | 21,518 | 6,685 | ||||||
| Deferred tax asset, net | 36 | - | ||||||
| Other long-term assets | 2,092 | 254 | ||||||
| Total assets | $ | 61,684 | $ | 50,405 | ||||
| LIABILITIES AND SHAREHOLDERS’ EQUITY | ||||||||
| CURRENT LIABILITIES: | ||||||||
| Current portion of debt, net | $ | 2,044 | $ | - | ||||
| Accounts payable | 2,074 | 2,360 | ||||||
| Accrued expenses | 3,044 | 3,521 | ||||||
| Deferred revenue | 18,191 | 11,303 | ||||||
| Total current liabilities | 25,353 | 17,184 | ||||||
| LONG-TERM LIABILITIES: | ||||||||
| Long-term debt, net | 6,440 | - | ||||||
| Deferred revenue, long-term | 2,078 | 302 | ||||||
| Deferred tax liability | 848 | - | ||||||
| Other long-term liabilities | 448 | 390 | ||||||
| Total long-term liabilities | 9,814 | 692 | ||||||
| Total liabilities | 35,167 | 17,876 | ||||||
| COMMITMENTS AND CONTINGENCIES (Note 7) | ||||||||
| SHAREHOLDERS’ EQUITY: | ||||||||
| Common stock, par value $0.01; authorized: 20,000,000 shares; issued and outstanding: 12,750,993 shares and 12,736,747 shares, respectively, as of September 30, 2018 and 12,272,704 shares and 12,258,458 shares, respectively, as of September 30, 2017 | 128 | 123 | ||||||
| Additional paid-in capital | 148,582 | 145,262 | ||||||
| Accumulated deficit | (120,068 | ) | (110,816 | ) | ||||
| Accumulated other comprehensive loss | (1,985 | ) | (1,900 | ) | ||||
| 26,657 | 32,669 | |||||||
| Less treasury stock, at cost, 14,246 shares | (140 | ) | (140 | ) | ||||
| Total shareholders’ equity | 26,517 | 32,529 | ||||||
| Total liabilities and shareholders’ equity | $ | 61,684 | $ | 50,405 | ||||
See accompanying notes to these consolidated financial statements.
| 43 |
CONSOLIDATED STATEMENTS OF OPERATIONS
(In thousands, except per share amounts)
| Years Ended | ||||||||||||
| September 30, | ||||||||||||
| 2018 | 2017 | 2016 | ||||||||||
| REVENUE: | ||||||||||||
| Software licenses | $ | 24,759 | $ | 20,051 | $ | 15,219 | ||||||
| Maintenance | 15,588 | 14,473 | 13,915 | |||||||||
| Professional services | 1,331 | 1,739 | 1,328 | |||||||||
| Total revenues | 41,678 | 36,263 | 30,462 | |||||||||
| COSTS AND EXPENSES: | ||||||||||||
| Cost of software licenses | 1,298 | 1,895 | 2,828 | |||||||||
| Cost of maintenance and services (1) | 3,622 | 2,349 | 2,177 | |||||||||
| Sales and marketing (1) | 22,597 | 19,124 | 20,783 | |||||||||
| Engineering and product development (1) | 11,421 | 8,888 | 8,167 | |||||||||
| General and administrative (1) | 11,835 | 8,777 | 9,636 | |||||||||
| Total costs and expenses | 50,773 | 41,033 | 43,591 | |||||||||
| LOSS FROM OPERATIONS | (9,095 | ) | (4,770 | ) | (13,129 | ) | ||||||
| Interest expense | (399 | ) | - | - | ||||||||
| Other income | 57 | 808 | 44 | |||||||||
| Foreign currency transaction gain (loss) | 174 | (49 | ) | (74 | ) | |||||||
| LOSS FROM OPERATIONS BEFORE INCOME TAXES | (9,263 | ) | (4,011 | ) | (13,159 | ) | ||||||
| Income tax (expense) benefit | 11 | 18 | (1,473 | ) | ||||||||
| NET LOSS | $ | (9,252 | ) | $ | (3,993 | ) | $ | (14,632 | ) | |||
| Net loss per share – basic: | $ | (0.74 | ) | $ | (0.33 | ) | $ | (1.24 | ) | |||
| Net loss per share – diluted: | $ | (0.74 | ) | $ | (0.33 | ) | $ | (1.24 | ) | |||
| Weighted-average shares outstanding – basic | 12,521 | 12,073 | 11,758 | |||||||||
| Weighted-average shares outstanding – diluted | 12,521 | 12,073 | 11,758 | |||||||||
| (1) Includes share-based compensation as follows: | ||||||||||||
| Cost of maintenance and services | $ | 62 | $ | 37 | $ | 37 | ||||||
| Sales and marketing | 869 | 579 | 1,028 | |||||||||
| Engineering and product development | 592 | 438 | 359 | |||||||||
| General and administrative | 1,452 | 1,119 | 1,407 | |||||||||
| $ | 2,975 | $ | 2,173 | $ | 2,831 | |||||||
See accompanying notes to these consolidated financial statements.
| 44 |
CONSOLIDATED STATEMENTS OF COMPREHENSIVE LOSS
(In thousands)
| Years Ended | ||||||||||||
| September 30, | ||||||||||||
| 2018 | 2017 | 2016 | ||||||||||
| Net loss | $ | (9,252 | ) | $ | (3,993 | ) | $ | (14,632 | ) | |||
| Other comprehensive income (loss): | ||||||||||||
| Foreign currency translation adjustments | (85 | ) | (34 | ) | 109 | |||||||
| Comprehensive loss | (9,337 | ) | (4,027 | ) | (14,523 | ) | ||||||
See accompanying notes to these consolidated financial statements.
| 45 |
CONSOLIDATED STATEMENTS OF SHAREHOLDERS’ EQUITY
(In thousands, except share amounts)
| Accumulated | ||||||||||||||||||||||||||||||||
| Additional | Other | |||||||||||||||||||||||||||||||
| Common Stock | Paid-In | Accumulated | Comprehensive | Treasury Stock | ||||||||||||||||||||||||||||
| Shares | Amount | Capital | Deficit | Loss | Shares | Amount | Total | |||||||||||||||||||||||||
| BALANCE, SEPTEMBER 30, 2015 | 11,640,097 | $ | 116 | $ | 139,732 | $ | (92,191 | ) | $ | (1,975 | ) | (14,246 | ) | $ | (140 | ) | $ | 45,542 | ||||||||||||||
| Exercise of stock options | 22,500 | - | 105 | - | - | - | - | 105 | ||||||||||||||||||||||||
| Vesting of restricted stock | 275,435 | 3 | - | - | - | - | - | 3 | ||||||||||||||||||||||||
| Share-based compensation expense | - | - | 2,831 | - | - | - | - | 2,831 | ||||||||||||||||||||||||
| Translation adjustments | - | - | - | - | 109 | - | - | 109 | ||||||||||||||||||||||||
| Net loss | - | - | - | (14,632 | ) | - | - | - | (14,632 | ) | ||||||||||||||||||||||
| BALANCE, SEPTEMBER 30, 2016 | 11,938,032 | 119 | 142,668 | (106,823 | ) | (1,866 | ) | (14,246 | ) | (140 | ) | 33,958 | ||||||||||||||||||||
| Exercise of stock options | 100,000 | 1 | 421 | - | - | - | - | 422 | ||||||||||||||||||||||||
| Vesting of restricted stock | 234,672 | 3 | - | - | - | - | - | 3 | ||||||||||||||||||||||||
| Share-based compensation expense | - | - | 2,173 | - | - | - | - | 2,173 | ||||||||||||||||||||||||
| Translation adjustments | - | - | - | - | (34 | ) | - | - | (34 | ) | ||||||||||||||||||||||
| Net loss | - | - | - | (3,993 | ) | - | - | - | (3,993 | ) | ||||||||||||||||||||||
| BALANCE, SEPTEMBER 30, 2017 | 12,272,704 | 123 | 145,262 | (110,816 | ) | (1,900 | ) | (14,246 | ) | (140 | ) | 32,529 | ||||||||||||||||||||
| Exercise of stock options | 100,000 | 1 | 345 | - | - | - | - | 346 | ||||||||||||||||||||||||
| Vesting of restricted stock | 378,289 | 4 | - | - | - | - | - | 4 | ||||||||||||||||||||||||
| Share-based compensation expense | - | - | 2,975 | - | - | - | - | 2,975 | ||||||||||||||||||||||||
| Translation adjustments | - | - | - | - | (85 | ) | - | - | (85 | ) | ||||||||||||||||||||||
| Net loss | - | - | - | (9,252 | ) | - | - | - | (9,252 | ) | ||||||||||||||||||||||
| BALANCE, SEPTEMBER 30, 2018 | 12,750,993 | $ | 128 | $ | 148,582 | $ | (120,068 | ) | $ | (1,985 | ) | (14,246 | ) | $ | (140 | ) | $ | 26,517 | ||||||||||||||
See accompanying notes to these consolidated financial statements.
| 46 |
CONSOLIDATED STATEMENTS OF CASH FLOWS
(In thousands)
| Years Ended September 30, | ||||||||||||
| 2018 | 2017 | 2016 | ||||||||||
| CASH FLOWS FROM OPERATING ACTIVITIES: | ||||||||||||
| Net loss | $ | (9,252 | ) | $ | (3,993 | ) | $ | (14,632 | ) | |||
| Adjustments to reconcile net loss to cash provided by (used in) operating activities: | ||||||||||||
| Depreciation and amortization | 1,662 | 1,627 | 2,548 | |||||||||
| Provision for doubtful accounts | 33 | 32 | (75 | ) | ||||||||
| Share-based compensation expense | 2,975 | 2,173 | 2,831 | |||||||||
| Deferred income taxes | (36 | ) | - | 1,567 | ||||||||
| Amortization of debt issuance costs | 16 | - | - | |||||||||
| Changes in operating assets and liabilities: | ||||||||||||
| Accounts receivable | (498 | ) | (332 | ) | 92 | |||||||
| Unbilled accounts receivable | 1,653 | - | - | |||||||||
| Prepaid expenses and other long-term assets | 1,284 | (479 | ) | (293 | ) | |||||||
| Accounts payable, accrued expenses and other liabilities | (1,758 | ) | 1,580 | 295 | ||||||||
| Deferred revenue | 3,363 | 1,684 | 1,398 | |||||||||
| Cash provided by (used in) operating activities | (558 | ) | 2,292 | (6,269 | ) | |||||||
| CASH FLOWS FROM INVESTING ACTIVITIES: | ||||||||||||
| Acquisition of Angoss Software, net of cash acquired (Note 2) | (24,559 | ) | - | - | ||||||||
| Purchases of property and equipment | (170 | ) | (277 | ) | (966 | ) | ||||||
| Cash used in investing activities | (24,729 | ) | (277 | ) | (966 | ) | ||||||
| CASH FLOWS FROM FINANCING ACTIVITIES: | ||||||||||||
| Proceeds from exercise of stock options | 346 | 422 | 105 | |||||||||
| Borrowings under debt agreement | 10,000 | - | - | |||||||||
| Cash paid for debt issuance costs | (74 | ) | - | - | ||||||||
| Principal repayments on outstanding debt | (1,458 | ) | - | - | ||||||||
| Cash provided by financing activities | 8,814 | 422 | 105 | |||||||||
| EFFECT OF EXCHANGE RATE CHANGES ON CASH AND CASH EQUIVALENTS | (243 | ) | (20 | ) | 2 | |||||||
| INCREASE (DECREASE) IN CASH AND CASH EQUIVALENTS | (16,716 | ) | 2,417 | (7,128 | ) | |||||||
| CASH AND CASH EQUIVALENTS, BEGINNING OF PERIOD | 30,451 | 28,034 | 35,162 | |||||||||
| CASH AND CASH EQUIVALENTS, END OF PERIOD | $ | 13,735 | $ | 30,451 | $ | 28,034 | ||||||
| SUPPLEMENTAL DISCLOSURES OF CASH FLOW INFORMATION: | ||||||||||||
| Interest paid | $ | 401 | $ | - | $ | - | ||||||
| Income taxes paid | $ | 17 | $ | 18 | $ | 34 | ||||||
See accompanying notes to these consolidated financial statements.
| 47 |
NOTE 1. NATURE OF BUSINESS AND SUMMARY OF SIGNIFICANT ACCOUNTING POLICIES
Nature of Business
Datawatch Corporation (the “Company” or “Datawatch”) designs, develops, markets and distributes business computer software products. The Company also provides services, including implementation and support of its software products, as well as training on their use and administration. The Company is subject to a number of risks including dependence on key individuals, competition from substitute products and larger companies and the need for successful ongoing development and marketing of products.
Summary of Significant Accounting Policies
Basis of Presentation and Principles of Consolidation
These consolidated financial statements include the accounts of Datawatch and its wholly-owned subsidiaries. All intercompany accounts and transactions have been eliminated in consolidation.
Accounting Estimates
The preparation of financial statements in conformity with U.S. GAAP requires management to make estimates and judgments, which are evaluated on an on-going basis, that affect the amounts and disclosures reported in the Company’s consolidated financial statements and accompanying notes. Management bases its estimates on historical experience and on various other assumptions that it believes are reasonable under the circumstances, the results of which form the basis for making judgments about the carrying values of assets and liabilities that are not readily apparent from other sources. The most significant estimates and judgments include those related to revenue recognition, the allowance for doubtful accounts, sales returns reserve, valuation of share-based compensation awards, useful lives of property and equipment and intangibles, and the valuation of long term assets including goodwill, intellectual property and intangibles, and deferred tax assets. Actual results could differ from those estimates and judgments.
Business Combinations
We allocate the fair value of purchase consideration to Angoss’ tangible assets acquired, liabilities assumed and intangible assets acquired based on their estimated fair values. The excess of the fair value of purchase consideration over the fair values of these identifiable assets and liabilities is recorded as goodwill. When determining the fair values of assets acquired and liabilities assumed, management makes significant estimates and assumptions, especially with respect to intangible assets.
Critical estimates in valuing certain intangible assets include, but are not limited to, future expected cash flows from customer relationships and acquired developed technology and discount rates. Management’s estimates of fair value are based upon assumptions believed to be reasonable, but which are inherently uncertain and unpredictable and, as a result, actual results may differ materially from estimates. Other estimates associated with the accounting for acquisitions may change as additional information becomes available regarding the assets acquired and liabilities assumed.
Revenue Recognition
Datawatch software products are generally sold in multiple element arrangements which may include software licenses, professional services and post-contract customer support (“PCS”). The Company licenses its software products directly to end-users and indirectly to end-users through value added resellers and distributors. Sales to indirect distribution channels accounted for 37%, 36% and 35% of total sales for the years ended September 30, 2018, 2017 and 2016, respectively. The Company’s software product offerings do not require customization and can be installed and used by customers on their own with little or no configuration required. Multi-user licenses marketed by the Company are sold as a right to use the number of licenses, and the license fee revenue is recognized upon delivery of the software.
| 48 |
Revenue typically consists of software licenses, PCS and professional services. Revenue from the sale of software products is generally recognized at the time of delivery, provided there are no uncertainties surrounding product acceptance, the fee is fixed or determinable, collectability is reasonably assured, persuasive evidence of the arrangement exists and there are no significant obligations remaining. PCS is typically provided under a maintenance agreement which provides technical support and rights to unspecified software maintenance updates and bug fixes on a when-and-if available basis. Revenue from PCS agreements is deferred and recognized ratably over the term of the agreements, typically one year. Professional services include advanced modeling, application design, implementation and configuration and process optimization with revenue recognized as the services are performed. These services are generally delivered on a time and materials basis, billed on a current basis as the work is performed, and generally do not involve modification or customization of the software or any unusual acceptance clauses or provisions.
For multiple element arrangements, total fees are allocated to each of the undelivered elements based upon vendor specific objective evidence (“VSOE”) of their fair values, with the residual amount recognized as revenue for the delivered elements. The residual method of revenue recognition is used for multi-element arrangements when the VSOE of the fair value does not exist for one of the delivered elements, generally the software license. Under the residual method, the arrangement fee is recognized as follows: (1) the total fair value of the undelivered elements, as supported by VSOE, is deferred and subsequently recognized as such items are delivered or completed and (2) the difference between the total arrangement fee and the amount allocated to the undelivered elements is recognized as revenue related to the delivered elements. The Company has established VSOE of fair value of PCS from either contractually stated renewal rates or using the bell-shaped curve method. Additionally, VSOE of fair value of the professional services is based on the amounts charged for these elements when sold separately.
Certain deals related to Angoss products contain unbilled receivables, fixed price services and multi-year contract term licenses with significant and incremental discounts. We do not have VSOE in software bundled arrangements involving fixed price services, which results in revenue being deferred and recognized ratably over the longest contractual period. Additionally, we may enter into multi-year contracts with customers that include a discount on future renewal options that is significant and incremental to the initial arrangement. A portion of the fee is deferred as a result of the significant and incremental discount and is recognized as revenue proportionally as future renewals are delivered or as the discount expires.
The Company also licenses its enterprise software using a subscription model. At the time a customer enters into a binding agreement to purchase a subscription, the customer is invoiced annually in advance and an account receivable and deferred revenue are recorded. Beginning on the date the software is delivered and available for use by the customer, and provided that all other criteria for revenue recognition are met, the deferred revenue amount is recognized ratably over the period the service is provided. The subscription arrangement includes software, maintenance and unspecified future upgrades including major version upgrades on a when-and-if available basis.
The Company’s software products are sold under warranty against certain defects in material and workmanship for a period of 30 days from the date of purchase. Revenue from the sale of software products to distributors and resellers is recognized at the time of shipment providing all other revenue recognition criteria are met and (i) the distributor or reseller is unconditionally obligated to pay for the products, including no contingency as to product resale, (ii) the distributor or reseller has independent economic substance apart from the Company, (iii) the Company is not obligated for future performance to bring about product resale, and (iv) the amount of future returns can be reasonably estimated. The Company’s experience and history with its distributors and resellers allows for reasonable estimates of future returns.
| 49 |
Allowance for Doubtful Accounts
The Company maintains allowances for doubtful accounts for estimated losses resulting from the inability of customers to make required payments. The Company analyzes accounts receivable and the composition of the accounts receivable aging, historical bad debts, customer creditworthiness, current economic trends and changes in customer payment terms when evaluating the adequacy of the allowance for doubtful accounts. Actual results could differ from the allowances recorded, and this difference could have a material effect on the Company’s financial position and results of operations. Receivables are written off against these allowances in the period they are determined to be uncollectible.
For the fiscal years ended September 30, 2018, 2017 and 2016, changes to and ending balances of the allowance for doubtful accounts were as follows:
| September 30, | ||||||||||||
| 2018 | 2017 | 2016 | ||||||||||
| (In thousands) | ||||||||||||
| Allowance for doubtful accounts balance - beginning of year | $ | 60 | $ | 28 | $ | 106 | ||||||
| Additions to the allowance for doubtful accounts | 117 | 113 | 51 | |||||||||
| Deductions against the allowance for doubtful accounts | (84 | ) | (81 | ) | (129 | ) | ||||||
| Allowance for doubtful accounts balance - end of year | $ | 93 | $ | 60 | $ | 28 | ||||||
Cash and Cash Equivalents
Cash and cash equivalents include cash on hand, cash deposited with banks and highly liquid securities consisting of money market investments with original maturities of 90 days or less.
Concentration of Credit Risks and Major Customers
Financial instruments, which potentially expose the Company to concentrations of credit risk consist primarily of cash, cash equivalents, and accounts receivable. The Company’s cash is maintained with what management believes to be a high-credit quality financial institution. At times, deposits held at this bank may exceed the federally insured limits. Management believes that the financial institutions that hold the Company’s deposits are financially sound and have minimal credit risk. Risks associated with cash and cash equivalents are mitigated by the Company’s investment policy, which limits the Company’s investing of excess cash into only money market mutual funds.
The Company licenses its products and services directly to end-users and indirectly to end-users through U.S. and non-U.S. distributors and other software resellers, under customary credit terms. No partners or customers accounted for more than 10% of total revenue for the years ended September 30, 2018 and 2016. One partner accounted for 12% of total revenue for the year ended September 30, 2017. No partner or customer constituted a significant portion (more than 10%) of accounts receivable for the years ended September 30, 2018 and 2017. The Company performs ongoing credit evaluations of its customers and generally does not require collateral.
Deferred Revenue
Deferred revenue consisted of the following at September 30:
| September 30, | ||||||||
| 2018 | 2017 | |||||||
| (In thousands) | ||||||||
| Maintenance | $ | 10,336 | $ | 8,632 | ||||
| Software licenses | 9,561 | 2,853 | ||||||
| Professional services | 372 | 120 | ||||||
| Total | 20,269 | 11,605 | ||||||
| Less: Long-term portion of deferred revenue | (2,078 | ) | (302 | ) | ||||
| Current portion of deferred revenue | $ | 18,191 | $ | 11,303 | ||||
| 50 |
Deferred maintenance revenue consists primarily of the unearned portion of customer support services provided by the Company to customers who purchased maintenance agreements for the Company’s products. Maintenance revenues are recognized on a straight-line basis over the term of the maintenance period, generally 12 months. Deferred license revenue consists primarily of the unearned portion of revenue from subscription sales and are recognized on a straight-line basis over the term of the subscription period. The increase in the long-term portion of deferred revenue is attributable to Angoss multi-year contracts. We may enter into multi-year contracts with customers that include a discount on future renewal options that is significant and incremental to the initial arrangement. A portion of the fee is deferred as a result of the significant and incremental discount and is recognized as revenue proportionally as future renewals are delivered or as the discount expires.
Deferred professional services revenue is generated from arrangements that are invoiced in accordance with the terms and conditions of the arrangement but do not meet all the criteria for revenue recognition and are, therefore, deferred until all revenue recognition criteria are met.
Property and Equipment
Property and equipment consists of office equipment, furniture and fixtures, software and leasehold improvements, all of which are recorded at cost. Depreciation and amortization are provided using the straight-line method over the lesser of the estimated useful lives of the related assets or term of the related leases. Useful lives and lease terms range from three to seven years. Depreciation and amortization expense related to property and equipment was $0.4 million for each of the years ended September 30, 2018, 2017, and 2016.
Long-Lived Assets
Intangible assets are reviewed for impairment whenever events or changes in circumstances indicate that the carrying amount of the asset may not be recoverable and an impairment loss is recognized when it is probable that the estimated cash flows are less than the carrying amount of the asset.
Long-Lived Assets: Acquired Intellectual Property
Acquired intellectual property consists of software source code acquired through business combinations. The acquired intellectual property assets are being amortized to cost of software licenses using the straight-line method over the estimated life of the asset.
Acquired intellectual property, net, were comprised of the following at September 30, 2018 and 2017 (in thousands):
| 51 |
| September 30, 2018 | ||||||||||||||
| Identified | Weighted | Gross | ||||||||||||
| Intangible | Average | Carrying | Accumulated | Net Carrying | ||||||||||
| Asset | Useful Life | Amount | Amortization | Amount | ||||||||||
| (In years) | ||||||||||||||
| Intellectual property | 8 | $ | 15,021 | $ | (11,278 | ) | $ | 3,743 | ||||||
| September 30, 2017 | ||||||||||||||
| Identified | Weighted | Gross | ||||||||||||
| Intangible | Average | Carrying | Accumulated | Net Carrying | ||||||||||
| Asset | Useful Life | Amount | Amortization | Amount | ||||||||||
| (In years) | ||||||||||||||
| Intellectual property | 8 | $ | 11,621 | $ | (10,734 | ) | $ | 887 | ||||||
Amortization expense related to the acquired intellectual property assets charged to cost of software licenses for the years ended September 30, 2018, 2017 and 2016, was $0.5 million, $1.1 million and $2.0 million, respectively.
The future amortization expense related to the acquired intellectual property is as follows (in thousands):
| Fiscal Years Ending September 30, | ||||
| 2019 | $ | 685 | ||
| 2020 | 685 | |||
| 2021 | 533 | |||
| 2022 | 425 | |||
| 2023 | 425 | |||
| Thereafter | 990 | |||
| Total future amortization expense | $ | 3,743 | ||
Long-Lived Assets: Other Intangible Assets
Other intangible assets consist of trade names, patents and customer lists acquired through business combinations. The values allocated to these intangible assets are amortized using the straight-line method over the estimated useful life of the related asset.
Other intangible assets, net, were comprised of the following at September 30, 2018 and 2017 (in thousands):
| September 30, 2018 | ||||||||||||||
| Identified | Weighted | Gross | ||||||||||||
| Intangible | Average | Carrying | Accumulated | Net Carrying | ||||||||||
| Asset | Useful Life | Amount | Amortization | Amount | ||||||||||
| (In years) | ||||||||||||||
| Patents | 20 | $ | 160 | $ | (113 | ) | $ | 47 | ||||||
| Customer lists | 8 | 8,075 | (3,347 | ) | 4,728 | |||||||||
| Trade names | 0 | 120 | (120 | ) | - | |||||||||
| Total | $ | 8,355 | $ | (3,580 | ) | $ | 4,775 | |||||||
| 52 |
| September 30, 2017 | ||||||||||||||
| Identified | Weighted | Gross | ||||||||||||
| Intangible | Average | Carrying | Accumulated | Net Carrying | ||||||||||
| Asset | Useful Life | Amount | Amortization | Amount | ||||||||||
| (In years) | ||||||||||||||
| Patents | 20 | $ | 160 | $ | (105 | ) | $ | 55 | ||||||
| Customer lists | 14 | 3,574 | (2,660 | ) | 914 | |||||||||
| Trade names | 3 | 120 | (120 | ) | - | |||||||||
| Total | $ | 3,854 | $ | (2,885 | ) | $ | 969 | |||||||
Amortization expense related to other intangible assets charged to sales and marketing totaled $0.7 million, $0.1 million and $0.2 million for fiscal 2018, 2017 and 2016, respectively. There was no amortization expense related to other intangible assets charged to general and administrative expense in fiscal years 2018 and 2017. Amortization expense related to other intangible assets charged to general and administrative expense totaled $20,000 for fiscal 2016.
The future amortization expense related to amortizing other intangible assets is as follows (in thousands):
| Fiscal Years Ending September 30, | ||||
| 2019 | $ | 992 | ||
| 2020 | 992 | |||
| 2021 | 992 | |||
| 2022 | 992 | |||
| 2023 | 389 | |||
| Thereafter | 418 | |||
| Total future amortization expense | $ | 4,775 | ||
Goodwill and Indefinite-Lived Assets
Goodwill represents the excess of the purchase price over the fair value of identifiable net assets of acquired businesses. Indefinite-lived intangibles are intangible assets whose useful lives are indefinite in that their lives extend beyond the foreseeable horizon – that is there is no foreseeable limit on the period of time over which they are expected to contribute to the cash flows of the reporting entity. The Company accounts for these items in accordance with FASB’s ASC 350 Intangibles – Goodwill and Other. This requires that goodwill and intangible assets having indefinite lives are not amortized but instead are reviewed annually, or more frequently as a result of an event or change in circumstances, for possible impairment with impaired assets written down to fair value. Goodwill, assembled workforce and Angoss trade names are considered indefinite-lived intangibles. The Company conducts its annual impairment test for goodwill and indefinite-lived intangible assets during the fourth quarter of each fiscal year.
| 53 |
The following table presents the changes in the carrying amount of goodwill and indefinite lived intangibles (in thousands):
| Amount | ||||
| Balance as of September 30, 2017 | $ | 6,685 | ||
| Goodwill acquired from the Angoss Acquisition | 11,633 | |||
| Indefinite lived trade names acquired from the Angoss Acquisition | 3,200 | |||
| Balance as of September 30, 2018 | $ | 21,518 | ||
Fair Value Measurements
The Company’s financial instruments consist of cash and cash equivalents, accounts receivable and accounts payable. The estimated fair values have been determined through information obtained from market sources and management estimates. The estimated fair value of certain financial instruments including cash equivalents, accounts receivable and account payable, approximate the carrying value due to their short-term maturity.
The fair value of the Company’s financial assets and liabilities are measured using inputs from the three levels of fair value hierarchy which are as follows:
· Level 1 — Quoted prices in active markets for identical assets or liabilities;
· Level 2 — Inputs other than Level 1 that are observable, either directly or indirectly, such as quoted prices for similar assets or liabilities; quoted prices in markets that are not active; or other inputs that are observable or can be corroborated by observable market data for substantially the full term of the assets or liabilities; and
· Level 3 — Unobservable inputs that are supported by little or no market activity and that are significant to the fair value of the assets or liabilities.
The Company classified its cash equivalents, which primarily include money market mutual funds, of $16.5 million as of September 30, 2017 within Level 2 of the fair value hierarchy. The Company held no money market mutual funds as of September 30, 2018
As of September 30, 2017, the Company’s assets that are measured on a recurring basis include the following (in thousands):
| September 30, 2017 | ||||||||||||
| Fair Value Measurement | ||||||||||||
| Using Input Types | ||||||||||||
| Level 1 | Level 2 | Level 3 | ||||||||||
| Assets: | ||||||||||||
| Money market funds | $ | - | $ | 16,470 | $ | - | ||||||
| Total | $ | - | $ | 16,470 | $ | - | ||||||
| 54 |
Non-financial assets such as goodwill and long-lived assets are also subject to fair value measurements. Goodwill is subject to recurring fair value measurements to determine whether impairment exists. Long-lived assets are subject to non-recurring fair value measurements if they are deemed to be impaired. The impairment models used for nonfinancial assets depend on the type of asset and are accounted for in accordance with the FASB guidance on fair value measurement.
Income Taxes
The provision for income taxes is based on the earnings or losses reported in the consolidated financial statements. The Company recognizes deferred tax liabilities and assets for the expected future tax consequences of events that have been recognized in the Company’s financial statements or tax returns. Deferred tax liabilities and assets are determined based on the difference between the financial statement carrying amounts and tax bases of assets and liabilities using enacted tax rates in effect in the years in which the differences are expected to reverse. The Company provides a valuation allowance against deferred tax assets if it is more likely than not that some or all of the deferred tax assets will not be realized.
The Company follows the accounting guidance for uncertain tax positions. This guidance clarifies the accounting for income taxes by prescribing the minimum threshold a tax position is required to meet before being recognized in the financial statements. It also provides guidance on derecognition, measurement, classification, interest and penalties, accounting in interim periods, disclosure and transition.
Net Loss Per Share
Basic net loss per common share is computed by dividing net loss by the weighted-average number of common shares outstanding during the period.
The following table details the derivation of weighted-average shares outstanding used in the calculation of basic and diluted net loss for each period (in thousands, except share data):
| Years Ended | ||||||||||||
| September 30, | ||||||||||||
| 2018 | 2017 | 2016 | ||||||||||
| Net loss | $ | (9,252 | ) | $ | (3,993 | ) | $ | (14,632 | ) | |||
| Weighted-average number of common shares outstanding | 12,521 | 12,073 | 11,758 | |||||||||
| Net loss per share | $ | (0.74 | ) | $ | (0.33 | ) | $ | (1.24 | ) | |||
As the Company was in a net loss position in fiscal 2018, 2017 and 2016, all common stock equivalents (vested stock options and unvested RSUs) in the respective periods were anti-dilutive. As a result of being anti-dilutive, 184,738 shares, 220,729 shares and 384,312 shares for the years ended September 30, 2018, 2017 and 2016, respectively, were excluded in the calculation above.
| 55 |
Foreign Currency Translations and Transactions
The Company’s foreign subsidiaries functional currency is their local currency. As a result, assets and liabilities of foreign subsidiaries are translated into U.S. dollars at rates in effect at each balance sheet date. Revenues, expenses and cash flows are translated into U.S. dollars at average rates prevailing during the respective period. The related translation adjustments are reported as a separate component of shareholders’ equity under the heading “Accumulated Other Comprehensive Loss.” Included in comprehensive loss are the foreign currency translation adjustments. During fiscal years 2018, 2017, and 2016 there were foreign currency translation losses of $0.1 million, losses of $34,000 and gains of $0.1 million, respectively.
Gains and losses resulting from transactions that are denominated in currencies other than the applicable unit’s functional currency are included in the operating results of the Company. For fiscal years 2018, 2017 and 2016 there were gains of $0.2 million, losses of $49,000 and losses of $0.1 million, respectively.
Advertising and Promotional Materials
Advertising and promotional costs are expensed as incurred and amounted to $0.2 million, $0.1 million and $0.6 million in fiscal years 2018, 2017 and 2016, respectively.
Share-Based Compensation
The Company recognizes the fair value of share-based awards over the requisite service period of the individual awards, which generally equals the vesting period. All of the Company’s share-based awards are accounted for as equity instruments and there have been no liability awards granted. See additional share-based compensation disclosure in Note 5.
Segment Information and Revenue by Geographic Location
The Company has determined that it has only one reportable segment. The Company’s chief operating decision maker, its Chief Executive Officer, does not manage any part of the Company separately, and the allocation of resources and assessment of performance is based solely on the Company’s consolidated operations and operating results. See Note 9 for information about the Company’s revenue by geographic operations.
Guarantees and Indemnifications
The Company’s software products are sold under warranty against certain defects in material and workmanship for a period of 30 days from the date of purchase. The Company has never incurred significant expense under its product or service warranties and does not expect to do so in the future. As a result, the Company believes its exposure related to these warranty agreements is minimal. Accordingly, there are no liabilities recorded for warranty claims as of September 30, 2018 or 2017.
The Company enters into indemnification agreements in the ordinary course of business. Pursuant to these agreements, the Company agrees to indemnify, hold harmless, and to reimburse the indemnified party for losses suffered or incurred by the indemnified party, generally its customers, in connection with any patent, copyright or other intellectual property infringement claim by any third party with respect to the Company’s products. The term of these indemnification agreements is generally perpetual. The maximum potential amount of future payments the Company could be required to make under these indemnification agreements is unlimited. The Company has never incurred costs to defend lawsuits or settle claims related to these indemnification agreements. As a result, the Company believes its exposure related to these agreements is minimal. Accordingly, the Company has no liabilities recorded for these potential obligations as of September 30, 2018 or 2017.
Certain of the Company’s agreements also provide for the performance of services at customer sites. These agreements may contain indemnification clauses, whereby the Company will indemnify the customer from any and all damages, losses, judgments, costs and expenses for acts of its employees or subcontractors resulting in bodily injury or property damage. The maximum potential amount of future payments the Company could be required to make under these indemnification agreements is unlimited; however, the Company has general and umbrella insurance policies that would enable it to recover a portion of any amounts paid. The Company has never incurred costs to defend lawsuits or settle claims related to these indemnification agreements. As a result, the Company believes its exposure related to these agreements is minimal. Accordingly, the Company has no liabilities recorded for these potential obligations as of September 30, 2018 or 2017.
| 56 |
As permitted under Delaware law, the Company has agreements with its directors whereby the Company will indemnify them for certain events or occurrences while the director is, or was, serving at the Company’s request in such capacity. The term of the director indemnification period is for the later of ten years after the date that the director ceases to serve in such capacity or the final termination of proceedings against the director as outlined in the indemnification agreement. The maximum potential amount of future payments the Company could be required to make under these indemnification agreements is unlimited; however, the Company’s director and officer insurance policy limits the Company’s exposure and would enable it to recover a portion of any future amounts paid. As a result of its insurance policy coverage for directors, the Company believes its exposure related to these indemnification agreements is minimal. The Company has no liabilities recorded for these potential obligations as September 30, 2018 or 2017.
Research and Development Costs
Research and development costs are expensed as incurred to the extent the costs do not meet the capitalization requirements. Capitalization of computer software developed for resale begins upon the establishment of technological feasibility, generally demonstrated by a working model or an operative version of the computer software product. Such costs have not been material to date as technological feasibility is established within a short time frame from the software’s general availability and, as a result, no costs were capitalized in fiscal years 2018, 2017, or 2016.
Recent Accounting Pronouncements
In January 2017, the FASB issued ASU 2017-04, Intangibles-Goodwill And Other (Topic 350): Simplifying The Test For Goodwill Impairment, in an effort to simplify the subsequent measurement of goodwill and the associated procedures to determine fair value. The guidance eliminates Step 2 from the goodwill impairment test. Instead, an entity should perform its annual, or interim, goodwill impairment test by comparing the fair value of the reporting unit with its carrying amount, and recognize an impairment charge for the amount by which the carrying amount exceeds the reporting unit’s fair value, not to exceed the total amount of goodwill allocated to the reporting unit. This guidance is effective for fiscal years beginning after December 15, 2019, including interim periods within that reporting period. The adoption of this guidance is not expected to have a material impact on our financial statements, unless we have an impairment.
In June 2016, the FASB issued ASU 2016-13, Financial Instruments – Credit Losses (Topic 326): Measurement of Credit Losses on Financial Instruments, which requires entities to estimate all expected credit losses for certain types of financial instruments, including trade receivables, held at the reporting date based on historical experience, current conditions, and reasonable and supportable forecasts. The updated guidance also expands the disclosure requirements to enable users of financial statements to understand the entity’s assumptions, models and methods for estimating expected credit losses. This guidance is effective for fiscal years beginning after December 15, 2019, including interim periods within that reporting period. Early adoption is permitted. The Company is in the process of evaluating the potential impacts of this new guidance on the Company’s consolidated financial statements and related disclosures.
| 57 |
In March 2016, the FASB issued ASU 2016-09, Improvements to Employee Share-Based Payment Accounting, which is intended to simplify various aspects of how share-based payments are accounted for and presented in financial statements. The standard is effective prospectively for fiscal years, and interim periods within those fiscal years, beginning after December 15, 2017, with early adoption permitted. The Company elected to adopt the pronouncement on a prospective basis starting from the first quarter of the fiscal year ended September 30, 2018. As a result of the adoption of ASU 2016-09, we recognize the impact of forfeitures when they occur with no adjustment for estimated forfeitures and recognize excess tax benefits as a reduction of income tax expense regardless of whether the benefit reduces income taxes payable. At September 30, 2017, the Company had approximately $7.6 million of Federal and state net operating loss carryovers related to excess stock compensation. The Company has increased its net operating loss deferred tax asset with a corresponding increase to its valuation allowance.
In February 2016, the FASB issued ASU 2016-02, Leases (Topic 842), which requires lessees to recognize, on the balance sheet, leases with a lease terms of greater than twelve months as a right-of-use asset and a lease liability. The standard is effective for fiscal years beginning after December 15, 2018. The Company is currently evaluating the effect that the standard will have on the Company’s consolidated financial statements and related disclosures.
In May 2014, the FASB issued ASU 2014-09, Revenue from Contracts with Customers (Topic 606). The ASU is the result of a joint project by the FASB and the International Accounting Standards Board (“IASB”) to clarify the principles for recognizing revenue and to develop a common revenue standard for GAAP and International Financial Reporting Standards (“IFRS”) that would: remove inconsistencies and weaknesses, provide a more robust framework for addressing revenue issues, improve comparability of revenue recognition practices across entities, jurisdictions, industries, and capital markets, improve disclosure requirements and resulting financial statements, and simplify the presentation of financial statements. The core principle of the new guidance is that an entity should recognize revenue to depict the transfer of promised goods or services to customers in an amount that reflects the consideration to which the entity expects to be entitled in exchange for those goods or services. The ASU was initially effective for annual reporting periods beginning after December 15, 2016. On July 9, 2015, the FASB voted to delay the effective date of the new revenue standard by one year, but to permit entities to choose to adopt the standard as of the original effective date.
The Company has adopted the full retrospective model on October 1, 2018. Quarterly results in the 2019 fiscal year and comparative prior periods will be compliant with Topic 606, with the Annual Report on Form 10-K for the year ended September 30, 2019 being the first such Annual Report issued in compliance with Topic 606.
The Company has substantially completed the implementation of ASC 606 and has identified the necessary changes to its policies, processes, systems, and controls. However, due to the complex nature of the Company’s arrangements and recent updates to interpretive guidance, the Company has not yet completed all of its internal control procedures.
Based upon the work performed to date, the Company expects to record a cumulative-effect adjustment as of September 30, 2016 to increase retained earnings by approximately $3.1 million which includes a $1.7 million increase due to the acceleration of subscription revenue, a $1.1 million increase due to deferred commission expense as a result of certain commissions being paid that have been deemed to be incremental in obtaining new contracts and are amortized over the estimated customer life and a $0.3 million increase due to estimated royalties being recorded in the period in which they were earned. We expect to fully disclose the impacts of the new standard in connection with our 10-Q filing for the first fiscal quarter of 2019.
The Company expects the following impacts:
| · | Currently, we recognize revenue from subscription licenses ratably over the term of the agreement. Subscription licenses currently include a maintenance element. A portion of the arrangement consideration will be allocated from the subscription to the maintenance obligation based on the relative stand-alone selling price. The adoption of the new revenue standard will result in revenue for performance obligations recognized as they are satisfied. Therefore, revenue from the subscription license performance obligation is expected to be recognized upon delivery. Revenue from maintenance includes two performance obligations, upgrades and customer support, and is expected to be recognized on a straight-line basis over the contractual term. |
| · | Currently, the Company allocates revenue to licenses under the residual method when it has Vendor Specific Objective Evidence (“VSOE”) for the remaining undelivered elements, which allocates any future credits or significant discounts entirely to the license. The adoption of ASC 606 will result in future credits, significant discounts, and material rights under ASC 606, generally allocated to all performance obligations based upon their relative selling price. Under ASC 606, additional license revenue from the reallocation of such arrangement considerations will be recognized when control is transferred to the client, which is generally upon delivery of the license. |
| 58 |
| · | Additionally, we do not have VSOE in software bundled arrangements involving fixed price services, which results in revenue being deferred and recognized ratably over the longest contractual performance period. The adoption of the new revenue standard eliminates the requirement for VSOE and replaces it with the concept of a stand-alone selling price. Once the transaction price is allocated to each of the performance obligations based on their relative stand-alone selling prices, we can recognize revenue as the performance obligations are delivered, either at a point in time or over time. Under the new revenue standard, fixed price consulting revenue will be recognized over time based on the input method that reflects the Company’s performance on the contract. This will result in the acceleration of consulting revenue when compared to the current practice of ratable recognition over the longest contractual service period for consulting when there is a lack of VSOE. |
| · | Under our current revenue recognition policy, we recognize royalty revenue in the period in which we receive royalty reports, which is typically in the quarter immediately following the quarter in which sales of royalty-bearing products occurred. Under the new standard, we will be required to make estimates of royalties earned in the current period and record royalty revenue based on those estimates. |
| · | We have also assessed accounting for incremental costs to obtain a contract and costs incurred in fulfilling a contract. We currently believe the most significant change to be accounting for commissions, as these incremental costs will be capitalized and will be amortized over a period of time which could extend beyond the initial contract term. |
| · | There will be a corresponding effect on taxes in relation to all of the above impacts. |
| · | We note that our internal control framework did not materially change upon adoption of the provisions of Topic 606 and the related cost guidance under ASC 340, but rather that existing internal controls were modified and augmented, as necessary, to consider our new revenue recognition policy that went into effect October 1, 2018. We have developed internal controls to ensure that we adequately evaluate our contracts and accurately restate our prior-period operating results under ASC 606. |
The Company has considered all other recently issued accounting pronouncements and does not believe the adoption of such pronouncements will have a material impact on its consolidated financial statements.
NOTE 2. ANGOSS ACQUISITION
On January 30, 2018 (the “Acquisition Date”), Datawatch, through its wholly-owned Canadian subsidiary, acquired all of the outstanding capital stock of Angoss Software Corporation ("Angoss"), a corporation existing under the laws of Ontario, for $24.6 million in cash, net of $3.0 million in cash acquired (the “Angoss Acquisition”). Of this payment, $0.1 million was determined to be post-combination compensation expense. Excluding this amount, the purchase consideration for the Angoss Acquisition totaled $24.6 million.
The Company accounted for the Angoss Acquisition in accordance with ASC 805, Business Combinations. The Company has allocated the cost to acquire Angoss to its identifiable tangible and intangible assets and liabilities, with the remaining amount classified as goodwill. The Company used its best estimates and assumptions as part of the purchase price allocation process to value the assets acquired and liabilities assumed on the acquisition date. Fair value estimates are based on a complex series of judgments about future events and uncertainties and rely heavily on estimates and assumptions. The judgments used to determine the estimated fair value assigned to each class of assets acquired and liabilities assumed, as well as asset lives, can materially impact the Company’s results of operations. During the fiscal year ended September 30, 2018, the Company recorded measurement period adjustments that resulted in an increase of goodwill of approximately $0.1 million.
The table below summarizes the estimated fair value of net assets acquired and net liabilities assumed in the Angoss Acquisition as of January 30, 2018 (in thousands).
| Amount | ||||
| Accounts receivable | $ | 1,933 | ||
| Unbilled accounts receivable | 6,882 | |||
| Prepaid expenses and other current assets | 370 | |||
| Property and equipment | 250 | |||
| Customer relationships | 4,500 | |||
| Developed technology | 3,400 | |||
| Trade names | 3,200 | |||
| Goodwill | 11,633 | |||
| Accounts payable | (186 | ) | ||
| Accrued expenses | (932 | ) | ||
| Deferred revenue | (5,643 | ) | ||
| Deferred tax liability | (848 | ) | ||
| Fair value of assets and liabilities acquired | $ | 24,559 | ||
| 59 |
The amount of goodwill resulting from the allocation of purchase consideration is primarily attributable to expected synergies. Goodwill is not deductible for tax purposes. In accordance with FASB ASC 805, goodwill will not be amortized but instead will be tested for impairment at least annually and more frequently if certain indicators of impairment are present. In the event that goodwill becomes impaired, we will record an expense for the amount impaired during the fiscal quarter in which the determination is made.
The Company incurred approximately $1.3 million of acquisition related costs in the year ended September 30, 2018. These costs are included in general and administrative expense in the accompanying consolidated statements of operations.
The intangible assets, excluding goodwill and assembled workforce are being amortized on a straight-line basis over their estimated lives as follows (in thousands):
| Fair | Estimated | |||||
| Value | Lives | |||||
| Customer relationships | $ | 4,500 | 5.0 years | |||
| Developed technology | 3,400 | 8.0 years | ||||
| Trade names | 3,200 | Indefinite | ||||
| Total intangible assets | $ | 11,100 | ||||
In accordance with FASB ASC Topic 350, Intangibles—Goodwill and Other, management determined that the straight-line method of amortization would be used for customer relationships and developed technology as this pattern most closely reflects the economic benefits of the intangible assets consumed.
Management is responsible for the valuation of net assets acquired and considered a number of factors, including valuations and appraisals, when estimating the fair values and estimated useful lives of acquired assets and liabilities. The fair values of the intangible assets and certain liabilities were determined using variations of the income approach.
Customer relationships
The $4.5 million fair value of customer relationships was determined using the multi-period excess earnings method, which estimates the fair value of an asset based on its ability to generate future cash flows. The 5 year useful life of customer relationships was determined based on an analysis of future net cash flows and the amount of time that would be required to realize 95% of the cumulative net cash flows attributable to the existing customer relationships.
| 60 |
Developed Technology
The $3.4 million fair value of developed technology was determined using the relief from royalty method. By owning the developed technology, Datawatch does not have to pay royalties for the continued use of the asset, which has value. Management determined a useful life of 8 years for this asset is appropriate because it represents the point in time at which 95% of the cumulative net cash flows attributable to the developed technology would be expected to be realized.
Trade Names
Similar to developed technology, the $3.2 million fair value of the trade names were determined using the relief from royalty method. Management has utilized an indefinite useful life for the acquired ‘Angoss’ and ‘Knowledge’ trade names as the Company currently plans to continue to use both trade names in association with all product and service offerings underlying the cash flows attributable to these trade names.
Deferred revenue
The fair value of the acquired deferred revenue of $5.6 million was determined using a cost build-up approach, which estimates the costs to complete the remaining obligations underlying the deferred revenue and applying a mark-up reflecting an appropriate operating margin.
Deferred tax liability
As part of the purchase accounting related to the Angoss Acquisition, the Company recognized a deferred tax liability of $0.8 million related to indefinite lived tradename intangible assets acquired in the Angoss Acquisition.
Pro forma results (unaudited)
The following unaudited pro forma results are prepared for comparative purposes only and do not necessarily reflect the results that would have occurred had the Angoss Acquisition occurred at the beginning of the periods presented or the results which may occur in the future. The following unaudited pro forma results of operations assume the Angoss Acquisition had occurred on October 1, 2017 (in thousands):
| Years Ended | ||||||||
| September 30, | ||||||||
| 2018 | 2017 | |||||||
| Revenues | $ | 45,285 | $ | 45,910 | ||||
| Net loss | $ | (9,884 | ) | $ | (4,648 | ) | ||
| Net loss per share – basic: | $ | (0.79 | ) | $ | (0.38 | ) | ||
| Net loss per share – diluted: | $ | (0.79 | ) | $ | (0.38 | ) | ||
Significant pro forma adjustments incorporated into the pro forma results above include the recognition of additional amortization expense related to acquired intangible assets.
| 61 |
NOTE 3. FINANCING ARRANGEMENT
Revolving Line of Credit and Term Note
In connection with the Angoss Acquisition, on January 24, 2018, Datawatch entered into a new credit facility with a bank. The credit facility includes a $10.0 million term loan and a $5.0 million revolving line of credit, secured by substantially all of the assets of Datawatch, excluding intellectual property. The term loan, which was used to fund a portion of the Angoss Acquisition, bears interest at the prime rate plus 1%, is repayable based on a 48-month amortization schedule, matures on January 24, 2021, and is subject to prepayment penalties. The line of credit, which is intended to be used for working capital and general corporate purposes, bears interest at the prime rate plus 0.5% and is due and payable on January 24, 2020. Commitment fees of $50,000 and $17,500 were paid for the term loan and line of credit, respectively. We incurred an additional $49,000 in costs related to the issuance of this credit facility, the majority of which relates to legal fees. Availability under the line of credit is based on the amount of eligible accounts receivable from time to time. The credit facility agreement contains various conditions, covenants and representations with which the Company must be in compliance in order to borrow funds and to avoid an event of default.
As of September 30, 2018, the total amount of debt outstanding on the term loan was $8.5 million, net of $0.1 million in capitalized lender fees and debt issuance costs. The interest rate on the term loan as of September 30, 2018 was 6.25%.
As of September 30, 2018, the Company had no outstanding debt on the revolving line of credit.
Future principal payments as of September 30, 2018 related to the term note are as follows (in thousands):
| Fiscal Years Ending September 30, | ||||
| 2019 | $ | 2,500 | ||
| 2020 | 2,500 | |||
| 2021 | 3,542 | |||
| Total future principal payments | 8,542 | |||
| Less: | ||||
| Current portion, net of debt discount | (2,044 | ) | ||
| Unamortized debt discount | (58 | ) | ||
| Long-term debt | $ | 6,440 | ||
NOTE 4. INCOME TAXES
Loss from operations before income taxes consists of the following for the years ended September 30:
| 2018 | 2017 | 2016 | ||||||||||
| (In thousands) | ||||||||||||
| Domestic | $ | (5,080 | ) | $ | (2,569 | ) | $ | (11,227 | ) | |||
| Foreign | (4,183 | ) | (1,442 | ) | (1,932 | ) | ||||||
| Total | $ | (9,263 | ) | $ | (4,011 | ) | $ | (13,159 | ) | |||
| 62 |
The benefit (provision) for income taxes consisted of the following for the years ended September 30:
| 2018 | 2017 | 2016 | ||||||||||
| (In thousands) | ||||||||||||
| Current: | ||||||||||||
| Federal | $ | (26 | ) | $ | - | $ | 66 | |||||
| State | (24 | ) | (9 | ) | 12 | |||||||
| Foreign | 5 | 27 | 16 | |||||||||
| (45 | ) | 18 | 94 | |||||||||
| Deferred: | ||||||||||||
| Federal | (4,736 | ) | 1,968 | (4,766 | ) | |||||||
| State | - | 55 | (397 | ) | ||||||||
| Foreign | 705 | (238 | ) | (861 | ) | |||||||
| Change in valuation allowance | 4,087 | (1,785 | ) | 4,457 | ||||||||
| 56 | - | (1,567 | ) | |||||||||
| Total (provision) benefit | $ | 11 | $ | 18 | $ | (1,473 | ) | |||||
At September 30, 2018, we had U.S. federal tax loss carryforwards of approximately $58 million, expiring at various dates through 2038, including approximately $0.2 million resulting from an acquisition undertaken during 2004 which are subject to additional annual limitations as a result of the changes in ownership, and had approximately $30.3 million in state tax loss carryforwards, which also expire at various dates through 2038. We have federal research and development credits of approximately $1.3 million that begin to expire beginning in 2021 and state credits of approximately $0.8 million that expire at various dates through 2033. We also have Canada ITC credits of $0.8 million which expire at various dates through 2037 and Canada foreign tax credits of $16,000 which expire at various dates through 2027. In addition, we have the following foreign net operating loss carryforwards: U.K. losses of approximately $12.9 million with no expiration date, Australia losses of approximately $3.3 million with no expiration date, Germany losses of approximately $1.9 million with no expiration date, Singapore losses of approximately $2.7 million with no expiration date, Sweden losses of approximately $11.9 million with no expiration, and Canada losses of $3.7 million that expire at various dates through 2038. The Company has a Canada net capital loss carryforward of $0.3 million with no expiration.
The components of the Company’s net deferred tax assets (liabilities) are as follows at September 30:
| 2018 | 2017 | |||||||
| (In thousands) | ||||||||
| Deferred tax liabilities: | ||||||||
| Prepaid expenses | $ | (192 | ) | $ | (405 | ) | ||
| Acquired intangibles | (3,027 | ) | (533 | ) | ||||
| (3,219 | ) | (938 | ) | |||||
| Deferred tax assets: | ||||||||
| Net operating loss carryforwards | 22,007 | 24,902 | ||||||
| Research and development credits | 1,937 | 1,546 | ||||||
| ITC credits | 602 | - | ||||||
| Alternative minimum tax credits | - | 7 | ||||||
| Accounts and notes receivable reserves | 26 | 24 | ||||||
| Depreciation and amortization | 1,720 | 2,569 | ||||||
| Deferred rent | 75 | 114 | ||||||
| Deferred revenue | 1,400 | - | ||||||
| Stock compensation | 1,645 | 253 | ||||||
| Scientific research and experimental development | 678 | - | ||||||
| Other | 142 | 31 | ||||||
| 30,232 | 29,446 | |||||||
| Total | 27,013 | 28,508 | ||||||
| Valuation allowance | (27,825 | ) | (28,508 | ) | ||||
| Deferred tax liability, net | $ | (812 | ) | $ | - | |||
| 63 |
The valuation allowance relates to the Company’s U.S. and foreign net operating losses and other deferred tax assets and is recorded based upon the uncertainty surrounding their realizability, as these assets can only be realized via profitable operations in the respective tax jurisdictions. The Company records a deferred tax asset or liability based on the difference between the financial statement and tax basis of assets and liabilities, as measured by enacted tax rates assumed to be in effect when these differences reverse. In evaluating the Company’s ability to recover its deferred tax assets, the Company considers all available positive and negative evidence including its past operating results, the existence of cumulative income in the most recent fiscal years, changes in the business in which the Company operates and its forecast of future taxable income. In determining future taxable income, the Company is responsible for assumptions utilized including the amount of federal, state and international pre-tax operating income, the reversal of temporary differences and the implementation of feasible and prudent tax planning strategies.
These assumptions require significant judgment about the forecasts of future taxable income and are consistent with the plans and estimates that the Company is using to manage the underlying business. The Company has experienced cumulative tax losses on a three year running basis covering the years ended September 30, 2018, 2017, and 2016. Accordingly, as of September 30, 2018, the Company determined that it is more likely than not that the deferred tax assets will not be realized in all of its jurisdictions, with the exception of Singapore and the United Kingdom. A full valuation allowance has been recorded in the U.S., Australia, Canada, Germany, Singapore, and Sweden. The Company had a valuation allowance on some of its assets in Singapore and the United Kingdom.
The following table reconciles the Company’s tax provision based on its effective tax rate to its tax provision based on the federal statutory rate of 24% for the year ended September 30, 2018 and 34% for the years ended September 30, 2017 and 2016 (in thousands):
| 2018 | 2017 | 2016 | ||||||||||
| (In thousands) | ||||||||||||
| Benefit at federal statutory rate | $ | 2,247 | $ | 1,369 | $ | 4,470 | ||||||
| State, net of federal impact | 506 | 4 | 264 | |||||||||
| Foreign income taxes | 61 | 115 | 204 | |||||||||
| Valuation allowance increase | 4,087 | (1,785 | ) | (6,385 | ) | |||||||
| Return to provision adjustments | 1,368 | 421 | 345 | |||||||||
| Foreign rate change | - | - | - | |||||||||
| Stock-based compensation | 214 | (148 | ) | (545 | ) | |||||||
| NOL adjustment due to subsidiary liquidation | - | - | - | |||||||||
| Acquisition costs | (310 | ) | - | - | ||||||||
| Change in uncertain tax positions | 20 | 30 | 105 | |||||||||
| IRS audit adjustments | - | - | - | |||||||||
| Goodwill and intangible asset impairment | - | - | - | |||||||||
| Federal Tax Reform | (8,210 | ) | - | - | ||||||||
| Other | 28 | 12 | 69 | |||||||||
| Income tax (expense) benefit | $ | 11 | $ | 18 | $ | (1,473 | ) | |||||
| 64 |
Deferred Taxes
The Company’s deferred tax assets include net operating loss carry forwards and tax credits that expire at different times through 2038 or have an unlimited carry forward. Significant judgment is required in determining the Company’s provision for income taxes, the carrying value of deferred tax assets and liabilities and the valuation allowance recorded against net deferred tax assets. Factors such as future reversals of deferred tax assets and liabilities, projected future taxable income, changes in enacted tax rates and the period over which the Company’s deferred tax assets will be recoverable are considered in making these determinations. Management does not believe the deferred tax assets are more likely than not to be realized in all jurisdictions, with the exception of Singapore and the United Kingdom. A full valuation allowance has been provided against the deferred tax assets in the U.S, Australia, Canada, Germany, and Sweden at September 30, 2018. The Company recorded a valuation allowance against some of its deferred tax assets in Singapore and the United Kingdom at September 30, 2018.
On December 22, 2017, President Trump signed into law the Tax Cuts and Jobs Act. ASC 740 requires deferred tax assets and liabilities to be measured using the enacted rate for the period in which they are expected to reverse. The tax law change was enacted as of December 31, 2017. Accordingly, the reduction to the U.S. Federal corporate tax rate to 21% should be utilized to measure the U.S. deferred tax assets and liabilities that will reverse in future periods. The Company's reduction to its net U.S. deferred tax asset of $8.2 million was offset by a corresponding reduction to its valuation allowance of $8.2 million. In addition, due to the Company’s fiscal tax year, it has a blended Federal rate of 24.25% for the fiscal year ended September 30, 2018. The new legislation includes a transition tax in which all foreign earnings are deemed to be repatriated to the U.S. and taxable at specified rates included within the tax legislation. We have analyzed our earnings and profit pools and determined that the transition tax will not have a material impact on the financial statements.
During the year ended September 30, 2018, the Company acquired Angoss Software Corporation and its subsidiary in the United Kingdom. The Company evaluated Angoss Software Corporation's ability to utilize its deferred tax assets. Angoss had a history of losses and no ability to carry back the deferred tax assets. The reversal of deferred tax assets and liabilities of the same type and during the same time period did not result in the ability to utilize Angoss Corporation's deferred tax assets. The Company recorded a full valuation allowance on Angoss Software Corporation's deferred tax assets in acquisition accounting. Angoss has an indefinite lived tradename intangible asset which resulted in a deferred tax liability of approximately $0.8 million being recorded in acquisition accounting.
Provision for Uncertain Tax Positions
The Company applies the accounting requirements for uncertain tax positions which provide a comprehensive model for the financial statement recognition, measurement, presentation and disclosure of uncertain tax positions taken or expected to be taken in income tax returns. In accordance with these requirements, the Company first determines whether a tax authority would “more likely than not” sustain its tax position if it were to audit the position with full knowledge of all the relevant facts and other information. For those tax positions that meet this threshold, the Company measures the amount of tax benefit based on the largest amount of tax benefit that the Company has a greater than 50% chance of realizing in a final settlement with the relevant authority. Those tax positions failing to qualify for initial recognition are recognized in the first interim period in which they meet the more likely than not standard, or are resolved through negotiation or litigation with the taxing authority, or upon expiration of the statute of limitations.
| 65 |
At September 30, 2017, the Company had a cumulative tax liability of $0.1 million related to Federal and foreign tax exposure that could result in cash payments. The Company increased the tax liability by $0.1 million during the fiscal year ended September 30, 2018. The net increase related to a decrease due to the statute of limitations expiring on foreign uncertain tax positions netted against an increase due U.S. uncertain tax positions. The Company does not expect its tax liability to change significantly during the next twelve months. The Company’s policy is to recognize interest and penalties related to uncertain tax positions as a component of income tax expense in its consolidated statements of operations. The Company accrued interest and penalties of approximately $11,000 associated with this liability for the fiscal year ended September 30, 2018.
The Company’s unrecognized tax benefits (before consideration of any valuation allowance) represent differences between tax positions taken by the Company in its various consolidated and separate worldwide tax returns and the benefits recognized and measured for uncertain tax positions. This amount also represents the amount of unrecognized tax benefits that, if recognized, would favorably affect the effective income tax rate in any future periods. The change in the unrecognized tax benefits during the fiscal year ended September 30, 2018 was as follows (in thousands):
| Balance at September 30, 2016 | $ | 155 | ||
| Reductions for prior year tax positions | (30 | ) | ||
| Balance at September 30, 2017 | 125 | |||
| Increases for prior year tax positions | 58 | |||
| Balance at September 30, 2018 | $ | 183 |
In the normal course of business, the Company is subject to examination by taxing authorities throughout the world, including such jurisdictions as the Sweden, United Kingdom, Germany, Singapore, Australia, Canada, and the United States, and as a result, files numerous consolidated and separate income tax returns in the U.S. federal jurisdiction and various state and foreign jurisdictions. The fiscal years ended September 30, 2013 through September 30, 2017 are generally still open to examination in the jurisdictions listed above. During the year ended September 30, 2017, the Company's Singapore tax returns for the fiscal tax year's ended September 30, 2013 through September 30, 2016 were audited by the Inland Revenue Authority of Singapore. The audit was completed during the fourth quarter ended September 30, 2017 and resulted in the reduction in net operating loss carry forwards of approximately $0.3 million. The Company has reduced its deferred tax assets and corresponding valuation allowance in Singapore to reflect the changes from the audit. During the year ended September 30, 2018, the State of New York commenced a Sales and Use tax audit. The Company has not received any findings from the State of New York as a result of this on-going audit to date. During the fiscal year ended September 30, 2015, the Swedish tax authorities began an audit of the Company’s subsidiary in Sweden. In February 2017, there was a decision of the Swedish tax authorities claiming that there had been a transfer of certain intellectual property assets by our Swedish subsidiary resulting in a tax liability of approximately $9 million. The Company has appealed the Swedish tax authority’s decision to the Swedish administrative court and the parties are awaiting a date for the oral hearing before the court. The Company has not made a reserve on its financial statements for any taxes that may become due as we believe that it is more likely than not that we will prevail in court.
| 66 |
NOTE 5. SHARE-BASED COMPENSATION
The Company provides its employees, officers, consultants and directors with stock options, restricted stock units (“RSUs”) and other stock rights for common stock of the Company on a discretionary basis. All option and RSU grants are subject to the terms and conditions determined by the Compensation and Stock Committee of the Board of Directors (the “Committee”), and generally vest over a three-year period and expire either seven or ten years from the date of grant.
On January 20, 2006, the Company established the Datawatch Corporation 2006 Equity Compensation and Incentive Plan (the “2006 Plan”), which provides for the granting of both incentive stock options and non-qualified options, the award of Company common stock and opportunities to make direct purchases of Company common stock, as determined by the Committee. Options pursuant to this plan were available to be granted through April 26, 2011 and vest as specified by the Committee.
On April 26, 2011, the Company established the Datawatch Corporation 2011 Equity Compensation and Incentive Plan (as amended, amended and restated, modified or supplemented from time to time, the “2011 Plan”), which provides for the granting of both incentive stock options and non-qualified options, the award of restricted stock, RSUs, and any other equity-based interests (collectively, “Stock Rights”), as determined by the Committee. Options pursuant to this plan may be granted through April 25, 2021 and shall vest as specified by the committee.
On April 22, 2014, the stockholders of the Company approved the adoption of the Company’s Second Amended and Restated 2011 Equity Compensation and Incentive Plan, which amended the previous Amended and Restated 2011 Equity Compensation and Incentive Plan to increase the shares authorized for issuance under such plan by 700,000 shares to 2,275,392 shares.
On April 18, 2017, the stockholders of the Company approved the adoption of the Company’s Third Amended and Restated 2011 Equity Compensation and Incentive Plan (the “Amended 2011 Plan”), which amended the previous Second Amended and Restated 2011 Equity Compensation and Incentive Plan to increase the shares authorized for issuance under such plan by 1,000,000 shares to 3,275,392 shares. At September 30, 2018, 262,674 shares were available for future issuance under the 2011 Plan.
Under the 2006 Plan and Amended 2011 Plan, stock options are granted at exercise prices not less than the fair market value of the underlying common stock at the date of grant. All of the Company’s share-based awards are accounted for as equity instruments and there have been no liability awards granted. Share-based compensation expense for share-based payment awards, issued to employees and directors, is measured based on the grant-date fair value of the award and recognized on a straight-line basis over the requisite period of the award. Share-based compensation expense for share-based payment awards, issued to non-employees, is revalued each fiscal quarter based on the current fair value of the award and recognized on over the requisite period of the award.
All awards granted during the year ended September 30, 2018 were granted under the Amended 2011 Plan.
Stock Options
The Company estimates the fair value of each share-based award (except RSUs, which are discussed below) using the Black-Scholes option valuation model. The Black-Scholes option valuation model incorporates assumptions as to stock price volatility, the expected life of options, a risk-free interest rate and dividend yield. No options were granted by the Company in the fiscal years 2018, 2017 or 2016. The total intrinsic value of options exercised during the years ended September 30, 2018, 2017 and 2016 was $0.8 million, $0.7 million and $15,000, respectively. Total cash received from option exercises during the years ended September 30, 2018, 2017 and 2016 was $0.3 million, $0.4 million and $0.1 million, respectively. There was no tax benefit realized from stock option exercised during the years ended September 30, 2018, 2017 and 2016. As of September 30, 2018, there was no unrecognized compensation cost related to non-vested stock option arrangements.
The expected option life is based on historical trends and data. With regard to the expected option life assumption, the Company considers the exercise behavior of past grants and models the pattern of aggregate exercises. Patterns are determined on specific criteria of the aggregate pool of optionees including the reaction to vesting, realizable value and short-time-to-maturity effect. The Company determined the volatility for options granted using the historical volatility of the Company’s common stock. The risk-free interest rate is based on a treasury instrument whose term is consistent with the expected life of the stock options. Dividend yield of zero is based on the fact that the Company has never paid cash dividends and has no present intention to pay cash dividends. Based on the Company’s historical voluntary turnover rates, an annualized estimated forfeiture rate of 10% has been used in calculating the historical cost. Additional expense will be recorded if the actual forfeiture rate is lower than estimated, and a recovery of prior expense will be recorded if the actual forfeiture rate is higher than estimated.
| 67 |
The following table is a summary of combined stock option activity under the 2006 Plan and the Amended 2011 Plan:
| Weighted- | Weighted- | |||||||||||||||
| Average | Average | Aggregate | ||||||||||||||
| Exercise | Remaining | Intrinsic | ||||||||||||||
| Number of Options | Price Per Share | Life (In years) | Value (In thousands) | |||||||||||||
| Outstanding, September 30, 2015 | 302,500 | $ | 6.15 | 2.86 | $ | 446 | ||||||||||
| Granted | - | - | - | - | ||||||||||||
| Canceled/Forfeited | (5,000 | ) | 3.61 | - | 7 | |||||||||||
| Exercised | (22,500 | ) | 4.73 | 1.00 | 15 | |||||||||||
| Outstanding, September 30, 2016 | 275,000 | $ | 6.31 | 5.01 | $ | 715 | ||||||||||
| Granted | - | - | - | - | ||||||||||||
| Canceled/Forfeited | - | - | - | - | ||||||||||||
| Exercised | (100,000 | ) | 4.22 | - | 688 | |||||||||||
| Outstanding, September 30, 2017 | 175,000 | $ | 7.51 | 1.31 | $ | 809 | ||||||||||
| Granted | - | - | - | - | ||||||||||||
| Canceled/Forfeited | - | - | - | - | ||||||||||||
| Exercised | (100,000 | ) | 3.46 | - | 764 | |||||||||||
| Outstanding, September 30, 2018 | 75,000 | $ | 12.92 | 1.56 | $ | - | ||||||||||
| Exercisable, September 30, 2018 | 75,000 | $ | 12.92 | 1.56 | $ | - | ||||||||||
| Unvested awards expected to vest, September 30, 2018 | - | $ | - | - | $ | - | ||||||||||
The following table presents weighted-average price and life information regarding options outstanding and exercisable at September 30, 2018:
| Outstanding | Exercisable | |||||||||||||||||||||
| Weighted- | ||||||||||||||||||||||
| Average | Weighted- | Weighted- | ||||||||||||||||||||
| Remaining | Average | Average | ||||||||||||||||||||
| Exercise | Number of | Contractual | Exercise | Exercise | ||||||||||||||||||
| Prices | Shares | Life (Years) | Price | Shares | Price | |||||||||||||||||
| $ | 12.92 | 75,000 | 1.56 | $ | 12.92 | 75,000 | $ | 12.92 | ||||||||||||||
Restricted Stock Units
The Company periodically grants awards of restricted stock units to its non-employee directors employees on a discretionary basis pursuant to its stock compensation plans. Each RSU entitles the holder to receive, at the end of each vesting period, a specified number of shares of the Company’s common stock. The total number of RSUs unvested at September 30, 2018 was 910,540. Most RSUs vest at the rate of 33.33% on each of the first through third anniversaries of the grant date.
| 68 |
The fair value related to the RSUs was calculated based primarily on the closing stock price of the Company’s common stock on the date of the grant and is being amortized evenly on a pro-rata basis over the vesting period to sales and marketing, engineering and product development, professional services and general and administrative expense. The fair values of the RSUs granted in fiscal years 2018, 2017 and 2016 were $4.1 million (or $9.15 weighted-average fair value per share), $4.6 million (or $7.17 weighted-average fair value per share) and $2.7 million (or $5.36 weighted-average fair value per share), respectively. The Company recorded compensation expense related to RSUs of approximately $3.0 million, $2.2 million and $2.7 million during the years ended September 30, 2018, 2017 and 2016, respectively. These amounts are included in the total share-based compensation expense disclosed above. As of September 30, 2018, there was $5.3 million of total unrecognized compensation cost related to RSUs, which is expected to be recognized over a weighted-average period of 2.03 years.
The following table presents nonvested RSU information for the fiscal years ended September 30, 2018, 2017 and 2016
| Number of | ||||
| RSUs | ||||
| Outstanding | ||||
| Nonvested, September 30, 2016 | 609,565 | |||
| Granted | 644,250 | |||
| Canceled/Forfeited | (91,077 | ) | ||
| Vested | (234,672 | ) | ||
| Nonvested, September 30, 2017 | 928,066 | |||
| Granted | 454,500 | |||
| Canceled/Forfeited | (93,737 | ) | ||
| Vested | (378,289 | ) | ||
| Nonvested, September 30, 2018 | 910,540 | |||
NOTE 6. ACCRUED EXPENSES
Accrued expenses consisted of the following at September 30, 2018 and 2017:
| September 30, | ||||||||
| 2018 | 2017 | |||||||
| Royalties and commissions | $ | 996 | $ | 1,709 | ||||
| Payroll and related expenses | 640 | 813 | ||||||
| Professional fees and consulting | 649 | 294 | ||||||
| Other | 759 | 705 | ||||||
| Total | $ | 3,044 | $ | 3,521 | ||||
| 69 |
NOTE 7. COMMITMENTS AND CONTINGENCIES
Leases
The Company leases various facilities and equipment in North America and overseas under non-cancelable operating leases which expire at various dates through 2022. The lease agreements generally provide for the payment of minimum annual rentals, pro-rata share of taxes and maintenance expenses. Rental expense for all operating leases was $1.1 million, $1.0 million and $1.1 million for fiscal years 2018, 2017, and 2016 respectively. At September 30, 2018 and 2017, deferred rent totaled $0.3 million which is included under the caption “Other long-term liabilities” in the Company’s consolidated balance sheets, for the year ended September 30, 2018 and 2017. Certain of the Company's facility leases include options to renew.
As of September 30, 2018, future minimum rental commitments under non-cancelable operating leases are as follows (in thousands):
| Fiscal Years Ending September 30, | ||||
| 2019 | $ | 980 | ||
| 2020 | 793 | |||
| 2021 | 794 | |||
| 2022 | 604 | |||
| 2023 | 147 | |||
| Total future minimum lease payments | $ | 3,318 | ||
Royalties
Royalty expense included in cost of software licenses was $0.5 million, $0.6 million and $0.7 million for the years ended September 30, 2018, 2017 and 2016, respectively. Minimum royalty obligations were insignificant for fiscal years 2018, 2017 and 2016.
Contingencies
From time to time, the Company is subject to claims and may be party to actions that arise in the normal course of business. The Company is not party to any litigation that management believes will have a material adverse effect on the Company's consolidated financial condition or results of operations.
NOTE 8. RETIREMENT SAVINGS PLAN
The Company has a 401(k) retirement savings plan covering substantially all of the Company’s full-time U.S. employees. Under the provisions of the plan, employees may contribute a portion of their compensation, subject to certain limitations. The Company, at the discretion of the Board of Directors, may make contributions on behalf of its employees under this plan. Such contributions, if any, become fully vested after five years of continuous service. The Company did not make any contributions to the 401(k) retirement savings plan in fiscal 2018, 2017 or 2016.
NOTE 9. SEGMENT INFORMATION AND REVENUE BY GEOGRAPHIC LOCATION
The Company has determined that it has only one reportable segment. The Company’s chief operating decision maker, its Chief Executive Officer, does not manage any part of the Company separately, and the allocation of resources and assessment of performance is based solely on the Company’s consolidated operations and operating results.
| 70 |
The Company conducts operations in the U.S. and internationally. The following table presents information about the Company’s geographic operations (in thousands):
| Domestic | International | Total | ||||||||||
| Total Revenue | ||||||||||||
| Year ended September 30, 2018 | $ | 33,458 | $ | 8,220 | $ | 41,678 | ||||||
| Year ended September 30, 2017 | $ | 29,969 | $ | 6,294 | $ | 36,263 | ||||||
| Year ended September 30, 2016 | $ | 26,055 | $ | 4,407 | $ | 30,462 | ||||||
| Total Operating Loss | ||||||||||||
| Year ended September 30, 2018 | $ | (5,582 | ) | $ | (3,513 | ) | $ | (9,095 | ) | |||
| Year ended September 30, 2017 | $ | (2,280 | ) | $ | (2,490 | ) | $ | (4,770 | ) | |||
| Year ended September 30, 2016 | $ | (9,380 | ) | $ | (3,749 | ) | $ | (13,129 | ) | |||
| Total Long-Lived Assets | ||||||||||||
| At September 30, 2018 | $ | 30,867 | $ | 2,344 | $ | 33,211 | ||||||
| At September 30, 2017 | $ | 9,812 | $ | 47 | $ | 9,859 | ||||||
NOTE 10. SUBSEQUENT EVENTS
On November 5, 2018, Datawatch announced an agreement to be acquired by an entity affiliated with Altair Engineering Inc. (together with its affiliates, “Altair”) pursuant to an Agreement and Plan of Merger (the “Merger Agreement”), dated as of November 5, 2018, by and among Datawatch, Dallas Merger Sub, Inc., a Delaware corporation (“Purchaser”) and Altair, pursuant to which, among other things, Purchaser has completed a tender offer (the “Offer”) to purchase all of the outstanding shares (the “Shares”) of Datawatch common stock, $0.01 par value, at a price of $13.10 per share, without interest and subject to any required withholding taxes (the “Offer Price”). Subject to the satisfaction or waiver of the remaining conditions set forth in the Merger Agreement, Purchaser will merge with and into Datawatch (the “Merger”) without a meeting or vote of the stockholders of Datawatch in accordance with Section 251(h) of the General Corporation Law of the State of Delaware (the “DGCL”), with Datawatch continuing as the surviving corporation in the Merger as a subsidiary of Altair. At the effective time of the Merger (the “Effective Time”), any Shares not purchased pursuant to the Offer (other than Shares (i) owned by stockholders who are entitled to demand and properly demand appraisal in accordance with Section 262 of the DGCL in connection with the Merger, (ii) then owned by Datawatch or owned both at the commencement of the Offer and at the Effective Time by any wholly owned subsidiary of Datawatch and (iii) irrevocably accepted for purchase in the Offer or owned both at the commencement of the Offer and at the Effective Time by Altair, Purchaser or any other wholly owned subsidiary of Altair) will be automatically converted into the right to receive the Offer Price, net to the seller in cash, without interest and less any applicable withholding taxes.
Consummation of the Merger is subject to various conditions set forth in the Merger Agreement, including, but not limited to the receipt of required approvals, waivers and consents, and other conditions set forth in Annex I to the Merger Agreement. The Merger is not subject to any financing condition.
NOTE 11. QUARTERLY RESULTS (UNAUDITED)
Supplementary Information:
| 71 |
| First | Second | Third | Fourth | |||||||||||||
| (In thousands, except per share amounts) | ||||||||||||||||
| Year Ended September 30, 2018: | ||||||||||||||||
| Software license revenue | $ | 5,558 | $ | 5,181 | $ | 6,868 | $ | 7,152 | ||||||||
| Maintenance revenue | 3,651 | 3,886 | 3,888 | 4,163 | ||||||||||||
| Professional services revenue | 376 | 335 | 350 | 270 | ||||||||||||
| Cost of software licenses | 239 | 336 | 354 | 369 | ||||||||||||
| Cost of maintenance and services | 604 | 885 | 1,114 | 1,019 | ||||||||||||
| Expenses | 9,612 | 11,930 | 12,077 | 12,234 | ||||||||||||
| Loss from operations | (879 | ) | (3,748 | ) | (2,431 | ) | (2,037 | ) | ||||||||
| Net loss | (828 | ) | (3,871 | ) | (2,281 | ) | (2,272 | ) | ||||||||
| Net loss per share – basic | $ | (0.07 | ) | $ | (0.31 | ) | $ | (0.18 | ) | $ | (0.18 | ) | ||||
| Net loss per share – diluted | $ | (0.07 | ) | $ | (0.31 | ) | $ | (0.18 | ) | $ | (0.18 | ) | ||||
| Year Ended September 30, 2017: | ||||||||||||||||
| Software license revenue | $ | 4,357 | $ | 4,889 | $ | 4,912 | $ | 5,893 | ||||||||
| Maintenance revenue | 3,555 | 3,560 | 3,729 | 3,629 | ||||||||||||
| Professional services revenue | 321 | 311 | 425 | 682 | ||||||||||||
| Cost of software licenses | 703 | 733 | 231 | 228 | ||||||||||||
| Cost of maintenance and services | 532 | 545 | 617 | 655 | ||||||||||||
| Expenses | 9,165 | 8,637 | 8,761 | 10,226 | ||||||||||||
| Loss from operations | (2,167 | ) | (1,155 | ) | (543 | ) | (905 | ) | ||||||||
| Net loss | (2,231 | ) | (449 | ) | (499 | ) | (814 | ) | ||||||||
| Net loss per share – basic | $ | (0.19 | ) | $ | (0.04 | ) | $ | (0.04 | ) | $ | (0.07 | ) | ||||
| Net loss per share – diluted | $ | (0.19 | ) | $ | (0.04 | ) | $ | (0.04 | ) | $ | (0.07 | ) | ||||
| Year Ended September 30, 2016: | ||||||||||||||||
| Software license revenue | $ | 3,147 | $ | 3,645 | $ | 3,669 | $ | 4,758 | ||||||||
| Maintenance revenue | 3,602 | 3,480 | 3,335 | 3,498 | ||||||||||||
| Professional services revenue | 306 | 299 | 372 | 351 | ||||||||||||
| Cost of software licenses | 689 | 499 | 879 | 761 | ||||||||||||
| Cost of maintenance and services | 598 | 610 | 499 | 470 | ||||||||||||
| Expenses | 9,809 | 9,792 | 9,562 | 9,423 | ||||||||||||
| Loss from operations | (4,041 | ) | (3,477 | ) | (3,564 | ) | (2,047 | ) | ||||||||
| Net loss | (3,964 | ) | (3,362 | ) | (5,374 | ) | (1,932 | ) | ||||||||
| Net loss per share – basic | $ | (0.34 | ) | $ | (0.29 | ) | $ | (0.45 | ) | $ | (0.16 | ) | ||||
| Net loss per share – diluted | $ | (0.34 | ) | $ | (0.29 | ) | $ | (0.45 | ) | $ | (0.16 | ) | ||||
| 72 |
Item 9. CHANGES IN AND DISAGREEMENTS WITH ACCOUNTANTS ON ACCOUNTING AND FINANCIAL DISCLOSURE
Not Applicable.
Item 9A. CONTROLS AND PROCEDURES
| (a) | Evaluation of Disclosure Controls and Procedures |
The Company evaluated the effectiveness of its disclosure controls and procedures, as defined in Rules 13a-15(e) and 15d-15(e) under the Securities Exchange Act of 1934, as amended (the “Exchange Act”), as of the end of the period covered by this Form 10-K. the principal executive officer and principal financial officer participated in this evaluation. Based upon that evaluation, the principal executive officer and principal financial officer concluded that our disclosure controls and procedures were effective as of the end of the period covered by this report.
| (b) | Management’s Report on Internal Control over Financial Reporting |
Our management is responsible for establishing and maintaining adequate internal control over financial reporting. Our internal control system was designed to provide reasonable assurance regarding the reliability of financial reporting and the preparation of financial statements for external purposes in accordance with accounting principles generally accepted in the United States of America.
Our internal control over financial reporting includes those policies and procedures that (i) pertain to the maintenance of records that, in reasonable detail, accurately and fairly reflect the transactions and dispositions of our assets; (ii) provide reasonable assurance that transactions are recorded as necessary to permit preparation of financial statements in accordance with generally accepted accounting principles, and that our receipts and expenditures are being made only in accordance with authorizations of our management and directors, and (iii) provide reasonable assurance regarding prevention or timely detection of unauthorized acquisition, use or disposition of our assets that could have a material effect on the financial statements.
Because of inherent limitations, internal control over financial reporting may not prevent or detect misstatements. Also, projections of any evaluation of effectiveness to future periods are subject to the risk that controls may become inadequate because of changes in conditions, or that the degree of compliance with the policies or procedures may deteriorate.
Our management assessed the effectiveness of our internal control over financial reporting as of September 30, 2018. In making this assessment, management used the criteria set forth by the Committee of Sponsoring Organizations of the Treadway Commission (COSO) in the 2013 Internal Control—Integrated Framework. Based on our assessment, management concluded that, as of September 30, 2018, our internal control over financial reporting was effective based on those criteria.
| (c) | Changes in Internal Control Over Financial Reporting |
As a result of the evaluation completed by management, and in which the principal executive officer and principal financial officer participated, we have concluded that there were no changes during the fiscal year ended September 30, 2018 in our internal control over financial reporting, which have materially affected, or are reasonably likely to materially affect, our internal control over financial reporting.
None.
| 73 |
Item 10. DIRECTORS AND EXECUTIVE OFFICERS OF THE REGISTRANT
The information set forth under the captions “Election of Directors” and “Information Concerning Executive Officers” appearing in the Company’s definitive Proxy Statement for the Annual Meeting of Shareholders for the fiscal year ended September 30, 2018 is incorporated herein by reference.
Item 11. EXECUTIVE COMPENSATION
The information set forth under the captions “Compensation of Directors” and “Executive Compensation” appearing in the Company’s definitive Proxy Statement for the Annual Meeting of Shareholders for the fiscal year ended September 30, 2018 is incorporated herein by reference.
Item 12. SECURITY OWNERSHIP OF CERTAIN BENEFICIAL OWNERS AND MANAGEMENT AND RELATED STOCKHOLDER MATTERS
The information set forth under the caption “Equity Incentive Plan Information” in Item 5 of this Annual Report on Form 10-K and under the caption “Principal Holders of Voting Securities” appearing in the Company’s definitive Proxy Statement for the Annual Meeting of Shareholders for the fiscal year ended September 30, 2018 is incorporated herein by reference.
Item 13. CERTAIN RELATIONSHIPS AND RELATED TRANSACTIONS, AND DIRECTOR INDEPENDENCE
The information set forth under the caption “Certain Relationships and Related Person Transactions” appearing in the Company’s definitive Proxy Statement for the Annual Meeting of Shareholders for the fiscal year ended September 30, 2018 is incorporated herein by reference.
Item 14. PRINCIPAL ACCOUNTING FEES AND SERVICES
The information set forth under the caption “Independent Registered Public Accounting Firms and Fees” appearing in the Company’s definitive Proxy Statement for the Annual Meeting of Shareholders for the fiscal year ended September 30, 2018 is incorporated herein by reference.
| 74 |
Item 15. EXHIBITS, FINANCIAL STATEMENT SCHEDULES AND REPORTS ON FORM 8-K
The following documents are filed as part of this report:
| (a) | 1. | Consolidated Financial Statements |
Report of Independent Registered Public Accounting Firm
Consolidated Balance Sheets as of September 30, 2018 and 2017
Consolidated Statements of Operations for the Years Ended September 30, 2018, 2017 and 2016
Consolidated Statements of Comprehensive Loss for the Years Ended September 30, 2018, 2017 and 2016
Consolidated Statements of Shareholders’ Equity for the Years Ended September 30, 2018, 2017 and 2016
Consolidated Statements of Cash Flows for the Years Ended September 30, 2018, 2017 and 2016
Notes to Consolidated Financial Statements
| 2. | Financial Statement Schedules |
All schedules are omitted as the required information is not applicable or is included in the financial statements or related notes.
| 3. | List of Exhibits |
| 75 |
| * | Indicates a management contract or compensatory plan or contract. |
| Note: The number given in parenthesis next to each item listed above indicates the corresponding exhibit in each filing listed below. | ||
| (1) | Previously filed as an exhibit to Registration Statement 33-46290 on Form S-1 and incorporated herein by reference. | |
| (2) | Previously filed as an exhibit to Registrant’s Current Report on Form 8-K dated February 2, 2001 and incorporated herein by reference. | |
| (3) | Previously filed as an exhibit to Registrant’s Quarterly Report on Form 10-Q for the quarter ended March 31, 2001 and incorporated herein by reference. | |
| (4) | Previously filed as an exhibit to Registrant’s Annual Report on Form 10-K for the fiscal year ended September 30, 2001 and incorporated herein by reference. | |
| (5) | Previously filed as Appendix A to Registrant’s Definitive Proxy Statement dated January 30, 2006 and incorporated herein by reference. | |
| (6) | Previously filed as an exhibit to Registrant’s Annual Report on Form 10-K for the fiscal year ended September 30, 2006 and incorporated herein by reference. | |
| (7) | Previously filed as an exhibit to Registrant’s Current Report on Form 8-K dated August 2, 2007 and incorporated herein by reference. | |
| (8) | Previously filed as an exhibit to Registrant’s Current Report on Form 8-K dated November 5, 2018 and incorporated herein by reference. | |
| (9) | Previously filed as Appendix A to Registrant’s Amended Definitive Proxy Statement on Schedule 14A dated March 3, 2017 and incorporated herein by reference. | |
| (10) | Previously filed as an exhibit to Registrant’s Current Report on Form 10-K for the fiscal year ended September 30, 2011 and incorporated herein by reference. | |
| (11) | Previously filed as an exhibit to Registrant’s Current Report on Form 8-K dated August 28, 2013 and incorporated herein by reference. |
| 76 |
| (12) | Previously filed as an exhibit to Registrant’s Current Report on Form 8-K dated December 6, 2017 and incorporated herein by reference. | |
| (13) | Previously filed as an exhibit to Registrant’s Annual Report on Form 10-K dated November 10, 2016 and incorporated herein by reference. | |
| (14) | Previously filed as an exhibit to Registrant’s Current Report on Form 8-K dated January 30, 2018 and incorporated herein by reference. |
| (b) | Exhibits |
The Company hereby files as exhibits to this Annual Report on Form 10-K those exhibits listed in Item 15(a)3 above.
| (c) | Financial Statement Schedules |
Not applicable.
| 77 |
SIGNATURES
Pursuant to the requirements of Section 13 or 15(d) of the Securities Exchange Act of 1934, the Registrant has duly caused this report to be signed on its behalf by the undersigned, thereunto duly authorized.
| Datawatch Corporation | |||
| Date: | December 13, 2018 | By: | /s/ Michael A. Morrison |
| Michael A. Morrison | |||
| President, Chief Executive Officer and Director | |||
Pursuant to the requirements of the Securities Exchange Act of 1934, this report has been signed below by the following persons on behalf of the Registrant and in the capacities and on the dates indicated.
| SIGNATURE | TITLE | DATE | ||
| /s/ Michael A. Morrison | Principal Executive Officer and Director | December 13, 2018 | ||
| Michael A. Morrison | ||||
| /s/ James L. Eliason | Principal Financial Officer and Principal Accounting Officer | December 13, 2018 | ||
| James L. Eliason | ||||
| /s/ Richard de J. Osborne | Chairman of the Board | December 13, 2018 | ||
| Richard de J. Osborne | ||||
| /s/ David C. Mahoney | Vice Chairman of the Board | December 13, 2018 | ||
| David C. Mahoney | ||||
| /s/ Christopher T. Cox | Director | December 13, 2018 | ||
| Christopher T. Cox | ||||
| /s/ Thomas H. Kelly | Director | December 13, 2018 | ||
| Thomas H. Kelly | ||||
| /s/ Joan McArdle | Director | December 13, 2018 | ||
| Joan McArdle | ||||
| /s/ Randy Seidl | Director | December 13, 2018 | ||
| Randy Seidl | ||||
| /s/ Colin Mahony | Director | December 13, 2018 | ||
| Colin Mahony | ||||
| /s/ Donald Friedman | Director | December 13, 2018 | ||
| Donald Friedman |
| 78 |