Attached files
| file | filename |
|---|---|
| EX-32 - EXHIBIT 32 - Civitas Solutions, Inc. | civi-9301810kexhibit32.htm |
| EX-31.2 - EXHIBIT 31.2 - Civitas Solutions, Inc. | civi-9301810kexhibit312.htm |
| EX-31.1 - EXHIBIT 31.1 - Civitas Solutions, Inc. | civi-9301810kexhibit311.htm |
| EX-23.1 - EXHIBIT 23.1 - Civitas Solutions, Inc. | civi-9301810kexhibit231.htm |
| EX-21.1 - EXHIBIT 21.1 - Civitas Solutions, Inc. | civi-9301810kexhibit211.htm |
UNITED STATES
SECURITIES AND EXCHANGE COMMISSION
Washington, DC 20549
_____________________________________________
Form 10-K
_____________________________________________
x | ANNUAL REPORT PURSUANT TO SECTION 13 OR 15(d) OF THE SECURITIES EXCHANGE ACT OF 1934 |
For the fiscal year ended September 30, 2018
or
¨ | TRANSITION REPORT PURSUANT TO SECTION 13 OR 15(d) OF THE SECURITIES EXCHANGE ACT OF 1934 |
For the transition period from to .
COMMISSION FILE NUMBER: 001-36623
_____________________________________________
CIVITAS SOLUTIONS, INC.
(Exact name of registrant as specified in its charter)
_____________________________________________
Delaware | 65-1309110 |
(State or other jurisdiction of incorporation or organization) | (I.R.S. Employer Identification No.) |
313 Congress Street, 6th Floor Boston, Massachusetts 02210 | (617) 790-4800 |
(Address of principal executive offices, including zip code) | (Registrant’s telephone number, including area code) |
Securities Registered Pursuant to Section 12(b) of the Act
Title of each Class | Name of each exchange on which registered | |
Common Stock, $0.01 par value per share | New York Stock Exchange | |
Securities Registered Pursuant to Section 12(g) of the Act:
None.
__________________________________________
Indicate by check mark if the registrant is a well-known seasoned issuer, as defined in Rule 405 of the Securities Act. Yes ¨ No x
Indicate by check mark if the registrant is not required to file reports pursuant to Section 13 or Section 15(d) of the Act. Yes ¨ No x
Indicate by check mark whether the registrant (1) has filed all reports required to be filed by Section 13 or 15(d) of the Securities Exchange Act of 1934 during the preceding 12 months (or for such shorter period that the registrant was required to file such reports), and (2) has been subject to such filing requirements for the past 90 days. Yes x No ¨
Indicate by check mark whether the registrant has submitted electronically every Interactive Data File required to be submitted pursuant to Rule 405 of Regulation S-T (§ 232.405 of this chapter) during the preceding 12 months (or for such shorter period that the registrant was required to submit such files). Yes x No ¨
Indicate by check mark if disclosure of delinquent filers pursuant to Item 405 of Regulation S-K is not contained herein, and will not be contained, to the best of the registrant’s knowledge, in definitive proxy or information statements incorporated by reference in Part III of this Form 10-K or any amendment to this Form 10-K. x
Indicate by check mark whether the registrant is a large accelerated filer, an accelerated filer, a non-accelerated filer, a smaller reporting company, or an emerging growth company. See the definitions of “large accelerated filer,” “accelerated filer,” “smaller reporting company,” and "emerging growth company" in Rule 12b-2 of the Exchange Act. (Check one):
Large accelerated filer | ¨ | Accelerated filer | x | ||
Non-accelerated filer | ¨ (Do not check if a smaller reporting company) | Smaller reporting company | ¨ | ||
Emerging growth company | ¨ | ||||
If an emerging growth company, indicate by check mark if the registrant has elected not to use the extended transition period for complying with any new or revised financial accounting standards provided pursuant to Section 13(a) of the Exchange Act. ¨
Indicate by check mark whether the registrant is a shell company (as defined in Rule 12b-2 of the Exchange Act). Yes ¨ No x
The aggregate market value of voting and non-voting common equity held by non-affiliates of the registrant as of March 31, 2018, the last business day of the registrant’s most recently completed second fiscal quarter, was approximately $270,000,000.
As of November 30, 2018, there were 36,116,252 shares of the registrant’s common stock, $0.01 par value, issued and outstanding.
DOCUMENTS INCORPORATED BY REFERENCE:
Portions of the registrant’s proxy statement for use in connection with its 2019 Annual Meeting of Stockholders, to be filed no later than 120 days after September 30, 2018 are incorporated by reference to Part III of this report.
TABLE OF CONTENTS
Item 1. | ||
Item 1A. | ||
Item 1B. | ||
Item 2. | ||
Item 3. | ||
Item 4. | ||
Item 5. | ||
Item 6. | ||
Item 7. | ||
Item 7A. | ||
Item 8. | ||
Item 9. | ||
Item 9A. | ||
Item 9B. | ||
Item 10. | ||
Item 11. | ||
Item 12. | ||
Item 13. | ||
Item 14. | ||
Item 15. | ||
FORWARD-LOOKING STATEMENTS
Some of the matters discussed in this report may constitute “forward-looking statements” within the meaning of Section 27A of the Securities Act of 1933, as amended, and Section 21E of the Securities Exchange Act of 1934, as amended (the “Exchange Act”).
These statements relate to future events or our future financial performance, and include statements about our expectations for future periods with respect to our markets, demand for our services, the political climate and budgetary and rate environment, our expansion efforts and the impact of our recent acquisitions, our plans for investments to further grow and develop our business, our margins, our liquidity, our labor costs, and costs of ongoing litigation. Terminology such as “may,” “will,” “should,” “could,” “expect,” “plan,” “anticipate,” “believe,” “estimate,” “predict,” “potential” or “continue,” or similar expressions are intended to identify these forward looking statements. These statements are only predictions. Actual events or results may differ materially.
The information in this report is not a complete description of our business or the risks associated with our business. There can be no assurance that other factors will not affect the accuracy of these forward-looking statements or that our actual results will not differ materially from the results anticipated in such forward-looking statements. While it is not possible to identify all such factors, factors that could cause actual results to differ materially from those estimated by us include, but are not limited to, those factors or conditions described under “Part I. Item 1A. Risk Factors” in this Annual Report on Form 10-K as well as the following:
• | reductions or changes in Medicaid or other funding or changes in budgetary priorities by federal, state and local governments; |
• | an increase in labor costs or labor-related liability; |
• | substantial claims, litigation and governmental proceedings; |
• | reductions in reimbursement rates, policies or payment practices by our payors; |
• | information technology failure, inadequacy, interruption or security failure; |
• | our ability to attract and retain experienced personnel; |
• | negative publicity or changes in public perception of our services; |
• | an increase in our self-insured retentions and changes in the insurance market for professional and general liability, workers’ compensation and automobile liability and our claims history and our ability to obtain coverage at reasonable rates; |
• | an increase in workers’ compensation related liability; |
• | our ability to comply with complicated billing and collection rules and regulations; |
• | failure to comply with reimbursement procedures and collect accounts receivable; |
• | the Patient Protection and Affordable Care Act materially reduced the flexibility we had in managing our healthcare cost and may make it harder for us to compete as an employer; |
• | our history of losses; |
• | changes in economic conditions; |
• | our ability to maintain effective internal controls; |
• | our substantial amount of debt, our ability to meet our debt service obligations and our ability to incur additional debt; |
• | our ability to establish and maintain relationships with government agencies and advocacy groups; |
• | our ability to maintain our status as a licensed service provider in certain jurisdictions; |
• | our susceptibility to any reduction in budget appropriations for our services in Minnesota or any other adverse developments in that state; |
1
• | our ability to maintain, expand and renew existing services contracts and to obtain additional contracts or acquire new licenses; |
• | our ability to realize and anticipate benefits of future acquisitions and our ability to successfully integrate acquired businesses; |
• | government regulations, changes in government regulations and our ability to comply with such regulations; |
• | write-offs of goodwill or other intangible assets; |
• | increased competition in our industry; |
• | decrease in popularity of home- and community-based human services among our targeted populations of individuals and/or state and local governments; |
• | our ability to operate our business due to constraints imposed by covenants in our senior credit agreement; |
• | our inability to successfully expand into adjacent markets; |
• | our ability to manage and integrate key administrative functions; |
• | natural disasters or public health catastrophes; |
• | our classification as a "controlled company"; |
• | our stock price may be volatile and/or decline; |
• | our equity sponsor has the ability to control significant corporate activities; |
• | future sales of common stock may depress our stock price; and |
• | as a holding company we rely on dividends, disbursements and other transfers of funds from our subsidiaries to meet our financial obligations. |
Although we believe that the expectations reflected in the forward-looking statements are reasonable, we cannot guarantee future results, levels of activity, performance or achievements. Moreover, we do not assume responsibility for the accuracy and completeness of the forward-looking statements. All written and oral forward-looking statements attributable to us or persons acting on our behalf are expressly qualified in their entirety by the “Risk Factors” and other cautionary statements included herein. We are under no duty to update any of the forward-looking statements after the date of this report to conform such statements to actual results or to changes in our expectations.
2
PART I
Item 1. | Business |
Company Overview
In this section “Civitas”, “we”, “us”, the “Company” and “our” refer to Civitas Solutions, Inc. and its consolidated subsidiaries. Throughout this Annual Report on Form 10-K we use the term “must serve” to describe the people we serve. We consider “must-serve individuals” to be those that public policy has recognized a responsibility to support because they are highly vulnerable by virtue of a condition acquired at birth or after birth, or their status as a minor, or as elders, and have special needs and/or disabilities such that they need to be supported or cared for in the daily activities of living.
We are the leading national provider of home- and community-based health and human services to must-serve individuals with intellectual, developmental, physical or behavioral disabilities and other special needs. These populations are large, growing and increasingly being served in home- and community-based settings. Our clinicians and direct support professionals develop customized service plans, delivered in non-institutional settings, designed to address a broad range of often life-long conditions and to enable those we serve to thrive in less restrictive settings. We believe we offer a powerful value proposition to government and non-public payors, referral sources and individuals and families by providing innovative, high-quality and cost-effective services that enable greater independence, skill building and community involvement.
Since our founding in 1980, we have been a pioneer in the movement to provide home- and community-based services for people who would otherwise be institutionalized. During our more than 38-year history, we have evolved from a single residential program serving at-risk youth to a diversified national network providing an array of high-quality services and care in large, growing and highly-fragmented markets. While we have the capabilities to serve individuals with a wide variety of special needs and disabilities, we currently provide our services to individuals with intellectual and/or developmental disabilities (“I/DD”), individuals with catastrophic injuries and illnesses, particularly acquired brain injury (“ABI”), youth with emotional, behavioral and/or medically complex challenges, and elders in need of day health services to support their independence. As of September 30, 2018, we operated in 36 states, serving approximately 12,700 individuals in residential settings and approximately 19,000 individuals in non-residential settings. We have a diverse group of hundreds of public payors that fund our services with a combination of federal, state and local funding, as well as an increasing number of non-public payors for our services to individuals with acquired brain injuries or other catastrophic injuries and illnesses.
Our core strength is providing a continuum of residential, day and vocational programs, and periodic services to support diverse populations with disabilities and special needs. We currently offer our services through a variety of models, including (i) neighborhood group homes, most of which are residences for six or fewer individuals, (ii) host homes, or the “Mentor” model, in which a person lives in the private home of a licensed providers, (iii) in-home settings, within which we support an individual's independent living or provide therapeutic services, (iv) specialized community facilities to support individuals with more complex medical, physical and behavioral challenges, and (v) non-residential care, consisting primarily of day and vocational programs and periodic services that are provided outside the individual's home. As of September 30, 2018, our services were provided by approximately 23,600 full-time equivalent employees, as well as more than 3,500 independently-contracted host home providers.
The Company
Civitas Solutions, Inc. is the parent and public reporting entity of a consolidated group of subsidiaries that market their services under The MENTOR Network tradename. Prior to October 1, 2015, Civitas Solutions, Inc. was a subsidiary of NMH Investment, LLC (“NMH Investment”), which was formed in connection with the acquisition of our business by affiliates of Vestar Capital Partners (“Vestar”) in 2006. Approximately 54% of the Common Stock of Civitas Solutions, Inc. is owned by Vestar. Our common stock is listed on the New York Stock Exchange under the ticker symbol CIVI .
Description of Services by Operating Division
We have four operating divisions, Community Support Services ("CSS"), Specialty Rehabilitation Services (“SRS”), Children & Family Services ("CFS") and Adult Day Health ("ADH"). Each operating division represents a reportable segment except ADH, which is included within Corporate and Other, because it does not meet the thresholds for separate reporting. As of October 1, 2018, Community Support Services and Children & Family Services are new names for the operating divisions formerly referred to as Intellectual and Developmental Disabilities ("I/DD") and At-Risk Youth ("ARY") respectively. There were no changes to the composition of the operating divisions as a result of these name changes.
We do not derive any revenues from countries outside the United States.
3
Community Support Services (CSS)
Our CSS operating division is focused on supporting individuals with intellectual and developmental disabilities ("I/DD") through programs that include residential support, day habilitation, vocational services, case management, crisis intervention and hourly support care. We provide services to these individuals through small group homes, Intermediate Care Facilities for Individuals with Intellectual and/or Developmental Disabilities (“ICFs-I/DD”), host homes, in-home settings and non-residential settings. We operate approximately 1,500 group homes and 150 ICFs-I/DD. As of September 30, 2018, we provided CSS services to approximately 18,500 individuals in 21 states. In fiscal 2018, our CSS services generated net revenue of $1,025.6 million, representing 64.0% of our net revenue. We receive substantially all our revenue for CSS services from a diverse group of state and local governmental payors.
Specialty Rehabilitation Services (SRS)
Our SRS operating division delivers health care and community-based health and human services to individuals who have suffered acquired brain injury, spinal injuries and other catastrophic injuries and illnesses.
Our SRS operating division is focused on rehabilitation and transitional living services and more medically-intensive post-acute care services. Our SRS services range from sub-acute healthcare for individuals with intensive medical needs to day treatment programs, and include: neurorehabilitation; neurobehavioral rehabilitation; specialized nursing; physical, occupational and speech therapies; supported living; outpatient treatment; and pre-vocational services. Our goal is to provide a continuum of care to allow individuals to achieve the highest level of function possible while enhancing their quality of life. We provide these services primarily through specialized community facilities, small group homes, in-home and non-residential settings. As of September 30, 2018, our SRS operations provided services in 25 states and served approximately 2,200 individuals nationally. In fiscal 2018, our SRS services generated net revenue of $356.3 million, representing approximately 22.2% of our net revenue. In fiscal 2018, we received 51% of our SRS revenue from non-public payors, such as commercial insurers, workers’ compensation funds, managed care and other private payors and 49% from state, local and federal governmental payors.
Children & Family Services (CFS)
Our CFS operating division is focused on supporting youth with emotional, behavioral and/or medically complex challenges through programs that include therapeutic foster care, family preservation, adoption services, early intervention, school-based services and juvenile offender programs. Our individualized approach allows us to work with an ever-changing population that is diverse demographically as well as in type and severity of condition. We provide these services through host homes, group homes, educational settings, in their family homes and in other non-residential settings. As of September 30, 2018, we provided CFS services to approximately 6,000 children, adolescents and their families in 9 states. In fiscal 2018, our CFS services generated net revenue of $147.7 million, representing 9.2% of our net revenue. We receive substantially all our revenue for CFS services from a diverse group of state and local governmental payors.
Adult Day Health (ADH)
Our newest operating division, ADH, delivers elder services including case management, nursing oversight, medication management, nutrition, daily living assistance, transportation, and therapeutic services. Our adult day health facilities provide outpatient, center-based services to approximately 5,000 adults in a group environment in 4 states. In fiscal 2018, our ADH services generated net revenue of $72.6 million, representing 4.5% of our net revenue. We receive substantially all our revenue for ADH services from state and local governmental payors.
Industry Overview
We provide home- and community-based services to large populations of individuals with intellectual, developmental, physical or behavioral disabilities and other special needs. These populations are must serve due to the nature of their disabilities, which in many cases are life-long and irreversible, or their status as children, adolescents, or elders. Within the broader health and human services market, we currently serve four primary populations:
• | Intellectual and Developmental Disabilities (I/DD). Based on reports prepared by Dr. David Braddock, public spending on I/DD services was estimated to be $65.2 billion in 2015, of which approximately 85% was spent to provide services in community settings of six or fewer beds, our target market, and for other non-institutional services, including supported living, supported employment and family assistance. In 2015, there were approximately |
4
5.1 million individuals with an intellectual or developmental disability across the nation. Over the past two decades, the delivery of services to the I/DD population in supervised residential settings has grown significantly and, at the same time, there has been a shift from institutional settings to home- and community-based settings. Dr. Braddock is Associate Vice President of the University of Colorado (CU) System and Executive Director of the Coleman Institute for Cognitive Disabilities.
• | Acquired Brain Injury (ABI). The market for acute care and rehabilitation for individuals with ABI is approximately $10.0 billion annually, according to the Centers for Disease Control and Prevention. According to the Brain Injury Association of America (“BIAA”), more than 3.2 million children and adults sustain a brain injury each year, many of which result in complex, life-long medical and/or behavioral issues that require specialized care. Approximately 5.3 million individuals in the United States are living with permanent disability as a result of an ABI. Many of these individuals are currently served in costly and often medically inappropriate care settings such as long-term acute care facilities and nursing homes. We expect that there will be a continuing shift in care delivery to more appropriate community-based settings such as those that we offer. |
• | Children & Family Services (CFS). According to reports published by the organization Child Trends, an estimated $29.1 billion was spent in state fiscal year 2014 on child welfare, including spending for residential and non-residential family support services such as those that we offer. Approximately 4.1 million referrals for abuse or neglect, which involved an estimated 7.4 million children, were investigated or assessed in the United States in federal fiscal year 2016. An estimated 688,000 children and adolescents were served by the foster care system in 2016. According to the Federal Department of Health and Human Services AFCARS data, there were nearly 437,000 children and adolescents in foster care as of September 30, 2016. Of those individuals, approximately 196,000 are living in non-relative foster family homes, which includes the therapeutic foster care market, the primary market for our residential CFS services. |
• | Adult Day Health (ADH). The ADH portion of the elder services market is an estimated $8.5 billion based on an IBISWorld 2018 report. IBISWorld forecasts growth to be at an annualized rate for ADH of 5.5% with revenue for this industry projected to reach $11.1 billion in 2021. We believe that there will be a growing demand for ADH services for several reasons, including that the population of adults 65 years of age and older is a growing demographic. According to the United States Census Bureau, the population of individuals age 65 and older will reach 82.8 million by 2050, almost double the estimated population of 49.2 million in 2016. Moreover, states are increasingly looking for alternatives to more expensive models of home-based, residential and institutional care. The ADH market, like other markets in which we operate, is highly fragmented with opportunities for consolidation. |
Our Business Strategy
We believe the market opportunity for home- and community-based health and human services that increase independence and participation in community life for the individuals we serve while reducing costs will continue to grow. We intend to continue leveraging our strengths to capitalize on this trend, both in existing markets and in new markets where we believe significant opportunities exist. The primary aspects of our strategy include the following:
Pursue Opportunistic Acquisitions.
As a leading provider in our markets with national scale and a proven track record of quality care, we are well positioned as an acquiror of choice for small operators in a highly-fragmented industry. This dynamic leads to a number of attractive acquisition opportunities that can drive returns. We continue to maintain a robust acquisition pipeline and deploy capital in a disciplined and opportunistic manner to pursue acquisitions.
We intend to continue to pursue acquisitions that are consistent with our mission and complement our existing operations. We have invested in a team dedicated to mergers and acquisitions, as well as the infrastructure and formalized processes to enable us to pursue acquisition opportunities and to integrate them into our business.
We monitor the market nationally for businesses that we can acquire at attractive prices and efficiently integrate with our existing operations. From the beginning of fiscal 2014 through September 30, 2018, we have successfully acquired 55 companies, at an aggregate purchase price of approximately $329.5 million, including $9.7 million to settle contingent consideration obligations.
Leverage our Core Competencies to Drive the Organic Growth of High-Quality Services.
5
We expect to capture the embedded growth opportunities resulting from organic growth initiatives and leverage our core competencies to further expand our presence in markets we currently serve and to further expand our geographic footprint in our existing service lines. During our 38-year history, we have developed and refined a core set of competencies through our experience developing customized service plans for complex cases and supporting our operations with expertise in areas such as quality improvement, risk management, compliance and quality improvement.
Continue to Invest in our New Start Programs.
A key driver of growth has been our new start programs that have historically generated attractive returns on our investments. Our demonstrated ability to quickly launch new start programs positions us well to meet new sources of market demand. New starts, which typically turn profitable within 18-24 months, require modest investments, consisting of operating losses and capital expenditures. Investments in the form of operating losses of approximately $16.3 million in new starts between fiscal 2012 and fiscal 2013 generated net revenues and operating income of approximately $83.4 million and $22.0 million, respectively, in fiscal 2018. Investments in the form of operating losses of approximately $11.8 million in new starts between fiscal 2014 and fiscal 2015 generated net revenues and operating income of approximately $57.1 million and $9.4 million, respectively, in fiscal 2018. Investments in the form of operating losses of approximately $13.0 million in new starts between fiscal 2016 and fiscal 2017 generated net revenues and operating income of approximately $33.7 million and $4.6 million, respectively in fiscal 2018. We have made a number of recent investments that we believe will continue to drive near term growth as they reach maturity. Our average annual new start investment in fiscal 2016 through fiscal 2018 was approximately $6.4 million. We intend to continue to aggressively pursue new start opportunities with attractive rates of return.
Expand our SRS Platform.
We intend to leverage our scale and leadership position to continue to expand our SRS platform through continued organic growth in new and existing markets, as well as through opportunistic acquisitions. We are the only provider with a national platform dedicated to providing post-acute care for individuals with brain injuries or other catastrophic injuries and illnesses, and thus we believe we are the leader serving this market. We have grown our SRS operating division revenue by over 70 percent since fiscal 2013, achieving a 11.3% compound annual growth rate in net revenue over that period. Furthermore, our SRS business is funded by a highly attractive payor mix, with approximately 51% of net revenues in fiscal 2018 derived from commercial insurers and other private entities.
Pursue Opportunities in Adjacent Markets and Complementary Service Lines that Diversify our Service Offerings.
We have a proven track record of developing new service areas, as evidenced by the growth of our SRS segment, and we intend to leverage our core competencies and relationships with state agencies to pursue opportunities in adjacent markets, particularly the $7.1 billion market for ADH, which we entered in 2014 with the acquisition of the Mass Adult Day Health Alliance. Since completing this acquisition, we have opened two additional ADH centers in Massachusetts and have acquired seven additional companies located in Massachusetts, Maryland, New Jersey and New Hampshire. We are continuing to evaluate opportunities to expand this service both organically and through potential acquisitions. In the future, we may explore additional opportunities to leverage our periodic, day and residential service models to support individuals in the broader elder care market as well as other adjacent markets, such as those serving youth with autism and individuals with mental health needs.
Customers and Contracts
Our customers that pay us to provide services to the individuals we support are governmental agencies, non-public payors and not-for-profit organizations. Our CSS and CFS services, as well as a significant portion of our SRS services, are delivered pursuant to contracts with various governmental agencies, such as state departments of developmental disabilities, juvenile justice, child welfare and the Federal Veterans Health Administration. Such contracts may be issued at the county or state level, depending upon the structure of the service system of the state in question. In addition, approximately 51% of our SRS revenue is derived from contracts with commercial insurers, workers’ compensation carriers and other non-public payors.
In all of our service lines, either the individuals that we support and/or the payors/referral sources (e.g., state agencies) select us as a provider and, although an individual funded by Medicaid has the right to choose an alternative provider at any time, it has been our experience that the individuals we support change providers infrequently. We believe that many of the individuals we support develop close relationships with their direct support professionals and our organization. Although an individual may develop a close relationship with his or her direct support professional, it is our experience that if such direct support professional leaves our employment, the individuals we support rarely elect to switch providers based on such direct support professional's departure. The length of stay varies widely based on individual needs. For instance, in our SRS segment,
6
an individual's care may be focused on rehabilitation, in which case we will provide services for several months, or, if an individual suffered a catastrophic illness or accident, that individual could remain in our care for the duration of their life, which could span years or decades. In our CSS business, the length of stay is generally years, and often we support individuals for decades. In our CFS business, the length of treatment can vary widely but most often is for several months.
Contracts may cover a range of individuals such as all children referred for host home services in a county or a particular set of individuals who will share group living arrangements. Contracts are sometimes issued for specific individuals, where rates are individually determined based on need. Although our contracts generally have a stated term of one year and generally may be terminated without cause on 60 days’ notice, the contracts are typically renewed annually if we have complied with licensing, certification, program standards and other regulatory requirements. As a provider of record, we contractually obligate ourselves to adhere to the applicable federal and state regulations regarding the provision of services, the maintenance of records and submission of claims for reimbursement under Medicaid and other government programs. In addition, while we are not obligated to serve each individual that is referred to us, we make every effort to review referrals made and accept individuals who need our services.
During fiscal 2018, revenue from our contracts with state and local governmental payors in the states of Minnesota, California, Massachusetts, Ohio and Indiana, our five largest revenue-generating states, comprised 41% of our net revenue. During fiscal 2017, revenue from our contracts with state and local governmental payors in the states of Minnesota, California, Indiana, Massachusetts, and New Jersey, our five largest revenue-generating states, comprised 40% of our net revenue. During fiscal 2016, revenue from our contracts with state and local governmental payors in the states of Minnesota, California, Indiana, New Jersey, and Massachusetts, our five largest revenue-generating states, comprised 41% of our net revenue. Of the 36 states the Company operates in, Minnesota is our largest state and generates revenue from our contracts with state and local governmental payors which accounted for 16%, 15%, and 15% of our net revenue in fiscal years 2018, 2017 and 2016, respectively. Contracts with state and local governmental payors in California, our second largest state, accounted for 10% of our net revenue in fiscal years 2018 and 2017. No other states accounted for 10% or more of our net revenue during fiscal years 2018, 2017, or 2016.
Training and Supporting our Direct Support Professionals
We provide pre-service and in-service education to all of our direct support professionals and clinical and administrative staff, and we encourage staff to avail themselves of outside training opportunities whenever possible. Employees participate in orientation programs designed to increase their understanding of our mission, philosophy of service, and our Code of Conduct and compliance program. Our employees benefit from our library of training materials and an intranet site that facilitates the identification and exchange of expertise across all of our operations. We work to increase individual job satisfaction and retention of motivated and qualified employees.
We use equally rigorous methods to identify and contract with independent contractor providers (host home providers), whether in an adult host home or foster care environment. In addition to pre-service and in-service orientation to familiarize the host home providers to the specifics of our model and expectations, the contracted host home providers in our CSS and CFS businesses receive a detailed briefing tailored to the individualized needs of the individual or child placed in their home. Prior to any placements being made, we conduct a home study to evaluate the appropriateness of any placement and conduct interviews and criminal background checks on adult members residing in the host home provider household. The services provided by host home providers are evaluated for contractual compliance by our case manager or coordinator according to standards set by licensing and regulatory agencies as well as our own quality standards. While host home providers can provide services independently, they have access to emergency telephone triage and on-site crisis intervention, if necessary. Host home providers also avail themselves of support groups, whether independent or offered at the program office.
Employees and Independent Contractors
As of September 30, 2018, we had approximately 23,600 full-time equivalent employees and more than 3,500 independent contractors. Although our employees are generally not unionized, we have one business in New Jersey with approximately 40 employees who are represented by a labor union and one business in Florida with approximately 62 employees that voted to unionize in June 2018. We consider our employee relations to be good.
Sales/Business Development and Marketing
We market our services nationally as The MENTOR Network, a national network of local service providers. We operate under several brands across the country, predominantly under the REM and MENTOR brands in our CSS and CFS operating divisions and the NeuroRestorative and CareMeridian brands in our SRS operating division.
7
The majority of individuals we serve in the CSS and CFS operating divisions come to us through third-party referrals, and frequently our CSS referrals come through recommendations to family members from state or local agencies. Since our operations depend heavily on these referrals, we seek to ensure that we provide high-quality services in all states in which we operate, allowing us to enhance our name recognition and maintain a positive reputation with state and local agencies.
Relationships with referral sources are cultivated and maintained at the local level by key operations managers and supported by an array of corporate resources including marketing communications, government relations and business development services to promote both new and existing product lines.
Our SRS sales activities are independently organized from those of our CSS and CFS businesses. We have dedicated, geographically assigned clinical marketing and sales staff cultivating relationships with public and private payors, referral sources and directly with potential participants and their families. These regional teams are also supported by corporate resources as outlined above.
To further distinguish ourselves in each operating division, we have established a comprehensive presence at both the national and local level through a robust online presence, including social media. Additionally, through our government relations and business development activities, we believe we have successfully positioned ourselves to anticipate and meet the needs of our public partners.
Competition
Community Support Services (CSS)
The CSS market is highly fragmented, with both not-for-profit and for-profit providers ranging in size from small, local agencies to large, national organizations. We and the other leading national provider account for less than 4% of services by revenue in the CSS market. Although state and local governments continue to supply a small percentage of services, the majority of services are provided by the private sector. Not-for-profit organizations are also active in all states and range from small agencies serving a limited area with specific programs to multi-state organizations. Many of the not-for-profit companies are affiliated with advocacy groups such as community mental health and religious organizations.
Specialty Rehabilitation Services (SRS)
We compete with local providers, both large and small, including hospitals, post-acute rehabilitation facilities, residential community-based facilities, day treatment centers and outpatient centers specializing in long-term catastrophic care and short-term rehabilitation. This market also includes several large national providers of general inpatient and outpatient rehabilitation services.
Children & Family Services (CFS)
The CFS market is extremely fragmented, with several thousand providers in the United States. Competitors include both not-for-profit and for profit local providers serving one particular geographic area to a single state, and, to a limited extent, multi-state providers.
Adult Day Health (ADH)
The ADH market in the United States is highly fragmented, with approximately 12,500 providers operating 15,300 centers according to IBISWorld. The majority of providers are relatively small companies, and only 33% of these providers have two or more locations. In 2016, the National Center on Health Statistics reported that for-profit providers served approximately 45% of the nearly 286,000 individuals who received this service.
Regulatory Framework
We must comply with comprehensive government regulation of our business, including federal, state and local statutes, regulations and policies governing the licensing of services, the quality of service, participation in State and Federal payment systems, the revenues received for services, and reimbursement for the cost of services. State and federal regulatory agencies have broad discretionary powers over the administration and enforcement of laws and regulations that govern our operations.
The following regulatory considerations are critical to our operations:
8
Funding. Federal and state funding for our services is subject to frequent statutory and regulatory changes, contracting and managed care initiatives, level of care assessments, court orders, rate setting and state budgetary considerations, all of which may materially increase or decrease reimbursement for our services. We actively participate in local and national legislative initiatives that seek to impact funding and regulation of our services. We derive revenues for our CSS and CFS services and a significant portion of our SRS services from Medicaid programs.
Licensure and qualification to deliver service. We are required to comply with extensive licensing and regulatory requirements applicable to the services we deliver. These include requirements for participation in the Medicaid program, state and local contractual obligations, and requirements relating to individual rights, the credentialing of individual employees and contract Mentors (including background and Office of Inspector General checks), the quality of care delivered, the physical plant and facilitation of community participation. Compliance with state licensing requirements is a prerequisite for participation in government-sponsored public health care assistance programs, such as Medicaid. To qualify for reimbursement under Medicaid, facilities and programs are subject to various requirements imposed by federal and state authorities. We maintain a licensing database that tracks activity impacting licenses governing the provision of services.
In addition to Medicaid participation requirements, our facilities and services are subject to annual or semi-annual licensing and other regulatory requirements of state and local authorities. These requirements relate to the condition of the facilities, the quality and adequacy of personnel staff and service ratios and the quality of services provided. State licensing and other regulatory requirements vary by jurisdiction and are subject to change and local interpretation.
From time to time we receive notices from regulatory inspectors that, in their opinion, there are deficiencies resulting from a failure to comply with various regulatory requirements. We review such notices and take corrective action as appropriate. In most cases we and the reviewing agency agree upon the steps to be taken to address the deficiency and, from time to time, we or one or more of our subsidiaries may enter into corrective action plans with regulatory agencies requiring us to take certain actions in order to maintain our licenses or certification. Serious or repeat deficiencies, or failure to comply with corrective action plans, may result in the assessment of fines or penalties, referral holds, payment suspensions and/or decertification or de-licensure actions by various federal or state regulatory agencies.
We deliver services and support under a number of different funding and program provisions. Our most significant sources of funding for our CSS services are home and community based waiver programs ("HCBS Waiver"), Medicaid programs for which eligibility is based on a set of criteria (typically disability or age) established by the state and approved by the federal government. There is no uniformity among states and/or regulations governing our delivery of waivered services to individuals. Each state where we deliver services operates under a plan submitted by the state to Centers for Medicare and Medicaid Services (“CMS”) which approves the state plan and thereby authorizes the state to use Medicaid funds in non-institutional settings using federal financial participation (“FFP”). Typically the state writes state specific regulations governing providers and services provided under the state waiver program. Consequently, there is no uniform method of describing or predicting the content or impact of regulations across states where we deliver HCBS Waiver services. On March 17, 2014, a federal regulation governing HCBS Waiver programs became effective. The rule establishes eligibility requirements for payment for Medicaid home and community-based services provided under the “waiver” program. Under the rule, home- and community-based settings must be integrated in and support full access to the greater community, be selected by the individual from different setting options, ensure individual rights of privacy, and optimize autonomy and independence in making life choices. The rule includes additional requirements for provider-owned or controlled home and community-based residential settings, including that the individual has a lease or other legally enforceable agreement, and standards related to the individual’s privacy, control over schedule and visitors, and physical accessibility of the setting. States have the option to request a variation or delay of compliance with the federal standards for as long as five (5) years from the effective date. Each state has its own implementation scheme and schedule, which presents implementation costs and challenges. At this juncture seven states and the District of Columbia have received final approval of their Statewide Transition Plans, and it remains unclear how other states will implement this regulation. Accordingly, the total cost of compliance with the HCBS waiver remains uncertain.
In addition, our ICFs-I/DD are governed by federal regulations, and may also be subject to individual state rules that vary widely in application and content. Federal regulations require that in order to maintain Medicaid certification as an ICF-I/DD, the facility is subject to annual on-site survey (a federal rule and process implemented by state agencies), the results of which provide or deny the certification necessary to bill Medicaid for services in the facility. Failure to successfully pass this inspection and remedy all defects or conditions cited may result in a finding of immediate jeopardy or other serious sanction and, ultimately, may cause a loss of both certification and funding for that particular facility.
9
Similarly, child foster care and other children’s services are largely governed by individual state regulations which vary both in terms and regulatory content. Failure to comply with any state’s regulations requires remedial action on our part and a failure to adequately remedy the problem may result in provider or contract termination.
All states in which we operate have adopted laws or regulations which generally require that a state agency approve us as a provider, and many require a determination that a need exists prior to the admission of covered individuals or services. Provider licenses are not transferable. Consequently, should we intend to acquire, develop, expand or divest services in any state or to enter a new state, we may be required to undergo a rigorous licensing, transfer and approval process prior to conducting business or completing any transaction.
Similarly, some states have a formal Certificate of Need (“CON”) process, whereby the state health care authority must first determine that a service proposed is needed under the state health plan, prior to any service being licensed or applied for. The CON process varies by state and may be formal in design, encompassing any transfer, organizational change, capital improvements, divestitures or acquisitions. Formal processes may include public notice, opportunity for affected parties to request a hearing prior to the health care authority approving the project, as well as an opportunity for the state authority to deny the project. Other states have a less formal process for CON application and approval and may be limited to new or institutional projects. Very few states require CON approval for waivered services. Failure to comply with a state CON process may result in a prohibition on Medicaid billing and may subject the provider to fines, penalties, other civil sanctions or criminal penalties for the operators or owners of an unapproved health service.
Other regulatory matters. The Health Insurance Portability and Accountability Act of 1996, or “HIPAA,” as amended by the Health Information Technology for Economic and Clinical Health Act (“HITECH Act”), set national standards for the protection of health information created, maintained or transmitted by health providers. Under the law and regulations known collectively as the privacy and security rules, covered entities must implement standards to protect and guard against the misuse of individually identifiable health information, report breaches and undertake notification and remedial steps consistent with regulation.
Federal regulations issued pursuant to HIPAA and the HITECH ACT contain, among other measures, provisions that require organizations to implement significant and expensive computer systems, employee training programs and business procedures. Rules have been established to protect the integrity, security and distribution of electronic health and related financial information. Many states have also implemented extensive data privacy and security laws and regulations. Failure to timely implement or comply with HIPAA or other data privacy and security regulations may, under certain circumstances, trigger the imposition of civil or criminal penalties.
The federal False Claims Act imposes civil liability on individuals and entities that submit or cause to be submitted false or fraudulent claims for payment to the government. Violations of the False Claims Act may include treble damages and penalties of up to $11,000 per false or fraudulent claim. Similarly, retention of any overpayments may be regarded by the government as a false claim.
In addition to actions being brought by government officials under the False Claims Act, this statute and analogous state laws also allow a private individual with direct knowledge of fraud to bring a “whistleblower” claim on behalf of the government for violations. The whistleblower receives a statutory amount of up to 30% of the recovered amount from the government’s litigation proceeds if the litigation is successful or if the case is successfully settled. Recently, the number of whistleblower suits brought against healthcare providers has increased dramatically, and has included suits based (among other things) upon alleged violations of the Federal Anti-Kickback Law.
The Anti-Kickback Law prohibits kickbacks, rebates and any other forms of remuneration in return for referrals. Any remuneration, direct or indirect, offered, paid, solicited or received, in return for referrals of patients or business for which payment may be made in whole or in part under Medicaid, could be considered a violation of law. The language of the Anti-Kickback law also prohibits payments made to anyone to induce them to recommend purchasing, leasing, or ordering any goods, facility, service or item for which payment may be made in whole or in part by Medicaid. Criminal penalties under the Anti-Kickback Law include fines up to $25,000, imprisonment for up to 5 years, or both. In addition, acts constituting a violation of the Anti-Kickback Law may also lead to civil penalties, such as fines, assessments and exclusion from participation in the Medicaid program.
Additionally we must comply with local zoning and licensing ordinances and requirements. The Federal Fair Housing Amendments Act of 1988 protects the interests of the individuals we serve, prohibits local discriminatory ordinance practices and provides additional opportunities and accommodations for people with disabilities to live in their community of choice.
10
Federal regulations promulgated by the Occupational Safety and Health Administration (“OSHA”) require us to have safety plans for blood borne pathogens and other work place risks. At any point in time OSHA investigators may receive a complaint which requires on-site inspection and/or audit, the outcome of which may adversely affect our operations.
The Patient Protection and Affordable Care Act of 2010 provided a mandate for more vigorous and widespread enforcement and directed state Medicaid agencies to establish Recovery Audit Contractor (“RAC”) programs. RACs are private entities which will perform audits on a contingency fee basis, giving them an incentive to identify discrepancies in payments, from which they may be permitted to extrapolate disproportionately large penalties and fines. States were required to be in compliance by January 1, 2012 unless granted an extension. We have experienced only modest RAC auditing activity to date; however this remains a fairly new federal initiative and the ultimate impact remains unclear. Only the passage of time and our experience with enforcement and compliance will permit our assessment of the exact impact the new statute and regulations have on our business.
Similarly the HIPAA and HITECH Regulations increased both the scope of liability and obligations of business associates with whom such covered entities contract for services, as well as increase disclosure obligations of providers in the event of a breach. The Federal enforcement agency has expressed an intent to increase investigations and potential penalties for noncompliance in part due to these new standards.
Managed care initiatives have recently been undertaken in certain states, notably in Iowa and Wisconsin, and those initiatives have impacted our business by modifying the types of services eligible for payment, the qualifications required for payment and the rates that are paid for those services. Managed care organizations ("MCOs") undertake frequent rate changes some of which are difficult to predict and the impact of those changes may reduce our revenue and ability to bill for services. In addition, as MCOs merge with others or leave the marketplace we may experience higher unpaid receivables as we enter into new contracts with the MCO's successor. Similarly, some states are pursuing waivers for dual-eligible populations (that is, persons eligible for both Medicare and Medicaid), and our ability to participate in such waivered services in some markets may depend on our ability to become a Medicare provider.
We participate in Medicare in a very select number of areas of the country, as well as in managed care projects that allocate funds for recipients who are dually eligible for Medicare and Medicaid. Medicare has a unique and different set of regulations, funding mechanisms and audit and compliance risks compared to Medicaid. In recent years, states have begun working toward maximizing Medicare funding for services for dual eligible populations due to the fiscal incentive to lower state contributions and shift the cost of service to Medicare. In some state markets “equalization” of rates is required, thereby mandating that the rates we charge to private payors may not exceed rates established and paid by Medicaid and/or Medicare. Public policy initiatives and cost-containment initiatives in the Medicare program may continue and may affect our operating margins where we participate in Medicare.
Conviction of abusive or fraudulent behavior with respect to one facility or program may subject other facilities and programs under common control or ownership to disqualification from participation in the Medicaid program. Executive Order 12549 prohibits any corporation or facility from participating in federal contracts if it or its principals (included but not limited to officers, directors, owners and key employees) have been debarred, suspended or declared ineligible or have been voluntarily excluded from participating in federal contracts. In addition, some state regulations provide that all facilities licensed with a state under common ownership or control are subject to delicensure if any one or more of such facilities are delicensed.
We must also comply with the standards set forth by the Office of Inspector General (“OIG”) governing internal compliance and external reporting requirements. We regularly review and monitor OIG advisory opinions, although they are often limited in their application to community-based Medicaid providers. Significant legislative, media and public attention has recently focused on health care. Because the law in this area is complex and continuously evolving, ongoing or future governmental investigations or litigation may result in interpretations that are inconsistent with our current practices. It is possible that outside entities could initiate investigations or future litigation impacting our services and that such matters could result in penalties and adverse publicity. It is also possible that our executive and other management personnel could be included in these investigations and litigation or be named defendants.
We are also subject to a large number of employment related laws and regulations, including laws regarding discrimination, wrongful discharge, retaliation, and federal and state wage and hours laws.
The Patient Protection and Affordable Care Act and Health Care and Education Reconciliation Act of 2010, and the rules and regulations thereunder (together, the “Affordable Care Act”), imposed requirements and restrictions, including, but not limited to, guaranteed coverage requirements, prohibitions on some annual and all lifetime limits on amounts paid on behalf of or to our employees, increased restrictions on rescinding coverage, establishment of minimum medical loss ratio
11
requirements, the establishment of state insurance exchanges and essential benefit packages, and greater limitations on product pricing.
A material violation of a law or regulation could subject us to fines and penalties and in some circumstances could disqualify some or all of the facilities and programs under our control from future participation in Medicaid or other government programs. Failure to comply with laws and regulations could have a material adverse effect on our business.
A Compliance Officer (vice president level position) oversees our compliance program and reports to our Chief Legal Officer, a management compliance committee, the board’s quality and risk management committee and the board’s audit committee, as applicable. The program activities are reported regularly to the management compliance committee which includes the Chief Executive Officer, Chief Operating Officer, Chief Financial Officer and Chief Quality Officer, as well as HR, legal and other quality improvement leaders. In addition, the program activities are periodically reported at the board level.
Seasonality
In general, our financial performance is not significantly impacted by fluctuations from seasonality.
Item 1A. | Risk Factors. |
Our business faces a number of risks. The risks described below are items of most concern to us, however these are not all of the risks we face. Additional risks and uncertainties not presently known to us or that we currently consider immaterial may also impact our business operations.
Reductions or changes in Medicaid funding or changes in budgetary priorities by the federal, state and local governments that pay for our services could have a material adverse effect on our revenue and profitability.
We currently derive approximately 89% of our revenue from contracts with state and local governments. These governmental payors fund a significant portion of their payments to us through Medicaid, a joint federal and state health insurance program through which state expenditures are matched by federal funds typically ranging from 50% to approximately 75% of total costs, a number based largely on a state’s per capita income. Our revenue, therefore, is largely determined by the level of federal, state and local governmental spending for the services we provide.
Efforts at the federal level to reduce the federal budget deficit, restructure the Medicaid program, and/or repeal or replace the Patient Protection and Affordable Care Act pose risk for significant reductions in federal Medicaid matching funds to state governments. Such efforts could include proposals to provide states with more flexibility to determine Medicaid benefits, eligibility or provider payments through the use of block grants, per capita caps or streamlined waiver approvals, as well as those that would reduce the amount of federal Medicaid matching funding available to states by curtailing the use of provider taxes or by adjusting the Federal Medical Assistance Percentage (FMAP). Furthermore, any new Medicaid-funded benefits and requirements established by Congress that mandate certain uses for Medicaid funds could have the effect of diverting those funds from the services we provide.
Budgetary pressures, a decline in tax revenue, as well as other economic, industry, and political factors, could cause state governments to limit spending, which could significantly reduce our revenue, referrals, margins and profitability, and adversely affect our growth strategy. Governmental agencies generally condition their contracts with us upon a sufficient budgetary appropriation. If a government agency does not receive an appropriation sufficient to cover its contractual obligations with us, it may terminate a contract or defer or reduce our reimbursement. There is also risk that previously appropriated funds could be reduced through subsequent legislation or that the Federal Government will fail to approve amendments to a waiver plan proposed by a state. In the past, several states in which we operate, including the states of Minnesota, California, Massachusetts, Indiana, Arizona, and West Virginia, where we generate significant revenue have implemented rate reductions, rate freezes and service reductions in response to state budgetary deficits. Delays in payment caused by a state's financial pressures could have a material adverse effect on our cash flows, liquidity and financial condition. Similarly, programmatic changes such as conversions to managed care with related contract demands regarding billing and services, unbundling of services, governmental efforts to increase consumer autonomy and reduce provider oversight, coverage and other changes under state Medicaid plans, may cause unanticipated costs and risks to our service delivery. The loss or reduction of or changes to reimbursement under our contracts could have a material adverse effect on our business, financial condition and operating results.
12
Our variable cost structure is directly related to our labor costs, which may be adversely affected by labor shortages, a deterioration in labor relations, increased unionization activities or mandated wage increases.
Our variable cost structure and operating profitability are directly related to our labor costs. Labor costs may be adversely affected by a variety of factors, including employee turnover, a limited supply of qualified personnel in any geographic area, local competitive forces, ineffective utilization of our labor force, increases in minimum wages or the need to increase wages to remain competitive, health care costs and other personnel costs, and adverse changes in our service models. We typically cannot recover our increased labor costs from payors and must absorb them ourselves. We have incurred higher labor costs in certain markets from time to time because of difficulty in hiring qualified direct support professionals. These higher labor costs have resulted from increased wages and overtime and the costs associated with recruitment and retention, training programs and use of temporary staffing personnel.
Although our employees are generally not unionized, we acquired one business in New Jersey in 2010 that currently has approximately 40 employees who are represented by a labor union. From time to time, we experience attempts to unionize certain of our non-union employees. In June 2018, we lost a union petition to organize approximately 62 employees in Florida. The National Labor Relations Board (“NLRB”) currently has a rule that significantly reduces the maximum number of days to hold a union election and this reduction in the open election period limits the Company’s ability to adequately inform employees regarding the risks associated with unionization. Future unionization activities could result in an increase of our labor and other costs. If any employees covered by a collective bargaining agreement were to engage in a strike, work stoppage or other slowdown, we could experience a disruption of our operations and/or higher ongoing labor costs, which could adversely affect our business, financial condition and results of operations.
We expect increases in payroll expenses as a result of recent policy initiatives to increase the minimum wage. The financial impact of such increases is not expected to be material in most of our states with an increasing minimum wage, and in others we anticipate receiving corresponding rate increases intended to pay for much of or all of the increased expense incurred as a result of the higher minimum wages. However, we cannot assure you that there will not be a material impact from increasing minimum wages in the future.
Our business subjects us to substantial claims, litigation and governmental proceedings.
We are in the health and human services business and, therefore, we have been and continue to be subject to substantial claims alleging that we, our employees or our Mentors failed to provide proper care for an individual we support. We are also subject to claims by the individuals we support, our employees, our Mentors or community members against us for negligence and intentional misconduct, or violation of applicable laws. Included in our recent claims are claims alleging personal injury, assault, abuse, wrongful death, violations of wage and hour laws and other charges. For more information, see “Item 3, Legal Proceedings”.
We are subject to United States federal, state and local employment laws that expose us to potential liability if we are determined to have violated such employment laws. Failure to comply with federal and state labor laws pertaining to minimum wage, overtime pay, meal and rest breaks, unemployment tax rates, workers’ compensation rates, citizenship or residency requirements, and other employment-related matters may have a material adverse effect on our business or operations. In addition, employee claims based on, among other things, discrimination, harassment or wrongful termination may divert financial and management resources and adversely affect operations. We are further subject to the Fair Labor Standards Act (which governs such matters as minimum wages, overtime and other working conditions) as well as state and local wage and hour laws.
There are currently two pending complaints in California state court that allege certain wage and hour violations of California laws and seek to be designated as class-actions. Two additional wage and hour class actions brought in California have been settled and approved by the court.The Company's policy is to accrue for all probable and estimable claims using information available at the time the financial statements are issued. Actual claims could settle in the future at materially different amounts due to the nature of litigation.
A litigation award excluded by, or in excess of, our third-party insurance limits and self-insurance reserves could have a material adverse impact on our operations and cash flow and could adversely impact our ability to continue to purchase appropriate liability insurance. Even if we are successful in our defense, lawsuits or regulatory proceedings could also irreparably damage our reputation.
Regulatory agencies may initiate administrative proceedings alleging that our programs, employees or agents violate statutes and regulations and seek to impose monetary penalties on us or ask for recoupment of amounts paid. We could be required to incur significant costs to respond to regulatory investigations or defend against lawsuits and, if we do not prevail,
13
we could be required to pay substantial amounts of money in damages, settlement amounts or penalties arising from these legal proceedings.
Reductions in reimbursement rates, a failure to obtain increases in reimbursement rates or subsequent negative audit adjustments could adversely affect our revenue, cash flows and profitability.
Our revenue and operating profitability depend on our ability to maintain our existing reimbursement levels and to obtain periodic increases in reimbursement rates to meet higher costs and demand for more services. Approximately 4.9% of our revenue is derived from contracts based on a retrospective cost reimbursement model, whereby we are required to maintain a certain cost structure in order to realize the specified rate. For such programs, if our costs are less than the required amount, we are required to return a portion of the revenue to the payor. Some of our programs are also subject to prospective rate adjustments based on current spending levels. For such programs, we could experience reduced rates in the future if our current spending is not sufficient. If we are not entitled to, do not receive or cannot negotiate increases in reimbursement rates, or are forced to accept a reduction in our reimbursement rates at approximately the same time as our costs of providing services increase, including labor costs and rent, our margins and profitability could be adversely affected.
Changes in how federal and state government agencies operate reimbursement programs can also affect our operating results and financial condition. Some states have, from time to time, revised their rate-setting methodologies in a manner that has resulted in rate decreases. In some instances, changes in rate-setting methodologies have resulted in third-party payors disallowing, in whole or in part, our requests for reimbursement. Any reduction in or the failure to maintain or increase our reimbursement rates could have a material adverse effect on our business, financial condition and results of operations. Changes in the manner in which state agencies interpret program policies and procedures or review and audit billings and costs could also adversely affect our business, financial condition and operating results.
As a result of cost reporting, we have from time to time experienced audit adjustments which are based on subjective judgments of reasonableness, necessity or allocation of costs in our services provided to individuals that we support. These adjustments are generally required to be negotiated as part of the overall audit resolution and may result in paybacks to payors and adjustments of our rates. We cannot assure you that our rates will be maintained or that we will be able to keep all payments made to us, until an audit of the relevant period is complete.
Our information systems are critical to our business and a failure of those systems, or a failure to upgrade them when required, could materially harm us.
We depend on our ability to store, retrieve, process and manage a significant amount of information, and to provide our operations with efficient and effective accounting, census, incident reporting and other quality assurance systems. Our information systems require maintenance and upgrading to meet our needs, which could significantly increase our administrative expenses.
We rely on information technology networks and systems to process, transmit and store electronic information in order to manage or support a variety of our business processes, including consumer records, financial transactions and maintenance of records. These processes may include sensitive financial information, personally identifiable information of individuals we serve and employees, and personal health information protected by HIPPA. Our business and operations may be harmed if we do not securely maintain our business processes and information systems or maintain the integrity of our confidential information. Although we have developed systems and processes that are designed to protect information against security breaches, it is impossible to prevent all security breaches. Failure to protect such information or mitigate any such breaches may adversely affect our operating results. Security breaches, including physical or electronic break-ins, computer viruses, attacks by hackers and similar breaches, can create system disruptions, shutdowns and unauthorized disclosure of confidential information. Any failure to maintain proper function, security and availability of our information systems could interrupt our operations, damage our reputation, subject us to liability claims or regulatory penalties, increase administrative expenses or lead to other adverse consequences.
Any system failure that causes an interruption in service or availability of our critical systems could adversely affect operations or delay the collection of revenues. Even though we have implemented network security measures, our servers are vulnerable to computer viruses, hacking and similar disruptions from unauthorized tampering. The occurrence of any of these events could result in interruptions, delays, the loss or corruption of data, or cessations in the availability of systems, all of which could have a material adverse effect on our financial position and results of operations and harm our business reputation. Furthermore, a loss of health care information could result in potential penalties in certain of our businesses if we fail to comply with privacy and security standards in violation of HIPAA, as amended by the HITECH Act.
14
The performance of our information technology and systems is critical to our business operations. Our information systems are essential to a number of critical areas of our operations, including:
• | accounting and financial reporting; |
• | billing and collecting accounts; |
• | coding and compliance; |
• | clinical systems, including census and incident reporting; |
• | records and document storage; and |
• | monitoring quality of care and collecting data on quality and compliance measures. |
In addition, as we continue to upgrade our systems, we run the risk of ongoing disruptions while we transition from legacy, and often paper-based, systems. Disruptions in our systems could result in delays and difficulties in billing, which could negatively affect our results from operations and cash flows. We may choose systems that ultimately fail to meet our needs, or that cost more to implement and maintain than we had anticipated. Such systems may become obsolete sooner than expected, our payors may require us to invest in other systems, and state and/or federal regulations may impose electronic records standards that we cannot easily address from our existing platform. If we fail to upgrade successfully and cost-effectively, or if we are forced to invest in new or incompatible technology, our financial condition, cash flows and results of operations may suffer.
In late December 2017, we discovered that an unencrypted disk sent to us by a third party software provider was lost in the mail. We conducted an investigation to determine the nature and scope of this incident, the types of information involved and the individuals affected. Based on the results of the investigation, personal identifiable information of approximately 80 individuals was potentially compromised and personal health information of approximately 7,300 individuals across 35 states was potentially compromised. We offered free credit monitoring to the 80 individuals where personal identifiable information was potentially compromised. In accordance with State and Federal Law, we notified the state Attorney General office for the states of California, Indiana, Massachusetts, Maryland, New York and New Jersey and the Office of Health and Human Services. In response to our notification to the Office of Health and Human Services (“HHS”), HHS requested additional information which we have provided. We have notified our cybersecurity insurance provider of the event. As of the date of this filing, we are not aware of any actual or attempted misuse of information as a result of this incident.
We have high turnover among our direct service professionals, particularly in the first year of employment, substantial competition in attracting and retaining experienced personnel, and we may be unable to maintain or grow our business if we cannot attract and retain qualified employees.
Our success depends to a significant degree on our ability to attract and retain qualified and experienced human service and other professionals, who possess the skills and experience necessary to deliver quality services to the individuals we support and manage our operations. We face significant competition for certain categories of our employees, particularly direct service professionals and managers. Contractual requirements and service needs determine the number, as well as the education and experience levels, of health and human service professionals we hire. We have high turnover among our direct service professionals, particularly in their first year of employment. Also, due to the nature of the services we provide, our working conditions require additional sensitivities and skills relative to traditional medical care environments. Our ability to attract and retain employees with the requisite credentials, experience and skills depends on several factors, including, but not limited to, our ability to offer competitive wages, benefits, working conditions and professional growth opportunities. The inability to attract and retain experienced personnel could have a material adverse effect on our business.
Negative publicity or changes in public perception of our services may adversely affect our ability to obtain new contracts and renew existing ones or obtain third-party referrals.
Our success in obtaining new contracts and renewals of our existing contracts depends upon maintaining our reputation as a quality service provider among governmental authorities, advocacy groups, families of individuals we serve, our individuals we serve and the public. Negative publicity, changes in public perception, quality lapses, legal proceedings and government investigations with respect to our operations could damage our reputation and hinder our ability to retain contracts and obtain new contracts, and could reduce referrals, increase government scrutiny and compliance or litigation costs, or generally discourage individuals from choosing us as a provider. Any of these events could have a material adverse effect on our business, financial condition and operating results.
15
Our reputation and prior experience with agency staff, direct support professionals and others in positions to make referrals to us are important for building and maintaining our operations. Any event that harms our reputation or creates negative experiences with such third parties could impact our ability to receive referrals and maintain or grow our base of individuals we serve.
On April 24, 2015, the United States Senate Finance Committee (the “SFC”) sent a letter to the governor of every state requesting information regarding the state’s administration of its foster care system and, in particular, the role of privatized foster care involving both not-for-profit and for-profit agencies. On June 17, 2015, the SFC sent a letter to us requesting extensive information regarding our foster care services. Following the June 17, 2015 letter, we received additional requests for further information regarding our foster care services from the SFC. We cooperated with the SFC’s requests for information. In October 2017, the SFC issued a report. While our organization was a focus of the report, there was no recommendation to take any action against us. The report could engender further negative publicity and other negative actions that may harm us.
Our financial results could be adversely affected if claims against us are successful, to the extent we must make payments under our self-insured retentions, if claims are not covered by our applicable insurance or if the costs of our insurance coverage increase.
We have been and continue to be subject to substantial claims against our professional and general liability and automobile liability insurance. In addition, we have been and continue to be subject to substantial wage and hour claims. Professional and general liability claims, if successful, could result in substantial damage awards which might require us to make significant payments under our self-insured retentions and increase future insurance costs. Commencing October 1, 2015, we have been self-insured for $3.0 million per claim and $28.0 million in the aggregate. We may be subject to increased self-insurance retention limits in the future which could have a negative impact on our results. An award may exceed the limits of any applicable insurance coverage, and awards for punitive damages may be excluded from our insurance policies either contractually or by operation of state law. In addition, our insurance does not cover all potential liabilities including, for example, those arising from employment practice claims, wage and hour violations, and governmental fines and penalties. As a result, we may become responsible for substantial damage awards that are uninsured.
Insurance against professional and general liability and automobile liability can be expensive and our insurance premiums may increase in the future. Insurance rates vary from state to state, by type and by other factors. It is also possible that our liability and other insurance coverage will not continue to be available at acceptable costs or on favorable terms. Rising costs of insurance premiums, and successful claims against us or the unavailability of insurance, could have a material adverse effect on our financial position and results of operations.
If payments for claims exceed actuarially determined estimates, if claims are not covered by insurance, or if our insurers fail to meet their obligations, our results of operations and financial position could be adversely affected.
The nature of services that we provide could subject us to significant workers’ compensation related liability, some of which may not be fully reserved for.
We use a combination of insurance and self-insurance plans to provide for potential liability for workers’ compensation claims. Because we have so many employees, and because of the inherent physical risk associated with the interaction of employees with the individuals we support, many of whom have intensive care needs, the potential for incidents giving rise to workers’ compensation liability is high.
We estimate liabilities associated with workers’ compensation risk and establish reserves each quarter based on internal valuations, third-party actuarial advice, historical loss development factors and other assumptions believed to be reasonable under the circumstances. In prior years, our results of operations have been adversely impacted by higher than anticipated claims, and they may be adversely impacted in the future if actual occurrences and claims exceed our assumptions and historical trends.
The Patient Protection and Affordable Care Act materially reduced the flexibility we had in maintaining our healthcare costs and may make it harder for us to compete as an employer.
The Patient Protection and Affordable Care Act imposed mandates on employers and individuals. Since January 2014, we offer employees health coverage that meets the requirements of the Patient Protection and Affordable Care Act. Uncertainty and speculation regarding the possible repeal of all or a portion of the Patient Protection and Affordable Care Act has continued since the Presidential election in 2016. Depending upon claims experience or enrollment changes in our new plans, or changes to the existing law, our cost for employee health insurance could materially increase. Moreover, if the coverage we are offering
16
isn’t competitive with the health insurance benefits our employees could receive at other employers, we may become less attractive as an employer and it may become more difficult for us to compete for qualified employees.
Economic conditions could have a material adverse effect on our cash flows, liquidity and financial condition.
Our government payors rely on tax revenue to pay for our services. In the wake of the last economic recession that began in 2008, most states faced unprecedented declines in tax revenues and, as a result, record budget gaps. Furthermore, even after nine years of economic improvement, state tax revenue is on average only slightly above prerecession levels, after adjusting for inflation, and only 34 states' revenues have surpassed prerecession levels in inflation adjusted terms. If the economy were to contract into a recession, our government payors or other counterparties that owe us money could be delayed in obtaining, or may not be able to obtain, necessary funding and/or financing to meet their cash flow needs. If the credit rating of the federal government is downgraded, it is possible there will be related downgrades of state credit ratings as well. If this or unrelated state downgrades occur, it could be more expensive for states to finance their cash flow needs and put additional pressure on state budgets. Delays in payment could have a material adverse effect on our cash flows, liquidity and financial condition. In the event that our payors or other counterparties are financially unstable or delay payments to us, our financial condition could be impaired.
State and local government payors with which we have contracts have complicated billing and collection rules and regulations, and if we fail to meet such requirements, our business could be materially impacted.
We derive approximately 89% of our revenue from contracts with state and local government agencies, and a substantial portion of this revenue is state-funded with federal Medicaid matching dollars. In billing for our services to third-party payors, we must follow complex documentation, coding and billing rules and there can be delays before we receive payment. These rules are based on federal and state laws, rules and regulations, various government pronouncements, and on industry practice. If we fail to comply with federal and state documentation, coding and billing rules, we could be subject to criminal and/or civil penalties, loss of licenses and exclusion from the Medicaid programs, which could materially adversely affect us. Specifically, failure to follow these rules could result in potential criminal or civil liability under the False Claims Act and various federal and state criminal healthcare fraud statutes, under which extensive financial penalties and exclusion from participation in federal healthcare programs can be imposed.
Federal false claims laws prohibit any person from knowingly presenting or causing to be presented a false claim for payment to the federal government, or knowingly making or causing to be made a false statement to get a false claim paid. Penalties for a False Claims Act violation include three times the actual damages sustained by the government, plus mandatory civil penalties of between $5,500 and $11,000 for each separate false claim, the potential for exclusion from participation in federal healthcare programs and criminal liability. The majority of states also have statutes or regulations similar to the federal false claims laws, which apply to items and services reimbursed under Medicaid and other state programs, or, in several states, apply regardless of the payor. See “—We are subject to extensive governmental regulations, which require significant compliance expenditures, and a failure to comply with these regulations could adversely affect our business.”
We annually submit a large volume of claims for Medicaid and other payments, and there can be no assurance that there have not been errors. The rules are frequently vague and confusing, our systems are often manual, and we cannot assure that governmental investigators, private insurers, private whistleblowers or Medicaid auditors will not challenge our practices. Such a challenge could result in a material adverse effect on our business.
We are routinely subject to governmental reviews, audits and investigations to verify our compliance with applicable laws and regulations. As a result of these reviews, audits and investigations, these governmental payors may be entitled to, at their discretion:
• | require us to refund amounts we have previously been paid; |
• | terminate or modify our existing contracts; |
• | suspend or prevent us from receiving new contracts or extending existing contracts; |
• | impose referral holds on us; |
• | impose fines, penalties or other sanctions on us; and |
• | reduce the amount we are paid under our existing contracts. |
17
As a result of past reviews and audits of our operations, we have been and are subject to some of these actions from time to time. While we do not currently believe that our existing governmental reviews and audit proceedings will have a material adverse effect on our financial condition or significantly harm our reputation, we cannot assure you that such actions or similar actions in the future will not do so. In addition, such proceedings could have a material adverse impact on our results of operations in a future reporting period. Moreover, if we are required to restructure our billing and collection methods, these changes could be disruptive to our operations and costly to implement.
Complicated billing and collection procedures can result in delays in collecting payment for our services, which may adversely affect our liquidity, cash flows and operating results.
The reimbursement process is time consuming and complex, and there can be delays before we receive payment. Government reimbursement, facility credentialing, Medicaid recipient eligibility, service authorization procedures, and the use of MCOs, are often complicated and burdensome, and delays can result from, among other things, securing documentation and coordinating necessary eligibility paperwork between agencies. Similar issues arise in seeking payment from some of our private payors. These reimbursement and procedural issues occasionally cause us to have to resubmit claims several times and manage other administrative requests before payment is remitted. Missed filing deadlines can cause rejections of claims. If there is a billing error, the process to resolve the error may be time-consuming and costly. To the extent that complexity associated with billing for our services causes delays in our cash collections, we assume the financial risk of increased carrying costs associated with the aging of our accounts receivable as well as increased potential for write-offs. We can provide no assurance that we will be able to collect payment for claims at our current levels in future periods. The risks associated with third-party payors and the inability to monitor and manage accounts receivable successfully could have a material adverse effect on our liquidity, cash flows and operating results.
Failure to comply with requirements to design, implement and maintain effective internal controls could have a material adverse effect on our business.
We are required, pursuant to Section 404 of the Sarbanes-Oxley Act, to furnish a report by management on the effectiveness of our internal control over financial reporting. In addition, our independent registered public accounting firm must report on its evaluation of our internal controls over financial reporting. If we are unable to remedy deficiencies, or if we identify additional deficiencies in the future, we may be unable to conclude that our internal control over financial reporting is effective or obtain an unqualified opinion from our independent registered public accounting firm.
We have a history of losses, and we might not be profitable in the future.
Due in large part to our high levels of indebtedness, prior to fiscal 2015 we have had a history of losses. Although we generated net income of $14.9 million, $6.3 million, and $9.2 million for the years ended September 30, 2018, 2017, and 2016, respectively, and have decreased our interest obligations by repaying all of our senior notes and refinancing our senior secured credit facilities, we could report losses in the future. Other factors may cause us to report losses in the future, including reductions in funding for our services, reductions in reimbursement rates, increases in our costs, increased competition and other factors described elsewhere under this “Item 1A, Risk Factors”.
Our level of indebtedness could adversely affect our liquidity and ability to raise additional capital to fund our operations, and it could limit our ability to invest in our growth initiatives or react to changes in the economy or our industry.
We have a significant amount of indebtedness and substantial leverage. As of September 30, 2018, we had total indebtedness, excluding capital lease obligations, of $700.1 million and an ability to borrow up to an additional $157.1 million under our revolving credit facility. On January 31, 2019, the aggregate revolving commitments under the revolving credit facility will decrease from $160.0 million to $70.0 million. Borrowings under the senior secured credit facilities bear interest at rates that fluctuate with changes in certain short-term prevailing interest rates. If interest rates increase, our debt service obligations on any portion of our variable rate indebtedness that we have not hedged would increase even though the amount borrowed remained the same. We expect to continue to make new investments in our growth that may reduce liquidity, and we may need to increase our indebtedness in the future.
Our substantial degree of leverage could have important consequences, including the following:
• | it may curtail our acquisitions program and may limit our ability to invest in our infrastructure and in growth opportunities; |
18
• | it may diminish our ability to obtain additional debt or equity financing for working capital, capital expenditures, debt service requirements and general corporate or other purposes; |
• | the debt service requirements of our indebtedness could make it more difficult for us to satisfy our indebtedness and contractual and commercial commitments; |
• | a significant portion of our cash flows from operations will be dedicated to the payment of principal and interest on our indebtedness and will not be available for other purposes, including our operations, future business opportunities and acquisitions and capital expenditures; |
• | interest rates on any portion of our variable interest rate borrowings under the senior secured credit facilities that we have not hedged may increase; |
• | it may limit our ability to adjust to changing market conditions and place us at a competitive disadvantage compared to our competitors that have less debt and a lower degree of leverage; and |
• | we may be vulnerable if the country falls into another recession, or if there is a downturn in our business, or we may be unable to carry out activities that are important to our growth. |
Subject to restrictions in the senior credit agreement, we may be able to incur more debt in the future, which may intensify the risks described in this risk factor. All of the borrowings under our senior secured credit facilities are secured by substantially all of the assets of the National Mentor Holdings, Inc. (“NMHI”) and its subsidiaries.
In addition to our significant amount of indebtedness, we have significant rental obligations under our operating leases for our group homes, other service facilities and administrative offices. For the fiscal year ended September 30, 2018 our aggregate rental expense for these leases was $92.9 million. We expect this number will increase during fiscal 2019 as a result of new leases entered into pursuant to acquisitions and new program starts. Our ongoing rental obligations could exacerbate the risks described above.
Our ability to generate sufficient cash flow to fund our debt service, rental payments and other obligations depends on many factors beyond our control. In addition, possible acquisitions or investments in organic growth and other strategic initiatives could require additional debt financing. If our future cash flows do not meet our expectations and we are unable to service our debt, or if we are unable to obtain additional debt financing, we may be forced to take actions such as revising or delaying our strategic plans, reducing or delaying acquisitions, selling assets, restructuring or refinancing our debt, or seeking additional equity capital. We may be unable to effect any of these transactions on satisfactory terms, or at all. Our inability to generate sufficient cash flow to satisfy our debt service obligations, or to obtain additional financing on satisfactory terms, or at all, could have a material adverse effect on our business, financial condition and operating results.
If we fail to establish and maintain relationships with government agencies, we may not be able to successfully procure or retain government-sponsored contracts, which could negatively impact our revenue.
To facilitate our ability to procure or retain government-sponsored contracts, we rely in part on establishing and maintaining relationships with officials of various government agencies, primarily at the state and local level but also including federal agencies. These relationships enable us to maintain and renew existing contracts and obtain new contracts and referrals. The effectiveness of our relationships may be reduced or eliminated with changes in the personnel holding various government offices or staff positions. We also may lose key personnel who have these relationships, and such personnel may not be subject to non-compete or non-solicitation covenants. Any failure to establish, maintain or manage relationships with government and agency personnel may hinder our ability to procure or retain government-sponsored contracts, and could negatively impact our revenue.
A loss of our status as a licensed service provider in any jurisdiction could result in the termination of existing services and our inability to market our services or acquire other services in that jurisdiction.
We operate in numerous jurisdictions and are required to maintain licenses and certifications in order to conduct our operations in each of them. Each state and local government has its own regulations, which can be complicated. Additionally, each of our operating divisions can be regulated differently within a particular jurisdiction. As a result, maintaining the necessary licenses and certifications to conduct our operations is cumbersome. Our licenses and certifications could be suspended, revoked or terminated for a number of reasons, including the:
• | failure by our direct care staff or host-home providers to properly care for individuals; |
19
• | failure to submit proper documentation to the applicable government agency, including documentation supporting reimbursements for costs; |
• | failure by our programs to abide by the applicable laws and regulations relating to the provision of health and human services; and the |
• | failure of our facilities to comply with the applicable building, health and safety codes and ordinances. |
From time to time, some of our licenses or certifications, or those of our employees, are temporarily placed on probationary status or suspended. If we lost our status as a licensed provider of health and human services in any jurisdiction or any other required certification, we would be unable to market our services in that jurisdiction, and the contracts under which we provide services in that jurisdiction would be subject to termination. This includes the possibility of loss or suspension of licenses for an entire state. For instance, in Minnesota a loss or suspension of our license in a particular county may result in the loss or suspension of any license held by one of our affiliates in the state which could preclude us from providing services throughout the entire state. In addition, in providing services in certain jurisdictions, we subcontract to another provider. In those situations, the other provider may hold the license or certification. However, if the other provider’s license or certification were revoked or suspended, we may no longer be permitted to provide services in that jurisdiction. Loss of a license as a direct provider or subcontractor of another provider of health and human services could constitute a violation of provisions of contracts in other jurisdictions, resulting in other contract, license or certification terminations. Any of these events could have a material adverse effect on our financial performance and operations.
We conduct a significant percentage of our operations in Minnesota and, as a result, we are particularly susceptible to any reduction in budget appropriations for our services or any other adverse developments in that state.
For the fiscal years ended September 30, 2018, 2017, and 2016, approximately 16%, 15%, and 15% of our net revenue was derived from contracts with government agencies in the State of Minnesota, respectively. Accordingly, any reduction in Minnesota’s budgetary appropriations for our services, whether as a result of fiscal constraints due to recession, changes in policy or otherwise, could result in a reduction in our revenues and possibly the loss of contracts. In 2018, through the waiver amendment process, CMS questioned whether a series of rate increases were duplicating intended impact and declined to provide federal match funding. Accordingly, effective July 1, 2018, a 7% rate decrease for a portion of the individuals that we serve in the state went into effect. While the state legislature attempted to reverse the cut prior to the effective date, and may attempt to do so again when the state legislature reconvenes in 2019, there is no assurance that the rate cut will be reversed, and we can provide no assurance there will be no additional rate reductions in the future in Minnesota. The concentration of our operations in Minnesota also makes us particularly susceptible to many of the other risks described above occurring in this state, including:
• | the failure to maintain and renew our licenses; |
• | the failure to maintain important relationships with officials of government agencies; and |
• | any negative publicity regarding our operations. |
Any of these adverse developments occurring in Minnesota could result in a reduction in revenue or a loss of contracts, which could have a material adverse effect on our results of operations, financial position and cash flows.
We have increased and will continue to make substantial expenditures to expand existing services, win new business and grow revenue, but we may not realize the anticipated benefits of such increased expenditures.
In order to grow our business, we must capitalize on opportunities to expand existing services and win new business, some of which require spending in advance of revenue. For example, states such as Ohio, California and Pennsylvania are in the process of transitioning individuals with intellectual and developmental disabilities from state-run institutions and other large institutional settings into community-based settings such as ours. Responding to opportunities such as these typically requires significant investment of our resources in advance of revenue.
We spend a significant amount on growth initiatives, especially new starts. These investments have had a negative effect on our operating margin, and we may not realize the anticipated benefits of the spending as soon as we expect to or at any point in the future. If we target the wrong areas, or fail to identify the evolving needs of our payors by responding with service offerings that meet their fiscal and programmatic requirements, we may not realize the anticipated benefits of our investments and the results of our operations may suffer.
20
We may not realize the anticipated benefits of any future acquisitions, and we may experience difficulties in integrating these acquisitions.
As part of our growth strategy, we intend to make acquisitions. Growing our business through acquisitions involves risks because with any acquisition there is the possibility that:
• | the business we acquire may not continue to generate income at the same historical levels on which we based our acquisition decision; |
• | we may be unable to maintain and renew the contracts of the acquired business; |
• | unforeseen difficulties may arise in integrating the acquired operations, including employment practices, information systems and accounting controls; |
• | we may not achieve operating efficiencies, synergies, economies of scale and cost reductions as expected; |
• | we may be required to pay higher purchase prices for acquisitions than we have paid historically; |
• | the goodwill and intangible assets we acquire may not be recoverable, resulting in an impairment charge that would negatively affect our financial results; |
• | management may be distracted from overseeing existing operations by the need to integrate the acquired business; |
• | we may acquire or assume unexpected liabilities or there may be other unanticipated costs; |
• | we may encounter unanticipated regulatory risk; |
• | we may experience problems entering new markets or service lines in which we have limited or no experience; |
• | we may fail to retain and assimilate key employees of the acquired business; |
• | we may finance the acquisition by incurring additional debt and further increase our leverage ratios; and |
• | the culture of the acquired business may not match well with our culture. |
As a result of these risks, there can be no assurance that any future acquisition will be successful or that it will not have a material adverse effect on our financial condition and results of operations.
We are subject to extensive governmental regulations, which require significant compliance expenditures, and a failure to comply with these regulations could adversely affect our business.
We are required to comply with comprehensive government regulation of our business, including statutes, regulations and policies governing the licensing of our facilities, the maintenance and management of our work place for our employees, the quality of our service, the revenue we receive for our services and reimbursement for the cost of our services. Compliance with these laws, regulations and policies is expensive, and if we fail to comply with these laws, regulations and policies, we could lose contracts and the related revenue, thereby harming our financial results. State and federal regulatory agencies have broad discretionary powers over the administration and enforcement of laws and regulations that govern our operations. A material violation of a law or regulation could subject us to fines and penalties and in some circumstances could disqualify some or all of the facilities and programs under our control from future participation in Medicaid or other government programs.
The Health Insurance Portability and Accountability Act of 1996 (“HIPAA”), as amended by the Health Information Technology for Economic and Clinical Health Act (“HITECH Act”) and other federal and state data privacy and security laws govern the collection, dissemination, security, use and confidentiality of patient-identifiable health information. HIPAA and the HITECH Act require us to comply with standards for the use and disclosure of health information within our company and with third parties, including, among other things, the adoption of administrative, physical and technical safeguards to protect such information. Additionally, certain states have adopted comparable privacy and security laws and regulations, some of which may be more stringent than HIPAA. While we have taken steps to comply with applicable health information privacy and security requirements to which we are aware that we are subject to, if we do not comply with existing or new federal or state laws and regulations related to patient health information, we could be subject to criminal or civil sanctions and any resulting liability could adversely affect our operations. The costs of complying with privacy and security related legal and regulatory requirements are burdensome and could have a material adverse effect on our operations.
21
Expenses incurred under governmental agency contracts for any of our services, as well as management contracts with providers of record for such agencies, are subject to review by agencies administering the contracts and services. Representatives of those agencies visit our group homes to verify compliance with state and local regulations governing our service operations. A negative outcome from any of these examinations could increase government scrutiny, increase compliance costs or hinder our ability to obtain or retain contracts. Any of these events could have a material adverse effect on our business, financial condition and operating results.
The federal Anti-Kickback Law and similar state statutes, prohibit the provision of kickbacks, rebates and any other form of remuneration in return for referrals. Any remuneration, direct or indirect, offered, paid, solicited or received, in return for referrals of patients or business for which payment may be made in whole or in part under Medicaid could be considered a violation of law. The Anti-Kickback Law also prohibits payments made to anyone to induce them to recommend purchasing, leasing or ordering any goods, facility, service or item for which payment may be made in whole or in part by Medicaid. Criminal penalties under the Anti-Kickback Law include fines up to $25,000, imprisonment for up to five years, or both. In addition, acts constituting a violation of the Anti-Kickback Law may also lead to civil penalties, such as fines, assessments, exclusion from participation in the Medicaid programs and liability under the False Claims Act.
We are subject to many different and varied audit mechanisms for post-payment review of claims submitted under the Medicaid program. These include Recovery Audit Contractor (“RAC”) auditors, State Medicaid auditors, surveillance integrity review audits and Payment Error Rate Measurement (“PERM”) audits, among others. Any one of these audit activities may identify claims that the auditors deem problematic and, following such determination, auditors may require recoupment of claims by Medicaid to us.
On March 17, 2014, a federal regulation governing home- and community-based services became effective. The rule establishes eligibility requirements for Medicaid home and community-based services provided under the “waiver” program. The waiver program allows the states to furnish an array of home- and community-based services and avoid institutional care. Under the new rule, home- and community-based settings must be integrated in and support full access to the greater community, be selected by the individual from different setting options, ensure individual rights of privacy, and optimize autonomy and independence in making life choices. The rule includes additional requirements for provider-owned or controlled home and community-based residential settings, including that the individual has a lease or other legally enforceable agreement, and standards related to the individual’s privacy, control over schedule and visitors, and physical accessibility of the setting. The rule requires that each state submit a transition plan to the federal government that describes how each state will implement the new regulation. At this juncture seven states and the District of Columbia have received final approval of their Statewide Transition Plans, and it remains unclear how other states will implement this regulation. The rule presents some implementation challenges, as some of the broad requirements may conflict with the needs and/or precautions that we must take for some of the individuals that we serve. It is unclear how each state will seek to address this potential conflict, and the impact and costs of implementation and compliance with this regulation are currently unknown. States have the option to request a variation or delay of compliance with the federal standards for as long as five years from the effective date. Moreover, each state Medicaid agency may interpret and submit different requests and extension timelines.
Any change in interpretations or enforcement of existing or new laws and regulations could subject our current business practices to allegations of impropriety or illegality, or could require us to make changes in our homes, equipment, personnel, services, pricing or capital expenditure programs, which could increase our operating expenses and have a material adverse effect on our operations or reduce the demand for or profitability of our services.
Should we be found out of compliance with these statutes, regulations and policies, depending on the nature of the findings, our business, our financial position and our results of operations could be materially adversely impacted.
Our financial results may suffer if we have to write off goodwill or other intangible assets.
A large portion of our total assets consists of goodwill and other intangible assets. Goodwill and other intangible assets, net of accumulated amortization, accounted for 55.8% and 55.9% of the total assets on our consolidated balance sheets as of September 30, 2018 and 2017, respectively.
We evaluate on a regular basis whether events and circumstances have occurred that indicate that all or a portion of the carrying amount of goodwill or other intangible assets may no longer be recoverable, and is therefore impaired. Under current accounting rules, any determination that impairment has occurred would require us to write-off the impaired portion of our goodwill or the unamortized portion of our intangible assets, resulting in a charge to our earnings. We may not realize the value of our goodwill or other intangible assets and we expect to engage in additional transactions that will result in our recognition of additional goodwill or other intangible assets. During the years ended September 30, 2017 and 2016, we recorded goodwill
22
and indefinite-lived intangible asset impairment charges of $31.0 million and $10.3 million, respectively associated with our ADH businesses. (Refer to Note 7, "Goodwill and Intangible Assets") There were no impairment charges related to goodwill or indefinite lived intangible assets recorded during year ended September 30, 2018.
The high level of competition in our industry could adversely affect our contract and revenue base.
We compete in a highly fragmented industry with a wide variety of competitors, ranging from small, local agencies to a few large, national organizations. Competitive factors may favor other providers and reduce our ability to obtain contracts, which would hinder our growth. Not-for-profit organizations are active in all states and range from small agencies, serving a limited area with specific programs to multi-state organizations. Smaller local organizations may have a better understanding of the local conditions and may be better able to gain political and public acceptance. Not-for-profit providers may be affiliated with advocacy groups, health organizations or religious organizations that have substantial influence with legislators and government agencies. Increased competition may result in pricing pressures, loss of or failure to gain market share or loss of individuals we serve or payors, any of which could harm our business.
Home and community-based human services may become less popular among our targeted populations and/or state and local governments, which would adversely affect our results of operations.
Our growth depends on the continuation of trends in our industry toward providing services to individuals in smaller, community-based settings and increasing the percentage of individuals served by non-governmental providers. For example, while demand for foster care services has been increasing for the last several years, during the course of much of the prior decade, state governments increasingly adopted policies that emphasized greater family preservation and family reunification for at-risk youth, which reduced the demand for foster care services, caused us to adapt our service offerings and contributed to our decision to divest CFS operations in six states. Shifts in public policy and, therefore, our future success, are subject to a variety of political, economic, social and legal pressures, all of which are beyond our control. A reversal in the downsizing and privatization trends could reduce the demand for our services, which could adversely affect our revenue and profitability.
Covenants in our senior credit agreement impose several restrictions on our business.
The senior credit agreement contains various covenants that limit our ability to, among other things:
• | incur additional debt or issue certain preferred shares; |
• | pay dividends on or make distributions in respect of capital stock or make other restricted payments; |
• | make certain investments; |
• | sell certain assets; |
• | create liens on certain assets to secure debt; |
• | enter into agreements that restrict dividends from subsidiaries; |
• | consolidate, merge, sell or otherwise dispose of all or substantially all of our assets; and |
• | enter into certain transactions with our affiliates. |
The senior credit agreement governing the senior secured credit facilities also requires us to maintain a specified financial ratio in the event that we draw greater than 30% of the revolving commitment under our senior revolver. Our ability to meet this financial ratio could be affected by events beyond our control. The breach of any of these covenants or financial ratio could result in a default under the senior secured credit facilities and our lenders could elect to declare all amounts borrowed thereunder, together with accrued interest, to be due and payable and could proceed against the collateral securing that indebtedness.
If we are not successful in expanding into adjacent markets, our growth strategy could suffer.
Our growth strategy depends on pursuing opportunities in adjacent markets, and we may not be successful in adapting our service models to markets or service lines in which we have little or no prior experience. We recently expanded into the ADH services market. In the ADH services market, competition for elders to serve can sometimes be intense and employees may leave and compete. In the future, we may explore other adjacent markets, such as services to youth with autism and individuals with mental health issues, which would expose us to additional operational, regulatory and legal risks. Serving other populations may require compliance with additional federal and state laws and regulations which may differ from the laws and regulations that apply to the populations we currently serve. Compliance with new laws and regulations may result in
23
unanticipated expenses or liabilities. Programs we open in adjacent markets may also take longer to reach expected revenue and profit levels on a consistent basis and may have higher occupancy or operating costs than programs in our existing markets, which may affect our overall profitability. Adjacent markets may have different payors, referral sources, staffing requirements, individual preferences and competitive conditions. We may find it more difficult to hire, motivate and keep qualified direct care workers and other employees in these adjacent markets. We may need to augment our staffing to meet regulatory requirements, and the overall cost of labor may be higher. As a result, we may not be successful in diversifying the populations we serve, and we may fail to capture market share in adjacent markets. If any steps taken to expand our existing business into adjacent markets are unsuccessful, we may not be able to achieve our growth strategy and our business, financial condition or results of operations could be adversely affected.
Our success depends on our ability to manage and integrate key administrative functions.
Our operations and administrative functions are largely decentralized and subject to disparate accounting and billing requirements established and often modified by our local payors and referral sources. Although in recent years we have undertaken an effort to consolidate accounting, billing, cash collections and other financial and administrative functions which may have mitigated this risk to some degree, there remains a substantial portion of the business that has not yet been centralized and some risk in the centralization process itself. If we encounter difficulties in integrating our operations further or implementing our cost saving measures or fail to effectively manage these functions to ensure compliance with disparate and evolving requirements imposed by our payors and referral sources, it could have a material adverse effect on our results of operations, financial position and cash flows.
We may be more susceptible to the effects of a natural disaster or public health catastrophe, compared with other businesses due to the vulnerable nature of our population.
Our primary population served includes individuals with developmental disabilities, brain injuries, or emotionally, behaviorally and/or medically complex challenges, many of whom would be more vulnerable than the general public in a natural disaster or public health catastrophe. In a natural disaster, we could be forced to relocate some of our individuals we serve on short notice under dangerous conditions and our new program starts and acquisitions could experience delays. Accordingly, natural disasters and certain public health catastrophes could have a material adverse effect on our financial condition and results of operations.
We are classified as a “controlled company” and, as a result, we qualify for, and rely upon, certain exemptions from certain corporate governance requirements. You will not have the same protections afforded to stockholders of companies that are subject to such requirements.
We are a “controlled company” within the meaning of the New York Stock Exchange corporate governance standards. Under the rules of the New York Stock Exchange, a company of which more than 50% of the outstanding voting power is held by an individual, group or another company is a “controlled company” and may elect not to comply with certain stock
exchange corporate governance requirements, including the requirements that:
• | a majority of the Board of Directors consist of independent directors; |
• | nominating and corporate governance matters be decided solely by independent directors; and |
• | employee and officer compensation matters be decided solely by independent directors. |
Although as of September 30, 2018, we ceased relying upon the exemptions listed above, we may rely on them in the future if we continue to qualify as a "controlled company." Accordingly, you may not have the same protections afforded to stockholders of companies that are subject to all of the stock exchange corporate governance requirements.
Our stock price may be volatile or may decline regardless of our operating performance, and you may not be able to resell your shares at or above your purchase price.
The market price for our common stock has been and may be volatile. You may not be able to resell your shares at or above the price you paid, due to fluctuations in the market price of our common stock, which may be caused by a number of factors, many of which we cannot control including the following:
• | changes in financial estimates by any securities analysts who follow our common stock, our failure to meet these estimates or failure of those analysts to initiate or maintain coverage of our common stock; |
24
• | downgrades by any securities analysts who follow our common stock; |
• | future sales of our common stock by our officers, directors and significant stockholders; |
• | market conditions or trends in our industry or the economy as a whole and, in particular, in the healthcare environment; |
• | investors’ perceptions of our prospects; |
• | announcements by us of significant contracts, acquisitions, joint ventures or capital commitments; and |
• | changes in key personnel. |
In addition, the stock markets have experienced extreme price and volume fluctuations that have affected and continue to affect the market prices of equity securities of many companies, including companies in the healthcare industry. In the past, stockholders have instituted securities class action litigation following periods of market volatility. If we were involved in securities litigation, we could incur substantial costs, and our resources and the attention of management could be diverted from our business.
Our equity sponsor has the ability to control significant corporate activities and our majority stockholder’s interests may not coincide with yours.
Vestar owns approximately 54% of our common stock. As a result, Vestar has the ability to control the outcome of matters submitted to a vote of stockholders. In addition, under the director nominating agreement that we entered into in connection with our IPO (the “Nominating Agreement”), affiliates of Vestar will have the right to nominate directors for election to our Board of Directors, and we will agree to support those nominees. Under certain circumstances, those nominees could constitute a majority of our Board of Directors even though affiliates of Vestar at the time owns less than a majority of our common stock, giving Vestar decision-making control over us. Matters over which Vestar may, directly or indirectly, exercise control include:
• | the election of our Board of Directors and the appointment and removal of our officers; |
• | mergers and other business combination transactions, including proposed transactions that would result in our stockholders receiving a premium price for their shares; |
• | other material acquisitions or dispositions of businesses or assets; |
• | incurrence of indebtedness and the issuance of equity securities; |
• | repurchase of stock and payment of dividends; and |
• | the issuance of shares to management under our equity incentive plans. |
Even if Vestar’s ownership of our shares falls below a majority, Vestar may continue to be able to influence or effectively control our decisions. Under our amended and restated certificate of incorporation, Vestar and its affiliates will not have any obligation to present to us, and Vestar may separately pursue, corporate opportunities of which they become aware, even if those opportunities are ones that we would have pursued if granted the opportunity.
Future sales of our common stock, or the perception in the public markets that these sales may occur, may depress our stock price.
Sales of substantial amounts of our common stock in the public market, or the perception that these sales could occur, could adversely affect the price of our common stock and could impair our ability to raise capital through the sale of additional shares. As of September 30, 2018, we had 36,116,252 shares of common stock outstanding and 350,000,000 shares of common stock authorized under our amended and restated certificate of incorporation.
On October 1, 2015, NMH Investment distributed all of the shares of our common stock held by it to its existing members in accordance with their respective membership interests (the “Distribution”). These former members of NMH Investment, which include Vestar and certain of our officers and directors, may sell the shares they received in the Distribution that they continue to hold under Rule 144 under the Securities Act, subject to the volume limits and other requirements of Rule 144 applicable to affiliates, or in future public offerings.
25
As of September 30, 2018, holders of an aggregate of approximately 20.3 million shares of our common stock (including Vestar and certain of our directors and executive officers) had the right, subject to certain conditions, to require us to register shares of our common stock pursuant to the terms of a registration rights agreement between us and the holders of those shares. We have also registered the shares of common stock issuable upon the exercise of stock options and RSUs granted under our 2014 omnibus incentive plan on a registration statement on Form S-8.
Members of our management have in the past and may in the future enter into Rule 10b5-1 trading plans pursuant to which they may sell shares of our common stock into the open market.
In the future, we may also issue our securities in connection with acquisitions or investments. The amount of shares of our common stock issued in connection with an acquisition or investment could constitute a material portion of our then-outstanding shares of our common stock. We cannot predict the size of future sales or issuances of our common stock or the effect, if any, that future sales or issuances of our common stock will have on the market price of our common stock.
If securities or industry analysts do not publish research or publish inaccurate or unfavorable research about our business, our stock price and trading volume could decline.
The trading market for our common stock depends in part on the research and reports that securities or industry analysts publish about us or our business. If one or more of the analysts who covers us downgrades our common stock or publishes inaccurate or unfavorable research about our business, our stock price would likely decline. If one or more of these analysts ceases coverage of us or fails to publish reports on us regularly, demand for our common stock could decrease, which could cause our stock price and trading volume to decline.
Because we do not intend to pay cash dividends in the foreseeable future, you may not receive any return on investment unless you are able to sell your common stock for a price greater than your purchase price.
The continued operation and expansion of our business will require substantial funding. Accordingly, we
do not anticipate that we will pay any cash dividends on shares of our common stock for the foreseeable future. Any determination to pay dividends in the future will be at the discretion of our Board of Directors and will depend upon results of operations, financial condition, contractual restrictions, including those under our senior secured credit facilities, any potential indebtedness we may incur, restrictions imposed by applicable law and other factors our Board of Directors deems relevant. Accordingly, if you purchase shares, realization of a gain on your investment will depend on the appreciation of the price of our common stock, which may never occur. Investors seeking cash dividends in the foreseeable future should not purchase our common stock.
We are a holding company and rely on dividends, distributions and other payments, advances and transfers of funds from our subsidiaries to meet our obligations.
We are a holding company that does not conduct any business operations of our own. As a result, we are largely dependent upon cash dividends and distributions and other transfers from our subsidiaries to meet our obligations. The deterioration of income from, or other available assets of, our subsidiaries for any reason could limit or impair their ability to pay dividends or other distributions to us.
26
Item 1B. | Unresolved Staff Comments |
We have not received written comments from the Securities and Exchange Commission that remain unresolved.
Item 2. | Properties |
Our principal executive office is located at 313 Congress Street, Boston, Massachusetts 02210. We operate a number of facilities and administrative offices throughout the United States. As of September 30, 2018, we provided services in 355 owned facilities and 1,862 leased facilities, as well as in homes owned by our Mentors. We also own 4 offices and lease 201 offices. We believe that our properties are adequate for our business as presently conducted and we believe we can meet requirements for additional space by exercising options on leases or by finding alternative space.
Item 3. | Legal Proceedings |
We are in the health and human services business and, therefore, we have been and continue to be subject to substantial claims alleging that we, our employees or our Mentors failed to provide proper care for an individual that we support. We are also subject to claims by individuals we support, our employees, our Mentors or community members against us for negligence, intentional misconduct or violation of applicable laws. Included in our recent claims are claims alleging personal injury, assault, abuse, wrongful death, violations of wage and hour laws and other charges. Regulatory agencies may initiate administrative proceedings alleging that our programs, employees or agents violate statutes and regulations and seek to impose monetary penalties on us. We could be required to incur significant costs to respond to regulatory investigations or defend against civil lawsuits and, if we do not prevail, we could be required to pay substantial amounts of money in damages, settlement amounts or penalties arising from these legal proceedings.
We also are subject to potential lawsuits under the False Claims Act and other federal and state whistleblower statutes designed to combat fraud and abuse in the health care industry. These lawsuits can involve significant monetary awards that may incentivize private plaintiffs to bring these suits. If we are found to have violated the False Claims Act, we could be excluded from participation in Medicaid and other federal healthcare programs which would have a material adverse effect on our business. The Patient Protection and Affordable Care Act provides a mandate for more vigorous and widespread enforcement activity to combat fraud and abuse in the health care industry.
Finally, we are also subject to employee-related claims under state and federal law, including claims for wage and hour violations under the Fair Labor Standards Act or state wage and hour laws and claims for discrimination, wrongful discharge or retaliation. The Company currently has two pending complaints in California state court that allege certain wage and hour violations of California labor laws and seek to be designated as class-actions. Two additional wage and hour class actions have been settled and approved by the court.
We reserve for costs related to contingencies when a loss is probable and the amount is reasonably estimable. While we believe our provision for legal contingencies is adequate, the outcome of our legal proceedings is difficult to predict, and we may settle legal claims or be subject to judgments for amounts that differ materially from our estimates. In addition, legal contingencies could have a material adverse impact on our results of operations in any given future reporting period.
See “Part I. Item 1A. Risk Factors” and “Part II. Item 7. Management’s Discussion and Analysis of Financial Condition and Results of Operations” and "Notes to Consolidated Financial Statements. Note 17. Other Commitments and Contingencies" for additional information.
Item 4. | Mine Safety Disclosures |
Not applicable.
27
PART II
Item 5. | Market for Registrant’s Common Equity, Related Stockholder Matters and Issuer Purchases of Equity Securities |
Market Information
Our common stock trades on the NYSE under the symbol “CIVI”.
Stockholders
On November 30, 2018, there were 36,116,252 shares of our common stock outstanding, held by 13 stockholders of record, one of which was Cede & Co., which is the nominee of shares held through The Depository Trust Company. The number of beneficial owners is substantially greater than the number of owners of record because a significant portion of our common stock is held through brokerage firms.
Stock Performance Graph
The graph below compares the cumulative total stockholder return on our common stock from September 17, 2014 through September 30, 2018 with the cumulative total return of the Russell 2000 Healthcare Services Index and the NYSE Composite. This graph assumes an investment of $100.00 in our common stock and in each of the indexes on September 17, 2014 and its relative performance is tracked through September 30, 2018. We paid no dividends on our common stock during the period covered by the graph. Measurement points are September 17, 2014 and the last trading day of each subsequent month end through September 30, 2018.
The comparisons shown in the graph below are based upon historical data. We caution that the stock price performance shown in the graph below is not necessarily indicative of, nor is it intended to forecast, the potential future performance of our common stock.
This graph is not deemed to be “filed” with the SEC or subject to the liabilities of Section 18 of the Exchange Act, and the graph shall not be deemed to be incorporated by reference into any prior or subsequent filing by Civitas under the Securities Act or the Exchange Act.
28
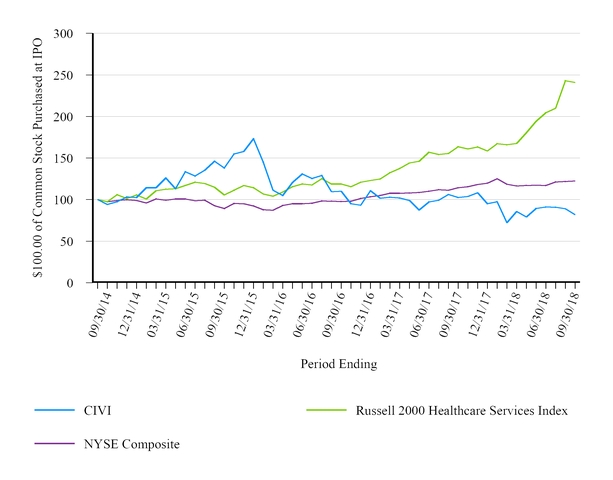
Dividends
We did not pay any cash dividends during fiscal 2018 or fiscal 2017. We do not anticipate paying any cash dividends in the foreseeable future. Our ability to pay dividends on our common stock is limited by restrictions on the ability of our subsidiaries and us to pay dividends or make distributions under the terms of NMHI’s current and any future agreements governing our indebtedness. Any future determination to pay dividends will be at the discretion of our Board of Directors, subject to compliance with covenants in NMHI’s current and any future agreements governing our indebtedness, and will depend upon our results of operations, financial condition, capital requirements and other factors that our Board of Directors deems relevant.
In addition, since we are a holding company, substantially all of the assets shown on our consolidated balance sheet are held by our subsidiaries. Accordingly, our earnings, cash flow and ability to pay dividends are largely dependent upon the earnings and cash flows of our subsidiaries and the distribution or other payment of such earnings to us in the form of dividends.
29
Repurchases of Equity Securities
The following table provides information about purchases we made during the three months ended September 30, 2018 of equity securities that are registered by us pursuant to Section 12 of the Exchange Act:
Total Number of Shares Purchased (1) | Weighted Average Price Paid per Share (2) | Total Number of Shares Purchased as Part of Publicly Announced Program (3) | Approximate Dollar Value of Shares that May Yet Be Purchased Under the Program (in thousands) | ||||||||||
7/1/2018 - 7/31/2018 | 84,568 | $ | 16.26 | 84,568 | $ | 3,954 | |||||||
8/1/2018 - 8/31/2018 | 34,325 | $ | 16.35 | 34,325 | $ | — | |||||||
9/1/2018 - 9/30/2018 | 3,077 | $ | 14.57 | 0 | $ | — | |||||||
(1) Our employees surrendered an aggregate of 3,077 shares to us in satisfaction of minimum tax withholding obligations associated with the vesting of restricted stock units during the three months ended September 30, 2018.
(2) The weighted average price paid per share of common stock does not include the cost of commissions.
(3) On February 8, 2018, we announced that our Board of Directors approved a stock repurchase program under which we were authorized to repurchase up to $25.0 million of the Company’s outstanding common stock from time to time in the open market, through negotiated transactions or otherwise (including, without limitation, the use of Rule 10b5-1 plans). We conducted any open market stock repurchase activities in compliance with the safe harbor provisions of Rule 10b-18 of the Exchange Act. During the fourth quarter of fiscal 2018, we repurchased and retired 118,893 shares for $1.9 million under the program, which was implemented through a 10b5-1 plan. The stock repurchase program expired on August 12, 2018, and we do not have authorization to repurchase any additional common stock under the program.
Unregistered Sales of Equity Securities
No unregistered equity securities of the Company were sold during fiscal 2018.
30
Item 6. | Selected Financial Data |
We derived the selected consolidated financial data below from the consolidated financial statements of the Company and the related notes included elsewhere in this Annual Report on Form 10-K and from the consolidated financial statements and the related notes included in previous Annual Reports on Form 10-K that we filed with the SEC.
The selected information below should be read in conjunction with “Management’s Discussion and Analysis of Financial Condition and Results of Operations” and the consolidated financial statements and notes included elsewhere in this report.
Year Ended September 30, | |||||||||||||||||||
2018 | 2017 | 2016 | 2015 | 2014 | |||||||||||||||
(Amounts in thousands, except share and per share amounts) | |||||||||||||||||||
Statements of Operations Data: | |||||||||||||||||||
Net revenue | $ | 1,602,202 | $ | 1,474,510 | $ | 1,407,587 | $ | 1,366,946 | $ | 1,255,838 | |||||||||
Cost of revenue | 1,280,608 | 1,160,528 | 1,092,181 | 1,059,364 | 983,043 | ||||||||||||||
Operating expenses: | |||||||||||||||||||
General and administrative expenses | 171,803 | 166,376 | 174,398 | 162,839 | 145,041 | ||||||||||||||
Goodwill and intangible impairment | — | 31,002 | 10,251 | 10,660 | — | ||||||||||||||
Depreciation and amortization | 95,421 | 75,713 | 73,061 | 71,512 | 67,488 | ||||||||||||||
Total operating expense | 267,224 | 273,091 | 257,710 | 245,011 | 212,529 | ||||||||||||||
Income from operations | 54,370 | 40,891 | 57,696 | 62,571 | 60,266 | ||||||||||||||
Other income (expense): | |||||||||||||||||||
Management fee of related party | — | — | — | 28 | (9,488 | ) | |||||||||||||
Other income (expense), net | (1,296 | ) | 710 | (908 | ) | (1,325 | ) | 374 | |||||||||||
Extinguishment of debt | — | — | — | (17,058 | ) | (14,699 | ) | ||||||||||||
Interest expense | (38,792 | ) | (33,406 | ) | (34,041 | ) | (37,455 | ) | (69,349 | ) | |||||||||
Income (loss) from continuing operations before income taxes | 14,282 | 8,195 | 22,747 | 6,761 | (32,896 | ) | |||||||||||||
Provision (benefit) for income taxes | (604 | ) | 1,864 | 13,290 | 2,689 | (11,463 | ) | ||||||||||||
Income (loss) from continuing operations | 14,886 | 6,331 | 9,457 | 4,072 | (21,433 | ) | |||||||||||||
Loss from discontinued operations, net of tax | — | — | (270 | ) | (1,000 | ) | (1,382 | ) | |||||||||||
Net income (loss) | $ | 14,886 | $ | 6,331 | $ | 9,187 | $ | 3,072 | $ | (22,815 | ) | ||||||||
Income (loss) per common share, basic and diluted | |||||||||||||||||||
Income (loss) from continuing operations | $ | 0.40 | $ | 0.17 | $ | 0.25 | $ | 0.11 | $ | (0.84 | ) | ||||||||
Loss from discontinued operations | — | — | — | (0.03 | ) | (0.05 | ) | ||||||||||||
Net income (loss) | $ | 0.40 | $ | 0.17 | $ | 0.25 | $ | 0.08 | $ | (0.89 | ) | ||||||||
Weighted average number of common shares outstanding, basic | 36,811,208 | 37,302,941 | 37,112,794 | 36,959,997 | 25,538,493 | ||||||||||||||
Weighted average number of common shares outstanding, diluted | 36,945,408 | 37,466,325 | 37,262,915 | 37,088,632 | 25,538,493 | ||||||||||||||
Balance Sheet Data (at end of period): | |||||||||||||||||||
Cash and cash equivalents | $ | 8,168 | $ | 7,297 | $ | 50,683 | $ | 41,690 | $ | 196,147 | |||||||||
Working capital (1) | 39,786 | 30,740 | 59,341 | 40,502 | 31,379 | ||||||||||||||
Total assets | 1,127,192 | 1,049,382 | 1,068,145 | 1,036,089 | 999,768 | ||||||||||||||
Total debt (2) | 711,753 | 637,488 | 644,591 | 651,643 | 815,509 | ||||||||||||||
Stockholders’ equity | 166,734 | 162,917 | 145,590 | 121,275 | 115,538 | ||||||||||||||
(1) | Calculated as current assets minus current liabilities. |
(2) | Includes obligations under capital leases. |
31
Item 7. | Management’s Discussion and Analysis of Financial Condition and Results of Operations |
The following discussion of our financial condition and results of operations should be read in conjunction with the historical consolidated financial statements and the related notes included elsewhere in this report. This discussion may contain forward-looking statements about our markets, the demand for our services and our future results. We based these statements on assumptions that we consider reasonable. Actual results may differ materially from those suggested by our forward-looking statements for various reasons, including those discussed in the “Risk Factors” and “Forward-Looking Statements” sections of this report.
Overview
We are the leading national provider of home- and community-based health and human services to must-serve individuals with intellectual, developmental, physical or behavioral disabilities and other special needs. Since our founding in 1980, we have been a pioneer in the movement to provide home- and community-based services for people who would otherwise be institutionalized. During our more than 38-year history, we have evolved from a single residential program serving at-risk youth to a diversified national network providing an array of high-quality services and care in large, growing and highly-fragmented markets. While we have the capabilities to serve individuals with a wide variety of special needs and disabilities, we currently provide our services to individuals with intellectual and/or developmental disabilities ("I/DD"), individuals with catastrophic injuries and illnesses, particularly acquired brain injury ("ABI"), youth with emotional, behavioral and/or medically complex challenges, and elders in need of day health services to support their independence. As of September 30, 2018, we operated in 36 states, serving approximately 12,700 individuals in residential settings and more than 19,000 individuals in non-residential settings. We have a diverse group of hundreds of public payors which fund our services with a combination of federal, state and local funding, as well as an increasing number of non-public payors related to our services for ABI and other catastrophic injuries and illnesses.
We operate our business in four operating divisions, Community Support Services ("CSS"), Specialty Rehabilitation Services ("SRS"), Children & Family Services ("CFS") and Adult Day Health ("ADH"). As of October 1, 2018, Community Support Services and Children & Family Services are new names for the operating divisions formerly named I/DD and ARY, respectively. The segments have been organized by service line.
Our CSS segment is the largest portion of our business. Through the CSS segment, we provide home- and community-based human services to adults and children with intellectual and developmental disabilities. Our CSS programs include residential support, day habilitation, vocational services, case management, crisis intervention and hourly support care.
Through the SRS segment, which is our second largest segment, we deliver services to individuals who have suffered acquired brain injury, spinal injuries and other catastrophic injuries and illnesses. Our SRS segment is primarily focused on providing behavioral therapies to individuals with brain injuries in post-acute community settings and more medically-intensive post-acute care services. Our SRS services range from sub-acute healthcare for individuals with intensive medical needs to day treatment programs, and include, neurorehabilitation, neurobehavioral rehabilitation, specialized nursing, physical, occupational and speech therapies, supported living, outpatient treatment and pre-vocational services.
Through the CFS segment we provide home- and community-based human services to youth with emotional, behavioral and/or medically complex challenges. Our CFS programs include therapeutic foster care, family preservation, adoption services, early intervention, school-based services and juvenile offender programs.
Our newest operating segment, ADH, delivers elder services including case management, nursing oversight, medication management, nutrition, daily living assistance, therapeutic services and transportation. The results of our ADH operating segment are included within Corporate and Other because ADH does not meet the thresholds for separate reporting.
Factors Affecting our Operating Results
Demand for Home and Community-Based Health and Human Services
Our growth in revenue has historically come from increases in the number of individuals served, as well as increases in the rates we receive for our services. This growth has depended largely upon development-driven activities, including the maintenance and expansion of existing contracts and the award of new contracts, our new start program and acquisitions. We also attribute the long-term growth in our base of individuals served to certain trends that are increasing demand in our industry, including demographic, health-care and political developments.
32
Demographic trends have had a particular impact on our CSS business. Increases in the life expectancy of individuals with I/DD, we believe, have resulted in steady increases in the demand and length of stay for CSS services. In addition, family members currently caring for their relatives at home are aging and many may soon be unable to continue with these responsibilities. Many states continue to downsize or close large, publicly-run facilities for individuals with I/DD and refer those individuals to private providers of community-based services. Each of these factors affects the size of the I/DD population in need of services. Demand for our SRS services has also grown as emergency response and improved medical techniques have resulted in more people surviving a catastrophic injury. SRS services are increasingly sought out as a clinically-appropriate and less-expensive alternative to institutional care and as a “step-down” for individuals who no longer require care in acute settings.
Political and economic trends can also affect our operations. Reductions or changes in Medicaid funding or changes in budgetary priorities by the federal, state and local governments that pay for our services could have a material adverse effect on our revenue and profitability. Recent efforts at the federal level to reduce the federal budget deficit, repeal and/or replace the Patient Protection and Affordable Care Act and/or restructure the Medicaid program pose risk for significant reductions in federal Medicaid matching funds to state governments. In addition, budgetary pressures facing state governments, especially within Medicaid programs, as well as other economic, industry and political factors could cause state governments to limit spending, which could significantly reduce our revenue, referrals, margins and profitability, and adversely affect our growth strategy. Government agencies generally condition their contracts with us upon a sufficient budgetary appropriation. If the government agency does not receive an appropriation sufficient to cover its obligations with us, it may terminate a contract or defer or reduce our reimbursements. In the past, certain states in which we operate, including Minnesota, California, Massachusetts, Indiana, Arizona, and West Virginia, where we generate significant revenue, have implemented rate reductions, rate freezes and service reductions, in response to state budgetary deficits. While we are currently managing through a small number of rate decreases, we expect the overall rate environment to continue to remain stable in 2019.
Beginning in 2015, West Virginia implemented a redesign of its I/DD Waiver Program. This redesign resulted in a reduction in our West Virginia operations in fiscal 2017 and 2016, totaling decreases of $20.7 million in net revenue and $6.3 million in income from operations. While the direct impact of the redesign was largely behind us entering fiscal 2018, during the year ended September 30, 2018 our West Virginia operations contracted further, mainly as a result of a very challenging labor environment. During the period, West Virginia net revenue and income from operations decreased by $6.8 million and $2.5 million, respectively. Notably, the state’s fiscal condition has continued to improve and the state recently announced that effective January 1, 2019 providers of I/DD Waiver services will receive a 5% rate increase for services billed.
Historically, our business has benefited from the trend toward privatization and the efforts of groups that advocate for the populations we serve. These groups lobby governments to fund residential services that use our small group home or host home models, rather than large, institutional models. Furthermore, we believe that successful lobbying by advocacy groups has preserved CSS and CFS services and, therefore, our revenue base for these services, from significant reductions as compared with certain other human services, although in the past certain states have imposed rate reductions, rate freezes, and service reductions in response to state budgetary pressures. In addition, a number of states have developed community-based waiver programs to support long-term services for survivors of a traumatic brain injury. However, the majority of our specialty rehabilitation services revenue is derived from non-public payors, such as commercial insurers, managed care and other private payors.
Expansion of Services
We have grown our business through expansion of existing markets and programs, entry into new geographical markets, as well as through acquisitions.
Organic Growth
Various economic, fiscal, public policy and legal factors are contributing to an environment with a number of organic growth opportunities, particularly within the CSS and SRS segments, and, as a result, we have a continued emphasis on growing our business organically and making investments to support the effort. Our future growth will depend heavily on our ability to expand our current programs and identify and execute upon new opportunities. Our organic expansion activities consist of both new program starts in existing markets and expansion into new geographical markets. Our new programs in new and existing geographic markets typically require us to incur and fund operating losses for a period of approximately 18 to 24 months (we refer to these new programs as “new starts”). Net operating loss or income of a new start is defined as its revenue for the period less direct expenses but not including allocated overhead costs. The aggregation of all programs with net operating losses that are less than 18 months old comprise the new start operating loss and the aggregation of all programs with net operating income that are less than 18 months old comprise the new start operating income for such period. During fiscal
33
years 2018, 2017, and 2016 new starts generated operating losses of $6.2 million, $5.6 million, and $7.4 million, respectively, and operating income of $2.7 million, $4.9 million and $3.7 million respectively.
Acquisitions
From the beginning of fiscal 2014 through September 30, 2018, we have completed 55 acquisitions, including several acquisitions of small providers, which we have integrated with our existing operations. Acquisitions could have a material impact on our consolidated financial statements.
During the fiscal year ended September 30, 2018, we acquired the assets or equity interests of eleven companies for total consideration of $99.8 million, net of $0.8 million of cash acquired and including $1.8 million of contingent consideration.
During the fiscal year ended September 30, 2017, we acquired the assets or equity interests of eleven companies for total consideration of $82.1 million, net of $0.5 million of cash acquired.
During the fiscal year ended September 30, 2016, we acquired the assets of twelve companies for total consideration of $45.2 million.
Divestitures
We regularly review and consider the divestiture of underperforming or non-strategic businesses to improve our operating results and better utilize our capital. We have made divestitures from time to time and expect that we may make additional divestitures in the future. Divestitures could have a material impact on our consolidated financial statements.
Beginning in the second quarter of fiscal 2018, as part of a larger, multi-year, multi-pronged effort to improve the efficiency of our operations and mitigate margin erosion created by increasing labor and healthcare costs, we recently raised the program performance standard and commenced a comprehensive, top-to-bottom examination of each program’s performance across all of our operating divisions. As a result of this initiative, we decided to close and/or consolidate 58 programs during fiscal 2018 primarily within our SRS and CSS operating divisions (the “Program Closures”). During the year ended September 30, 2018, we incurred exit costs associated with these closures of $10.7 million, including $10.0 million in lease termination costs, and $0.7 million in severance. In addition, we recorded $6.1 million of accelerated amortization related to definite-lived intangible assets and a $1.2 million loss on the disposition of fixed assets associated with these locations. These closures are expected to eliminate losses of $1.8 million annually. The comprehensive examination was completed during the fourth quarter of fiscal 2018 and there will no additional closures associated with this review.
During fiscal 2015, we decided to discontinue CFS services in the states of Illinois, Florida, Louisiana, Indiana, North Carolina and Texas ("CFS Divestitures"). In connection with these divestitures we recorded impairment charges for intangible assets of $10.4 million in fiscal 2015, exit costs of $2.0 million and a loss on sale of $1.3 million during the first two quarters of fiscal 2016. It was determined that this disposal group did not meet the criteria to be presented as discontinued operations and, as a result, the operating results are included within continuing operating results in the Consolidated Statement of Income. During fiscal 2016 and 2015, these businesses had net revenue of $7.1 million, and $53.9 million, respectively; and loss from operations of $3.2 million, and $0.5 million, respectively. The CFS Divestitures were not included in our operating results for fiscal 2018 and 2017.
Revenue
Revenue is reported net of allowances for unauthorized sales and estimated sales adjustments, and net of any state provider taxes or gross receipts taxes levied on services we provide. See “—Critical Accounting Policies—Revenue Recognition” for further information. We derive revenue from contracts with state, local and other government payors and non-public payors. During the fiscal years ended September 30, 2018 and 2017, we derived 89% of our net revenue from contracts with state, local and other government payors and 11% of our net revenue from non-public payors. Substantially all of our non-public revenue is generated by our SRS business through contracts with commercial insurers, workers’ compensation carriers and other private payors. The payment terms and rates of our contracts vary widely by jurisdiction and service type. We have four types of contractual arrangements with payors which include negotiated contracts, fixed fee contracts, retrospective reimbursement contracts and prospective payments contracts. See “—Critical Accounting Policies—Revenue Recognition” for further information. Our revenue may be affected by adjustments to our billed rates as well as adjustments to previously billed amounts. Revenue in the future may be affected by changes in rates, rate-setting structures, methodologies or interpretations that may be proposed in states where we operate or by the federal government which provides matching funds. We cannot determine the impact of such changes or the effect of any possible governmental actions. In general, we take prices set by our payors and do not compete based on pricing.
34
We bill the majority of our residential services on a per person, per-diem basis. We believe important performance measures of revenues in our residential service business include average daily residential census and average daily billing rates. We bill the majority of our non-residential service on a per service unit basis. These service units, which vary in length, are converted to billable units which are the hourly equivalent for the service provided. We believe important performance measures of revenues in our non-residential service business include billable units and average billable unit rates. We calculate the impact of these measures on gross revenue rather than net revenue because the timing of sales adjustments, both positive and negative, is unpredictable. We define these measures and gross revenue as follows:
• | Gross Revenue: Revenues before adjusting for sales adjustments and state provider and gross receipts taxes. |
• | Average Residential Census: The average daily residential census over the respective period. |
• | Average Daily Rate: A mathematical calculation derived by dividing the gross residential revenue by the residential census and the resulting quotient by the number of days during the respective period. |
• | Non-Residential Billable Units: The hourly equivalent of non-residential services provided. |
• | Average Billable Unit Rate: Gross non-residential revenue divided by the billable units provided during the period. |
35
A comparative summary of gross revenues by operating division and our key metrics is as follows (dollars in thousands, except for daily and billable unit rates):
Year Ended September 30, | |||||||||||
2018 | 2017 | 2016 | |||||||||
Community Support Services | |||||||||||
Gross Revenues | $ | 1,039,711 | $ | 977,843 | $ | 946,064 | |||||
Average Residential Census | 8,850 | 8,278 | 8,079 | ||||||||
Average Daily Rate | $ | 248.81 | $ | 246.00 | $ | 241.15 | |||||
Non-Residential Billable Units | 12,450,129 | 12,618,504 | 12,700,230 | ||||||||
Average Non-Residential Billable Unit Rate | $ | 18.95 | $ | 18.59 | $ | 18.35 | |||||
Gross Revenue Growth % | 6.3 | % | 3.4 | % | 4.6 | % | |||||
Gross Revenue growth due to: | |||||||||||
Volume Growth | 4.9 | % | 1.7 | % | 2.3 | % | |||||
Average Rate Growth | 1.4 | % | 1.7 | % | 2.3 | % | |||||
Specialty Rehabilitation Services | |||||||||||
Gross Revenues | $ | 363,567 | $ | 317,196 | $ | 289,978 | |||||
Average Residential Census | 1,424 | 1,324 | 1,257 | ||||||||
Average Daily Rate | $ | 662.19 | $ | 629.14 | $ | 605.41 | |||||
Non-residential Billable Units | 254,087 | 171,098 | 158,498 | ||||||||
Average Non-Residential Billable Unit Rate | $ | 76.30 | $ | 77.21 | $ | 72.20 | |||||
Gross Revenue Growth % | 14.6 | % | 9.4 | % | 8.5 | % | |||||
Gross Revenue growth due to: | |||||||||||
Volume Growth | 9.3 | % | 5.4 | % | 7.7 | % | |||||
Average Rate Growth | 5.3 | % | 4.0 | % | 0.8 | % | |||||
Children & Family Services | |||||||||||
Gross Revenues (1) | $ | 148,455 | $ | 142,137 | $ | 148,400 | |||||
Average Residential Census | 2,213 | 2,123 | 2,303 | ||||||||
Average Daily Rate | $ | 128.46 | $ | 126.72 | $ | 124.90 | |||||
Non-residential Billable Units | 525,883 | 523,429 | 536,160 | ||||||||
Average Non-Residential Billable Unit Rate | $ | 85.01 | $ | 83.95 | $ | 80.45 | |||||
Gross Revenue Growth % | 4.4 | % | (4.2 | )% | (23.1 | )% | |||||
Gross Revenue growth due to: | |||||||||||
Volume Growth | 3.1 | % | (6.2 | )% | (29.4 | )% | |||||
Average Rate Growth | 1.3 | % | 2.0 | % | 6.3 | % | |||||
Adult Day Health | |||||||||||
Gross Revenues | $ | 73,437 | $ | 57,103 | $ | 35,684 | |||||
Non-residential Billable Units | 4,102,607 | 3,230,599 | 2,197,263 | ||||||||
Average Non-Residential Billable Unit Rate | $ | 17.90 | $ | 17.68 | $ | 16.24 | |||||
Gross Revenue Growth % | 28.6 | % | 60.0 | % | 79.0 | % | |||||
Gross Revenue growth due to: | |||||||||||
Volume Growth | 27.0 | % | 47.0 | % | 72.3 | % | |||||
Average Rate Growth | 1.6 | % | 13.0 | % | 6.7 | % | |||||
Consolidated Results | |||||||||||
Gross Revenues | $ | 1,625,170 | $ | 1,494,279 | $ | 1,420,126 | |||||
Gross Revenue Growth % | 8.8 | % | 5.2 | % | 2.6 | % | |||||
Gross Revenue growth due to: | |||||||||||
Volume Growth (1) | 6.6 | % | 2.8 | % | (2.0 | )% | |||||
Average Rate Growth | 2.2 | % | 2.4 | % | 4.6 | % | |||||
36
(1) | Includes $7.3 million of revenue for fiscal 2016 from the six state operations that were divested during the first quarter of fiscal 2016. |
Expenses
Expenses directly related to providing services are classified as cost of revenue. These expenses consist of direct labor costs which principally include salaries and benefits for service provider employees and per diem payments to our Mentors; direct program costs such as food, medicine and professional and general liability and employment practices liability expenses; residential occupancy expenses which are primarily composed of rent and utilities related to facilities providing direct care; and other direct costs which include travel and transportation costs and other ancillary direct costs associated with the provision of services to individuals, including workers’ compensation expense.
Wages and benefits to our employees and per diem payments to our Mentors constitute the most significant operating cost in each of our operations. Most of our direct support professionals are paid on an hourly basis, with hours of work generally tied to an individual’s need. Our Mentors are paid on a per diem basis, but only if the Mentor is currently caring for an individual. Our labor costs are generally influenced by levels of service, and these costs can vary in material respects across regions. In addition, our labor costs can be negatively impacted by higher rates of caregiver turnover, vacant positions and overtime utilization, as well as regulatory actions at the Federal, state, and local levels. For example, states and local governments set localized minimum wage increases, which in turn impact labor costs.
Occupancy costs represent a significant portion of our operating costs. As of September 30, 2018, we owned 355 facilities and 4 offices, and we leased 1,862 facilities and 201 offices. We expect occupancy costs to increase during fiscal 2019 as a result of new leases entered into pursuant to acquisitions and new starts. We incur no facility costs for services provided in the home of a Mentor.
Our business insurance programs include professional and general liability insurance, for which we are self-insured for $3.0 million per claim and $28.0 million in the aggregate, among others. We incurred professional and general liability expenses of $13.5 million, $7.2 million and $12.9 million for the fiscal years ended September 30, 2018, 2017 and 2016, respectively. These expenses are incurred in connection with our claims reserves and insurance premiums. The increase in our professional and general liability expense during fiscal 2018 was due to unfavorable claims experience compared to fiscal 2017. In addition, the professional and general liability expense during fiscal 2017 was positively impacted by changes in assumptions used in our actuarial estimates as a result of our historical claims experience.
We are fully self insured for employment practices liability claims. We currently have two pending complaints in California state court that allege certain wage and hour violations of California labor laws and seek to be designated as class-actions. Two additional California wage and hour class actions have been settled and approved by the court. These actions have increased our expenses for employment-practices liability related claims. For the fiscal years ended September 30, 2018, 2017 and 2016, we incurred employment practices liability expenses of $2.2 million, $5.5 million, and $0.2 million, respectively.
General and administrative expenses primarily include salaries and benefits for administrative employees, or employees that are not directly providing services, administrative occupancy costs as well as professional expenses such as accounting, consulting and legal services, and stock-based compensation expense.
Depreciation and amortization includes depreciation for fixed assets utilized in both facilities providing direct care and administrative offices, and amortization related to intangible assets.
We continue to review our operations in an effort to improve efficiencies, reduce overtime expenses, and implement cost saving measures throughout the Company. This expense reduction project includes a multi-pronged review of total company-wide expenses, inclusive of labor management and organizational structure. In connection with this project to optimize our business operations we have incurred $4.4 million in consulting, severance and contract termination costs in the fiscal year ended September 30, 2018. The cost savings associated with this project was approximately $5.0 million and $6.1 million in fiscal years 2017 and 2018, respectively.
37
Results of Operations
The following table sets forth our consolidated results of operations as a percentage of total gross revenues for the periods indicated.
Year ended September 30, | ||||||||
2018 | 2017 | 2016 | ||||||
Gross revenue | 100.0 | % | 100.0 | % | 100.0 | % | ||
Sales adjustments | (1.4 | )% | (1.3 | )% | (0.9 | )% | ||
Net revenue | 98.6 | % | 98.7 | % | 99.1 | % | ||
Cost of revenue | 78.8 | % | 77.7 | % | 76.9 | % | ||
Operating expenses: | ||||||||
General and administrative | 10.6 | % | 11.1 | % | 12.3 | % | ||
Goodwill and intangible asset impairment | 0.0 | % | 2.1 | % | 0.7 | % | ||
Depreciation and amortization | 5.9 | % | 5.1 | % | 5.1 | % | ||
Total operating expense | 16.5 | % | 18.3 | % | 18.1 | % | ||
Income from operations | 3.3 | % | 2.7 | % | 4.1 | % | ||
Other income (expense): | ||||||||
Other expense, net | (0.1 | )% | 0.0 | % | (0.1 | )% | ||
Interest expense | (2.4 | )% | (2.2 | )% | (2.4 | )% | ||
Income from continuing operations before income taxes | 0.8 | % | 0.5 | % | 1.6 | % | ||
Provision for income taxes | — | % | 0.1 | % | 0.9 | % | ||
Income from continuing operations | 0.8 | % | 0.4 | % | 0.7 | % | ||
Loss from discontinued operations, net of tax | — | % | — | % | — | % | ||
Net income | 0.8 | % | 0.4 | % | 0.7 | % | ||
Fiscal Year Ended September 30, 2018 compared to Fiscal Year Ended September 30, 2017
Consolidated overview
Year ended September 30, | Increase (Decrease) | ||||||||||
(In thousands) | 2018 | 2017 | |||||||||
Gross revenue | $ | 1,625,170 | $ | 1,494,279 | $ | 130,891 | |||||
Sales adjustments | (22,968 | ) | (19,769 | ) | (3,199 | ) | |||||
Net revenue | $ | 1,602,202 | $ | 1,474,510 | $ | 127,692 | |||||
Income from operations | $ | 54,370 | $ | 40,891 | $ | 13,479 | |||||
Operating margin | 3.3 | % | 2.7 | % | 0.6 | % | |||||
Consolidated gross revenue for the fiscal year ended September 30, 2018 (“fiscal 2018”) increased by $130.9 million, or 8.8%, compared to gross revenue for the fiscal year ended September 30, 2017 (“fiscal 2017”). Gross revenue increased by $107.2 million from acquisitions that closed during and after fiscal 2017, and $23.7 million from organic growth. Organic growth during fiscal 2018 was negatively impacted by the Program Closures, which resulted in a decrease of $11.4 million in gross revenue.
Consolidated income from operations increased from 2.7% of gross revenue, or $40.9 million, in fiscal 2017 to 3.3% of gross revenue, or $54.4 million, in fiscal 2018. The increase in our operating margin was due to $31.0 million of goodwill and intangible asset impairment charges recorded in the prior year and a decrease in general and administrative expenses as a percentage of net revenue that was the result of cost containment efforts and efficiencies gained from our multi-year project to optimize the Company's cost structure. The increase in our operating margin was partially offset by an increase in occupancy costs due to $10.0 million of lease termination costs associated with the Program Closures and higher levels of open occupancy within our waiver group homes compared to the prior year. In addition, our operating margin was negatively impacted by $6.1 million of accelerated amortization related to intangible assets associated with the Program Closures. Direct labor costs remained relatively consistent as a percentage of revenue compared to fiscal 2017.
38
Community Support Services (CSS) Results of Operations
The following table sets forth the results of operations for the CSS segment for the periods indicated (in thousands):
Year ended September 30, | ||||||||||||||||||||
2018 | 2017 | Change in % of gross revenue | ||||||||||||||||||
Amount | % of gross revenue | Amount | % of gross revenue | Increase (Decrease) | ||||||||||||||||
Revenue: | ||||||||||||||||||||
CSS gross revenue | $ | 1,039,711 | 100.0 | % | $ | 977,843 | 100.0 | % | $ | 61,868 | ||||||||||
Sales adjustments | (14,099 | ) | (1.4 | )% | (10,810 | ) | (1.1 | )% | (3,289 | ) | (0.3 | )% | ||||||||
CSS net revenue | 1,025,612 | 98.6 | % | 967,033 | 98.9 | % | 58,579 | (0.3 | )% | |||||||||||
Cost of revenue: | ||||||||||||||||||||
Direct labor costs | 669,997 | 64.4 | % | 627,625 | 64.2 | % | 42,372 | 0.2 | % | |||||||||||
Direct program costs | 43,622 | 4.2 | % | 39,626 | 4.1 | % | 3,996 | 0.1 | % | |||||||||||
Direct occupancy costs | 78,710 | 7.6 | % | 68,212 | 7.0 | % | 10,498 | 0.6 | % | |||||||||||
Other direct costs | 45,333 | 4.4 | % | 42,043 | 4.3 | % | 3,290 | 0.1 | % | |||||||||||
Total cost of revenue | 837,662 | 80.6 | % | 777,506 | 79.6 | % | 60,156 | 1.0 | % | |||||||||||
General and administrative | 50,651 | 4.9 | % | 50,551 | 5.2 | % | 100 | (0.3 | )% | |||||||||||
CSS EBITDA | 137,299 | 13.1 | % | 138,976 | 14.1 | % | (1,677 | ) | (1.0 | )% | ||||||||||
Depreciation and amortization | 43,738 | 4.2 | % | 37,445 | 3.8 | % | 6,293 | 0.4 | % | |||||||||||
Income from Operations | $ | 93,561 | 8.9 | % | $ | 101,531 | 10.3 | % | $ | (7,970 | ) | (1.4 | )% | |||||||
CSS gross revenue
CSS gross revenue for the year ended September 30, 2018 increased by $61.9 million, or 6.3%, compared to the year ended September 30, 2017. The increase in CSS gross revenue included $11.6 million from organic growth and $50.3 million from acquisitions that closed during and after the year ended September 30, 2017. The organic growth was the result of a 1.6% increase in average billing rates partially offset by a 0.4% decrease in volume compared to the year ended September 30, 2017.
CSS EBITDA
CSS EBITDA decreased from $139.0 million during the year ended September 30, 2017 to $137.3 million during the year ended September 30, 2018. CSS EBITDA as a percentage of gross revenue decreased from 14.1% during the year ended September 30, 2017 to 13.1% during the year ended September 30, 2018. The decrease in our CSS EBITDA margin was due to an increase in cost of revenue as a percentage of gross revenue compared to the prior year.
CSS cost of revenue for the year ended September 30, 2018 increased, as a percentage of gross revenue, by 1.0%, compared to the year ended September 30, 2017. This was primarily due to an increase in direct labor costs of 0.2%, and an increase in direct occupancy costs of 0.6% . The increase in direct labor costs was primarily due to an increase in overtime pay compared to the year ended September 30, 2017 as we continue to experience higher competition for labor in certain markets. The increase in direct occupancy costs as a percentage of gross revenue was primarily due to higher levels of open occupancy in our waiver group home programs compared to fiscal 2017. Occupancy costs during fiscal 2018 were also negatively impacted by $0.8 million in lease termination costs associated with the Program Closures.
CSS general and administrative expenses decreased as a percentage of gross revenue in fiscal 2018 compared to fiscal 2017 due to cost containment efforts and efficiencies gained from our multi-year project to optimize the Company’s cost structure.
CSS Depreciation and amortization expense
39
Depreciation and amortization expense increased $6.3 million or 0.4% as a percentage of gross revenue, compared to the year ended September 30, 2017. The increase as a percentage of gross revenue was primarily due to higher annual amortization expense resulting from intangible assets associated with the Habilitative Services, Inc. ("HSI") acquisition we completed at the end of fiscal 2017.
Specialty Rehabilitation Services (SRS) Results of Operations
The following table sets forth the results of operations for the SRS segment for the periods indicated (in thousands):
Year ended September 30, | ||||||||||||||||||||
2018 | 2017 | Change in % of gross revenue | ||||||||||||||||||
Amount | % of gross revenue | Amount | % of gross revenue | Increase (Decrease) | ||||||||||||||||
Revenue: | ||||||||||||||||||||
SRS gross revenue | $ | 363,567 | 100.0 | % | $ | 317,196 | 100.0 | % | $ | 46,371 | ||||||||||
Sales adjustments | (7,286 | ) | (2.0 | )% | (7,653 | ) | (2.4 | )% | 367 | 0.4 | % | |||||||||
SRS net revenue | 356,281 | 98.0 | % | 309,543 | 97.6 | % | 46,738 | 0.4 | % | |||||||||||
Cost of revenue: | ||||||||||||||||||||
Direct labor costs | 187,277 | 51.5 | % | 162,990 | 51.4 | % | 24,287 | 0.1 | % | |||||||||||
Direct program costs | 22,820 | 6.3 | % | 21,916 | 6.9 | % | 904 | (0.6 | )% | |||||||||||
Direct occupancy costs | 51,088 | 14.1 | % | 35,275 | 11.1 | % | 15,813 | 3.0 | % | |||||||||||
Other direct costs | 9,173 | 2.5 | % | 8,366 | 2.6 | % | 807 | (0.1 | )% | |||||||||||
Total cost of revenue | 270,358 | 74.4 | % | 228,547 | 72.0 | % | 41,811 | 2.4 | % | |||||||||||
General and administrative | 31,411 | 8.6 | % | 29,197 | 9.2 | % | 2,214 | (0.6 | )% | |||||||||||
SRS EBITDA | 54,512 | 15.0 | % | 51,799 | 16.4 | % | 2,713 | (1.4 | )% | |||||||||||
Depreciation and amortization | 31,045 | 8.5 | % | 23,622 | 7.4 | % | 7,423 | 1.1 | % | |||||||||||
Income from Operations | $ | 23,467 | 6.5 | % | $ | 28,177 | 9.0 | % | $ | (4,710 | ) | (2.5 | )% | |||||||
SRS gross revenue
SRS gross revenue for the year ended September 30, 2018 increased by $46.4 million, or 14.6%, compared to the year ended September 30, 2017. The increase in SRS gross revenue included $3.1 million from organic growth and $43.3 million from acquisitions that closed during and after fiscal 2017. The organic growth was driven by an increase of 0.3% in volume and an increase of 0.7% in the average billing rate.
SRS EBITDA
SRS EBITDA increased from $51.8 million during the year ended September 30, 2017 to $54.5 million during the year ended September 30, 2018. SRS EBITDA as a percentage of gross revenue decreased from 16.4% during the year ended September 30, 2017 to 15.0% during the year ended September 30, 2018. The decrease in our SRS EBITDA margin as a percentage of revenue was primarily due to an increase in cost of revenue.
SRS cost of revenue for the year ended September 30, 2018 increased as a percentage of gross revenue by 2.4% compared to the year ended September 30, 2017. The increase was due to a 3.0% increase in occupancy costs that was primarily due to $8.3 million of lease termination costs related to the Program Closures and an increase in rent expense that was partially driven by the Mentis Neuro Rehabilitation, LLC ("Mentis") acquisition. The increase was partially offset by a 0.6% decrease in direct program costs resulting from lower food and medical cost due to improvements in our procurement processes that have resulted in more favorable pricing with certain vendors.
40
SRS general and administrative expenses decreased as a percentage of gross revenue by 0.6% during the year ended September 30, 2018. The decrease in general and administrative expenses was primarily due to cost containment efforts and efficiencies gained from our multi-year project to optimize the Company’s cost structure.
SRS Depreciation and amortization expense
Depreciation and amortization expense as a percentage of gross revenue increased by 1.1% as a percentage of revenue, compared to the year ended September 30, 2017. The increase was primarily due to $2.3 million of accelerated amortization related to definite-lived intangible assets associated with the Program Closures and additional amortization expense resulting from intangible assets acquired in the Mentis acquisition that closed during the first quarter of fiscal 2018.
Children & Family Services (CFS) Results of Operations
The following table sets forth the results of operations for the CFS segment for the periods indicated (in thousands):
Year ended September 30, | ||||||||||||||||||||
2018 | 2017 | Change in % of gross revenue | ||||||||||||||||||
Amount | % of gross revenue | Amount | % of gross revenue | Increase (Decrease) | ||||||||||||||||
Revenue: | ||||||||||||||||||||
CFS gross revenue | $ | 148,455 | 100.0 | % | $ | 142,137 | 100.0 | % | $ | 6,318 | ||||||||||
Sales adjustments | (779 | ) | (0.5 | )% | (395 | ) | (0.3 | )% | (384 | ) | (0.2 | )% | ||||||||
CFS net revenue | 147,676 | 99.5 | % | 141,742 | 99.7 | % | 5,934 | (0.2 | )% | |||||||||||
Cost of revenue | 113,896 | 76.7 | % | 108,410 | 76.3 | % | 5,486 | 0.4 | % | |||||||||||
General and administrative | 12,008 | 8.1 | % | 11,742 | 8.3 | % | 266 | (0.2 | )% | |||||||||||
CFS EBITDA | 21,772 | 14.7 | % | 21,590 | 15.1 | % | 182 | (0.4 | )% | |||||||||||
Depreciation and amortization | 5,445 | 3.7 | % | 5,662 | 4.0 | % | (217 | ) | (0.3 | )% | ||||||||||
Income from Operations | $ | 16,327 | 11.0 | % | $ | 15,928 | 11.1 | % | $ | 399 | (0.1 | )% | ||||||||
CFS gross revenue
CFS gross revenue for the year ended September 30, 2018 increased by $6.3 million, or 4.4%, compared to the year ended September 30, 2017. The $6.3 million increase in CFS gross revenue, which was all from organic growth, was due to a 3.1% increase in volume and a 1.3% increase in average billing rate.
CFS EBITDA
CFS EBITDA increased from $21.6 million during the year ended September 30, 2017 to $21.8 million during the year ended September 30, 2018. CFS EBITDA as a percentage of gross revenue decreased from 15.1% during the year ended September 30, 2017 to 14.7% during the year ended September 30, 2018. The decrease in our CFS EBITDA margin as a percentage of revenue was due to an increase in cost of revenue that was primarily attributable to higher direct labor costs, partially offset by a decrease in general and administrative expense resulting from cost containment efforts and efficiencies gained from our multi-year project to optimize the Company’s cost structure.
CFS Depreciation and amortization expense
Depreciation and amortization expense for the year ended September 30, 2018 decreased by 0.2 million, or 0.3% of gross revenue, compared to the year ended September 30, 2017. This was primarily due to certain intangible assets becoming fully amortized during the first quarter of the fiscal 2018.
41
Corporate and Other Results of Operations
The following table sets forth the results of operations for Corporate and Other for the periods indicated (in thousands):
Year ended September 30, | |||||||||||
2018 | 2017 | ||||||||||
Amount | Amount | Increase (Decrease) | |||||||||
Revenue: | |||||||||||
Corporate and Other gross revenue | $ | 73,438 | $ | 57,103 | $ | 16,335 | |||||
Sales adjustments | (805 | ) | (911 | ) | 106 | ||||||
Corporate and Other net revenue | 72,633 | 56,192 | 16,441 | ||||||||
Cost of revenue | 58,692 | 46,065 | 12,627 | ||||||||
General and administrative | 77,733 | 74,886 | 2,847 | ||||||||
Goodwill and intangible asset impairment | — | 31,002 | (31,002 | ) | |||||||
Depreciation and amortization | 15,193 | 8,984 | 6,209 | ||||||||
Loss from operations | $ | (78,985 | ) | $ | (104,745 | ) | $ | 25,760 | |||
Corporate and Other revenue
Corporate and Other gross revenue consists of revenue from our Adult Day Health ("ADH") business. ADH gross revenue for the year ended September 30, 2018 increased by $16.3 million, or 28.6%, compared to the year ended September 30, 2017. The increase in gross revenue included $13.6 million from acquisitions closed during and after the year ended September 30, 2017, and $2.7 million from organic growth.
Corporate and Other cost of revenue
Corporate and Other cost of revenue consists of costs associated with our ADH business. Corporate and Other cost of revenue for the year ended September 30, 2018 decreased as a percentage of gross revenue by 0.7% compared to the year ended September 30, 2017. The decrease was primarily due to lower direct labor and occupancy costs as a percentage of revenue resulting from higher operating margins on maturing new start programs and the positive impact of divesting some under-performing programs during fiscal 2017 and fiscal 2018.
Corporate and Other operating expense
General and administrative expenses for the year ended September 30, 2018 increased by $2.8 million as compared to year ended September 30, 2017.
Depreciation and amortization expense for the year ended September 30, 2018 increased by $6.2 million compared to the year ended September 30, 2017. The increase was primarily attributable to accelerated amortization expense on intangible assets associated with two ADH programs that were closed as a result of the Program Closures and additional amortization expense from intangible assets from acquisitions that closed during and after the year ended September 30, 2017.
Consolidated Other income (expense)
Other income (expense), net, which primarily consists of interest income and mark to market adjustments of the cash surrender value of Company owned life insurance policies, was $1.3 million of expense and $0.7 million of income for the years ended September 30, 2018 and September 30, 2017, respectively.
Consolidated Provision (benefit) for income taxes
For the year ended September 30, 2018 our effective income tax rate was (4.2)% compared to an effective tax rate of 22.7% for the year ended September 30, 2017. The lower effective tax rate for the year ended September 30, 2018 compared to the federal statutory income tax rate was primarily due to a $4.9 million tax benefit that was recognized in connection with revaluing of the Company’s deferred tax liabilities as a result of the lower corporate tax rate established by the Tax Act enacted in the first quarter of fiscal 2018. The lower effective tax rate for the year ended September 30, 2017 compared to the federal statutory income tax rate was primarily due to tax credits realized during fiscal 2017.
42
Fiscal Year Ended September 30, 2017 compared to Fiscal Year Ended September 30, 2016
Consolidated overview
Year ended September 30, | Increase (Decrease) | ||||||||||
(In thousands) | 2017 | 2016 | |||||||||
Gross revenue | $ | 1,494,279 | $ | 1,420,126 | $ | 74,153 | |||||
Sales adjustments | (19,769 | ) | (12,539 | ) | (7,230 | ) | |||||
Net revenue | $ | 1,474,510 | $ | 1,407,587 | $ | 66,923 | |||||
Income from operations | $ | 40,891 | $ | 57,696 | $ | (16,805 | ) | ||||
Operating margin | 2.7 | % | 4.1 | % | (1.4 | )% | |||||
Consolidated gross revenue for the fiscal year ended September 30, 2017 (“fiscal 2017”) increased by $74.2 million, or 5.2%, compared to gross revenue for the fiscal year ended September 30, 2016 (“fiscal 2016”). Gross revenue increased by $39.8 million from acquisitions that closed during and after fiscal 2016, and $34.4 million from organic growth. Organic growth was negatively impacted by the CFS Divestitures, which resulted in a decrease of $7.3 million in gross revenue. Excluding the operating results of the CFS Divestitures, gross revenue increased $41.7 million from organic growth. Sales adjustments as a percentage of gross revenue increased from 0.9% to 1.3% during fiscal 2017. The largest driver of this increase in net sales adjustments was higher accounts receivable reserve levels in our CareMeridian business unit that resulted from changes in our collectability assumptions for certain aged accounts receivable. In addition, favorable adjustments to our reserves in the prior year that did not recur in fiscal 2017 contributed to the increase in sales adjustments.
Consolidated income from operations decreased from 4.1% of gross revenue, or $57.7 million, in fiscal 2016 to 2.7% of gross revenue, or $40.9 million, in fiscal 2017. The decrease in our operating margin was primarily due to $31.0 million of goodwill and intangible impairment charges during fiscal 2017. The impairment charges include $28.0 million of goodwill impairment charges and $3.0 million of intangible impairment charges, both of which related to our ADH reporting unit (see Note 7 to our consolidated financial statements for more information on the goodwill impairment). The goodwill impairment was attributable to a reduction in the profit projections of the core ADH business and a decrease in the forecasted contributions from future new start programs as compared to the prior year's projections. The tradename impairment was the result of our decision to phase in one national brand name for our ADH business unit. In addition to these charges, our margin was negatively impacted by increases in direct expense due to higher overtime pay, especially within our CSS segment, an increase in health insurance expense and higher occupancy costs as a percentage of revenue compared to fiscal 2016. The decrease in operating margin was partially offset by an $8.6 million decrease in stock-based compensation (see Note 12 to our consolidated financial statements for more information on the former equity plan), the effect of approximately $2.0 million of exit costs associated with the CFS Divestitures recorded in the prior year, and lower general and administrative costs as a percentage of revenue resulting from management's continued focus optimizing the Company's costs structure.
43
Community Support Services (CSS) Results of Operations
The following table sets forth the results of operations for the CSS segment for the periods indicated (in thousands):
Year ended September 30, | ||||||||||||||||||||
2017 | 2016 | Change in % of gross revenue | ||||||||||||||||||
Amount | % of gross revenue | Amount | % of gross revenue | Increase (Decrease) | ||||||||||||||||
Revenue: | ||||||||||||||||||||
CSS gross revenue | $ | 977,843 | 100.0 | % | $ | 946,064 | 100.0 | % | $ | 31,779 | ||||||||||
Sales adjustments | (10,810 | ) | (1.1 | )% | (10,123 | ) | (1.1 | )% | (687 | ) | — | % | ||||||||
CSS net revenue | 967,033 | 98.9 | % | 935,941 | 98.9 | % | 31,092 | — | % | |||||||||||
Cost of revenue: | ||||||||||||||||||||
Direct labor costs | 627,625 | 64.2 | % | 602,113 | 63.6 | % | 25,512 | 0.6 | % | |||||||||||
Direct program costs | 39,626 | 4.1 | % | 39,344 | 4.2 | % | 282 | (0.1 | )% | |||||||||||
Direct occupancy costs | 68,212 | 7.0 | % | 63,448 | 6.7 | % | 4,764 | 0.3 | % | |||||||||||
Other direct costs | 42,043 | 4.3 | % | 40,731 | 4.3 | % | 1,312 | — | % | |||||||||||
Total cost of revenues | 777,506 | 79.6 | % | 745,636 | 78.8 | % | 31,870 | 0.8 | % | |||||||||||
General and administrative | 50,551 | 5.2 | % | 50,026 | 5.3 | % | 525 | (0.1 | )% | |||||||||||
CSS EBITDA | 138,976 | 14.1 | % | 140,279 | 14.8 | % | (1,303 | ) | (0.7 | )% | ||||||||||
Depreciation and amortization | 37,445 | 3.8 | % | 37,850 | 4.0 | % | (405 | ) | (0.2 | )% | ||||||||||
Income from Operations | $ | 101,531 | 10.3 | % | $ | 102,429 | 10.8 | % | $ | (898 | ) | (0.5 | )% | |||||||
CSS gross revenue
CSS gross revenue for the year ended September 30, 2017 increased by $31.8 million, or 3.4%, compared to the year ended September 30, 2016. The increase in CSS gross revenue included $19.8 million from organic growth and $12.0 million from acquisitions that closed during and after the year ended September 30, 2016. The organic growth was the result of a 1.7% increase in average billing rates and a 0.4% increase in volume compared to the year ended September 30, 2016.
CSS EBITDA
CSS EBITDA decreased from $140.3 million during the year ended September 30, 2016 to $139.0 million during the year ended September 30, 2017. CSS EBITDA as a percentage of gross revenue decreased from 14.8% during the year ended September 30, 2016 to 14.1% during the year ended September 30, 2017. The decrease in our CSS EBITDA margin was due to an increase in cost of revenues as a percentage of gross revenue compared to the prior year.
CSS cost of revenues for the year ended September 30, 2017 increased, as a percentage of gross revenue, by 0.8%, compared to the year ended September 30, 2016. This was primarily due to an increase in direct labor costs of 0.6%, and an increase in direct occupancy costs of 0.3% . The increase in direct labor costs was due to higher amounts of overtime pay as we continue to experience increased competition for labor in some markets and an increase in health insurance expense due to higher enrollment and utilization compared to the year ended September 30, 2016. The increase in direct occupancy costs as a percentage of gross revenue was primarily due to certain programs with higher levels of open occupancy and increases in rent, utilities, and repairs and maintenance costs.
CSS general and administrative expenses remained relatively consistent as a percentage of gross revenue during the year ended September 30, 2017, compared to the year ended September 30, 2016.
CSS Depreciation and amortization expense
44
Depreciation and amortization expense decreased $0.4 million or 0.2% as a percentage of gross revenue, compared to the year ended September 30, 2016. The decrease as a percentage of gross revenue was the result of certain intangible assets becoming fully amortized during the year ended September 30, 2017.
Specialty Rehabilitation Services (SRS) Results of Operations
The following table sets forth the results of operations for the SRS segment for the periods indicated (in thousands):
Year ended September 30, | ||||||||||||||||||||
2017 | 2016 | Change in % of gross revenue | ||||||||||||||||||
Amount | % of gross revenue | Amount | % of gross revenue | Increase (Decrease) | ||||||||||||||||
Revenue: | ||||||||||||||||||||
SRS gross revenue | $ | 317,196 | 100.0 | % | $ | 289,978 | 100.0 | % | $ | 27,218 | ||||||||||
Sales adjustments | (7,653 | ) | (2.4 | )% | (885 | ) | (0.3 | )% | (6,768 | ) | (2.1 | )% | ||||||||
SRS net revenue | 309,543 | 97.6 | % | 289,093 | 99.7 | % | 20,450 | (2.1 | )% | |||||||||||
Cost of revenue: | ||||||||||||||||||||
Direct labor costs | 162,990 | 51.4 | % | 147,425 | 50.8 | % | 15,565 | 0.6 | % | |||||||||||
Direct program costs | 21,916 | 6.9 | % | 20,201 | 7.0 | % | 1,715 | (0.1 | )% | |||||||||||
Direct occupancy costs | 35,275 | 11.1 | % | 33,037 | 11.4 | % | 2,238 | (0.3 | )% | |||||||||||
Other direct costs | 8,366 | 2.6 | % | 7,731 | 2.7 | % | 635 | (0.1 | )% | |||||||||||
Total cost of revenue | 228,547 | 72.0 | % | 208,394 | 71.9 | % | 20,153 | 0.1 | % | |||||||||||
General and administrative | 29,197 | 9.2 | % | 25,844 | 8.9 | % | 3,353 | 0.3 | % | |||||||||||
SRS EBITDA | 51,799 | 16.4 | % | 54,855 | 18.9 | % | (3,056 | ) | (2.5 | )% | ||||||||||
Depreciation and amortization | 23,622 | 7.4 | % | 23,412 | 8.1 | % | 210 | (0.7 | )% | |||||||||||
Income from Operations | $ | 28,177 | 9.0 | % | $ | 31,443 | 10.8 | % | $ | (3,266 | ) | (1.8 | )% | |||||||
SRS gross revenue
SRS gross revenue for the year ended September 30, 2017 increased by $27.2 million, or 9.4%, compared to the year ended September 30, 2016. The increase in SRS gross revenue included $19.9 million from organic growth and $7.3 million from acquisitions that closed during and after fiscal 2016. The organic growth was driven by an increase of 3.6% in volume and an increase of 3.3% in the average billing rate. The increase in volume was primarily due to higher occupancy levels resulting from the maturation of new programs started in recent years. The increase in average billing rate was primarily due to changes in consumer mix.
SRS EBITDA
SRS EBITDA decreased from $54.9 million during the year ended September 30, 2016 to $51.8 million during the year ended September 30, 2017. SRS EBITDA as a percentage of gross revenue decreased from 18.9% during the year ended September 30, 2016 to 16.4% during the year ended September 30, 2017. The decrease in our SRS EBITDA margin as a percentage of revenue was primarily due to increases in net sales adjustments and general and administrative expenses as a percentage of gross revenue.
SRS sales adjustments for the year ended September 30, 2017 increased by $6.8 million, or 2.1% as a percentage of gross revenue, compared to the year ended September 30, 2016. The largest driver of this increase was higher accounts receivable reserves for our CareMeridian business unit that resulted from changes in our collectability assumptions for certain aged accounts receivable. In addition, favorable adjustments to our reserves in the prior year that did not recur in fiscal 2017 contributed to the increase in sales adjustments during fiscal 2017.
45
SRS cost of revenues for the year ended September 30, 2017 remained relatively stable as a percentage of gross revenue increasing 0.1% compared to the year ended September 30, 2016. The increase was primarily due to an increase of 0.6% in direct labor costs, partially offset by a 0.3% decrease in direct occupancy costs. The increase in direct labor costs as a percentage of gross revenue was primarily due to increases in overtime pay and an increase in health insurance expense due to higher enrollment and utilization compared to the year ended September 30, 2016. The decrease in direct occupancy costs as a percentage of revenue was mainly due to lower levels of open occupancy resulting from the maturation of programs started in recent years.
SRS general and administrative expenses increased as a percentage of gross revenue by 0.3% during the year ended September 30, 2017. The increase in general and administrative expenses was primarily due to professional service fees and other costs incurred in connection with our project to improve efficiencies and optimize our cost structure.
SRS Depreciation and amortization expense
Depreciation and amortization expense as a percentage of gross revenue decreased by 0.7% as a percentage of revenue, compared to the year ended September 30, 2016. The decrease as a percentage of gross revenue is the result of the revenue growth being more heavily weighted toward organic versus acquisitions in recent years.
Children & Family Services (CFS) Results of Operations
The following table sets forth the results of operations for the CFS segment for the periods indicated (in thousands):
Year ended September 30, | ||||||||||||||||||||
2017 | 2016 | Change in % of gross revenue | ||||||||||||||||||
Amount | % of gross revenue | Amount | % of gross revenue | Increase (Decrease) | ||||||||||||||||
Revenue: | ||||||||||||||||||||
CFS gross revenue | $ | 142,137 | 100.0 | % | $ | 148,400 | 100.0 | % | $ | (6,263 | ) | |||||||||
Sales adjustments | (395 | ) | (0.3 | )% | (1,121 | ) | (0.8 | )% | 726 | 0.5 | % | |||||||||
CFS net revenue | 141,742 | 99.7 | % | 147,279 | 99.2 | % | (5,537 | ) | 0.5 | % | ||||||||||
Cost of revenues | 108,410 | 76.3 | % | 111,233 | 75.0 | % | (2,823 | ) | 1.3 | % | ||||||||||
General and administrative | 11,742 | 8.3 | % | 15,449 | 10.4 | % | (3,707 | ) | (2.1 | )% | ||||||||||
CFS EBITDA | 21,590 | 15.1 | % | 20,597 | 13.8 | % | 993 | 1.3 | % | |||||||||||
Depreciation and amortization | 5,662 | 4.0 | % | 5,722 | 3.9 | % | (60 | ) | 0.1 | % | ||||||||||
Income from Operations | $ | 15,928 | 11.1 | % | $ | 14,875 | 9.9 | % | $ | 1,053 | 1.2 | % | ||||||||
CFS gross revenue
CFS gross revenue for the year ended September 30, 2017 decreased by $6.3 million, or 4.2%, compared to the year ended September 30, 2016. The $6.3 million decrease in CFS gross revenue was due to a 6.2% decrease in volume resulting
from the CFS Divestitures during the first half of fiscal 2016, slightly offset by a 2.0% increase in average billing rate. The CFS Divestitures resulted in a decrease of $7.3 million in gross revenue compared to the year ended September 30, 2016.
CFS EBITDA
CFS EBITDA increased from $20.6 million during the year ended September 30, 2016 to $21.6 million during the year ended September 30, 2017. CFS EBITDA as a percentage of gross revenue increased from 13.8% during the year ended September 30, 2016 to 15.1% during the year ended September 30, 2017. The increase in our CFS EBITDA margin as a percentage of revenue was the result of decreases in general and administrative expense and net sales adjustments as a percentage of gross revenue, partially offset by an increase in cost of revenue as a percentage of gross revenue compared to the prior year.
CFS cost of revenues for the year ended September 30, 2017 increased as a percentage of gross revenue by 1.3% as
46
compared to the year ended September 30, 2016. This was primarily due to higher amounts of overtime pay, an increase in health insurance expense, and an increase in direct occupancy costs compared to the prior year.
CFS general and administrative expenses decreased by $3.7 million, or 2.1% of gross revenue, during the year ended September 30, 2017. The decrease in general and administrative expenses was due to costs associated with the CFS divestitures, including approximately $2.0 million of exit costs recorded in the prior year.
CFS Depreciation and amortization expense
Depreciation and amortization expense for the year ended September 30, 2017 remained relatively consistent as a percentage of gross revenue compared to the year ended September 30, 2016.
Corporate and Other Results of Operations
The following table sets forth the results of operations for Corporate and Other for the periods indicated (in thousands):
Year ended September 30, | |||||||||||
2017 | 2016 | ||||||||||
Amount | Amount | Increase (Decrease) | |||||||||
Revenue: | |||||||||||
Corporate and Other gross revenue | $ | 57,103 | $ | 35,684 | $ | 21,419 | |||||
Sales adjustments | (911 | ) | (410 | ) | (501 | ) | |||||
Corporate and Other net revenue | 56,192 | 35,274 | 20,918 | ||||||||
Cost of revenue | 46,065 | 26,918 | 19,147 | ||||||||
General and administrative | 74,886 | 83,079 | (8,193 | ) | |||||||
Goodwill and intangible impairment | 31,002 | 10,251 | 20,751 | ||||||||
Depreciation and amortization | 8,984 | 6,077 | 2,907 | ||||||||
Loss from operations | $ | (104,745 | ) | $ | (91,051 | ) | $ | (13,694 | ) | ||
Corporate and Other revenue
Corporate and Other gross revenue consists of revenue from our Adult Day Health ("ADH") business. ADH gross revenue for the year ended September 30, 2017 increased by $21.4 million, or 60.0%, compared to the year ended September 30, 2016. The increase in gross revenue included $20.5 million from acquisitions closed during the year ended September 30, 2017, and $0.9 million from organic growth.
Corporate and Other cost of revenue
Corporate and Other cost of revenue consists of costs associated with our ADH business. Corporate and Other costs of revenue for the year ended September 30, 2017 increased by $19.1 million or 5.3% as a percentage of revenue, compared to the year ended September 30, 2016. The increase as a percentage of revenue was primarily due to the impact of programs with higher levels of open capacity, costs associated new starts and certain acquisitions with lower operating margins.
Corporate and Other operating expense
General and administrative expenses for the year ended September 30, 2017 decreased by $8.2 million as compared to year ended September 30, 2016. This was primarily due to an $8.6 million reduction in stock-based compensation expense
resulting from a $10.5 million charge recorded during the year ended September 30, 2016 related to awards under our former
equity plan. In addition, our indirect labor costs and other administrative expenses decreased compared to the prior year as a result of our continued focus on improving efficiencies and maximizing the Company's cost structure.
Goodwill and intangible impairment charges increased $20.8 million as compared to year ended September 30, 2016. This was primarily due to $31.0 million of impairment charges related to our ADH business, including $28.0 million of goodwill impairment charges and $3.0 million of impairment charges associated with ADH tradenames. The goodwill impairment was attributable to a reduction in the profit projections of the core ADH business and a decrease in the forecasted
47
contributions from future new start programs as compared to the prior year's projections. The tradename impairment was the result of our decision in the fourth quarter of fiscal 2017 to phase in one national brand name for the ADH business.
Depreciation and amortization expense for the year ended September 30, 2017 decreased by1.3% as a percentage of gross revenue, compared to the year ended September 30, 2016. The decrease as a percentage of gross revenue was the result of certain intangibles assets becoming fully amortized during the year ended September 30, 2017.
Consolidated Other income (expense)
Other income (expense), net, which primarily consists of interest income, mark to market adjustments of the cash surrender value of Company owned life insurance policies and the accretion of interest on acquisition related contingent consideration liabilities, was $0.7 million of income and $0.9 million of expense for the years ended September 30, 2017 and September 30, 2016, respectively. Other income of $0.7 million for the year ended September 30, 2017 was
primarily the result of gains from our Company owned life insurance policies. Other expense of $0.9 million for the year ended September 30, 2016 was due to a $1.3 million loss recorded on the sale of our CFS operations in the state of North
Carolina.
Consolidated Provision (benefit) for income taxes
For the year ended September 30, 2017 our effective income tax rate was 22.7% compared to an effective tax rate of 58.4% for the year ended September 30, 2016. These rates differ from the federal statutory income tax rate primarily due to state income taxes and nondeductible permanent differences such as meals and nondeductible compensation. The lower effective tax rate for the year ended September 30, 2017 compared to the federal statutory income tax rate was primarily due to tax credits realized during fiscal 2017 and lower pretax income compared to the prior year. The higher effective tax rate for the year ended September 30, 2016 compared to the federal statutory income tax rate was primarily due to a $10.5 million stock-based compensation charge recorded during the first quarter of fiscal 2016. The charge resulted in a higher effective tax rate during the prior year because it was not deductible for tax purposes.
Liquidity and Capital Resources
Our principal uses of cash are to meet working capital requirements, fund debt obligations, finance capital expenditures and acquisitions, and repurchase shares of common stock. Cash flows from operations and borrowings under our senior credit facility have historically been sufficient to meet these cash requirements. Our principal sources of funds are cash flows from operating activities, cash on hand, and available borrowings under our senior revolver.
Operating activities
Cash flows provided by operating activities were $106.7 million, $96.9 million and $107.1 million for fiscal 2018, 2017 and 2016, respectively. The increase in net cash provided by operations during fiscal 2018 compared to fiscal 2017 was primarily due to contributions from acquisitions, partially offset by an increase in days sales outstanding ("DSO") from 45.2 days to 46.2 days. The decrease in cash provided by operating activities in fiscal 2017 compared to fiscal 2016 was primarily due an increase in our DSO from 43.0 days in fiscal 2016 to 45.2 days in fiscal 2017.
Investing activities
Net cash used in investing activities was $149.2 million, $125.7 million and $87.4 million for fiscal 2018, 2017 and 2016, respectively. Cash paid for acquisitions was $100.1 million, $82.1 million and $45.2 million for fiscal 2018, 2017 and 2016, respectively. We acquired 11, 11, and 12 companies in each of fiscal 2018, 2017 and 2016, respectively. Cash paid for property and equipment for fiscal 2018 was $51.0 million, or 3.2% of net revenue, compared to $46.6 million, or 3.2% of net revenue for fiscal 2017, and $43.4 million, or 3.1% of net revenue, for fiscal 2016.
Financing activities
Net cash provided by financing activities was $43.4 million for fiscal 2018 compared to cash used in financing activities of $14.7 million in fiscal 2017 and $10.7 million in fiscal 2016. The net cash provided by financing activities during fiscal 2018 was primarily attributable to the proceeds of the incremental term loan of $75.0 million which were used for the acquisition of Mentis, partially offset by the use of cash to purchase common stock under the stock repurchase program.
48
The net cash used in financing activities during fiscal 2017 and fiscal 2016 was primarily attributable to cash paid to settle acquisition contingent consideration and principal payments on the Company's long-term debt.
During fiscal 2018, 2017 and 2016, we borrowed an aggregate of $659.3 million, $7.3 million, and $52.2 million, respectively, under our senior revolver, all of which was repaid during the same periods.
At September 30, 2018, we had no outstanding loans and $157.1 million of availability under the senior revolver due to $2.9 million in standby letters of credit issued under the senior revolver. Letters of credit can be issued under our institutional letter of credit facility up to the $50.0 million limit, subject to certain maintenance and issuance limitations and letters of credit in excess of that amount reduce availability under our senior revolver. At September 30, 2018, $48.5 million of letters of credit were issued under the institutional letter of credit facility and $2.9 million of letters of credit were issued under the senior revolver.
We believe that available borrowings under our senior revolver and cash flow from operations will provide sufficient liquidity and capital resources to meet our financial obligations for the next twelve months, including scheduled principal and interest payments, as well as to provide funds for working capital, acquisitions, capital expenditures and other needs. No assurance can be given, however, that this will be the case.
Debt and Financing Arrangements
Senior Secured Credit Facilities
NMHI and NMHH, wholly owned subsidiaries of Civitas, have a senior credit facility that includes a term loan facility with a stated principal amount of $730.0 million (original $655.0 million term loan plus a $75.0 million incremental term loan funded on October 25, 2017) and a revolving credit facility of $160.0 million. In connection with the facility, NMHI has deposited $50.0 million into a restricted cash account as collateral to support the issuance of letters of credit. As of September 30, 2018, $157.1 million was available for borrowing under the revolving credit facility and the remainder, or $2.9 million, was utilized to support letter of credit.
On October 24, 2017, NMHI entered into Amendment No. 6 to its senior credit agreement which provided for an incremental $75.0 million term loan. The net proceeds of the incremental term loan were used by the Company for the acquisition of Mentis, with any excess proceeds used for general corporate purposes.
On November 21, 2017, NMHI entered into Amendment No. 7 to its senior credit agreement which increased the aggregate revolving commitments from $120.0 million to $160.0 million and extended the maturity date for $90.0 million of the revolving commitments (the “Extended Revolving Commitments") to January 31, 2021. The terms of the remaining $70.0 million of the revolving commitments (the "Initial Revolving Commitments"), which mature on January 31, 2019, remain unchanged. All of the other terms of the Extended Revolving Commitments are identical to the Initial Revolving Commitments, except that the applicable margin for the Extended Revolving Commitments will decrease by 0.25% per annum when the Initial Revolving Commitments are terminated or expire.
Borrowings under the term loan facility bear interest, at our option, at: (i) an alternate base rate ("ABR") equal to the greater of (a) the prime rate of Barclays Bank PLC, (b) the federal funds rate plus 1/2 of 1.0%, and (c) the Eurodollar rate for an interest period of one-month plus 100 basis points (provided that the ABR applicable to the term loan facility will not be less than 2.00% per annum), plus 2.00%; or (ii) the Eurodollar rate (provided that the Eurodollar rate applicable to the term loan facility will not be less than 0.75% per annum), plus 3.00%. Borrowings under the revolving and swingline loans bear interest at our option at (i) an ABR equal to the greater of (a) the prime rate of Barclays Bank PLC, (b) the federal funds rate plus 1/2 of 1.0%, and (c) the Eurodollar rate for an interest period of one-month plus 100 basis points (provided that the ABR applicable to the term loan facility will not be less than 2.00% per annum), plus 2.25%; or (ii) the Eurodollar rate (provided that the Eurodollar rate applicable to the term loan facility will not be less than 0.75% per annum), plus 3.25%. NMHI is also required to pay a commitment fee to the lenders under the senior revolver at an initial rate of 0.50% of the average daily unutilized commitments thereunder. NMHI must also pay customary letter of credit fees.
As of September 30, 2018, the Company had $700.1 million in term loans outstanding with an average borrowing rate of 5.39%. In addition, the Company has entered into two interest rate swaps on $375.0 million of the term loan principal to effectively fix the interest rate on this portion of the borrowings to 4.80%.
Covenants
49
The senior credit agreement also contains a number of covenants that, among other things, restrict, subject to certain exceptions, NMHI’s ability and the ability of its subsidiaries to: (i) incur additional indebtedness; (ii) create liens on assets; (iii) engage in mergers or consolidations; (iv) sell assets; (v) pay dividends and distributions or repurchase our capital stock; (vi) enter into swap transactions; (vii) make investments, loans or advances; (viii) repay certain junior indebtedness; (ix) engage in certain transactions with affiliates; (x) enter into sale and leaseback transactions; (xi) amend material agreements governing certain of our junior indebtedness; (xii) change our lines of business; (xiii) make certain acquisitions; and (xiv) limitations on the letter of credit cash collateral account. If we withdraw any of the $50.0 million from the cash collateral account supporting the issuance of letters of credit, we must use the cash to either prepay the term loan facility or to secure any other obligations under the senior secured credit facilities in a manner reasonably satisfactory to the administrative agent. We were in compliance with these covenants as of September 30, 2018. The senior credit agreement contains customary affirmative covenants and events of default.
The senior credit agreement contains a springing financial covenant. If, at the end of any fiscal quarter, NMHI's usage of the senior revolver exceeds 30% of the commitments thereunder, NMHI is required to maintain at the end of each such fiscal quarter a consolidated first lien leverage ratio of not more than 5.00 to 1.00. The springing financial covenant was not in effect as of September 30, 2018 as our usage of the senior revolver did not exceed the threshold for that quarter.
Contractual Commitments Summary
The following table summarizes our contractual obligations and commitments as of September 30, 2018:
Total | Less Than 1 Year | 1-3 Years | 3-5 Years | More Than 5 Years | |||||||||||||||
(In thousands) | |||||||||||||||||||
Long-term debt obligations (1) | $ | 788,623 | $ | 45,416 | $ | 743,207 | $ | — | $ | — | |||||||||
Operating lease obligations (2) | 373,790 | 75,606 | 116,839 | 76,085 | 105,260 | ||||||||||||||
Capital lease obligations | 19,731 | 1,882 | 3,823 | 3,149 | 10,877 | ||||||||||||||
Purchase obligations (3) | 11,940 | 4,990 | 6,060 | 890 | — | ||||||||||||||
Standby letters of credit | 51,409 | 51,409 | — | — | — | ||||||||||||||
Total obligations and commitments | $ | 1,245,493 | $ | 179,303 | $ | 869,929 | $ | 80,124 | $ | 116,137 | |||||||||
________________________
(1) | Represents the principal amount of our long-term debt and the expected cash payments for interest on our long-term debt based on the interest rates in place and amounts outstanding at September 30, 2018. The interest payments do not reflect the projected impact of interest rate swap agreements. The principal and interest payments are due in quarterly installments through January 31, 2021. The senior credit agreement requires us to make mandatory prepayments, subject to certain exceptions, with 50% of our annual excess cash flow, as defined in the agreement, 100% of net cash proceeds of all non-ordinary course assets sales or other dispositions of property, and 100% of the net cash proceeds of any debt incurrence, other than debt permitted under the senior credit agreement. The obligations included in the table above do not include mandatory prepayments. |
(2) | Includes the fixed rent payable under the leases and does not include additional amounts, such as taxes, that may be payable under the leases. |
(3) | Represents purchase obligations related to information technology services and maintenance contracts. |
Inflation
We do not believe that general inflation in the U.S. economy has had a material impact on our financial position or results of operations.
Off-Balance Sheet Arrangements
We do not have any off-balance sheet transactions or interests.
Critical Accounting Policies
Our discussion and analysis of our financial condition and results of operations are based upon our consolidated financial statements, which have been prepared in accordance with generally accepted accounting principles (“GAAP”). The
50
preparation of financial statements in conformity with GAAP requires management to make estimates and assumptions that affect the reported amounts of assets and liabilities and disclosure of contingent assets and liabilities at the date of the financial statements and the reported amounts of revenue and expenses during the reporting period. Actual results could differ from those estimates.
We believe our application of accounting policies, and the estimates inherently required therein, are reasonable. These accounting policies and estimates are constantly reevaluated, and adjustments are made when facts and circumstances dictate a change.
The following critical accounting policies affect our more significant judgments and estimates used in the preparation of our financial statements.
Revenue Recognition
Revenue is reported net of allowances (discussed below) and state provider taxes. Revenue is recognized when evidence of an arrangement exists, the service has been provided, the price is fixed or determinable and collectability is reasonably assured.
Generally, we recognize revenue for services when earned. Our services fall into two general categories: residential and non-residential. In residential services, we are providing a living environment, usually a community residence, to an individual and providing support on a 24-hour basis. Non-residential services are provided to an individual on an hourly (or other unit of time) basis for therapy, community support or in our day program centers. Revenues for residential services are recognized for the number of days in the accounting period that the individual is in our service. Periodic service revenue is recognized when the related services are performed.
In addition, we operate under four distinct types of contracting arrangements with our payors:
• | Negotiated Contracts - for these contracts, services are priced pursuant to a “plan of care” for the individual which encompasses habilitation and therapies. Such contracts are not subject to retroactive adjustment or cost reimbursement requirements. However, there may be instances where rates are adjusted based upon a change in circumstances with a particular individual or in situations where additional services are needed. Subsequent adjustments to rates, if any, are recognized when approved by the payor. For fiscal years ended 2016, 2017 and 2018, 30.2%, 31.3% and 32.9% respectively, of our revenues were earned from contracts that fall into this category. |
• | Fixed Fee Contracts - - for these contracts, payors set a standard rate or set of rates for a particular service usually dependent on the acuity of the individual being served. These rates are the same for all agencies providing the service. For these contract types, there is generally no cost report required and we recognized revenue at the standard rate as earned. For fiscal years ended 2016, 2017 and 2018, 51.6%, 53.7% and 55.8%, respectively, of our revenues were earned from contracts that fall into this category. |
• | Retrospective Reimbursement Contracts - for these contracts, a provisional rate is set for the year pending the filing of an annual cost report that may further adjust that rate. Cost reimbursement rules differ by jurisdiction and program type. Revenue under these contracts is limited to the allowable costs under the contract. To the extent revenue exceeds the allowable costs it is deferred and reimbursed to the payor at the end of fiscal year. For fiscal years ended 2016, 2017 and 2018, 10.1%, 7.6% and 4.9%, respectively, of our revenues were earned from contracts that fall into this category. |
• | Prospective Payment Contracts - these contracts are cost reported in the same way as retrospective contracts, except the cost report for the annual period is used to set the rates in a future period. For these contracts, changes in rates are recognized in revenue prospectively. For fiscal years ended 2016, 2017 and 2018, 8.1%, 7.4% and 6.4%, respectively, of our revenues were earned from contracts that fall into this category. |
All four types of contracting arrangements are subject to audit by the payor and may be subject to recoupments of revenue if in performing our services we have not adhered to the terms of the contract, or not documented our services as specified by the payor. For fiscal years ended 2016, 2017 and 2018, liabilities to payors for cost based contracts were $6.5 million, $6.9 million and $6.7 million, respectively.
51
Non Authorized Sales Allowance. The individuals we support are generally long-term recipients of our services and require continuous support. The majority of the services are paid for through state Medicaid programs. When we enter into an arrangement to provide services to an individual, we obtain an “authorization” to provide services for a specified period of time such as a six months or one year. When an authorization expires we generally do not discontinue providing service to the individuals we support and in some cases are prevented from doing so legally. Therefore, it is not uncommon for us to serve an individual without a current authorization. In this situation we determine whether a non-authorized sales allowance is required by whether the lapse in authorization is within the documented customary business practice period that we have established for that particular payor. Once the lapse in authorization extends beyond the normal period for that payor, we adjust the non-authorized sales allowance to reserve the revenue. As of September 30, 2016, 2017 and 2018, our non-authorized sales allowance was $2.8 million, $2.9 million and $5.2 million, respectively.
Goodwill and Indefinite-lived Intangible Assets
We review goodwill and indefinite-lived intangible assets for impairment annually, as of July 1st, or whenever events or changes in circumstances indicate the carrying value of these assets may not be recoverable to determine whether any impairment exists, and, if so, the extent of such impairment. Our goodwill balance represents the difference between the purchase price of acquired businesses and the fair value of the identifiable tangible and intangible net assets when accounted for using the purchase method of accounting. We test goodwill at the reporting unit level, which is the same level as our operating segments. We have the option to first assess qualitative factors to determine whether further impairment testing is necessary. We have elected to bypass the qualitative assessments. The goodwill impairment test consists of comparing the fair value of the Company's reporting units with the carrying values. We estimated the fair value of each of our reporting units using the income approach. The income approach is based on a discounted cash flow analysis and calculates the fair value of a reporting unit by estimating the after–tax cash flows attributable to a reporting unit and then discounting them to a present value using a risk-adjusted discount rate. The discount rates, which are intended to reflect the risks inherent in future cash flow projections used in the discounted cash flow analysis, are based on estimates of the weighted average costs of capital of market participants relative to each respective reporting unit. In our discounted cash flow analysis, we forecasted cash flows by reporting unit for each of the next ten years and applied a long term growth rate to the final years of the forecasted cash flows to estimate terminal value. The cash flows were then discounted to a present value using the risk-adjusted discount rate. If the carrying amount of the reporting unit exceeds its estimated fair value we recognize an impairment charge for the amount by which the carrying amount exceeds the reporting unit's fair value. The loss recognized for the impairment charges is limited to the total amount of goodwill allocated to the respective reporting unit.
Our indefinite-lived intangible assets primarily consist of trade names acquired in business combinations. For these assets, we have the option to first assess qualitative factors to determine whether further impairment testing is necessary. The Company has elected to bypass the qualitative assessments and proceed directly to the quantitative impairment test. The impairment test for indefinite-lived intangible assets requires the determination of the fair value of the intangible asset. If the fair value of the indefinite-lived intangible asset is less than its carrying value, an impairment loss is recognized in an amount equal to the difference. Fair values are established using the relief from royalty method.
The estimated fair values of our reporting units and indefinite-lived intangibles are based on discounted estimated future cash flows. The discounted cash flow analysis requires significant judgment, including judgments about the appropriate discount rates and terminal values, future growth, capital expenditures and market conditions over the estimated remaining operating period. As such, actual results may differ from these estimates and lead to a revaluation of our goodwill and indefinite-lived intangible assets. If updated estimates indicate that the fair value of goodwill or any indefinite-lived intangibles is less than the carrying value of the asset, an impairment charge is recorded in the consolidated statements of income in the period of the change in estimate.
We completed our annual impairment tests in the fourth quarter of fiscal 2018, 2017 and 2016. It was determined in fiscal 2018 that the carrying value of goodwill and indefinite-lived assets was not impaired. In fiscal 2017 and fiscal 2016, the fair value of each of our reporting units was in excess of its carrying value and passed with a substantial margin, except for the ADH reporting unit. In fiscal 2017, our annual impairment test as of July 1, 2017, indicated that the fair value of the ADH reporting unit, that is included within Corporate and Other, was less than its carrying value. As a result, we recognized a goodwill impairment charge of $28.0 million, which is included in Goodwill and intangible asset impairment in the statement of income for the year ended September 30, 2017. The goodwill impairment was attributable to a reduction in the profit projections of the core ADH business and a decrease in the forecasted contributions from future new start programs as compared to the prior year's projections. In addition, as a result of our decision in the fourth quarter of fiscal 2017 to phase in one national brand name for the ADH business we concluded that the useful lives of the indefinite-lived ADH trade names are no longer indefinite. We performed an impairment test using the relief from royalty method over the remaining useful life of one year. The impairment test indicated that the $3.4 million carrying value of the indefinite-lived ADH trade names exceeded
52
its fair value, resulting in an impairment charge of $3.0 million which is included in Goodwill and intangible asset impairment in the statement of income for the year ended September 30, 2017. In fiscal 2016, our annual impairment test as of July 1, 2016 indicated that the fair value of the ADH reporting unit, that is included within Corporate and Other, was less than its carrying value. As a result an impairment charge of $10.3 million, which is included in Goodwill and intangible asset impairment in the statement of income, was recorded during the year ended September 30, 2016. The impairment was primarily due to higher than anticipated operating costs in a recently acquired business that have negatively affected the reporting unit's projected operating margins.
Since our annual goodwill impairment test on July 1, 2018, no triggering events have come to our attention pursuant to our review of goodwill that indicated a test for impairment is necessary as of September 30, 2018.
Impairment of Long-Lived Assets
Intangible assets with finite lives consist of agency contracts, acquired licenses and permits and non-competition agreements and are valued according to the future cash flows they are estimated to produce. Tangible assets with finite lives consist of property and equipment, which are depreciated over their estimate useful lives. We review these long-lived assets for impairment by continually evaluating whether circumstances indicate the carrying amount of an asset may not be recoverable based on the undiscounted future cash flows of the asset. If the carrying amount of the asset is determined not to be recoverable, a write-down to fair value is recorded.
Accruals for Self-Insurance
We maintain insurance for professional and general liability, workers’ compensation, automobile liability and health insurance with policies that include self-insured retentions. Employment practices liability is fully self-insured. We record expenses related to claims on an incurred basis, which includes estimates of fully developed losses for both reported and unreported claims. The accruals for the health, workers’ compensation, automobile, employment practices liability and professional and general liability programs are based on analyses performed internally by management and for certain balances, take into account reports by independent third party actuaries.
We regularly analyze our reserves for incurred but not reported claims and for reported but not paid claims related to our self-insured retentions and fully self-insured programs. We believe our reserves are adequate. However, significant judgment is involved in assessing these reserves, such as assessing historical paid claims, average lags between the claims’ incurred date, reported dates and paid dates and the frequency and severity of claims. There may be differences between actual settlement amounts and recorded reserves and any resulting adjustments are included in expense once a probable amount is known. Any significant increase in the number of claims or costs associated with claims made under these programs above our reserves could have a material adverse effect on our financial results.
Legal Contingencies
We are regularly involved in litigation and regulatory proceedings in the operation of our business. We reserve for costs related to contingencies when a loss is probable and the amount is reasonably estimable. While we believe our provision for legal contingencies is adequate, the outcome of our legal proceedings is difficult to predict, and we may settle legal claims or be subject to judgments for amounts that materially differ from our estimates. In addition, legal contingencies could have a material adverse impact on our results of operations in any given future reporting period. See “Risk Factors” and “Business—Legal Proceedings” for additional information.
Item 7A. Quantitative and Qualitative Disclosures about Market Risk
We are exposed to changes in interest rates as a result of our outstanding variable rate debt. As of May 25, 2017
pursuant to an amendment to the senior credit agreement, the term loan bears interest at (i) a rate equal to the greater of (a) the prime rate, (b) the federal funds rate plus 1/2 of 1% and (c) the Eurodollar rate for an interest period of one-month beginning on such day plus 100 basis points plus 2.00%; or (ii) the Eurodollar rate for a one, two, three or six month period at our option (subject to a LIBOR floor of 0.75%); plus 3.00%. A 1% increase in the interest rate on our floating rate debt as of
September 30, 2018 would have increased cash interest expense on the floating rate debt by approximately $7.1 million per annum, without giving effect to the interest rate swap agreements discussed below.
To reduce the interest rate exposure related to our variable debt, NMHI entered into two interest rate swaps in an aggregate notional amount of $375.0 million, effective on January 20, 2015. Under the terms of the swaps, we receive from the counterparty a quarterly payment based on a rate equal to the greater of 3-month LIBOR or 1.00% per annum, and we make payments to the counterparty based on a fixed rate of 1.795% per annum, in each case on the notional amount of $375.0 million, settled on a net payment basis.
Item 8. | Financial Statements and Supplementary Data |
Our consolidated financial statements required by this Item are on pages F-1 through F-37 of this report.
Item 9. | Changes in and Disagreements with Accountants on Accounting and Financial Disclosure |
Not applicable.
Item 9A. | Controls and Procedures |
(a) Evaluation of Disclosure Controls and Procedures
We maintain disclosure controls and procedures (as defined in Rule 13a-15(e) under the Securities Exchange Act of 1934, as amended (the “Exchange Act”), that are intended to ensure that information that would be required to be disclosed in Exchange Act reports is recorded, processed, summarized and reported within the time periods specified in the SEC’s rules and forms, and that such information is accumulated and communicated to our management, including the Chief Executive Officer and the Chief Financial Officer, as appropriate, to allow timely decisions regarding required disclosure.
We carried out an evaluation, under the supervision, and with the participation of our management, including our Chief Executive Officer and Chief Financial Officer, of the effectiveness of the design and operation of our disclosure controls and procedures as of September 30, 2018. Based on this evaluation, our Chief Executive Officer and Chief Financial Officer concluded that our disclosure controls and procedures were effective as of September 30, 2018.
(b) Management’s Report on Internal Control Over Financial Reporting
Management of the Company is responsible for establishing and maintaining adequate internal control over financial reporting. Internal control over financial reporting is defined in Rule 13a-15(f) promulgated under the Exchange Act as a process, designed by, or under the supervision of the Company’s principal executive and principal financial officer and effected by the Company’s Board of Directors, management and other personnel, to provide reasonable assurance regarding the reliability of financial reporting and the preparation of financial statements for external purposes in accordance with accounting principles generally accepted in the United States of America. Internal control over financial reporting includes maintaining records that in reasonable detail accurately and fairly reflect our transactions and disposition of assets; providing reasonable assurance that transactions are recorded as necessary for preparation of our financial statements; providing reasonable assurance that receipts and expenditures are made only in accordance with management and Board authorizations; and providing reasonable assurance regarding prevention or timely detection of unauthorized acquisition, use or disposition of our assets that could have a material effect on our financial statements.
Because of its inherent limitations, internal control over financial reporting is not intended to provide absolute assurance that a misstatement of our financial statements would be prevented or detected. Also, projections of any evaluation of effectiveness to future periods are subject to the risk that controls may become inadequate because of changes in conditions or that the degree of compliance with policies or procedures may deteriorate.
Management, with the participation of the Company’s principal executive and principal financial officers, conducted an evaluation of the effectiveness of our internal control over financial reporting as of September 30, 2018 based on the framework and criteria established in Internal Control - Integrated Framework (2013) issued by the Committee of Sponsoring Organizations of the Treadway Commission. This evaluation included review of the documentation of controls, evaluation of the design effectiveness of controls, testing of the operating effectiveness of controls and a conclusion on this evaluation. Based on the foregoing, management concluded that the Company’s internal control over financial reporting was effective as of September 30, 2018.
53
Our internal control over financial reporting as of September 30, 2018, has been audited by Deloitte & Touche LLP, an independent registered public accounting firm, as stated in their report, which follows below.
(c) Changes in Internal Control over Financial Reporting
There was no change in our internal control over financial reporting (as defined in Rules 13a-15(f) of the Exchange Act) that occurred during the quarter ended September 30, 2018 which has materially affected, or is reasonably likely to materially affect, our internal control over financial reporting.
54
REPORT OF INDEPENDENT REGISTERED PUBLIC ACCOUNTING FIRM
To the Board of Directors and Stockholders of Civitas Solutions, Inc.
Opinion on Internal Control over Financial Reporting
We have audited the internal control over financial reporting of Civitas Solutions and subsidiaries (the “Company”) as of September 30, 2018, based on criteria established in Internal Control - Integrated Framework (2013) issued by the Committee of Sponsoring Organizations of the Treadway Commission (COSO). In our opinion, the Company maintained, in all material respects, effective internal control over financial reporting as of September 30, 2018, based on criteria established in Internal Control - Integrated Framework (2013) issued by COSO.
We have also audited, in accordance with the standards of the Public Company Accounting Oversight Board (United States) (PCAOB), the consolidated financial statements and financial statement schedule as of and for the year ended September 30, 2018, of the Company and our report dated December 13, 2018 expressed an unqualified opinion on those financial statements and financial statement schedule.
Basis for Opinion
The Company’s management is responsible for maintaining effective internal control over financial reporting and for its assessment of the effectiveness of internal control over financial reporting, included in the accompanying Management’s Report on Internal Control Over Financial Reporting. Our responsibility is to express an opinion on the Company’s internal control over financial reporting based on our audit. We are a public accounting firm registered with the PCAOB and are required to be independent with respect to the Company in accordance with the U.S. federal securities laws and the applicable rules and regulations of the Securities and Exchange Commission and the PCAOB.
We conducted our audit in accordance with the standards of the PCAOB. Those standards require that we plan and perform the audit to obtain reasonable assurance about whether effective internal control over financial reporting was maintained in all material respects. Our audit included obtaining an understanding of internal control over financial reporting, assessing the risk that a material weakness exists, testing and evaluating the design and operating effectiveness of internal control based on the assessed risk, and performing such other procedures as we considered necessary in the circumstances. We believe that our audit provides a reasonable basis for our opinion.
Definition and Limitations of Internal Control over Financial Reporting
A company’s internal control over financial reporting is a process designed to provide reasonable assurance regarding the reliability of financial reporting and the preparation of financial statements for external purposes in accordance with generally accepted accounting principles. A company’s internal control over financial reporting includes those policies and procedures that (1) pertain to the maintenance of records that, in reasonable detail, accurately and fairly reflect the transactions and dispositions of the assets of the company; (2) provide reasonable assurance that transactions are recorded as necessary to permit preparation of financial statements in accordance with generally accepted accounting principles, and that receipts and expenditures of the company are being made only in accordance with authorizations of management and directors of the company; and (3) provide reasonable assurance regarding prevention or timely detection of unauthorized acquisition, use, or disposition of the company’s assets that could have a material effect on the financial statements.
Because of its inherent limitations, internal control over financial reporting may not prevent or detect misstatements. Also, projections of any evaluation of effectiveness to future periods are subject to the risk that controls may become inadequate because of changes in conditions, or that the degree of compliance with the policies or procedures may deteriorate.
/s/ DELOITTE & TOUCHE LLP
Boston, Massachusetts
December 13, 2018
Item 9B. | Other Information |
55
On December 7, 2018, the Compensation Committee of the Board of Directors of the Company approved an increase in the base salary of Brett I. Cohen, the Company’s Chief Operating Officer, from $365,000 to $400,000, effective as of January 1, 2019.
56
PART III
Item 10. | Directors, Executive Officers and Corporate Governance |
The response to this item will be included under the sections entitled “Proposal 1 - Election of Directors,” “Corporate Governance,” and “Stock Ownership - Section 16(a) Beneficial Ownership Reporting Compliance" contained in the proxy statement for our 2019 annual meeting of stockholders to be filed with the SEC no later than 120 days after the end of the fiscal year and is incorporated herein by reference.
Item 11. | Executive Compensation |
The response to this item will be included under the sections entitled “Executive Compensation and Related Information" and “Corporate Governance” contained in the proxy statement for our 2019 annual meeting of stockholders to be filed with the SEC no later than 120 days after the end of the fiscal year and is incorporated herein by reference.
Item 12. | Security Ownership of Certain Beneficial Owners and Management and Related Stockholder Matters |
The response to this item will be included under the sections entitled “Stock Ownership” and “Equity Compensation Plan Information” contained in the proxy statement for our 2019 annual meeting of stockholders to be filed with the SEC no later than 120 days after the end of the fiscal year and is incorporated herein by reference.
Item 13. | Certain Relationships and Related Transactions, and Director Independence |
The response to this item will be included under the sections entitled “Certain Relationships and Related Person Transactions" and “Corporate Governance" contained in the proxy statement for our 2019 annual meeting of stockholders to be filed with the SEC no later than 120 days after the end of the fiscal year and is incorporated herein by reference.
Item 14. | Principal Accounting Fees and Services |
The response to this item will be included under the sections entitled “Audit Committee" contained in the proxy statement for our 2019 annual meeting of stockholders to be filed with the SEC no later than 120 days after the end of the fiscal year and is incorporated herein by reference.
57
PART IV
Item 15. | Exhibits and Financial Statement Schedules |
(a)(1) Financial Statements
The following consolidated financial statements on pages F-1 through F-37 are filed as part of this report.
• | Consolidated Balance Sheets as of September 30, 2018 and 2017; |
• | Consolidated Statements of Income for the years ended September 30, 2018, 2017 and 2016; |
• | Consolidated Statements of Comprehensive Income for the years ended September 30, 2018, 2017 and 2016; |
• | Consolidated Statements of Stockholders' Equity for the years ended September 30, 2018, 2017 and 2016; and |
• | Consolidated Statements of Cash Flows for the years ended September 30, 2018, 2017 and 2016. |
(2) Financial Statement Schedules: The following schedule is filed herewith pursuant to the requirements of Regulation S-X beginning on page F-38.
Schedule | Description | |
I | Condensed Parent Company Financial Information | |
(3) Exhibits: The Exhibit Index is incorporated by reference herein.
58
SIGNATURES
Pursuant to the requirements of Section 13 or 15(d) of the Securities Exchange Act of 1934, the registrant has duly caused this report to be signed on its behalf by the undersigned, thereunto duly authorized.
Civitas Solutions, Inc. | ||
By: | /s/ Bruce F. Nardella | |
Bruce F. Nardella | ||
Its: Chief Executive Officer, President & Chair of the Board of Directors | ||
Date: December 13, 2018
Pursuant to the requirements of the Securities Exchange Act of 1934, this report has been signed below as of December 13, 2018 by the following persons on behalf of the registrant and in the capacities indicated.
Signature | Title |
/s/ Bruce F. Nardella | Chief Executive Officer |
Bruce F. Nardella | (principal executive officer) and Chair of the Board of Directors |
/s/ Denis M. Holler | Chief Financial Officer |
Denis M. Holler | (principal financial officer and principal accounting officer) |
/s/ Chris A. Durbin | Director |
Chris A. Durbin | |
/s/ James L. Elrod, Jr. | Director |
James L. Elrod, Jr. | |
/s/ Patrick M. Gray | Director |
Patrick M. Gray | |
/s/ Pamela F. Lenehan | Director |
Pamela F. Lenehan | |
/s/ Robert L. Rosner | Director |
Robert L. Rosner | |
/s/ Gregory S. Roth | Director |
Gregory S. Roth | |
/s/ Guy Sansone | Director |
Guy Sansone | |
/s/ Mary Ann Tocio | Director |
Mary Ann Tocio | |
59
EXHIBIT INDEX
Exhibit No. | Description | |||
Incorporated by reference to Exhibit 2.1 of National Mentor Holdings, Inc. Form S-4 Registration Statement (Registration No. 333-138362) filed on November 1, 2006 | ||||
Incorporated by reference to Civitas Solutions, Inc. Amendment No. 3 to Form S-1 Registration Statement (Registration No. 333-196281) filed on August 27, 2014 | ||||
Incorporated by reference to Civitas Solutions, Inc. Amendment No. 3 to Form S-1 Registration Statement (Registration No. 333-196281) filed on August 27, 2014 | ||||
Incorporated by reference to Civitas Solutions, Inc. Amendment No. 3 to Form S-1 Registration Statement (Registration No. 333-196281) filed on August 27, 2014 | ||||
Incorporated by reference to Exhibit 10.4 of the National Mentor Holdings, Inc. Form 10-Q for the quarterly period ended March 31, 2014 (the “March 2014 10-Q”) | ||||
Incorporated by reference to Exhibit 10.5 of the March 2014 10-Q | ||||
60
Exhibit No. | Description | |||
Incorporated by reference to Exhibit 10.3 of the Civitas Solutions, Inc. Form 10-K filed December 17, 2014 | ||||
Incorporated by reference to Exhibit 10.1 to National Mentor Holdings, Inc. Form 8-K filed October 23, 2014 | ||||
Incorporated by reference to Exhibit 10.43 to Civitas Solutions, Inc. Form 10-Q filed May 12, 2015. | ||||
Incorporated by reference to Exhibit 10.1 of National Mentor Holdings, Inc. Form 10-Q for the quarterly period ended December 31, 2008 | ||||
Incorporated by reference to Exhibit 10.11 of National Mentor Holdings, Inc. Form 10-K for the fiscal year ended September 30, 2009 (the “2009 10-K”) | ||||
Incorporated by reference to Exhibit 10.8.1 of National Mentor Holdings, Inc. Form 10-K for the fiscal year ended September 30, 2011 | ||||
Incorporated by reference to Exhibit 10.13 of the 2009 10-K | ||||
Incorporated by reference to Exhibit 10.17 of National Mentor Holdings, Inc. Form S-4/A Amendment No. 1 to the Registration Statement (Registration No. 333-138362) filed on January 12, 2007 (the “S-4/A”) | ||||
Incorporated by reference to Exhibit 10.1 of National Mentor Holdings, Inc. Form 10-Q for the quarterly period ended June 30, 2008 | ||||
Incorporated by reference to Exhibit 10.6 of National Mentor Holdings, Inc. Form 10-Q for the quarterly period ended March 31, 2011 (the “March 2011 10-Q”) | ||||
Incorporated by reference to Exhibit 10.1 of National Mentor Holdings, Inc. Form 10-Q for the quarterly period ended June 30, 2012 (the “June 2012 10-Q”) | ||||
61
Exhibit No. | Description | |||
Incorporated by reference to Exhibit 10.15 of the S-4/A | ||||
Incorporated by reference to Exhibit 10.19 of the 2009 10-K | ||||
Incorporated by reference to Exhibit 10.7 of the March 2011 10-Q | ||||
Incorporated by reference to Exhibit 10.2 of the June 2012 10-Q | ||||
Incorporated by reference to Exhibit 10.3 of the June 2012 10-Q | ||||
Incorporated by reference to Exhibit 10.13 of National Mentor Holdings, Inc. Form 10-K for the fiscal year ended September 30, 2008 | ||||
Incorporated by reference to Exhibit 10.21 of the 2009 10-K | ||||
Incorporated by reference to Civitas Solutions, Inc. Amendment No. 3 to Form S-1 Registration (Registration No. 333-196281) filed on August 27, 2014 | ||||
Incorporated by reference to Civitas Solutions, Inc. Amendment No. 3 to Form S-1 Registration Statement (Registration No. 333-196281) filed on August 27, 2014 | ||||
Incorporated by reference to Civitas Solutions, Inc. Amendment No. 1 to Form S-1 Registration Statement (Registration No. 333-196281) filed on July 16, 2014. | ||||
Incorporated by reference to Civitas Solutions, Inc. Amendment No. 1 to Form S-1 Registration Statement (Registration No. 333-196281) filed on July 16, 2014. | ||||
Incorporated by reference to Civitas Solutions, Inc. Amendment No. 1 to Form S-1 Registration Statement (Registration No. 333-196281) filed on July 16, 2014. | ||||
Incorporated by reference to Exhibit 10.1 of Civitas Solutions, Inc. Current Report on Form 8-K filed on October 2, 2015 | ||||
Incorporated by reference to Civitas Solutions, Inc. Amendment No. 4 to Form S-1 Registration Statement (Registration No. 333-196281) filed on September 3, 2014 | ||||
Incorporated by reference to Civitas Solutions, Inc. Amendment No. 4 to Form S-1 Registration Statement (Registration No. 333-196281) filed on September 3, 2014 | ||||
Incorporated by reference to Civitas Solutions, Inc. Amendment No. 4 to Form S-1 Registration Statement (Registration No. 333-196281) filed on September 3, 2014 | ||||
62
Exhibit No. | Description | |||
Incorporated by reference to Exhibit 10.3 of Civitas Solutions, Inc. Form 8-K filed on September 22, 2014 | ||||
Incorporated by reference to Exhibit 10.4 of Civitas Solutions, Inc. Form 8-K filed on September 22, 2014 | ||||
Incorporated by reference to Exhibit 10.5 of Civitas Solutions, Inc. Form 8-K filed on September 22, 2014 | ||||
Incorporated by reference to Exhibit 10.6 of Civitas Solutions, Inc. Form 8-K filed on September 22, 2014 | ||||
Incorporated by reference to Exhibit 10.7 of Civitas Solutions, Inc. Form 8-K filed on September 22, 2014 | ||||
Incorporated by reference to Civitas Solutions, Inc. Amendment No. 4 to Form S-1 Registration Statement (Registration No. 333-196281) filed on September 3, 2014 | ||||
Incorporated by reference to Exhibit 10.42 of the Civitas Solutions, Inc. Form 10-K for the fiscal year ended September 30, 2014 | ||||
Incorporated by reference to Civitas Solutions, Inc. Amendment No. 5 to Form S-1 Registration Statement (Registration No. 333-196281) filed on September 12, 2014 | ||||
Incorporated by reference to Civitas Solutions, Inc. Amendment No. 5 to Form S-1 Registration Statement (Registration No. 333-196281) filed on September 12, 2014 | ||||
Incorporated by reference to Exhibit 10.1 of Civitas Solutions, Inc. Form 8-K filed on August 20, 2015 | ||||
Incorporated by reference to Exhibit 10.1 of Civitas Solutions, Inc. Form 8-K filed on October 20, 2015 | ||||
Incorporated by reference to Exhibit 10.1 of Civitas Solutions, Inc. Form 8-K filed on January 13, 2016 | ||||
Incorporated by reference to Exhibit 10.1 of Civitas Solutions, Inc. Form 8-K filed on March 9, 2017 | ||||
63
Incorporated by reference to Exhibit 10.1 of Civitas Solutions, Inc. Form 8-K filed on May 26, 2017. | ||||
Incorporated by reference to Exhibit 10.44 of Civitas Solutions, Inc. Form 10-K filed on December 12, 2017. | ||||
Incorporated by reference to Exhibit 10.1 of Civitas Solutions, Inc. Form 8-K filed on October 26, 2017. | ||||
Incorporated by reference to Exhibit 10.1 of Civitas Solutions, Inc. Form 8-K filed on November 24, 2017. | ||||
Incorporated by reference to Exhibit 10.1 of Civitas Solution, Inc. Form 8-K filed on August 17, 2018 | ||||
64
Exhibit No. | Description | |||
Filed herewith | ||||
Filed herewith | ||||
Filed herewith | ||||
Filed herewith | ||||
Filed herewith | ||||
101.INS | XBRL Instance Document. | Filed herewith | ||
101.SCH | XBRL Taxonomy Extension Schema Document. | Filed herewith | ||
101.CAL | XBRL Taxonomy Extension Calculation Linkbase Document. | Filed herewith | ||
101.DEF | XBRL Taxonomy Extension Definition Linkbase Document. | Filed herewith | ||
101.LAB | XBRL Taxonomy Extension Label Linkbase Document. | Filed herewith | ||
101.PRE | XBRL Taxonomy Extension Presentation Linkbase Document. | Filed herewith | ||
* | Management contract or compensatory plan or arrangement. |
¥ | Schedules have been omitted pursuant to Item 601(b)(2) of Regulation S-K. The Company hereby undertakes to furnish supplemental copies of any of the omitted schedules upon request by the Securities and Exchange Commission. |
# | Indicates confidential portions have been omitted pursuant to a request for confidential treatment filed separately with SEC, which has been granted. |
65
Civitas Solutions, Inc.
Consolidated Financial Statements
Contents
Consolidated Financial Statements for the years ended September 30, 2018, 2017 and 2016 | |
F-1
REPORT OF INDEPENDENT REGISTERED PUBLIC ACCOUNTING FIRM
To the Board of Directors and Stockholders of Civitas Solutions, Inc.
Opinion on the Financial Statements
We have audited the accompanying consolidated balance sheets of Civitas Solutions, Inc. and subsidiaries (the "Company") as of September 30, 2018 and 2017, the related consolidated statements of income, comprehensive income, stockholders' equity, and cash flows, for each of the three years in the period ended September 30, 2018, and the related notes and the schedule listed in the Index at Item 15 (collectively referred to as the "financial statements"). In our opinion, the financial statements present fairly, in all material respects, the financial position of the Company as of September 30, 2018 and 2017 and the results of its operations and its cash flows for each of the three years in the period ended September 30, 2018, in conformity with accounting principles generally accepted in the United States of America.
We have also audited, in accordance with the standards of the Public Company Accounting Oversight Board (United States) (PCAOB), the Company's internal control over financial reporting as of September 30, 2018, based on criteria established in Internal Control - Integrated Framework (2013) issued by the Committee of Sponsoring Organizations of the Treadway Commission and our report dated December 13, 2018 expressed an unqualified opinion on the Company's internal control over financial reporting.
Basis for Opinion
These financial statements are the responsibility of the Company's management. Our responsibility is to express an opinion on the Company's financial statements based on our audits. We are a public accounting firm registered with the PCAOB and are required to be independent with respect to the Company in accordance with the U.S. federal securities laws and the applicable rules and regulations of the Securities and Exchange Commission and the PCAOB.
We conducted our audits in accordance with the standards of the PCAOB. Those standards require that we plan and perform the audit to obtain reasonable assurance about whether the financial statements are free of material misstatement, whether due to error or fraud. Our audits included performing procedures to assess the risks of material misstatement of the financial statements, whether due to error or fraud, and performing procedures that respond to those risks. Such procedures included examining, on a test basis, evidence regarding the amounts and disclosures in the financial statements. Our audits also included evaluating the accounting principles used and significant estimates made by management, as well as evaluating the overall presentation of the financial statements. We believe that our audits provide a reasonable basis for our opinion.
/s/ DELOITTE & TOUCHE LLP
Boston, Massachusetts
December 13, 2018
We have served as the Company's auditor since 2010.
F-2
Civitas Solutions, Inc.
Consolidated Balance Sheets
(Amounts in thousands, except share amounts)
September 30, | |||||||
2018 | 2017 | ||||||
ASSETS | |||||||
Current Assets: | |||||||
Cash and cash equivalents | $ | 8,168 | $ | 7,297 | |||
Restricted cash | 333 | 327 | |||||
Accounts receivable, net of allowances of $20,229 and $15,997 at September 30, 2018 and 2017, respectively | 186,311 | 172,850 | |||||
Prepaid expenses and other current assets | 18,439 | 12,998 | |||||
Total current assets | 213,251 | 193,472 | |||||
Property and equipment, net | 196,992 | 183,338 | |||||
Intangible assets, net | 317,172 | 313,075 | |||||
Goodwill | 311,752 | 273,325 | |||||
Restricted cash | 50,000 | 50,000 | |||||
Other assets | 38,025 | 36,172 | |||||
Total assets | $ | 1,127,192 | $ | 1,049,382 | |||
LIABILITIES AND STOCKHOLDERS' EQUITY | |||||||
Current Liabilities: | |||||||
Accounts payable | $ | 38,669 | $ | 35,275 | |||
Accrued payroll and related costs | 82,820 | 78,011 | |||||
Other accrued liabilities | 43,864 | 42,284 | |||||
Obligations under capital lease, current | 781 | 608 | |||||
Current portion of long-term debt | 7,331 | 6,554 | |||||
Total current liabilities | 173,465 | 162,732 | |||||
Other long-term liabilities | 79,847 | 77,081 | |||||
Deferred tax liabilities, net | 8,122 | 22,349 | |||||
Obligations under capital lease, less current portion | 10,827 | 4,404 | |||||
Long-term debt, less current portion | 688,197 | 619,899 | |||||
Commitments and contingencies (Note 17) | |||||||
Stockholders' Equity | |||||||
Common stock, $0.01 par value; 350,000,000 shares authorized; and 36,116,252 and 37,441,257 shares issued and outstanding at September 30, 2018 and 2017, respectively | 360 | 374 | |||||
Additional paid-in capital | 286,897 | 301,819 | |||||
Accumulated gain (loss) on derivatives, net of tax expense (benefit) of $1,501 and ($62) at September 30, 2018 and September 30, 2017, respectively | 3,936 | (91 | ) | ||||
Accumulated deficit | (124,459 | ) | (139,185 | ) | |||
Total stockholders' equity | 166,734 | 162,917 | |||||
Total liabilities and stockholders' equity | $ | 1,127,192 | $ | 1,049,382 | |||
See accompanying notes to these consolidated financial statements.
F-3
Civitas Solutions, Inc.
Consolidated Statements of Income
(Amounts in thousands, except share and per share amounts)
Year Ended September 30, | |||||||||||
2018 | 2017 | 2016 | |||||||||
Net revenue | $ | 1,602,202 | $ | 1,474,510 | $ | 1,407,587 | |||||
Cost of revenue (exclusive of depreciation and amortization expense below) | 1,280,608 | 1,160,528 | 1,092,181 | ||||||||
Operating expenses: | |||||||||||
General and administrative | 171,803 | 166,376 | 174,398 | ||||||||
Goodwill and intangible asset impairment | — | 31,002 | 10,251 | ||||||||
Depreciation and amortization | 95,421 | 75,713 | 73,061 | ||||||||
Total operating expenses | 267,224 | 273,091 | 257,710 | ||||||||
Income from operations | 54,370 | 40,891 | 57,696 | ||||||||
Other income (expense): | |||||||||||
Other income (expense), net | (1,296 | ) | 710 | (908 | ) | ||||||
Interest expense | (38,792 | ) | (33,406 | ) | (34,041 | ) | |||||
Income from continuing operations before income taxes | 14,282 | 8,195 | 22,747 | ||||||||
Provision (benefit) for income taxes | (604 | ) | 1,864 | 13,290 | |||||||
Income from continuing operations | 14,886 | 6,331 | 9,457 | ||||||||
Loss from discontinued operations, net of tax benefit for the fiscal year ended September 30, 2016 of $171 | — | — | (270 | ) | |||||||
Net income | $ | 14,886 | $ | 6,331 | $ | 9,187 | |||||
Income per common share, basic and diluted | |||||||||||
Income from continuing operations | $ | 0.40 | $ | 0.17 | $ | 0.25 | |||||
Loss from discontinued operations | — | — | — | ||||||||
Net income | $ | 0.40 | $ | 0.17 | $ | 0.25 | |||||
Weighted average number of common shares outstanding, basic | 36,811,208 | 37,302,941 | 37,112,794 | ||||||||
Weighted average number of common shares outstanding, diluted | 36,945,408 | 37,466,325 | 37,262,915 | ||||||||
See accompanying notes to these consolidated financial statements.
F-4
Civitas Solutions, Inc.
Consolidated Statements of Comprehensive Income
(Amounts in thousands)
Year Ended September 30, | |||||||||||
2018 | 2017 | 2016 | |||||||||
Net income | $ | 14,886 | $ | 6,331 | $ | 9,187 | |||||
Other comprehensive income (loss), net of tax: | |||||||||||
Gain (loss) on derivative instrument classified as cash flow hedge, net of tax expense (benefit) of $1,563, $2,356 and ($1,261) for the fiscal years ended September 30, 2018, 2017, and 2016, respectively | 4,027 | 3,470 | (1,857 | ) | |||||||
Comprehensive income | $ | 18,913 | $ | 9,801 | $ | 7,330 | |||||
See accompanying notes to these consolidated financial statements.
F-5
Civitas Solutions, Inc.
Consolidated Statements of Stockholders’ Equity
(Amounts in thousands, except share amounts)
Common Stock | Additional Paid-in Capital | Accumulated Other Comprehensive Loss | Accumulated Deficit | Total Stockholder’s Equity | ||||||||||||||||||
Shares | Amount | |||||||||||||||||||||
Balance at September 30, 2015 | 37,093,237 | $ | 371 | $ | 277,311 | $ | (1,704 | ) | $ | (154,703 | ) | $ | 121,275 | |||||||||
Issuance of common stock under employee incentive plans, net of shares surrendered | 121,521 | 1 | (901 | ) | — | — | (900 | ) | ||||||||||||||
Other comprehensive loss, net of tax | — | — | — | (1,857 | ) | — | (1,857 | ) | ||||||||||||||
Stock-based compensation | — | — | 17,072 | — | — | 17,072 | ||||||||||||||||
Excess tax benefits from stock-based compensation awards | — | — | 813 | — | — | 813 | ||||||||||||||||
Net income | — | — | — | — | 9,187 | 9,187 | ||||||||||||||||
Balance at September 30, 2016 | 37,214,758 | 372 | 294,295 | (3,561 | ) | (145,516 | ) | 145,590 | ||||||||||||||
Issuance of common stock under employee incentive plans, net of shares surrendered | 226,499 | 2 | (562 | ) | — | — | (560 | ) | ||||||||||||||
Other comprehensive income, net of tax | — | — | — | 3,470 | — | 3,470 | ||||||||||||||||
Stock-based compensation | — | — | 8,441 | — | — | 8,441 | ||||||||||||||||
Tax shortfall from stock-based compensation awards | — | — | (355 | ) | — | — | (355 | ) | ||||||||||||||
Net income | — | — | — | — | 6,331 | 6,331 | ||||||||||||||||
Balance at September 30, 2017 | 37,441,257 | 374 | 301,819 | (91 | ) | (139,185 | ) | 162,917 | ||||||||||||||
Cumulative effect adjustment on adoption of ASU 2016-09, Compensation - Stock Compensation - Improvements to Employee Share-Based Payments Accounting | — | — | 219 | — | (160 | ) | 59 | |||||||||||||||
Issuance of common stock under employee incentive plans, net of shares surrendered | 145,780 | 1 | (1,154 | ) | — | — | (1,153 | ) | ||||||||||||||
Repurchase of common stock under stock repurchase program | (1,470,785 | ) | (15 | ) | (21,594 | ) | — | — | (21,609 | ) | ||||||||||||
Other comprehensive income, net of tax | — | — | — | 4,027 | — | 4,027 | ||||||||||||||||
Stock-based compensation | — | — | 7,607 | — | — | 7,607 | ||||||||||||||||
Net income | — | — | — | — | 14,886 | 14,886 | ||||||||||||||||
Balance at September 30, 2018 | 36,116,252 | $ | 360 | $ | 286,897 | $ | 3,936 | $ | (124,459 | ) | $ | 166,734 | ||||||||||
See accompanying notes to these consolidated financial statements.
F-6
Civitas Solutions, Inc.
Consolidated Statements of Cash Flows
(Amounts in thousands)
Year Ended September 30, | |||||||||||
2018 | 2017 | 2016 | |||||||||
Cash Flows from operating activities: | |||||||||||
Net income | $ | 14,886 | $ | 6,331 | $ | 9,187 | |||||
Adjustments to reconcile net income to net cash provided by operating activities: | |||||||||||
Provision for accounts receivable allowances | 23,186 | 20,674 | 14,784 | ||||||||
Depreciation and amortization | 95,421 | 75,713 | 73,100 | ||||||||
Amortization original issue discount and financing costs | 2,213 | 1,921 | 1,837 | ||||||||
Stock-based compensation expense | 7,607 | 8,441 | 17,072 | ||||||||
Deferred income taxes | (11,964 | ) | (22,545 | ) | 4,359 | ||||||
Gain from company owned life insurance policy | — | (501 | ) | — | |||||||
Loss on disposal of assets | 2,212 | 678 | 789 | ||||||||
Gain from derivatives | (329 | ) | — | — | |||||||
Goodwill and intangible asset impairment | — | 31,002 | 10,251 | ||||||||
Net change in fair value of contingent liabilities | — | 194 | 405 | ||||||||
Changes in operating assets and liabilities, net of acquisitions: | |||||||||||
Accounts receivable | (32,312 | ) | (35,083 | ) | (25,156 | ) | |||||
Other assets | (988 | ) | 10,686 | (8,706 | ) | ||||||
Accounts payable | 16 | 2,608 | 6,802 | ||||||||
Accrued payroll and related costs | 4,231 | (716 | ) | (3,930 | ) | ||||||
Other accrued liabilities | 326 | 2,005 | 5,028 | ||||||||
Other long-term liabilities | 2,166 | (4,488 | ) | 1,300 | |||||||
Net cash provided by operating activities | 106,671 | 96,920 | 107,122 | ||||||||
Cash Flows from investing activities: | |||||||||||
Acquisition of businesses, net of cash acquired | (100,129 | ) | (82,091 | ) | (45,196 | ) | |||||
Acquisition of intangible assets | (1,200 | ) | — | — | |||||||
Purchases of property and equipment | (51,041 | ) | (46,649 | ) | (43,356 | ) | |||||
Changes in restricted cash | (6 | ) | 719 | (297 | ) | ||||||
Proceeds from company owned life insurance policy | — | 738 | — | ||||||||
Proceeds from sale of assets | 3,187 | 1,629 | 1,423 | ||||||||
Net cash used in investing activities | (149,189 | ) | (125,654 | ) | (87,426 | ) | |||||
Cash Flows from financing activities: | |||||||||||
Issuance of long term-debt, net of original issue discount | 74,452 | — | — | ||||||||
Repayments of long-term debt | (7,331 | ) | (6,554 | ) | (6,554 | ) | |||||
Proceeds from borrowings under senior revolver | 659,300 | 7,300 | 52,200 | ||||||||
Repayments of borrowings under senior revolver | (659,300 | ) | (7,300 | ) | (52,200 | ) | |||||
Repayments of capital lease obligations | (712 | ) | (549 | ) | (497 | ) | |||||
Cash paid for earn-out obligations | — | (6,109 | ) | (3,565 | ) | ||||||
Payments of deferred financing costs | (258 | ) | (878 | ) | — | ||||||
Issuance of common stock under employee equity incentive plans | — | 764 | 142 | ||||||||
Tax windfall from stock-based compensation | — | — | 813 | ||||||||
Repurchase of common stock under stock repurchase program | (21,609 | ) | — | — | |||||||
Taxes paid related to net share settlements of equity awards | (1,153 | ) | (1,326 | ) | (1,042 | ) | |||||
Net cash provided by (used in) financing activities | 43,389 | (14,652 | ) | (10,703 | ) | ||||||
Net increase (decrease) in cash and cash equivalents | 871 | (43,386 | ) | 8,993 | |||||||
Cash and cash equivalents at beginning of period | 7,297 | 50,683 | 41,690 | ||||||||
Cash and cash equivalents at end of period | $ | 8,168 | $ | 7,297 | $ | 50,683 | |||||
Supplemental disclosure of cash flow information | |||||||||||
Cash paid for interest | $ | 36,003 | $ | 30,794 | $ | 31,563 | |||||
Cash paid for income taxes, net | $ | 13,469 | $ | 17,438 | $ | 12,641 | |||||
Supplemental disclosure of non-cash investing activities: | |||||||||||
Accrued property and equipment | $ | 3,665 | $ | 1,036 | $ | 810 | |||||
Fair value of contingent consideration related to acquisitions | $ | 1,805 | $ | — | $ | — | |||||
Property and equipment acquired through capital leases | $ | 7,308 | $ | — | $ | — | |||||
Accrued tenant reimbursements for leasehold improvements | $ | — | $ | — | $ | 1,262 | |||||
See accompanying notes to these consolidated financial statements.
F-7
Civitas Solutions, Inc.
Notes to Consolidated Financial Statements
September 30, 2018
1. Business Overview
Civitas Solutions, Inc. (“Civitas”), through its wholly-owned subsidiaries (collectively, the “Company”), is the leading provider of home- and community-based health and human services to adults and children with intellectual and/or developmental disabilities, acquired brain injury and other catastrophic injuries and illnesses; and to youth with emotional, behavioral and/or medically complex challenges. Since the Company’s founding in 1980, the Company has evolved into a diversified national network providing an array of high-quality services and care in large, growing and highly-fragmented markets. The Company currently provides services to individuals with intellectual and/or developmental disabilities (“I/DD”), individuals with catastrophic injuries and illnesses, particularly acquired brain injury (“ABI”), youth with emotional, behavioral and/or medically complex challenges, and elders in need of day health services to support their independence. As of September 30, 2018, the Company operated in 36 states, serving approximately 12,700 individuals in residential settings and approximately 19,000 individuals in non-residential settings.
The Company designs customized service plans to meet the individual needs of those served by the Company, which it delivers in home- and community-based settings. Most of the Company’s service plans involve residential support, typically in small group homes, host home settings, or specialized community facilities, designed to improve the quality of life of the individuals served by the Company and to promote their independence and participation in community life. Other services offered include supported living, day and transitional programs, vocational services, case management, family-based and outpatient therapeutic services, post-acute treatment and neurorehabilitation, neurobehavioral rehabilitation and physical, occupational and speech therapies, among others. The Company’s customized service plans offer individuals as well as the payors of these services, an attractive, cost-effective alternative to health and human services provided in large, institutional settings.
Civitas is the parent of a consolidated group of subsidiaries that market their services under The MENTOR Network tradename. NMH Holdings, LLC (“NMHH”) is a wholly owned subsidiary of Civitas and National Mentor Holdings, Inc. (“NMHI”) is a wholly owned subsidiary of NMHH. The financial results of Civitas are primarily composed of the financial results of NMHI and its subsidiaries on a consolidated basis.
We have four operating divisions, Community Support Services ("CSS"), Specialty Rehabilitation Services (“SRS”), Children & Family Services ("CFS") and Adult Day Health ("ADH"). Each operating division represents a reportable segment except ADH which is included within Corporate and Other. As of October 1, 2018, Community Support Services and Children & Family Services are new names for the operating divisions formerly referred to as Intellectual and Developmental Disabilities ("I/DD") and At-Risk Youth ("ARY") respectively. There were no changes to the composition of the operating divisions as a result of these name changes.
2. Significant Accounting Policies
Basis of Presentation
Principles of Consolidation
The consolidated financial statements include the accounts of the Company and its wholly-owned subsidiaries. Intercompany accounts and transactions between the Company and its subsidiaries have been eliminated in consolidation.
Use of Estimates
The preparation of financial statements in conformity with accounting principles generally accepted in the United States of America (“GAAP”) requires management to make estimates and assumptions that affect the reported amounts of assets and liabilities and disclosure of contingent assets and liabilities at the date of the financial statements and the reported amounts of revenue and expenses during the reporting period. On an on-going basis, we evaluate our estimates and judgments and methodologies.
Adoption of New Accounting Pronouncements
F-8
Stock Compensation
The Company adopted the guidance in Accounting Standards Update ("ASU") No. 2016-09 Compensation - Stock Compensation - Improvements to Employee Share-Based Payments Accounting (ASU No. 2016-09), on October 1, 2017. Under this standard, entities are permitted to make an accounting policy election to either estimate forfeitures on share-based payment awards, as previously required, or to recognize forfeitures as they occur. The Company has elected to recognize forfeitures as they occur and the impact of that change in accounting policy has been recorded as a $0.2 million cumulative effect adjustment to increase accumulated deficit as of October 1, 2017.
ASU No. 2016-09 requires that all income tax effects related to settlements of share-based payment awards be reported in earnings as an increase (or decrease) to income tax expense (benefit). Previously, income tax benefits at settlement of an award were reported as an increase (or decrease) to additional paid-in capital to the extent that those benefits were greater than (or less than) the income tax benefits reported in earnings during the award’s vesting period. The requirement to report those income tax effects in earnings has been applied on a prospective basis to settlements occurring on or after October 1, 2017, and the impact of applying the guidance was not material to the consolidated financial statements for the year ended September 30, 2018. Application of the guidance may result in fluctuations in the Company’s effective tax rate depending on how many options are exercised, how many restricted stock units vest and the volatility of the Company’s stock price.
ASU No. 2016-09 also requires that all income tax-related cash flows resulting from share-based payments be reported as operating activities in the statement of cash flows. Previously, income tax benefits at settlement of an award were reported as a reduction to operating cash flows and an increase to financing cash flows to the extent that those benefits exceeded the income tax benefits reported in earnings during the award’s vesting period. The change in classification of cash flows has no impact to prior periods, and the Company has elected to apply the changes in cash flow classification on a prospective basis.
Income Taxes
In March 2018, the FASB issued ASU No. 2018-05 Income Taxes (Topic 740): Amendments to SEC Paragraphs Pursuant to SEC Staff Accounting Bulletin No. 118 (ASU 2018-05). The update provides guidance associated with the accounting and disclosures around the enactment of the Tax Cuts and Jobs Act and the Securities and Exchange Commission’s Staff Accounting Bulletin No. 118, Income Tax Accounting Implications of the Tax Cuts and Jobs Act (“SAB 118”). This guidance was effective upon issuance and has been applied to the consolidated financial statements and related disclosures beginning in the second quarter of fiscal 2018, see Note 18 for the disclosures related to this amended guidance.
Fair Value Measurements
The accounting standard for fair value measurements defines fair value, establishes a framework for measuring fair value in accordance with GAAP, and requires detailed disclosures about fair value measurements. Under this standard, fair value is the price that would be received to sell an asset or paid to transfer a liability in an orderly transaction between market participants at the measurement date. The valuation techniques are based on observable and unobservable inputs. Observable inputs reflect readily obtainable data from independent sources, while unobservable inputs reflect certain market assumptions. This standard classifies these inputs into the following hierarchy:
Level 1 Inputs - Quoted prices for identical instruments in active markets.
Level 2 Inputs - Quoted prices for similar instruments in active markets; quoted prices for identical or similar instruments in markets that are not active; and model-derived valuations whose inputs are observable or whose significant value drivers are observable.
Level 3 Inputs - Instruments with primarily unobservable value drivers.
The fair value hierarchy level is determined by asset class based on the lowest level of significant input. In periods of market inactivity, the observability of prices and inputs may be reduced for certain instruments. This condition could cause an instrument to be reclassified between levels. During the years ended September 30, 2018 and 2017, there were no transfers between levels.
Cash Equivalents
The Company considers short-term investments with maturity dates of 90 days or less at the date of purchase to be cash equivalents. As of September 30, 2018 and 2017, the Company did not have any cash equivalents.
Restricted Cash
F-9
Restricted cash consists of a cash collateral account set up to support the issuance of letters of credit under the Company’s institutional letter of credit facility and funds provided from government payors restricted for use by individuals served by the Company.
Concentrations of Credit and Other Risks
Financial instruments that potentially subject the Company to credit risk primarily consist of cash and cash equivalents, self-insurance receivables and accounts receivable. Cash and cash equivalents are deposited with federally insured commercial banks in the United States, which, at times may exceed federally insured limits of $250 thousand. The Company has not experienced any losses in such accounts. As of September 30, 2018, our accounts exceeded federally insured limits by $58.1 million.
The Company derives approximately 89% of its revenue from state and local government payors. These entities fund a significant portion of their payments to the Company through federal matching funds, which pass through various state and local government agencies. Of the 36 states the Company operates in, Minnesota is our largest state and generates revenue from our contracts with state and local governmental payors which accounted for approximately 16%, 15%, and 15% of our net revenue in fiscal 2018, 2017 and 2016, respectively. Contracts with state and local governmental payors in California, our second largest state, accounted for 10% of our net revenue in fiscal 2018 and 2017. No other states accounted for 10% or more of our net revenue during fiscal years 2018, 2017, or 2016.
Revenue Recognition
Revenue is reported net of allowances for unauthorized sales and estimated sales adjustments. Revenue is also reported net of any state provider taxes or gross receipts taxes levied on services the Company provides. Sales adjustments are estimated based on an analysis of historical sales adjustments and recent developments in payment trends. Revenue is recognized when evidence of an arrangement exists, the service has been provided, the price is fixed or determinable and collectability is reasonably assured.
The Company recognizes revenue for services performed pursuant to contracts with various state and local government agencies and private health care agencies. The payment terms and rates of our contracts vary by jurisdiction and service type. The Company has four types of contractual arrangements with payors which include negotiated contracts, fixed fee contracts, retrospective reimbursement contracts and prospective payments contracts. Under the Company's units-of-service contracts, which include negotiated contracts and fixed fee contacts, revenue is recognized at the time the service is performed. Under the Company's cost reimbursement contracts, which include retrospective reimbursement contracts and prospective payment contracts, revenue is recognized at the time the service costs are incurred. For the Company’s cost-reimbursement contracts, the rate provided by the payor is based on a certain level of service and types of costs incurred in delivering the service. From time to time, the Company receives payments under cost-reimbursement contracts in excess of the allowable costs required to support those payments. In such instances, the Company estimates and records a liability for such excess payments. At the end of the contract period, any balance of excess payments is maintained as a liability until it is reimbursed to the payor or until the Company has exhausted efforts to make the reimbursement. Revenue in the future may be affected by changes in rate-setting structures, methodologies or interpretations that may be enacted in states where the Company operates or by the federal government.
Cost of Revenue
The Company classifies expenses directly related to providing services as cost of revenue, except for depreciation and amortization related to cost of revenue, which are shown separately in the consolidated statements of income. Direct costs and expenses principally include salaries and benefits for service provider employees, per diem payments to independently contracted host-home caregivers (“Mentors”), residential occupancy expenses, which are primarily composed of rent and utilities related to facilities providing direct care, certain expenses, such as food and medicine and transportation costs for individuals requiring services, professional and general liability expense, employment practices liability expense and workers’ compensation expense.
Property and Equipment
Property and equipment are recorded at cost and are depreciated using a straight-line method when placed into service, based on their estimated useful lives as follows:
F-10
Asset Description | Estimated Useful Life | |
(in years) | ||
Land | Indefinite | |
Building | 30 | |
Building improvements | 10 | |
Leasehold improvements | Not to exceed 7 years or length of lease | |
Vehicles | 5 | |
Computer hardware and software | 3 | |
Furniture, fixtures and equipment | 3-5 | |
Capital lease assets are depreciated over the lesser of the lease term or the useful life of the asset. Expenditures for maintenance and repairs are charged to operating expenses as incurred. When assets are sold or retired, the corresponding cost and accumulated depreciation are removed from the related accounts and any gain or loss is recorded in the period of the sale or retirement.
Accounts Receivable
Accounts receivable primarily consist of amounts due from government agencies, not-for-profit providers and commercial insurance companies. An estimated allowance for doubtful accounts is recorded to the extent it is probable that a portion or all of a particular account will not be collected. In evaluating the collectability of accounts receivable, the Company considers a number of factors, including payment trends in individual states, age of the accounts and the status of ongoing disputes with third party payors. Complex rules and regulations regarding billing and timely filing requirements in various states are also a factor in our assessment of the collectability of accounts receivable. Actual collections of accounts receivable in subsequent periods may require changes in the estimated allowance for doubtful accounts. Changes in these estimates are charged or credited to revenue as a contractual allowance in the consolidated statements of income in the period of the change in estimate.
Goodwill and Indefinite-lived Intangible Assets
The Company reviews costs of purchased businesses in excess of the fair value of net assets acquired (goodwill), and indefinite-lived intangible assets for impairment at least annually, unless significant changes in circumstances indicate a potential impairment may have occurred sooner. The Company conducts its annual impairment test for both goodwill and indefinite-lived intangible assets on July 1st of each year.
In fiscal 2016, the Company conducted the goodwill impairment test on a reporting unit basis using the two step process in accordance with the guidance in ASC 350. The Company had the option to first assess qualitative factors to determine whether further impairment testing is necessary. The Company elected to bypass the qualitative assessments and proceeded directly to the two-step impairment test. The first step is to compare the fair value of the reporting unit with its carrying value. The fair value of the reporting unit is determined by using the income approach, specifically the discounted cash flow method. If the carrying amount of the reporting unit exceeds its fair value then the second step of the goodwill impairment test is performed. The second step of the goodwill impairment test compares the implied fair value of the reporting unit’s goodwill with the carrying amount of that goodwill in order to determine the amount of impairment to be recognized. The excess of the carrying value of goodwill above the implied goodwill, if any, would be recognized as an impairment charge. Fair values are estimated using the discounted cash flow method.
Beginning in fiscal 2017, the Company no longer performs Step 2 of the goodwill impairment test. The annual impairment tests in fiscal 2017 and fiscal 2018 were performed by comparing the fair value of a reporting unit with its carrying value. The fair value of the reporting unit is determined by using the income approach, specifically the discounted cash flow method, and corroborated by the market approach. If the fair value of the reporting unit exceeds its carrying amount, goodwill is not impaired and no further testing is required. If the fair value of the reporting unit is less than the carrying value, an impairment charge is recognized for the amount by which the carrying amount exceeds the reporting unit's fair value; however, the loss recognized should not exceed the total amount of goodwill allocated to that reporting unit.
For its indefinite-lived intangible assets, the Company has elected to bypass the qualitative assessments and proceed directly to the quantitative impairment test. The impairment test for indefinite-lived intangible assets requires the determination of the fair value of the intangible asset. If the fair value of the indefinite-lived intangible asset is less than its
F-11
carrying value, an impairment loss is recognized in an amount equal to the difference. Fair values are estimated using the relief from royalty method.
As described above, the fair value of a reporting unit and intangible asset is based on discounted estimated future cash flows. The assumptions used to estimate fair value include management’s best estimates of future operating cash flows, including revenue growth, tax rates, capital expenditures, discount rates and working capital changes. As such, actual results may differ from these estimates and lead to a revaluation of the Company’s goodwill and indefinite-lived intangible assets.
Impairment of Long-Lived Tangible and Intangible Assets
The Company reviews long-lived tangible and intangible assets for impairment when events or circumstances have occurred that indicate the estimated useful life of these assets may warrant revision or that the carrying amount of these assets may be impaired. To compute whether assets have been impaired, the estimated undiscounted future cash flows for the estimated remaining useful life of the assets are compared to the carrying value. To the extent that the future cash flows are less than the carrying value, the assets are written down to the estimated fair value of the asset.
Income Taxes
The Company accounts for income taxes using the asset and liability method. Under this method, deferred tax assets and liabilities are determined by multiplying the differences between the financial reporting and tax reporting bases for assets and liabilities by the enacted tax rates expected to be in effect when such differences are recovered or settled. Valuation allowances on deferred tax assets are estimated based on the Company’s assessment of the realizability of such amounts.
The Company recognizes the benefits of tax positions when certain criteria are satisfied. The Company may recognize the tax benefit from an uncertain tax position only if it is more likely than not that the tax position will be sustained on examination by the taxing authorities, based on the technical merits of the position. The tax benefits recognized in the financial statements from such a position should be measured based on the largest benefit that has a greater than fifty percent likelihood of being realized upon ultimate settlement. The Company recognizes interest and penalties related to uncertain tax positions as a component of income tax expense.
Derivative Financial Instruments
The Company reports derivative financial instruments on the balance sheet at fair value and establishes criteria for designation and effectiveness of hedging relationships. Changes in the fair value of derivatives are recorded each period in current operations or in the consolidated statements of comprehensive income (loss) depending upon whether the derivative is designated as part of a hedge transaction and, if it is, the type of hedge transaction.
The Company, from time to time, enters into interest rate swap agreements to hedge against variability in cash flows resulting from fluctuations in the benchmark interest rate, which is LIBOR, on the Company’s debt. These agreements involve the exchange of variable interest rates for fixed interest rates over the life of the swap agreement without an exchange of the notional amount upon which the payments are based. On a quarterly basis, the differential to be received or paid as interest rates change is accrued and recognized as an adjustment to interest expense in the accompanying consolidated statements of income. In addition, on a quarterly basis, the mark to market valuation is recorded as an adjustment to gain (loss) on derivative within the consolidated statements of comprehensive income with any ineffective portion recorded to Interest expense within the consolidated statement of income. The related amount receivable from or payable to counterparties is included as an asset or liability, respectively, in the Company’s consolidated balance sheets.
Stock-Based Compensation
Prior to the Company's initial public offering ("IPO"), NMH Investment maintained an equity-based compensation plan, and from time to time it issued units of limited liability company interests pursuant to such plan. The units were available for issuance to the Company’s employees and members of the Board of Directors. The Company recognized the fair value of these awards as compensation expense over the requisite services period or when the satisfaction of the vesting conditions were determined to be probable.
In October 2015, NMH Investment distributed all of the 25,250,000 shares of our common stock it held to its existing members in accordance with their respective membership interests and pursuant to the terms of the NMH Investment's Limited Liability Company Agreement and the management unitholders agreements (the “Distribution”). The Distribution triggered the vesting conditions for all unvested awards. As a result, the Company recorded compensation expense of $10.5
F-12
million that is included in General and administrative expense on the consolidated statement of income during the year ended September 30, 2016.
In fiscal 2014, Civitas adopted an equity-based compensation plan and began issuing stock-based awards including non-qualified stock options ("NSOs"), restricted stock units ("RSUs"), and performance based restricted stock units ("PRSUs"). The Company recognizes the fair value of stock-based compensation expense over the requisite service period of the individual grantee, which equals the vesting period. The fair value of each NSO granted was estimated on the grant date using the Black-Scholes valuation model. The fair value of each RSU was determined based on the Company's closing stock price on the date of grant. The fair value of each PRSU was determined based on either the Company's closing stock price on the date of grant or through a Monte Carlo simulation methodology for those awards that included a market condition. The number of performance based restricted stock units earned is determined based on the Company's attainment of predefined performance targets set by the Compensation Committee. At each reporting period, the Company assesses the number of performance based restricted stock units expected to vest based on the expected attainment of the performance targets. The Company recognizes forfeitures as they occur. The actual expense recognized over the vesting period will only be for those awards that vest.
Self-Insurance
The Company maintains insurance for professional and general liability, workers’ compensation, automobile liability and health insurance with policies that include self-insured retentions. Employment practices liability is fully self-insured. The Company records expenses related to claims on an incurred basis, which includes estimates of fully developed losses for both reported and unreported claims. The accruals for the health, workers’ compensation, automobile, employment practices liability and professional and general liability programs are based on analyses performed internally by management and for certain balances, take into account reports by independent third party actuaries. Self-insurance accruals are periodically re-evaluated and increased or decreased based on new information.
The Company reports its insurance liabilities on a gross basis without giving effect to insurance recoveries. Insurance recovery receivables are presented in Prepaid expenses and other current assets and Other assets on the consolidated balance sheets. Self-insured liabilities are presented in Accrued payroll and related costs, Other accrued liabilities and Other long-term liabilities on the Company’s consolidated balance sheets.
Legal Contingencies
The Company reserves for costs related to contingencies when a loss is probable and the amount is reasonably estimable or a range of loss can be determined. These accruals represent management’s best estimate of probable loss. Disclosure is also provided when it is reasonably possible that a loss will be incurred or when it is reasonably possible that the amount of loss will exceed the recorded provision. Significant judgment is required in both the determination of probability and the determination as to whether an exposure is reasonably estimable. Because of uncertainties related to these matters, accruals are based only on the best information available at the time. As additional information becomes available, the Company reassesses the potential liability related to pending claims and litigation and may revise its estimates. These revisions in the estimates of the potential liabilities could have a material impact on our consolidated results of operations and financial position.
Leases
The Company accounts for leases in accordance with ASC Topic 840 Leases. For lease agreements that provide for escalating rent payments and rent holidays, the Company recognizes rent expense on a straight-line basis over the non-cancellable lease term and option renewal periods where failure to exercise such options would result in an economic penalty such that the renewal appears, at the inception of the lease, to be reasonably assured. The lease term commences when the Company becomes obligated under the terms of the lease agreement.
Subsequent Events
The Company considers events or transactions that have occurred after the balance sheet date of September 30, 2018, but prior to the filing of the financial statements with the Securities and Exchange Commission, or SEC, to provide additional evidence relative to certain estimates or to identify matters that require additional recognition or disclosure. Subsequent events have been evaluated through the filing of the financial statements accompanying this Annual Report on Form 10-K.
F-13
3. Recent Accounting Pronouncements
Revenue from Contracts with Customers— In May 2014, the Financial Accounting Standards Board ("FASB") issued Accounting Standards Update ("ASU") No. 2014-09, Revenue from Contracts with Customers Topic 606 (ASU 2014-09), which supersedes nearly all existing revenue recognition guidance under U.S. GAAP. The core principle of ASU 2014-09 is to recognize revenues when promised goods or services are transferred to customers in an amount that reflects the consideration to which an entity expects to be entitled for those goods or services. ASU 2014-09 defines a five step process to achieve this core principle and, in doing so, more judgment and estimates may be required within the revenue recognition process than are required under existing U.S. GAAP including identifying performance obligations in the contract, estimating the amount of variable consideration to include in the transaction price and allocating the transaction price to each separate performance obligation. The FASB has subsequently issued amendments to ASU No. 2014-09 that have the same effective date and transition date. ASU 2014-09, as amended, is effective for the Company's fiscal year beginning October 1, 2018, and the Company will adopt the new standard under the modified retrospective approach for contracts with customers. Under the modified retrospective approach, the guidance will be applied to the most current period presented, recognizing the cumulative effect of the adoption change as an adjustment to beginning retained earnings. In fiscal 2017, the Company established a formal program and cross-functional implementation team to identify design and implement changes to its accounting systems and policies and internal controls to support recognition and disclosure under the new standard. This process included a review of the requirements under the new standard compared to the current accounting policies for each of the Company’s revenue streams. As of the end of the fourth quarter, the Company completed its review and there is not expected to be a material impact on the consolidated financial statements upon implementation on October 1, 2018. The Company has implemented changes to accounting policies and controls to support the new revenue recognition and disclosure requirements.
Leases— In February 2016, the FASB issued ASU No. 2016-02—Leases (Topic 842). The new standard requires that all lessees recognize the assets and liabilities that arise from leases on the balance sheet and disclose qualitative and quantitative information about its leasing arrangements. The standard will be effective for the Company on October 1, 2019. In July 2018, the FASB issued ASU No. 2018-11—Leases (Topic 842): Targeted Improvements (ASU 2018-11). Prior to ASU 2018-11, a modified retrospective transition was required for financing or operating leases existing at or entered into after the beginning of the earliest comparative period presented in the financial statements. ASU 2018-11 allows entities an additional transition method to the existing requirements whereby an entity could adopt the provisions of ASU 2016-02 by recognizing a cumulative-effect adjustment to the opening balance of retained earnings in the period of adoption without adjustment to the financial statements for periods prior to adoption. The Company will elect this new transition method when it adopts ASU 2016-02 on October 1, 2019. The adoption of this standard is expected to have a material impact on the Company's financial position. As of September 30, 2018 and September 30, 2017, the Company had gross operating lease commitments of approximately $374 million and $317 million, respectively. Upon adoption, a substantial portion of these lease commitments will be recorded at their net present value as a right of use asset and a lease obligation.
Statement of Cash Flows— In November 2016, the FASB issued ASU No. 2016-18—Statement of Cash Flows (Topic 230): Restricted Cash. The update requires that a statement of cash flows present the change during the period in the total of cash, cash equivalents, and amounts generally described as restricted cash or restricted cash equivalents. Therefore, amounts generally described as restricted cash and restricted cash equivalents should be included with cash and cash equivalents when reconciling the beginning-of-period and end-of-period total amounts shown on the statement of cash flows. The new standard is effective for the Company on October 1, 2018 and will be applied using a retrospective transition method by adjusting the prior periods presented to conform to the new presentation. As of September 30, 2018 and 2017, the Company had restricted cash amounts of $50.3 million.
Business Combinations— In January 2017, the FASB issued ASU No. 2017-01—Business Combinations (Topic 805): Clarifying the Definition of a Business. The update provides guidance to determine when an integrated set of assets and activities is not a business. When substantially all of the fair value of the gross assets acquired, or disposed of, is concentrated in a single identifiable asset or a group of similar identifiable assets, then the acquisition, or disposition, is not a business. The amendments in this update should be applied prospectively on or after the effective date. No disclosures are required at transition. The new standard is effective for the Company on October 1, 2018. This standard could reduce the number of acquisitions that are treated as business combinations in the future.
Fair Value Measurements— In August 2018, the FASB issued ASU No. 2018-13, Fair Value Measurement (Topic 820) - Disclosure Framework - Changes to the Disclosure Requirements for Fair Value Measurement, which is designed to improve the effectiveness of disclosures by removing, modifying and adding disclosures related to fair value measurements. The update is effective for the Company on October 1, 2020, with early adoption permitted. The Company is currently assessing the impact this update will have on its consolidated financial statements.
F-14
Cloud Computing Arrangements— In August 2018, the FASB issued ASU 2018-15, Intangibles-Goodwill and Other-Internal-Use Software (Subtopic 350-40): Customer’s Accounting for Implementation Costs Incurred in a Cloud Computing Arrangement That Is a Service Contract. The amendments in this update align the requirements for capitalizing implementation costs incurred in a hosting arrangement that is a service contract with the requirements for capitalizing implementation costs incurred to develop or obtain internal-use software (and hosting arrangements that include an internal-use software license). The accounting for the service element of a hosting arrangement that is a service contract is not affected by the amendments in this update. The amendments in this update are effective for the Company on October 1, 2020, with early adoption permitted. The amendments in this update should be applied either retrospectively or prospectively to all implementation costs incurred after the date of adoption. The Company is in the process of assessing the impact of the amendments in this update but does not expect it to have a material impact on the Company's consolidated financial statements.
4. Business Combinations
The operating results of the businesses acquired are included in the consolidated statements of income from the date of acquisition. The Company accounted for these acquisitions under the acquisition method and, as a result, the purchase price was allocated to the assets acquired and liabilities assumed based upon their respective fair values. The excess of the purchase price over the estimated fair value of net tangible assets was allocated to specifically identified intangible assets, with the residual being allocated to goodwill.
Fiscal 2018 Acquisitions
During the year ended September 30, 2018, the Company acquired the assets or equity interests of 11 companies for total consideration of $99.8 million, net of $0.8 million of cash acquired, and including $1.8 million of contingent consideration.
Mentis Neuro Rehabilitation, LLC (“Mentis”). On October 25, 2017, the Company acquired all of the outstanding membership interests of Mentis for $74.7 million, net of $0.8 million of cash acquired. Mentis is located in Texas and provides specialty rehabilitation services to individuals recovering from acquired brain injuries. The Company acquired $35.3 million of identifiable intangible assets which included approximately $30.2 million of agency contracts with a weighted average useful life of 12 years, $3.8 million of licenses and permits with a weighted average useful life of 10 years, and $0.9 million in tradenames with a weighted average useful life of 5 years. The Company also acquired $9.5 million of other assets, net of liabilities, consisting primarily of accounts receivable, deferred tax assets, and fixed assets. The estimated fair values of the intangible assets acquired at the date of acquisition were determined based on a preliminary valuation that has yet to be finalized. In addition, the accounting for the acquired deferred tax assets and liabilities is provisional and subject to further refinement as the tax basis of assets acquired and liabilities assumed is finalized. As a result of the acquisition, the Company recorded $29.9 million of goodwill in the SRS segment, which is not expected to be deductible for tax purposes.
Unique Options, LLC (“Unique”). On December 4, 2017, the Company acquired the assets of Unique for $5.9 million. Unique is located in Michigan and provides vocational rehabilitation, training and similar services to individuals with acquired brain injuries and similar conditions. The Company acquired $3.9 million of identifiable intangible assets which included $3.7 million of agency contracts with a weighted average useful life of 11 years. As a result of this acquisition, the Company recorded $2.0 million of goodwill in the SRS segment, which is expected to be deductible for tax purposes.
Hartwell Healthcare, LLC, and Polyclinic, LLC (“Aging Well and Living Well”). On April 2, 2018, the Company acquired the assets of Aging Well and Living Well for $13.2 million. Aging Well and Living Well are located in Massachusetts and provide person-centered day services to elders, including medication management and nutritional and nursing support. The Company acquired $9.0 million of identifiable intangible assets which included $8.1 million of agency contracts with a weighted average useful life of 12 years and $0.9 million of licenses and permits with a weighted average useful life of 10 years. As a result of this acquisition, the Company recorded $4.1 million of goodwill in the Corporate and Other segment, which is expected to be deductible for tax purposes.
Other Acquisitions. During the year ended September 30, 2018, the Company acquired the assets of Powell Life Skills Inc. (“Powell”), Jac-Lin Manor, Inc. (“Jac-Lin”), Dungarvin Wisconsin, LLC (“Dungarvin”), Resources for Human Development, Inc. (“RHD”), Circle of Support, Inc. (“Circle”), Wexner Heritage Village, Inc. (“Shalom House South”), Creative Connections, Inc. ("CCI"), and Maintaining Independence Adult Day Services, Inc. ("Maintaining Independence"). Total cash consideration for these companies was $4.2 million and total contingent consideration was $1.8 million.
The following table summarizes the recognized amounts of identifiable net assets acquired at the date of each acquisition:
F-15
(in thousands) | Identifiable Intangible Assets | Other Assets, Net | Total Identifiable Net Assets | Goodwill | Purchase Consideration | ||||||||||||||
Mentis | $ | 35,300 | $ | 9,452 | $ | 44,752 | $ | 29,935 | $ | 74,687 | |||||||||
Unique | 3,939 | 22 | 3,961 | 1,985 | 5,946 | ||||||||||||||
Aging Well and Living Well | 9,035 | 12 | 9,047 | 4,105 | 13,152 | ||||||||||||||
Other acquisitions | 5,292 | 234 | 5,526 | 508 | 6,034 | ||||||||||||||
Total | $ | 53,566 | $ | 9,720 | $ | 63,286 | $ | 36,533 | $ | 99,819 | |||||||||
The Company's consolidated statement of income for the year ended September 30, 2018 included revenue totaling approximately $48.0 million from the acquisition date of each respective acquisition. The Company has not disclosed income from operations because it is immaterial.
Fiscal 2017 Acquisitions
During the year ended September 30, 2017, the Company acquired the assets or equity interests of 11 companies for total cash consideration of $82.1 million, net of $0.5 million of cash acquired.
The following table summarizes the recognized amounts of identifiable net assets acquired at the date of each acquisition:
(in thousands) | Identifiable Intangible Assets | Other Assets, Net | Total Identifiable Assets | Goodwill | Purchase Consideration | ||||||||||||||
Loma Linda | $ | 2,225 | $ | 33 | $ | 2,258 | $ | 483 | $ | 2,741 | |||||||||
Rainbow ADH | 13,260 | 1,497 | 14,757 | 9,852 | 24,609 | ||||||||||||||
JLH | 1,301 | 60 | 1,361 | 136 | 1,497 | ||||||||||||||
Mi Casa | 2,960 | 59 | 3,019 | 1,921 | 4,940 | ||||||||||||||
Harbor Rehab | 1,642 | — | 1,642 | 461 | 2,103 | ||||||||||||||
Brockton Stoughton ADH | 4,000 | 195 | 4,195 | 2,055 | 6,250 | ||||||||||||||
Country Life | 6,177 | 72 | 6,249 | 3,156 | 9,405 | ||||||||||||||
HSI | 18,860 | 1,539 | 20,399 | 9,569 | 29,968 | ||||||||||||||
Other acquisitions | 432 | 138 | 570 | 8 | 578 | ||||||||||||||
Total | $ | 50,857 | $ | 3,593 | $ | 54,450 | $ | 27,641 | $ | 82,091 | |||||||||
Loma Linda Management Company, Inc. ("Loma Linda"). On January 31, 2017, the Company acquired the assets of Loma Linda for $2.7 million. Loma Linda is located in California and provides adult day health and community integration services to individuals with developmental disabilities and other special needs. The Company acquired $2.2 million of identifiable intangible assets which included approximately $1.7 million of agency contracts with a weighted average useful life of 12 years. As a result of the acquisition, the Company recorded $0.5 million of goodwill in the CSS segment, which is expected to be deductible for tax purposes.
Rainbow Adult Day Health ("Rainbow ADH"). On March 1, 2017, the Company acquired the assets of Rainbow ADH for $24.6 million. Rainbow ADH is located in Maryland and provides adult day health services. The Company acquired $13.3 million of identifiable intangible assets which included $11.3 million of agency contracts with a weighted average useful life of 12 years, and $2.0 million of licenses and permits with a weighted average useful life of 10 years. In addition, the Company acquired total tangible assets of $1.5 million, consisting primarily of vehicles. As a result of this acquisition, the Company recorded $9.9 million of goodwill in the Corporate and other segment, which is expected to be deductible for tax purposes.
JLH Enterprises, Chippewa Valley, Inc ("JLH"). On June 1, 2017, the Company acquired the assets of JLH for $1.5 million. JLH is located in Wisconsin and is engaged in the business of providing residential services, supported living services, day program services and similar services to individuals with developmental disabilities and similar conditions. The Company acquired $1.3 million of identifiable intangible assets, all of which were agency contracts with a weighted average useful life of 12 years. As a result of this acquisition, the Company recorded $0.1 million of goodwill in the CSS segment, which is expected to be deductible for tax purposes.
Mi Casa es Su Casa, Inc. ("Mi Casa"). On June 9, 2017, the Company acquired the assets of Mi Casa for $4.9 million. Mi Casa is located in New Jersey and provides adult day health services. The Company acquired $3.0 million of identifiable intangible assets which included $2.5 million of agency contracts with a weighted average useful life of 12. As a result of this acquisition, the Company recorded $1.9 million of goodwill in the Corporate and other segment, which is expected to be deductible for tax purposes.
F-16
Harbor Rehabilitation, LLC ("Harbor Rehab"). On June 12, 2017, the Company acquired the assets of Harbor Rehab for $2.1 million. Harbor Rehab is located in Michigan and provides physical therapy, rehabilitation and related services to individuals with injuries or impairments. The Company acquired $1.6 million of identifiable intangible assets which included $1.1 million of agency contracts with a weighted average useful life of 12 years. As a result of this acquisition, the Company recorded $0.5 million of goodwill in the SRS segment, which is expected to be deductible for tax purposes.
Brockton and Stoughton Adult Medical Day Care Center, Inc. ("Brockton Stoughton ADH"). On June 26, 2017, the Company acquired the assets of Brockton Stoughton ADH for $6.3 million. Brockton Stoughton ADH is located in Massachusetts and provides adult day health services. The Company acquired $4.0 million of identifiable intangible assets which included $3.4 million of agency contracts with a weighted average useful life of 12 years. As a result of this acquisition, the Company recorded $2.1 million of goodwill in the Corporate and other segment, which is expected to be deductible for tax purposes.
Country Life Care Centers, Inc. ("Country Life"). On July 1, 2017, the Company acquired the assets of Country Life for $9.4 million. Country Life is located in Utah and is engaged in the business of operating a rehabilitation and sub-acute care facility that provides short-term and long-term medical care for people after a catastrophic injury or illness or with chronic medical conditions. The Company acquired $6.2 million of identifiable intangible assets which included $4.8 million of agency contracts with a weighted average useful life of 11 years. As a result of this acquisition, the Company recorded $3.2 million of goodwill in the SRS segment, which is expected to be deductible for tax purposes.
Habilitative Services, Inc. ("HSI"). On September 29, 2017, the Company acquired all of the outstanding capital stock of HSI and two related companies for $30.0 million. HSI is located in Minnesota and is engaged in the business of providing residential or supported living services and other services to individuals with developmental disabilities, traumatic brain injuries or mental illness. The Company acquired $18.9 million of identifiable intangible assets which included $14.7 million of agency contracts with a weighted average useful life of 12 years, and $4.1 million of licenses and permits with a weighted average useful life of 10 years. The Company also acquired $1.5 million of other assets, net of liabilities, consisting primarily of accounts receivable and fixed assets. As a result of this acquisition, the Company recorded $9.6 million of goodwill in the CSS segment, which is not expected to be deductible for tax purposes.
Other Acquisitions. During fiscal 2017, the Company acquired the assets of Hope Homes, Inc. ("Hope Homes"), Res-Care Wisconsin, Inc. ("RC"), and Micki's Creative Option, Inc. ("Micki's"). Hope Homes provides residential and day program services for individuals with developmental disabilities in Ohio, RC provides adult family home residential services to elderly individuals in Wisconsin, and Micki's provides group home services, supported living services and related services to individuals with intellectual and developmental disabilities in Ohio. These acquisitions are included in our CSS segment. Total cash consideration for these companies was $0.6 million.
The Company's consolidated statement of income for the year ended September 30, 2017 included revenue totaling approximately $18.2 million from the acquisition date of each respective acquisition. The Company has not disclosed income from operations because it is immaterial.
Fiscal 2016 Acquisitions
During the fiscal year ended September 30, 2016, the Company acquired certain assets of 12 companies for total cash consideration of $45.2 million.
F-17
The following table summarizes the recognized amounts of identifiable assets acquired at the date of each acquisition:
(in thousands) | Identifiable Intangible Assets | Tangible Assets | Total Identifiable Assets | Goodwill | Purchase Consideration | ||||||||||||||
Mother's Touch | $ | 2,741 | $ | 9 | $ | 2,750 | $ | 650 | $ | 3,400 | |||||||||
Winways | 619 | 29 | 648 | 108 | 756 | ||||||||||||||
Triumph | 2,335 | — | 2,335 | 265 | 2,600 | ||||||||||||||
Brighton Worcester ADH | 10,600 | 363 | 10,963 | 2,677 | 13,640 | ||||||||||||||
TLC Duluth | 7,132 | 26 | 7,158 | 1,342 | 8,500 | ||||||||||||||
Maryland ADH | 7,680 | 769 | 8,449 | 3,835 | 12,284 | ||||||||||||||
Eagle Crest | 1,698 | — | 1,698 | 302 | 2,000 | ||||||||||||||
CRM | 934 | 87 | 1,021 | 119 | 1,140 | ||||||||||||||
RHD | 18 | 43 | 61 | — | 61 | ||||||||||||||
Learning Services | 100 | — | 100 | — | 100 | ||||||||||||||
Pine Grove | 407 | — | 407 | 93 | 500 | ||||||||||||||
Milne | 210 | 5 | 215 | — | 215 | ||||||||||||||
Total | $ | 34,474 | $ | 1,331 | $ | 35,805 | $ | 9,391 | $ | 45,196 | |||||||||
Mother's Touch, LLC ("Mother's Touch"). On November 30, 2015, the Company acquired the assets of Mother's Touch for $3.4 million. Mother's Touch is located in Indiana and provides residential and community-based services to individuals with developmental disabilities. The Company acquired $2.7 million of identifiable intangible assets which included approximately $2.7 million of agency contracts with a weighted average useful life of 12 years. As a result of the acquisition, the Company recorded $0.7 million of goodwill in the CSS segment, which is expected to be deductible for tax purposes.
Winways, LLC ("Winways"). On December 31, 2015, the Company acquired the assets of Winways for $0.8 million. Winways is located in California and provides residential and day treatment services to individuals with traumatic brain injuries, neurological illnesses and similar conditions. The Company acquired $0.6 million of identified intangible assets which included $0.5 million of agency contracts with a weighted average useful life of 12 years. As a result of this acquisition, the Company recorded $0.1 million of goodwill in the SRS segment, which is expected to be deductible for tax purposes.
Triumph Rehabilitation, LLC ("Triumph"). On February 1, 2016, the Company acquired the assets of Triumph for $2.6 million. Triumph is located in Michigan and provides physical therapy, rehabilitation and related services to individuals with traumatic brain injuries, neurological illnesses, and similar conditions. The Company acquired $2.3 million of identifiable intangible assets which included $2.2 million of agency contracts with a weighted average useful life of 12 years. As a result of this acquisition, the Company recorded $0.3 million of goodwill in the SRS segment, which is expected to be deductible for tax purposes.
Brighton Worcester Massachusetts Adult Day Health, Inc. ("Brighton Worcester ADH"). On February 1, 2016 the Company acquired the assets of Brighton Worcester ADH for $13.6 million. Brighton Worcester ADH is located in Massachusetts and provides nursing and health oversight, medication management, therapy services, nutritional and dietary services, counseling and case management to elders. The Company acquired $10.6 million of identifiable intangible assets which included $9.9 million of agency contracts with a weighted average useful life of 12 years and $0.7 million of tradenames with a weighted average useful life of 5 years. As a result of this acquisition, the Company recorded $2.7 million of goodwill in the Corporate and other segment, which is expected to be deductible for tax purposes.
Tender Loving Care Duluth, LLC ("TLC Duluth"). On February 29, 2016, the Company acquired the assets of TLC Duluth for $8.5 million. TLC Duluth is located in Minnesota and provides full-time services in the community residential setting for individuals with developmental disabilities, traumatic brain injuries or mental illness. The Company acquired $7.1 million of identifiable intangible assets which included $6.2 million of agency contracts with a weighted average useful life of 12 years and $0.9 million of licenses and permits with a weighted average useful life of 10 years. As a result of this acquisition, the Company recorded $1.3 million of goodwill in the CSS segment, which is expected to be deductible for tax purposes.
Maryland Adult Day Health, Inc. ("Maryland ADH"). On March 14, 2016, the Company acquired the assets of Maryland ADH for $12.3 million. Maryland ADH is located in Maryland and provides adult day health care services to the Medicaid eligible elderly population. The Company acquired $7.7 million of identifiable intangible assets which included $6.7 million of agency contracts with a weighted average useful life of 12 years and $1.0 million of tradenames with a weighted average useful life of 5 years. In addition, the Company acquired total tangible assets, consisting primarily of vehicles, of $0.8 million. As a result of this acquisition, the Company recorded $3.8 million of goodwill in the Corporate and other segment, which is expected to be deductible for tax purposes.
F-18
Eagle Crest Center, LLC ("Eagle Crest"). On March 15, 2016, the Company acquired the assets of Eagle Crest for $2.0 million. Eagle Crest is located in California and provides skilled nursing services and related services to individuals with traumatic brain injuries, spinal cord injuries, neuro-muscular or congenital anomalies, and similar conditions. The Company acquired $1.7 million of identifiable intangible assets which included $1.4 million of agency contracts with a weighted average useful life of 12 years. As a result of this acquisition, the Company recorded $0.3 million of goodwill in the SRS segment, which is expected to be deductible for tax purposes.
CRM Habilitative Services, Inc. ("CRM"). On March 31, 2016, the Company acquired the assets of CRM for $1.1 million. CRM is located in Pennsylvania and provides group home services and day program services and related services to individuals with intellectual and developmental disabilities. The Company acquired $0.9 million of identifiable intangible assets which included $0.8 million of agency contracts with a weighted average useful life of 12 years. As a result of this acquisition, the Company recorded $0.1 million of goodwill in the CSS segment, which is expected to be deductible for tax purposes.
Other acquisitions. During fiscal 2016, the Company acquired the assets of Resources for Human Development ("RHD"), Learning Services, Inc. ("Learning Services"), Pine Grove Habilitation Center ("Pine Grove"), and Alexander Milne Developmental Services ("Milne"). RHD, Pine Grove and Milne are in the business of providing residential group home services to individuals with developmental disabilities and similar conditions and is included in our CSS segment. Learning Services is engaged in the business of providing supported living and rehabilitation services for individuals with acquired brain injuries and similar conditions and is included in our SRS segment. Total cash consideration for these companies was $0.9 million.
The Company's consolidated statement of income for the year ended September 30, 2016 included revenue totaling approximately $27.6 million. The Company has not disclosed income from operations because it is immaterial.
5. Proforma Results of Operations (unaudited)
The following table reflects the unaudited pro forma results of operations for fiscal 2018, 2017, and 2016 assuming that the acquisitions made during fiscal 2018, 2017, and 2016 had occurred on October 1, 2016, 2015 and 2014, respectively.
(in thousands) | Year Ended September 30, 2018 | Year ended September 30, 2017 | Year ended September 30, 2016 | ||||||||
Net revenue | $ | 1,616,206 | $ | 1,597,562 | $ | 1,507,342 | |||||
Net income | 16,290 | 16,316 | 19,254 | ||||||||
The unaudited pro forma information is presented for informational purposes only and is not necessarily indicative of the actual results that would have been achieved had the acquisitions occurred as of October 1, 2016, 2015 and 2014, or the results that may be achieved in future periods.
6. Dispositions
In connection with a review of under-performing and/or non-strategic programs that began during the second quarter of fiscal 2018, the Company decided to close and/or consolidate a number of programs primarily within the SRS and CSS segments. During the year ended September 30, 2018, the Company incurred exit costs associated with these completed and planned divestitures of $10.7 million, including $10.0 million in lease termination costs, and $0.7 million in severance. In addition, the Company recorded $6.1 million of accelerated amortization related to definite-lived intangible assets and a $1.2 million loss on the disposition of fixed assets associated with these programs.
As part of a strategic review of CFS operations, the Company decided to discontinue CFS services in the states of Florida, Louisiana, Indiana, North Carolina and Texas in fiscal 2015. These operations were included in the CFS segment. On December 1, 2015, the Company completed the sale of its CFS operations in the state of North Carolina. As consideration, the buyer assumed the lease and service delivery obligations in exchange for the assets of the business, excluding working capital items, and a cash payment of $1.3 million to the buyer. Upon the completion of the sale, the Company recorded a loss of $1.3 million. The closures of the CFS operations in Florida and Louisiana were complete as of December 31, 2015 and the closures of CFS operations in Indiana and Texas were completed in January 2016. During fiscal 2016, the Company recorded cash charges of approximately $2.0 million, consisting of severance costs of $0.5 million and lease termination costs of $1.5 million.
For the CFS services that were discontinued in fiscal 2015, the Company assessed the disposal group under the guidance of ASU 2014-08, Discontinued Operations and Disclosures of Disposals of Components of an Entity and concluded
F-19
that the closure of the disposal group does not represent a "strategic shift" and therefore has not been classified as discontinued operations for any of the periods presented. However, the Company has concluded that the disposal group was an individually significant disposal group. There were no operating results for the disposal group during the years ended September 30, 2018 and September 30, 2017. Pretax losses for this disposal group were $5.6 million for the fiscal year ended September 30, 2016. Pretax losses for the year ended September 30, 2016 included exit costs of $2.0 million disclosed above.
7. Goodwill and Intangible Assets
Goodwill
The Company has three reportable business segments: the CSS segment, the SRS segment and the CFS segment. The ADH operating segment is included in Corporate and Other. For more information refer to Note 19, "Segment Information."
The changes in goodwill for the fiscal years ended September 30, 2018 and 2017 are as follows (in thousands):
CSS | SRS | CFS | Corporate/Other | Total | |||||||||||||||
Balance as of September 30, 2016 | $ | 104,155 | $ | 81,909 | $ | 73,464 | $ | 14,132 | $ | 273,660 | |||||||||
Impact of segment change | 44,980 | — | (44,980 | ) | — | — | |||||||||||||
Acquisition adjustments | (17 | ) | — | — | 10 | (7 | ) | ||||||||||||
Goodwill acquired through acquisitions | 10,198 | 3,616 | — | 13,827 | 27,641 | ||||||||||||||
Impairment | — | — | — | (27,969 | ) | (27,969 | ) | ||||||||||||
Balance as of September 30, 2017 | 159,316 | 85,525 | 28,484 | — | 273,325 | ||||||||||||||
Goodwill acquired through acquisitions | 508 | 31,920 | — | 4,105 | 36,533 | ||||||||||||||
Adjustments to prior acquisitions (1) | 1,894 | — | — | — | 1,894 | ||||||||||||||
Balance as of September 30, 2018 | $ | 161,718 | $ | 117,445 | $ | 28,484 | $ | 4,105 | $ | 311,752 | |||||||||
(1) Includes amounts paid in fiscal 2018 associated with the net working capital settlement for the HSI acquisition in fiscal 2017.
As a result of segment and reporting unit changes that were effective as of October 1, 2016, the Company allocated goodwill between the new CSS and CFS reporting units based on the relative fair values, resulting in an allocation of $45.0 million. The Company estimated the fair value of the new reporting units using the income approach. The income approach is based on a discounted cash flow analysis and calculates the fair value of a reporting unit by estimating the after–tax cash flows attributable to a reporting unit and then discounting them to a present value using a risk-adjusted discount rate. In the discounted cash flow analysis, cash flows for the new reporting units were forecasted for each of the next ten years and a long term growth rate was applied to the final year of the forecasted cash flows to estimate terminal value. The cash flows were then discounted to a present value using a risk-adjusted discount rate. The discount rates, which are intended to reflect the risks inherent in future cash flow projections used in the discounted cash flow analysis, are based on estimates of the weighted average costs of capital of market participants relative to each respective reporting unit.
This change in the Company's CSS and CFS reporting units was considered a triggering event that indicated a test for goodwill impairment was necessary as of October 1, 2016. The Company completed impairment tests for these reporting units as of October 1, 2016 and it was determined that the carrying value of goodwill was not impaired as the fair value of the reporting units significantly exceeded the carrying value.
Annual Goodwill Impairment Testing
The Company completes the annual testing of impairment for goodwill on July 1st of each fiscal year. In addition to its annual test, the Company regularly evaluates whether events or circumstances have occurred that may indicate a potential impairment of these assets.
The Company utilizes the income approach, specifically the discounted cash flow method, to estimate the fair value of its reporting units when testing for impairment of goodwill. A number of significant assumptions and estimates are involved in the application of the income approach to forecast operating cash flows, including revenue growth, capital spending, discount rate and working capital changes. These inputs are not observable in the market and represent Level 3 inputs within the fair value hierarchy. Cash flow forecasts are based on business unit operating plans and historical experiences. The income approach is sensitive to changes in long-term terminal growth rates and the discount rate. The discount rate was selected based on the estimated rate of return as well as the time value of money.
F-20
The Company conducted Step 1of the annual goodwill impairment test as of July 1, 2018, which indicated that the fair value of each reporting unit exceeded its carrying value.
For the annual goodwill impairment test as of July 1, 2017, Step 1 indicated that the fair value of the ADH reporting unit, that is included within Corporate and Other, was less than its carrying value. Based on the guidance in ASU 2017-04, the Company recognized an impairment charge for the amount by which the carrying amount exceeded the reporting unit’s fair value. The $28.0 million impairment charge is included in Goodwill and intangible asset impairment in the consolidated statement of income for the year ended September 30, 2017. The goodwill impairment was attributable to a reduction in the profit projections of the core ADH business and a decrease in the forecasted contributions from future new start programs as compared to the prior year's projections.
Prior to adoption of ASU 2017-04, our annual impairment analysis as of July 1, 2016 indicated that the Step 2 analysis was necessary for the ADH reporting unit, that is included within Corporate/Other, as the carrying value exceeded the fair value of the reporting unit. Step 2 of the goodwill test is performed to measure the impairment loss. Step 2 required that the implied fair value of the reporting unit goodwill be compared to the carrying amount of that goodwill. If the carrying amount of the reporting unit goodwill exceeds the implied fair value of that goodwill, an impairment loss shall be recognized in an amount equal to that excess. After performing Step 2, it was determined that the implied value of goodwill was less than the carrying amount, resulting in an impairment charge of $10.3 million that is included in Goodwill and intangible asset impairment in the consolidated statement of income for the year ended September 30, 2016. The impairment was driven by higher than anticipated operating costs in recently acquired businesses that have negatively affected the reporting unit's projected operating margins.
The Company completed Step 1 for its other reporting units as of July 1, 2017 and 2016 and concluded that there was no goodwill impairment.
Intangible Assets
Intangible assets consist of the following as of September 30, 2018 (in thousands):
Description | Weighted Average Remaining Life | Gross Carrying Value | Accumulated Amortization | Intangible Assets, Net | ||||||||||
Agency contracts | 6 years | $ | 581,222 | $ | 326,925 | $ | 254,297 | |||||||
Non-compete/non-solicit | 1 year | 7,453 | 5,974 | $ | 1,479 | |||||||||
Trade names | 1 year | 8,161 | 6,771 | $ | 1,390 | |||||||||
Trade names (indefinite life) | — | 42,400 | — | $ | 42,400 | |||||||||
Licenses and permits | 3 years | 62,279 | 44,673 | $ | 17,606 | |||||||||
$ | 701,515 | $ | 384,343 | $ | 317,172 | |||||||||
Intangible assets consist of the following as of September 30, 2017 (in thousands):
Description | Weighted Average Remaining Life | Gross Carrying Value | Accumulated Amortization | Intangible Assets, Net | ||||||||||
Agency contracts | 7 years | $ | 540,826 | $ | 290,687 | $ | 250,139 | |||||||
Non-compete/non-solicit | 1 year | 7,196 | 5,228 | 1,968 | ||||||||||
Trade names | 2 years | 7,138 | 4,779 | 2,359 | ||||||||||
Trade names (indefinite life) | — | 42,400 | — | 42,400 | ||||||||||
Licenses and permits | 3 years | 58,443 | 42,234 | 16,209 | ||||||||||
$ | 656,003 | $ | 342,928 | $ | 313,075 | |||||||||
For fiscal years ended 2018, 2017 and 2016, the amortization expense for continuing operations was $50.7 million, $37.0 million and $38.1 million, respectively. Amortization expense for the year ended September 30, 2018 includes $6.1 million of accelerated amortization related to definite-lived intangible assets associated with the divestitures described in Note 6.
Indefinite Life Impairment Testing
The Company tests indefinite-lived intangible assets at least annually for possible impairment. Accordingly, the Company completes the annual testing of impairment for indefinite-lived intangible assets on July 1 of each fiscal year. In
F-21
addition to its annual test, the Company regularly evaluates whether events or circumstances have occurred that may indicate a potential impairment of these assets.
The impairment test consists of a comparison of the fair value of the indefinite-lived intangible asset with its carrying amount. If the carrying amount of an indefinite-lived intangible asset exceeds its fair value, an impairment loss in an amount equal to that excess is recognized. The Company has consistently employed the relief from royalty model to estimate the current fair value when testing for impairment of indefinite-lived intangible assets. In addition, the Company evaluates the remaining useful life of its indefinite-lived intangible assets at least each reporting period to determine whether events or circumstances continue to support an indefinite useful life. If events or circumstances indicate that the useful lives of indefinite-lived intangible assets are no longer indefinite, the assets will be tested for impairment.
The Company performed its annual impairment testing as of July 1, 2018, 2017 and 2016 and concluded that there is no impairment to its indefinite lived trade names. During the fourth quarter of fiscal 2017, the Company concluded that the useful lives of the indefinite-lived ADH trade names are no longer indefinite as a result of the Company's decision to phase in one national brand name for this business. The Company performed an impairment test using the relief from royalty model over the remaining useful life of one year. The impairment test indicated that the $3.4 million carrying value of the indefinite-lived ADH trade names exceeded its fair value, resulting in an impairment charge of $3.0 million which is included in Goodwill and intangible asset impairment in the consolidated statement of income for the year ended September 30, 2017. The remaining net book value of $0.4 million was amortized over the remaining useful life of one year, and the ADH trade names are fully amortized as of September 30, 2018.
Long-Lived Asset Impairment Testing
The Company reviews long-lived tangible and intangible assets for impairment when events or circumstances have occurred that indicate the estimated useful life of these assets may warrant revision or that the carrying amount of these assets may be impaired.
During the fiscal year ended September 30, 2018, the Company concluded that there were no triggering events associated with long-lived assets, except for the divestitures described in Note 6. The Company performed a test of recoverability, which indicated that the carrying value of the associated assets was no longer recoverable. As a result, the Company recorded $6.1 million of accelerated amortization related to definite-lived intangible assets and a $1.2 million loss on the disposition of fixed assets associated with these programs.
During the fiscal years ended September 30, 2017 and 2016, the Company concluded it had a triggering event requiring assessment of impairment for certain long-lived assets held by ADH due to the impairment of goodwill. The Company estimated the future net undiscounted cash flows and compared them to the carrying amount of the assets. Based on this assessment the Company concluded that the assets are recoverable as the undiscounted cash flows exceeded the carrying amount, therefore; an impairment did not exist at September 30, 2017 and 2016.
The estimated remaining amortization expense related to intangible assets with finite lives for each of the five succeeding years and thereafter is as follows:
Year Ending September 30, | (In thousands) | ||
2019 | $ | 44,022 | |
2020 | 42,580 | ||
2021 | 39,165 | ||
2022 | 37,360 | ||
2023 | 33,019 | ||
Thereafter | 78,626 | ||
$ | 274,772 | ||
8. Property and Equipment
F-22
Property and equipment consists of the following as of September 30 (in thousands):
2018 | 2017 | ||||||
Buildings, building improvements and land | $ | 133,963 | $ | 126,497 | |||
Vehicles | 85,958 | 76,677 | |||||
Computer hardware and software | 38,536 | 35,863 | |||||
Leasehold improvements | 108,203 | 97,476 | |||||
Furniture and fixtures | 22,500 | 19,530 | |||||
Office and telecommunication equipment | 8,281 | 7,613 | |||||
Software for internal use | 8,293 | 6,129 | |||||
Construction in progress | 3,144 | 3,181 | |||||
408,878 | 372,966 | ||||||
Less accumulated depreciation | (211,886 | ) | (189,628 | ) | |||
Property and equipment, net | $ | 196,992 | $ | 183,338 | |||
For fiscal years ended 2018, 2017 and 2016, depreciation expense for continuing operations was $44.8 million, $38.7 million and $34.9 million, respectively.
9. Certain Balance Sheet Accounts
Prepaid Expenses and Other Current Assets
Prepaid expenses and other current assets consist of the following as of September 30 (in thousands):
2018 | 2017 | ||||||
Insurance recovery receivables | $ | 6,127 | $ | 7,291 | |||
Prepaid business expense | 3,807 | 3,827 | |||||
Interest rate swap agreements | 3,447 | — | |||||
Prepaid income taxes | 1,089 | — | |||||
Prepaid insurance | 1,049 | 279 | |||||
Other | 2,920 | 1,601 | |||||
Prepaid expenses and other current assets | $ | 18,439 | $ | 12,998 | |||
Other Accrued Liabilities
Other accrued liabilities consist of the following as of September 30 (in thousands):
2018 | 2017 | ||||||
Accrued insurance | $ | 16,910 | $ | 19,328 | |||
Due to third party payors | 6,723 | 6,942 | |||||
Accrued professional services | 3,522 | 3,225 | |||||
Deferred revenue | 3,370 | 2,371 | |||||
Real estate and property taxes | 2,489 | 2,743 | |||||
Other | 10,850 | 7,675 | |||||
Other accrued liabilities | $ | 43,864 | $ | 42,284 | |||
Other Long-Term Liabilities
Other long-term liabilities consist of the following as of September 30 (in thousands):
2018 | 2017 | ||||||
Accrued self-insurance reserves | $ | 55,649 | $ | 55,096 | |||
Deferred compensation liabilities | 14,603 | 13,578 | |||||
Other | 9,595 | 8,407 | |||||
Other long-term liabilities | $ | 79,847 | $ | 77,081 | |||
F-23
10. Long-term Debt
The Company’s long-term debt consists of the following as of September 30 (in thousands):
2018 | 2017 | ||||||
Term loan principal; principal and interest are due in quarterly installments through January 31, 2021 | $ | 700,145 | $ | 632,476 | |||
Original issue discount on term loan, net of accumulated amortization | (1,020 | ) | (901 | ) | |||
Deferred financing costs, net of accumulated amortization | (3,597 | ) | (5,122 | ) | |||
695,528 | 626,453 | ||||||
Less current portion | 7,331 | 6,554 | |||||
Long-term debt | $ | 688,197 | $ | 619,899 | |||
As of September 30, 2018 and 2017, the Company did not have any borrowings under the senior revolver.
Senior Secured Credit Facilities
As of September 30, 2018, NMHI's senior credit agreement (the “senior credit agreement”), as amended, governs a $730.0 million Tranche B term loan facility (the “term loan facility”), of which $50.0 million was deposited in a cash collateral account in support of the issuance of letters of credit under an institutional letter of credit facility (the “institutional letter of credit facility”), and a $160.0 million senior secured revolving credit facility (the “senior revolver”). The term loan facility matures on January 31, 2021 a portion of the commitments under the senior revolver matures on January 31, 2019 and a portion of the commitments under the senior revolver matures on January 31, 2021, as described below. All of the obligations under the senior secured credit facilities are guaranteed by NMHH and the subsidiary guarantors named therein. The senior credit agreement provides that NMHI may make one or more offers to the lenders, and consummate transactions with individual lenders that accept the terms contained in such offers, to extend the maturity date of the lender’s term loans and/or revolving commitments, subject to certain conditions, and any extended term loans or revolving commitments will constitute a separate class of term loans or revolving commitments.
On October 24, 2017, NMHI entered into Amendment No. 6 to its senior credit agreement which provided for an incremental $75.0 million term loan. The net proceeds of the incremental term loan were used by the Company for the acquisition of Mentis, with any excess proceeds used for general corporate purposes.
On November 21, 2017, NMHI entered into Amendment No. 7 to its senior credit agreement which increased the aggregate revolving commitments from $120.0 million to $160.0 million and extended the maturity date for $90.0 million of the revolving commitments (the “Extended Revolving Commitments") to January 31, 2021. The terms of the remaining $70.0 million of the revolving commitments (the "Initial Revolving Commitments"), which mature on January 31, 2019, remain unchanged. All of the other terms of the Extended Revolving Commitments are identical to the Initial Revolving Commitments, except that the applicable margin for the Extended Revolving Commitments will decrease by 0.25% per annum when the Initial Revolving Commitments are terminated or expire.
The senior revolver includes borrowing capacity available for letters of credit and for borrowings on same-day notice, referred to as the “swingline loans.” Any issuance of letters of credit or borrowing on a swingline loan will reduce the amount available under the senior revolver. As of September 30, 2018, NMHI had no borrowings under the senior revolver, $48.5 million of letters of credit issued under the institutional letter of credit facility and $2.9 million of standby letters of credit under the senior revolver.
On May 25, 2017, NMHI entered into Amendment No. 5 to its senior credit agreement (the "repricing amendment"). Under the terms of the repricing amendment, the applicable interest margin for the term loan facility under the senior credit agreement decreased by 25 basis points for both alternate base rate ("ABR") borrowings and Eurodollar borrowings, and reduced the Eurodollar floor by 25 basis points. The repricing amendment also reset the period during which a 1.0% prepayment premium may be required for a repricing transaction (as defined in the senior credit agreement) until May 25, 2018.
As a result of the repricing amendment, borrowings under the term loan facility bear interest, at our option, at: (i) an alternate base rate ("ABR") equal to the greater of (a) the prime rate of Barclays Bank PLC, (b) the federal funds rate plus 1/2 of 1.0%, and (c) the Eurodollar rate for an interest period of one-month plus 100 basis points (provided that the ABR applicable to the term loan facility will not be less than 2.00% per annum), plus 2.00%; or (ii) the Eurodollar rate (provided that the Eurodollar rate applicable to the term loan facility will not be less than 0.75% per annum), plus 3.00%. Borrowings under
F-24
the revolving and swingline loans bear interest at our option at (i) an alternate base rate equal to the greater of (a) the prime rate of Barclays Bank PLC, (b) the federal funds rate plus 1/2 of 1.0%, and (c) the Eurodollar rate for an interest period of one-month plus 100 basis points (provided that the ABR applicable to the term loan facility will not be less than 2.00% per annum), plus 2.25%; or (ii) the Eurodollar rate (provided that the Eurodollar rate applicable to the term loan facility will not be less than 0.75% per annum), plus 3.25%. NMHI is also required to pay a commitment fee to the lenders under the senior revolver at an initial rate of 0.50% of the average daily unutilized commitments thereunder. NMHI must also pay customary letter of credit fees.
The senior credit agreement requires NMHI to make mandatory prepayments, subject to certain exceptions, on a percentage of NMHI's annual Excess Cash Flow, as defined in the senior credit agreement. NMHI determines whether or not a mandatory prepayment is required at the end of each fiscal year. NMHI was not required to make a prepayment for the fiscal year ended September 30, 2018.
Covenants
The senior credit agreement contains negative covenants, including, among other things, limitations on the Company’s ability to incur additional debt, create liens on assets, transfer or sell assets, pay dividends, redeem stock or make other distributions or investments, and engage in certain transactions with affiliates. The senior credit agreement contains a springing financial covenant. If, at the end of any fiscal quarter, the Company’s outstanding borrowings under the senior revolver exceeds 30% of the commitments thereunder, it is required to maintain at the end of each such fiscal quarter a consolidated first lien leverage ratio of not more than 5.00 to 1.00. The springing financial covenant was not in effect as of September 30, 2018 as our usage of the senior revolver did not exceed the threshold for that quarter.
Derivatives
On January 20, 2015, NMHI entered into two interest rate swap agreements in an aggregate notional amount of $375.0 million in order to reduce the variability of cash flows of our variable rate debt. NMHI entered into these interest rate swaps to hedge the risk of changes in the floating rate of interest on borrowings under the term loan. Under the terms of the swaps, NMHI will receive from the counterparty a quarterly payment based on a rate equal to the greater of 3-month LIBOR or 1.00% per annum, and NMHI will make payments to the counterparty based on a fixed rate of 1.795% per annum, in each case on the notional amount of $375.0 million, settled on a net payment basis. The swap agreements expire on March 31, 2020.
The fair value of the swap agreements, representing the price that would be received to transfer the liability in an orderly transaction between market participants, was an asset of $5.8 million at September 30, 2018 and a liability of $0.2 million at September 30, 2017. Based on the timing of the associated cash flows, the fair value was split between current and long-term classification on the Company’s consolidated balance sheet in Prepaid expenses and other current assets and Other assets as of September 30, 2018 and in Other accrued liabilities as of September 30, 2017. The fair value was determined based on pricing models and independent formulas using current assumptions. Hedge ineffectiveness, if any, associated with the swap is recorded as interest expense in the period incurred. During the year ended September 30, 2018, the ineffective portion of gains resulting from changes in fair value was $0.3 million which was recorded in Interest expense in the consolidated statement of income. The Company did not record any interest expense for ineffectiveness during the years ended September 30, 2017 and 2016. No amounts were excluded from ineffectiveness testing for the years ended September 30, 2018, 2017, and 2016.
Annual maturities
Annual maturities of the Company’s debt for the fiscal year ended September 30 are as follows:
(In thousands) | |||
2019 | $ | 7,331 | |
2020 | 7,331 | ||
2021 | 685,483 | ||
Total | $ | 700,145 | |
F-25
Amounts due at any year end may increase as a result of the provision in the senior credit agreement that requires a prepayment of a portion of the outstanding term loan amount if NMHI generates certain levels of cash flow.
11. Stockholders' Equity
Common Stock
The holders of the Company’s common stock are entitled to receive dividends when and as declared by the Company’s Board of Directors. In addition, the holders of common stock are entitled to one vote per share.
Preferred Stock
The Company has authorized 50,000,000 shares of $0.01 par value preferred stock. No shares of preferred stock are outstanding.
Stock Repurchase Program
On February 8, 2018, the Company announced that the Board of Directors approved a stock repurchase program under which the Company was authorized to repurchase up to $25.0 million of the Company’s outstanding common stock from time to time in the open market, through negotiated transactions or otherwise (including, without limitation, the use of Rule 10b5-1 plans). The Company conducted any open market stock repurchase activities in compliance with the safe harbor provisions of Rule 10b-18 of the Exchange Act. During the year ended September 30, 2018, the Company repurchased and retired 1,470,785 shares for $21.6 million under the program, which was implemented through a 10b5-1 plan. The stock repurchase program expired on August 12, 2018, and the Company does not have authorization to repurchase any additional common stock under the program.
12. Employee Savings and Retirement Plans
The Company has a multi-company plan (the “Plan”) which covers all of its wholly-owned subsidiaries. Under the Plan, employees may contribute a portion of their earnings, which are invested in mutual funds of their choice. After January 1, the Company makes a matching contribution for the previous calendar year on behalf of all participants employed on the last day of the year. This matching contribution vests immediately. In addition, there is a profit sharing feature of the Plan, whereby, at the discretion of management, an allocation may be made to all of the eligible employees in one or more of its business units. Profit sharing contributions vest ratably over three years with forfeitures available to cover plan costs and employer matches in future years. The Company made contributions of $5.5 million, $6.2 million and $6.4 million, for fiscal years 2018, 2017 and 2016, respectively.
The Company has the following two deferred compensation plans:
The National Mentor Holdings, LLC Executive Deferred Compensation Plan
The National Mentor Holdings, LLC Executive Deferred Compensation Plan is an unfunded, nonqualified deferred compensation arrangement for senior management, in which the Company contributes to the executive’s account a percentage of the executive’s base compensation. This contribution is made at the end of the year for service rendered during the year. The Company contributed $0.5 million, $0.4 million and $0.6 million for fiscal 2018, 2017 and 2016, respectively. The unfunded accrued liability was $3.1 million and $3.0 million as of September 30, 2018 and 2017, respectively, and was included in other long-term liabilities on the Company’s consolidated balance sheets.
The National Mentor Holdings, LLC Executive Deferral Plan
The National Mentor Holdings, LLC Executive Deferral Plan, available to highly compensated employees, is a plan in which participants contribute a percentage of salary and/or bonus earned during the year. Employees contributed $1.1 million, $1.1 million and $1.3 million for fiscal 2018, 2017 and 2016, respectively. The accrued liability related to this plan was $11.5 million and $10.4 million as of September 30, 2018 and 2017, respectively, and was included in other long-term liabilities on the Company’s consolidated balance sheets.
In connection with the National Mentor Holdings, LLC Executive Deferral Plan, the Company has purchased company owned life insurance (“COLI”) policies on certain plan participants. The cash surrender value of the COLI policies is designed to provide a source for funding the accrued liability. The cash surrender value of the COLI policies was $10.1 million
F-26
and $9.0 million as of September 30, 2018 and 2017, respectively, and was included in other assets on the Company’s consolidated balance sheets.
The expense related to the deferred compensation plans for the fiscal years ended September 30, 2018, 2017 and 2016 was $1.7 million, $1.9 million and $1.6 million, respectively.
13. Related Party Transactions
Lease Agreements
The Company leases several offices, homes and other facilities from its employees, or from relatives of employees, primarily in the states of Minnesota, Wisconsin and Michigan. These leases have various expiration dates extending out as far as September 2024. Related party lease expense was $0.9 million, $0.7 million and $0.7 million for the fiscal years ended September 30, 2018, 2017 and 2016, respectively.
14. Fair Value Measurements
The Company measures and reports its financial assets and liabilities on the basis of fair value. Fair value is defined as the price that would be received to sell an asset or paid to transfer a liability (an exit price) in the principal or most advantageous market for the asset or liability in an orderly transaction between market participants on the measurement date.
Valuation techniques for assets and liabilities measured using Level 3 inputs may include methodologies such as the market approach, the income approach or the cost approach, and may use unobservable inputs such as projections, estimates and management’s interpretation of current market data. These unobservable inputs are only utilized to the extent that observable inputs are not available or cost-effective to obtain.
A description of the valuation methodologies used for instruments measured at fair value as well as the general classification of such instruments pursuant to the valuation hierarchy, is set forth below.
The following table set forth the Company’s assets and liabilities that were accounted for at fair value on a recurring basis as of September 30, 2018.
(in thousands) | Total | Quoted Market Prices (Level 1) | Significant Other Observable Inputs (Level 2) | Significant Unobservable Inputs (Level 3) | |||||||||||
Assets | |||||||||||||||
Interest rate swap agreements (current) | $ | 3,447 | $ | — | $ | 3,447 | $ | — | |||||||
Interest rate swap agreements (long-term) | 2,320 | — | 2,320 | — | |||||||||||
Total | $ | 5,767 | $ | — | $ | 5,767 | $ | — | |||||||
Liabilities | |||||||||||||||
Contingent consideration | $ | 1,805 | $ | — | $ | — | $ | 1,805 | |||||||
The following table set forth the Company’s assets and liabilities that were accounted for at fair value on a recurring basis as of September 30, 2017.
(in thousands) | Total | Quoted Market Prices (Level 1) | Significant Other Observable Inputs (Level 2) | Significant Unobservable Inputs (Level 3) | |||||||||||
Liabilities | |||||||||||||||
Interest rate swap agreements | $ | (153 | ) | $ | — | $ | (153 | ) | $ | — | |||||
Interest rate-swap agreements. The Company’s interest rate swap agreements are classified within level 2 of the fair value hierarchy. Based on the timing of the associated cash flows, the fair value of the swap agreements was recorded in Prepaid expenses and other current assets, Other assets, or Other accrued liabilities in the Company’s consolidated balance
F-27
sheets. The fair value of these agreements was determined based on pricing models and independent formulas using current assumptions that included swap terms, interest rates and forward LIBOR curves and the Company’s credit risk.
Contingent Consideration. In connection with the acquisitions of Powell, Jac-Lin, and CCI in fiscal 2018, the Company recorded contingent consideration pertaining to the amounts potentially payable to the former owners upon the businesses achieving certain performance targets. The fair values of the Company's contingent consideration obligations were based on a probability-weighted approach derived from the overall likelihood of achieving certain performance targets. The fair value measurement was based on significant inputs not observable in the market, which represent Level 3 inputs within the fair value hierarchy.
The following table presents a summary of changes in fair value of the Company’s Level 3 liabilities measured on a recurring basis for fiscal years 2018 and 2017.
(in thousands) | Level 3 Inputs Liabilities | ||
Balance at September 30, 2016 | $ | 5,915 | |
Fair value adjustments | 194 | ||
Payments (1) | (6,109 | ) | |
Balance at September 30, 2017 | — | ||
Acquisition date fair value of contingent consideration obligations recorded | 1,805 | ||
Balance at September 30, 2018 | $ | 1,805 | |
(1) The Company settled the remaining Adult Day Health and Cassell contingent consideration obligations during the year ended September 30, 2017 for $6.1 million.
As of September 30, 2018, the Company had $1.8 million of contingent consideration liabilities, which was reflected in Other accrued liabilities or Other long-term liabilities. As of September 30, 2017, the Company had no contingent consideration liability.
Items Measured at Fair Value on a Nonrecurring Basis. The Company’s intangible assets are measured at fair value on a nonrecurring basis using Level 3 inputs. During the year ended September 30, 2017, the Company recorded a $3.0 million impairment charge associated with the indefinite-lived ADH trade names due to the Company's decision to phase in one national brand name for its ADH business unit. See Note 7 for further information about the impairment charge which was recorded in Goodwill and intangible asset impairment in the consolidated statement of income. The impairment charge was determined by comparing the fair value based on the relief from royalty model over the remaining useful life of one year to the assets' carrying value of $3.4 million.
There were no other items measured at fair value on a nonrecurring basis during the years ended September 30, 2018, 2017 or 2016.
At September 30, 2018 and 2017, the carrying values of cash, accounts receivable, accounts payable and variable rate debt approximated fair value.
15. Leases
Operating leases
The Company leases office and residential facilities, vehicles and certain office equipment in several locations under operating lease arrangements, which expire at various dates through fiscal 2033. In addition to base rents presented below, the majority of the leases require payments for additional expenses such as taxes, maintenance and utilities. Certain of the leases contain renewal options at the Company’s option and some have escalation clauses which are recognized as rent expense on a straight line basis. Total rent expense from continuing operations for fiscal 2018, 2017 and 2016 was $92.9 million, $73.5 million and $70.0 million, respectively. Rent expense for the year ended September 30, 2018 includes $10.0 million in lease termination costs associated with the divestitures described in Note 6.
Future minimum lease payments for non-cancellable operating leases for the fiscal years ending September 30 are as follows (in thousands):
F-28
2019 | $ | 75,606 | |
2020 | 63,896 | ||
2021 | 52,943 | ||
2022 | 43,118 | ||
2023 | 32,967 | ||
Thereafter | 105,260 | ||
$ | 373,790 | ||
Capital leases
The Company leases certain facilities and office equipment under various non-cancellable capital leases that expire at various dates through fiscal 2033. Assets acquired under capital leases with an original cost of $14.9 million and $7.8 million and related accumulated amortization of $4.6 million and $4.0 million are included in property and equipment, net as of September 30, 2018 and 2017, respectively. Amortization expense for fiscal years 2018, 2017 and 2016 was $0.7 million, $0.6 million, and $0.6 million, respectively.
The following is a schedule of the future minimum lease payments under the capital leases for the fiscal years ending September 30 (in thousands):
2019 | $ | 1,882 | |
2020 | 1,901 | ||
2021 | 1,922 | ||
2022 | 1,618 | ||
2023 | 1,531 | ||
Thereafter | 10,877 | ||
Total minimum lease payments | 19,731 | ||
Less: Interest payments | (8,123 | ) | |
$ | 11,608 | ||
Interest expense on capital leases during fiscal years 2018, 2017 and 2016 was $0.7 million, $0.6 million, and $0.6 million, respectively.
16. Accruals for Self-Insurance
The Company maintains insurance for professional and general liability, workers’ compensation liability, automobile liability and health insurance liabilities that includes self-insured retentions. The Company intends to maintain such coverage in the future and is of the opinion that its insurance coverage is adequate to cover potential losses on asserted claims. Employment practices liability is fully self-insured.
The Company records expenses related to claims on an incurred basis, which includes estimates of fully developed losses for both reported and unreported claims. The accruals for the health, workers’ compensation, automobile, and professional and general liability programs are based on analyses performed by management and take into account reports by independent third parties. Accruals are periodically reevaluated and increased or decreased based on new information. The expense related to professional and general liability for the fiscal years ended September 30, 2018, 2017 and 2016 was $13.5 million, $7.2 million and $12.9 million, respectively. The expense related to employment practices liability for the fiscal years ended September 30, 2018, 2017 and 2016 was $2.2 million, $5.5 million, and $0.2 million, respectively.
For professional and general liability, the Company is self-insured for $3.0 million per claim and $28.0 million in the aggregate. For workers’ compensation, the Company has a $350 thousand per claim retention with statutory limits. Automobile liability has a $100 thousand per claim retention, with additional insurance coverage above the retention. The Company purchases specific stop loss insurance as protection against extraordinary claims liability for health insurance claims. Stop loss insurance covers claims that exceed $300 thousand on a per member, per event basis.
The Company reports its self-insurance liabilities on a gross basis without giving effect to insurance recoveries. Anticipated insurance recoveries are presented in Prepaid expenses and other current assets and Other assets on the Company’s
F-29
consolidated balance sheets. Self-insured liabilities are presented in Accrued payroll and related costs, Other accrued liabilities and Other long-term liabilities on its consolidated balance sheets.
17. Other Commitments and Contingencies
The Company is in the health and human services business and, therefore, has been and continues to be subject to numerous claims alleging that the Company, its employees or its independently contracted host-home caregivers (“Mentors”) failed to provide proper care for an individual served by the Company. The Company is also subject to claims by these individuals, its employees, its Mentors or community members against the Company for negligence, intentional misconduct or violation of applicable laws. Included in the Company’s recent claims are claims alleging personal injury, assault, abuse, wrongful death, violations of wage and hour laws and other charges. Regulatory agencies may initiate administrative proceedings alleging that the Company’s programs, employees or agents violate statutes and regulations and seek to impose monetary penalties on the Company. The Company could be required to incur significant costs to respond to regulatory investigations or defend against civil lawsuits and, if the Company does not prevail, the Company could be required to pay substantial amounts of money in damages, settlement amounts or penalties arising from these legal proceedings.
The Company is also subject to potential lawsuits under the False Claims Act and other federal and state whistleblower statutes designed to combat fraud and abuse in the health care industry. These lawsuits can involve significant monetary awards that may incentivize private plaintiffs to bring these suits. If the Company is found to have violated the False Claims Act, it could be excluded from participation in Medicaid and other federal healthcare programs which would have a material adverse effect on our business. The Patient Protection and Affordable Care Act provides a mandate for more vigorous and widespread enforcement activity to combat fraud and abuse in the health care industry.
The Company is also subject to employee-related claims under state and federal law, including claims for wage and hour violations under the Fair Labor Standards Act or state wage and hour laws, and claims for discrimination, wrongful discharge or retaliation. The Company currently has two pending complaints in California state court that allege certain wage and hour violations of California labor laws and seek to be designated as class-actions. Two additional wage and hour complaints have been settled and approved by the court. The Company's policy is to accrue for all probable and estimable claims using information available at the time the financial statements are issued. Actual claims could settle in the future at materially different amounts due to the nature of litigation.
18. Income Taxes
The provision (benefit) for income taxes consists of the following as of September 30 (in thousands):
2018 | 2017 | 2016 | |||||||||
Current: | |||||||||||
Federal | $ | 7,572 | $ | 18,701 | $ | 5,382 | |||||
State | 3,788 | 5,708 | 3,549 | ||||||||
Total current tax provision | 11,360 | 24,409 | 8,931 | ||||||||
Deferred: | |||||||||||
Federal | (10,128 | ) | (17,894 | ) | 4,701 | ||||||
State | (1,836 | ) | (4,651 | ) | (342 | ) | |||||
Net deferred tax provision (benefit) | (11,964 | ) | (22,545 | ) | 4,359 | ||||||
Income tax provision (benefit) | $ | (604 | ) | $ | 1,864 | $ | 13,290 | ||||
On December 22, 2017, the Tax Cuts and Jobs Act (the "Tax Act") was enacted into law in the United States. The Tax Act significantly revises corporate income tax law by, among other things, lowering the corporate income tax rates from 35% to 21%. Under GAAP, deferred taxes must be adjusted for enacted changes in tax laws or rates during the period in which new tax legislation is enacted. During the year ended September 30, 2018, a tax benefit of approximately $4.9 million was recorded, representing the revaluation of deferred tax assets and liabilities as a result of the lower corporate tax rate established by the Tax Act. As of September 30, 2018, the Company has completed the accounting for the tax effects of the enactment of the Tax Act.
F-30
Deferred income taxes reflect the net tax effects of temporary differences between the carrying amount of the assets and liabilities for financial reporting purposes and the amounts used for income tax purposes. Significant components of the Company’s deferred tax assets and liabilities consist of the following as of September 30 (in thousands):
2018 | 2017 | ||||||
Gross deferred tax assets: | |||||||
Deferred compensation | $ | 869 | $ | 1,300 | |||
Interest rate swap agreements | — | 62 | |||||
Accrued workers’ compensation | 7,414 | 11,147 | |||||
Net operating loss carryforwards | 10,188 | 6,215 | |||||
Allowance for bad debts | 6,317 | 6,398 | |||||
Stock compensation | 3,225 | 3,353 | |||||
Other accrued liabilities | 10,040 | 9,634 | |||||
38,053 | 38,109 | ||||||
Valuation allowance | (7,859 | ) | (6,215 | ) | |||
Deferred tax assets | 30,194 | 31,894 | |||||
Deferred tax liabilities: | |||||||
Interest rate swap agreements | (1,501 | ) | — | ||||
Depreciation | (4,610 | ) | (1,596 | ) | |||
Amortization of goodwill and intangible assets | (32,205 | ) | (52,647 | ) | |||
Net deferred tax liabilities | $ | (8,122 | ) | $ | (22,349 | ) | |
The Company is required to record a valuation allowance to reduce the deferred tax assets if, based on the weight of the evidence, it is more likely than not that some portion or all of the deferred tax assets will not be realized. After consideration of all the evidence, both positive and negative, management determined that valuation allowances at September 30, 2018 and 2017 of $7.9 million and $6.2 million, respectively, were necessary to reduce the deferred tax assets to the amount that will more likely than not be realized. The valuation allowances primarily related to certain state net operating loss carryforwards.
For federal purposes, the Company had $11.1 million net operating loss carryforwards as of September 30, 2018. For state purposes, the Company had $145.6 million of net operating loss carryforwards for fiscal 2018, which expire from 2018 through 2038.
The following is reconciliation between the statutory and effective income tax rates at September 30 (in thousands):
2018 | 2017 | 2016 | ||||||
Federal income tax at statutory rate | 24.5 | % | 35.0 | % | 35.0 | % | ||
State income taxes, net of federal tax benefit | 10.3 | % | 8.5 | % | 9.3 | % | ||
Nondeductible compensation(1) | 4.1 | % | 7.9 | % | 18.8 | % | ||
Other nondeductible expenses | 1.4 | % | (0.4 | )% | 1.5 | % | ||
Credits | (16.9 | )% | (22.5 | )% | (6.6 | )% | ||
Impacts of the Tax Act(2) | (34.4 | )% | 0.0 | % | 0.0 | % | ||
Other | 6.8 | % | (5.8 | )% | 0.4 | % | ||
Effective tax rate | (4.2 | )% | 22.7 | % | 58.4 | % | ||
(1) The higher impact on the effective rate for fiscal 2016 was due to a stock compensation charge of $10.5 million recorded in the first quarter of fiscal 2016 related to certain awards under our former equity compensation plan that vested in October 2015. Refer to Note 21 - Stock-Based Compensation for further information.
(2) The revaluation of the Company's deferred tax assets and liabilities due to the lower corporate tax rate established by the Tax Act resulted in a $4.9 million tax benefit during the year ended September 30, 2018.
Companies may recognize the tax benefit from an uncertain tax position only if it is more likely than not that the tax position will be sustained on examination by the taxing authorities, based on the technical merits of the position. The tax benefits recognized in the financial statements from such a position should be measured based on the largest benefit that has a greater than fifty percent likelihood of being realized upon ultimate settlement.
F-31
There was no unrecognized tax benefit for the years ended September 30, 2018, 2017 and 2016. The Company does not expect any significant changes to unrecognized tax benefits within the next twelve months.
The Company recognizes interest and penalties related to uncertain tax positions as a component of income tax expense which is consistent with the recognition of these items in prior reporting periods. No interest and penalties were accrued as of September 30, 2018, 2017 and 2016.
The Company files a federal consolidated return and files various state income tax returns and, generally, the Company is no longer subject to income tax examinations by the taxing authorities for years prior to September 30, 2015. The Company believes that it has appropriate support for the income tax positions taken and to be taken on the Company’s income tax returns. In addition, the Company believes its accruals for income tax liabilities are adequate for all open years based on an assessment of many factors including past experience and interpretations of the tax laws as applied to the facts of each matter.
19. Segment Information
The Company has three reportable business segments: the CSS segment, the SRS segment, and the CFS segment.
Through the CSS segment, the Company provides home- and community-based human services to adults and children with intellectual and developmental disabilities. Through the SRS segment, the Company delivers services to individuals who have suffered acquired brain injury, spinal injuries and other catastrophic injuries and illnesses. The operations of the SRS segment were previously organized by management into two operating segments, NeuroRestorative and CareMeridian, based upon service type. The NeuroRestorative operating group provides behavioral therapies to individuals with brain injuries in post-acute community settings and the CareMeridian operating group provides a higher level of medical support to individuals with traumatic injuries. Effective as of October 1, 2017, NeuroRestorative and CareMeridian are operated under one management team and no longer represent individual components of the SRS segment. Through the CFS segment, the Company provides home- and community-based human services to youth with emotional, behavioral and/or medically complex challenges.
Each operating group is aligned with the Company’s reporting structure and has a segment manager that is directly accountable for its operations and regularly reports results to the chief operating decision maker, which is the Company's Chief Operating Officer, for the purpose of evaluating these results and making decisions regarding resource allocations.
The Company evaluates performance based on EBITDA. EBITDA for each segment is defined as income (loss) from continuing operations for the segment before income taxes, before depreciation and amortization, and interest income (expense).
Activities classified as “Corporate and Other” in the table below relate to the results of the ADH operating segment and unallocated home office expenses and stock-based compensation expense. Total assets included in the Corporate and Other segment include assets associated with the ADH operating segment and assets maintained by the corporate entity including cash, restricted cash, and other current and non-current assets.
F-32
The following table is a financial summary by reportable segments for the periods indicated (in thousands).
For the Year Ended September 30, | CSS | SRS | CFS | Corporate/Other | Consolidated | ||||||||||||||
2018 | |||||||||||||||||||
Net revenue | $ | 1,025,612 | $ | 356,281 | $ | 147,676 | $ | 72,633 | $ | 1,602,202 | |||||||||
EBITDA | 137,299 | 54,512 | 21,772 | (65,091 | ) | 148,492 | |||||||||||||
Total assets | 503,849 | 333,862 | 67,690 | 221,791 | 1,127,192 | ||||||||||||||
Depreciation and amortization | 43,738 | 31,045 | 5,445 | 15,193 | 95,421 | ||||||||||||||
Purchases of property and equipment | 26,491 | 14,822 | 1,901 | 7,827 | 51,041 | ||||||||||||||
2017 | |||||||||||||||||||
Net revenue | $ | 967,033 | $ | 309,543 | $ | 141,742 | $ | 56,192 | $ | 1,474,510 | |||||||||
EBITDA (2) | 138,976 | 51,799 | 21,590 | (95,060 | ) | 117,305 | |||||||||||||
Total assets | 512,658 | 257,718 | 71,298 | 207,708 | 1,049,382 | ||||||||||||||
Depreciation and amortization | 37,445 | 23,622 | 5,662 | 8,984 | 75,713 | ||||||||||||||
Purchases of property and equipment | 25,234 | 12,625 | 1,258 | 7,532 | 46,649 | ||||||||||||||
2016 | |||||||||||||||||||
Net revenue (1) | $ | 935,941 | $ | 289,093 | $ | 147,279 | $ | 35,274 | $ | 1,407,587 | |||||||||
EBITDA (2) | 140,279 | 54,855 | 20,597 | (86,112 | ) | 129,619 | |||||||||||||
Total assets | 475,206 | 253,612 | 82,617 | 256,710 | 1,068,145 | ||||||||||||||
Depreciation and amortization | 37,850 | 23,412 | 5,722 | 6,077 | 73,061 | ||||||||||||||
Purchases of property and equipment | 21,050 | 11,417 | 1,990 | 8,899 | 43,356 | ||||||||||||||
(1) In fiscal 2015 and 2016, we discontinued CFS services in the states of Illinois, Florida, Indiana, Louisiana, North Carolina and Texas. Included in the results for fiscal 2016 is net revenue of $7.1 million related to these businesses.
(2) Included in the results for fiscal years 2017 and 2016 are goodwill impairment charges of 28.0 million and $10.3 million, respectively, related to the ADH reporting unit which is included in Corporate and Other.
A reconciliation of EBITDA to income from continuing operations on a consolidated basis is as follows (in thousands):
Year Ended September 30 | |||||||||||
2018 | 2017 | 2016 | |||||||||
EBITDA | $ | 148,492 | $ | 117,305 | $ | 129,619 | |||||
Less: | |||||||||||
Depreciation and amortization | 95,421 | 75,713 | 73,061 | ||||||||
Interest expense, net (1) | 38,789 | 33,397 | 33,811 | ||||||||
Income from continuing operations before income taxes | $ | 14,282 | $ | 8,195 | $ | 22,747 | |||||
(1) Interest expense, net includes interest income and acquisition related contingent consideration liabilities which is included in Other income (expense) in the consolidated statement of income.
20. Net Income Per Share
Basic net income per common share is computed by dividing net income by the basic weighted average number of common shares outstanding during the period. Diluted net income per common share is computed by dividing net income by the diluted weighted average number of common shares and common equivalent shares outstanding during the period. The weighted average number of common equivalent shares outstanding has been determined in accordance with the treasury-stock method. Common equivalent shares consist of common stock issuable on the exercise of outstanding options and vesting of restricted stock units when dilutive.
F-33
The following table sets forth the computation of basic and diluted earnings per share (“EPS”):
Year Ended September 30, | ||||||||||||
2018 | 2017 | 2016 | ||||||||||
Numerator | ||||||||||||
Net income | $ | 14,886 | $ | 6,331 | $ | 9,187 | ||||||
Denominator | ||||||||||||
Weighted average shares outstanding, basic | 36,811,208 | 37,302,941 | 37,112,794 | |||||||||
Weighted average common equivalent shares | 134,200 | 163,384 | 150,121 | |||||||||
Weighted average shares outstanding, diluted | 36,945,408 | 37,466,325 | 37,262,915 | |||||||||
Net income per share, basic and diluted | $ | 0.40 | $ | 0.17 | $ | 0.25 | ||||||
Equity instruments excluded from diluted net income per share calculation as the effect would have been anti-dilutive: | ||||||||||||
Stock options | 849,550 | 789,702 | 534,312 | |||||||||
Performance and restricted stock units | 282,744 | 92,435 | 83,793 | |||||||||
21. Stock-Based Compensation
Summary of Stock-Based Compensation Plans
2014 Plan
Civitas maintains a 2014 Omnibus Incentive Plan (“2014 Plan”). As of September 30, 2018, the 2014 Plan authorized the issuance of up to 7,786,478 shares of common stock as stock-based awards, including incentive stock options (“ISOs”), non-qualified stock options (“NSOs”), restricted stock units (“RSUs”) and performance based restricted stock units ("PRSUs").
Stock Options
For the years ended September 30, 2018, 2017 and 2016, Civitas issued 155,041, 319,604 and 230,739 NSOs, respectively, which vest over three years (one-third each year). The fair value of each option granted was estimated on the grant date using the Black-Scholes valuation model with the following assumptions:
2018 | 2017 | 2016 | ||||||
Risk-free interest rate | 2.22% - 2.74% | 1.83% - 2.08% | 1.32% - 1.92% | |||||
Expected term | 6 years | 6 years | 6 years | |||||
Expected volatility | 33.56% - 35.81% | 34.32% - 36.21% | 34.65% - 36.20% | |||||
Expected dividend yield | — | % | — | % | — | % | ||
Risk-free interest rate - The risk-free interest rate is equal to the U.S. federal Treasury bond rate consistent with the expected term assumption.
Expected term - Expected term represents the period that Civitas’ option grants are expected to be outstanding. As Civitas had been operating as a private company, there is not sufficient historical data to calculate the expected term of the options. Therefore, management elected to utilize the “simplified method” to determine the expected term assumption. Under this approach, the weighted average expected life is presumed to be the average of the vesting term and the contractual term of the option.
Expected volatility - Management has estimated volatility for the units granted based on the daily historical volatility of the Company's common stock and the daily historical volatility for a representative peer group over the expected term. The representative peer group is a group of companies selected based on industry and market capitalization, due to lack of sufficient historical publicly traded prices of the Company's common stock.
Expected dividend yield - The expected dividend yield is zero as dividends are not expected to be paid in the foreseeable future.
F-34
The fair value of the stock options on the date of grant is recognized as expense in the Company’s consolidated financial statements on a straight-line basis over the requisite service periods (vesting term) of the awards. Forfeitures are recognized as they occur. The actual expense recognized over the vesting period will only be for those awards that vest.
The table below summarizes our stock option activity during fiscal year 2018:
Number of Shares | Weighted- Average Exercise Price per Share | Weighted- Average Remaining Life (Years) | Aggregate Intrinsic Value | |||||||||
Outstanding at September 30, 2017 | 877,781 | $ | 18.65 | |||||||||
Granted | 155,041 | 18.80 | ||||||||||
Forfeited | 41,514 | 18.68 | ||||||||||
Exercised | 17,608 | 17.00 | ||||||||||
Expired | 34,487 | 19.54 | ||||||||||
Outstanding at September 30, 2018 | 939,213 | $ | 18.67 | 7.4 | $ | 2 | ||||||
Vested or expected to vest as of September 30, 2018 | 939,213 | $ | 18.67 | 7.4 | $ | 2 | ||||||
Exercisable at September 30, 2018 | 560,002 | $ | 18.54 | 6.6 | $ | — | ||||||
The total intrinsic values of options exercised was less than $0.1 million for each of the years ended September 30, 2018, 2017 and 2016. As of September 30, 2018, there was $1.6 million of unrecognized compensation cost related to unvested stock options. This cost is expected to be recognized over a weighted-average period of 1.7 years.
Restricted Stock Unit Awards (RSUs)
For the years ended September 30, 2018, 2017 and 2016, Civitas granted 450,893, 566,668 and 283,865 RSUs, respectively, to employees and members of the Board of Directors. The fair value of all RSUs is based on the closing market value of the Company's stock on the date of grant. The weighted average per share grant date fair value of the RSUs granted during the years ended September 30, 2018, 2017 and 2016 was $17.87, $17.79, and $23.99, respectively. These awards will vest over three years (one-third each year) for employee grants and one year (100% on the first anniversary of the grant date) for grants to members of the Board of Directors.
The fair value of the restricted stock unit awards on the date of grant will be recognized as expense in the Company’s consolidated financial statements on a straight-line basis over the requisite service periods (vesting term) of the awards. Forfeitures are recognized as they occur. The actual expense recognized over the vesting period will only be for those awards that vest.
A summary of our issued restricted stock unit awards is as follows:
Number of Restricted Stock Units | Weighted Average Grant-Date Fair Value | |||||
Non-vested units at September 30, 2017 | 677,406 | $ | 19.20 | |||
Granted | 450,893 | 17.87 | ||||
Forfeited | 86,140 | 18.77 | ||||
Vested | 206,260 | 19.88 | ||||
Non-vested units at September 30, 2018 | 835,899 | $ | 18.35 | |||
The total fair values of RSUs that vested during the years ended September 30, 2018, 2017 and 2016, was $3.7 million, $4.5 million and $3.1 million, respectively. As of September 30, 2018, there was $9.4 million of unrecognized compensation expense related to unvested restricted stock unit awards. This cost is expected to be recognized over a weighted-average period of 1.8 years.
Performance Based Restricted Stock Units (PRSUs)
During the year ended September 30, 2017, the Company awarded 45,624 PRSUs under the 2014 Plan. The PRSUs vest based upon the achievement of established performance targets in the third year of the three year performance
F-35
period, or fiscal 2019. The number of PRSUs that may vest varies between 0%-200% based on the achievement of such goals. The PRSUs were valued at $19.85 per share based on the closing price of the Company's common stock on the date of grant.
During the year ended September 30, 2018, the Company awarded 50,834 PRSUs under the 2014 Plan. The PRSUs vest based upon the achievement of established performance targets in the third year of the three year performance period, or fiscal 2020. The number of PRSUs that may vest varies between 0%-200% based on the achievement of such goals. The PRSUs were valued at a weighted average of $18.76 per share based on the closing price of the Company's common stock on the date of grant.
To calculate compensation expense, the Company forecasts the likelihood of achieving the predefined performance targets and calculates the number of PRSUs expected to be earned. As of September 30, 2018, the Company expects to recognize $0.7 million of stock-based compensation expense related to outstanding PRSUs based on the expected attainment levels. This cost is expected to be recognized over a weighted-average period of 2.0 years.
A summary of PRSU activity for the year ended September 30, 2018 is as follows:
Number of Performance Based Restricted Stock Units | Weighted Average Grant-Date Fair Value | ||||||
Non-vested units at September 30, 2017 | 84,505 | $ | 19.85 | ||||
Granted | 50,834 | 18.76 | |||||
Forfeited | — | — | |||||
Vested | — | — | |||||
Non-vested units at September 30, 2018 | 135,339 | $ | 19.44 | ||||
Units expected to vest as of September 30, 2018 | 50,834 | $ | 18.76 | ||||
For NSOs, RSUs and PRSUs under the 2014 Plan, the Company recorded $7.6 million, $8.4 million and $17.1 million of stock-based compensation expense during fiscal years 2018, 2017 and 2016, respectively. Stock-based compensation expense is included in general and administrative expense in the consolidated statements of income.
Unit Plan
Prior to October 1, 2015, NMH Investment maintained the Amended and Restated 2006 Unit Plan (the “Unit Plan”). Under the Unit Plan, NMH Investment issued units of limited liability company interests pursuant to such plan, consisting of Class B Common Units, Class C Common Units, Class D Common Units, Class E Common Units, Class F Common Units, Class G Common Units and Class H Common Units. These units derived their value from the value of the Company.
On October 1, 2015, in connection with a secondary offering, NMH Investment distributed all of the 25,250,000 shares of our common stock it held to its existing members in accordance with their respective membership interests and pursuant to the terms of the NMH Investment's Limited Liability Company Agreement and the management unitholders agreements (the “Distribution”). The Distribution triggered the vesting condition for the Class H Common Units and the acceleration of unvested Class F Common Units. As a result, the Company recorded compensation expense of $10.5 million related to these awards during the quarter ended December 31, 2015. This expense is not deductible for tax purposes. The expense is included in general and administrative expense in the consolidated statements of income. As a result of the Distribution, the Unit Plan has concluded and there will be no future issuances under this plan.
22. Valuation and Qualifying Accounts
The following table summarizes information about the allowances for doubtful accounts for the years ended September 30, 2018, 2017 and 2016 (in thousands):
F-36
Balance at Beginning of Year | Provision | Write-Offs | Balance at end of Year | ||||||||||||
Fiscal year ended September 30, 2018 | $ | 15,997 | $ | 23,186 | $ | (18,954 | ) | $ | 20,229 | ||||||
Fiscal year ended September 30, 2017 | $ | 11,863 | $ | 20,674 | $ | (16,540 | ) | $ | 15,997 | ||||||
Fiscal year ended September 30, 2016 | $ | 11,207 | $ | 14,784 | $ | (14,128 | ) | $ | 11,863 | ||||||
The Company also had $3.7 million and $3.8 million of accounts receivable collateralized by liens, net of allowances for those liens of $1.3 million and $1.0 million, recorded as part of other assets within the accompanying consolidated balance sheets as of September 30, 2018 and 2017, respectively.
23. Quarterly Financial Data (unaudited)
The following table presents consolidated statement of income data for each of the eight quarters in the period which began October 1, 2016 and ended September 30, 2018. This information is derived from the Company’s unaudited financial statements, which in the opinion of management contain all adjustments necessary for a fair presentation of such financial data. Operating results for these periods are not necessarily indicative of the operating results for a full year. Historical results are not necessarily indicative of the results to be expected in future periods.
For The Quarters Ended (in thousands, except per share amounts) | |||||||||||||||||||||||||||||||
September 30, 2018 | June 30, 2018 | March 31, 2018 | December 31, 2017 | September 30, 2017 | June 30, 2017 | March 31, 2017 | December 31, 2016 | ||||||||||||||||||||||||
Net revenue | $ | 409,485 | $ | 404,498 | $ | 392,801 | $ | 395,418 | $ | 380,372 | $ | 372,345 | $ | 362,399 | $ | 359,394 | |||||||||||||||
Gross margin | 77,680 | 88,564 | 76,189 | 79,161 | 81,836 | 79,847 | 76,881 | 75,418 | |||||||||||||||||||||||
Net income (loss) (1) | $ | (1,605 | ) | $ | 9,585 | $ | (2,488 | ) | $ | 9,394 | $ | (10,688 | ) | $ | 7,361 | $ | 5,479 | $ | 4,179 | ||||||||||||
Income (loss) per common share, basic and diluted | $ | (0.04 | ) | $ | 0.26 | $ | (0.07 | ) | $ | 0.25 | $ | (0.29 | ) | $ | 0.20 | $ | 0.15 | $ | 0.11 | ||||||||||||
Weighted average number of common shares outstanding, basic | 36,141 | 36,503 | 37,434 | 37,472 | 37,375 | 37,323 | 37,282 | 37,231 | |||||||||||||||||||||||
Weighted average number of common shares outstanding, diluted | 36,141 | 36,593 | 37,434 | 37,676 | 37,375 | 37,495 | 37,417 | 37,329 | |||||||||||||||||||||||
(1) During the three month period ended September 30, 2017, the Company recorded a goodwill impairment charge of $28.0 million. See Note 7 to the consolidated financial statements for more information. During the three month period ended December 31, 2017, the Company recorded a tax benefit of $6.5 million as a result of the enactment of the Tax Act on December 22, 2017. See Note 18 to the consolidated financial statements for more information.
F-37
Financial Statement Schedule
Schedule I—Condensed Parent Company Financial Information
Civitas Solutions, Inc. Parent-Only Condensed Balance Sheets
(in thousands) | September 30, | ||||||
2018 | 2017 | ||||||
Assets | |||||||
Investment in subsidiaries | $ | 166,734 | $ | 163,477 | |||
Total assets | $ | 166,734 | $ | 163,477 | |||
Liabilities & Stockholders' Equity | |||||||
Other liabilities | $ | — | $ | 560 | |||
Total liabilities | $ | — | $ | 560 | |||
Stockholder's equity | |||||||
Common stock, $0.01 par value; 350,000,000 shares authorized; and 36,116,252 and 37,441,257 shares issued and outstanding at September 30, 2018 and 2017, respectively | 360 | 374 | |||||
Additional paid-in-capital | 286,897 | 301,819 | |||||
Accumulated other comprehensive income (loss) | 3,936 | (91 | ) | ||||
Accumulated deficit | (124,459 | ) | (139,185 | ) | |||
Total stockholders' equity | 166,734 | 162,917 | |||||
Total liabilities and stockholders' equity | $ | 166,734 | $ | 163,477 | |||
Civitas Solutions, Inc. Parent-Only Condensed Statements of Income and Comprehensive Income
(in thousands) | For the Year Ended September 30, | ||||||||||
2018 | 2017 | 2016 | |||||||||
Equity in net income of subsidiary | $ | 14,886 | $ | 6,331 | $ | 9,187 | |||||
Income from operations | 14,886 | 6,331 | 9,187 | ||||||||
Income before income taxes | 14,886 | 6,331 | 9,187 | ||||||||
Benefit for income taxes | — | — | — | ||||||||
Net income | 14,886 | 6,331 | 9,187 | ||||||||
Other comprehensive income (loss) | 4,027 | 3,470 | (1,857 | ) | |||||||
Comprehensive income | $ | 18,913 | $ | 9,801 | $ | 7,330 | |||||
F-38
Civitas Solutions, Inc. Parent-Only Condensed Statements of Cash Flows
(in thousands) | For the Year Ended September 30, | ||||||||||
2018 | 2017 | 2016 | |||||||||
Cash flows (used in) provided by operating activities: | |||||||||||
Net income | $ | 14,886 | $ | 6,331 | $ | 9,187 | |||||
Adjustments to reconcile net income to net cash (used in) provided by operating activities: | |||||||||||
Equity in net income loss of subsidiary | (14,886 | ) | (6,331 | ) | (9,187 | ) | |||||
Deferred income taxes | — | — | 11,004 | ||||||||
Other assets | — | 4,215 | 1,021 | ||||||||
Other accrued liabilities | (560 | ) | (633 | ) | — | ||||||
Net cash (used in) provided by operating activities | (560 | ) | 3,582 | 12,025 | |||||||
Cash flows provided by (used in) investing activities: | |||||||||||
Investment in NMHI | — | (3,582 | ) | (12,025 | ) | ||||||
Dividend from NMHI | 560 | — | — | ||||||||
Net cash provided by (used in) investing activities | 560 | (3,582 | ) | (12,025 | ) | ||||||
Decrease in cash and cash equivalents | — | — | — | ||||||||
Cash and cash equivalents, beginning of period | — | — | — | ||||||||
Cash and cash equivalents, end of period | $ | — | $ | — | $ | — | |||||
Notes to Condensed Civitas Solutions, Inc. Parent-Only Financial Statements
Note 1 - Summary of Significant Accounting Policies and Nature of Operations
Civitas Solutions, Inc., formerly known as NMH Holdings, Inc. (“Civitas”), was incorporated in Delaware on June 15, 2007. Civitas has no other operations beyond its ownership of National Mentor Holdings, Inc. (“NMHI”).
The condensed Civitas financial information includes the activity of Civitas and its investment in NMHI using the equity method. The consolidated activity of Civitas and its subsidiaries are not included and are meant to be read in conjunction with the Civitas consolidated financial statements included elsewhere in this Annual Report on Form 10-K.
.
Note 2 - Dividend from Subsidiaries
Civitas' ability to pay dividends on its common stock is limited by restrictions on the ability of its subsidiaries to pay dividends or make distributions under the terms of NMHI’s agreements governing its indebtedness. Any future determination to pay dividends will be at the discretion of our Board of Directors, subject to compliance with covenants in NMHI’s current and any future agreements governing indebtedness, and will depend upon our results of operations, financial condition, capital requirements and other factors that our Board of Directors deems relevant. Civitas received no dividends for the fiscal years ended 2016, 2017, or 2018.
F-39