Attached files
| file | filename |
|---|---|
| EX-99.4 - EXHIBIT 99.4 - PHOTRONICS INC | ex99_4.htm |
| EX-99.3 - EXHIBIT 99.3 - PHOTRONICS INC | ex99_3.htm |
| EX-99.2 - EXHIBIT 99.2 - PHOTRONICS INC | ex99_2.htm |
| EX-99.1 - EXHIBIT 99.1 - PHOTRONICS INC | ex99_1.htm |
| 8-K - 8-K - PHOTRONICS INC | form8k.htm |
Exhibit 99.5
Photronics, Inc. Q4 2018 Financial Results Conference CallDecember 12, 2018
Safe Harbor Statement 2 This presentation and some of our comments may contain projections or other
forward-looking statements regarding future events, our future financial performance, and/or the future performance of the industry. These statements are predictions, and contain risks and uncertainties. Actual events or results may differ
materially from those presented. These statements include words like “anticipate”, “believe”, “estimate”, “expect”, “forecast”, “may”, “should”, “plan”, “project” or the negative thereto. We cannot guarantee the accuracy of any forecasts or
estimates, and we are not obligated to update any forward-looking statements if our expectations change. If you would like more information on the risks involved in forward-looking statements, please see the documents we file from time to
time with the Securities and Exchange Commission, specifically our most recent Form 10K and Form 10Q.Non-GAAP Financial MeasuresThis presentation and some of our comments may reference non-GAAP financial measures. These non-GAAP financial
measures exclude certain income or expense items, and are consistent with another way management internally analyzes our results of operations. Non-GAAP information should be considered to be a supplement to, and not a substitute for,
financial statements prepared in accordance with GAAP. Please see the “Reconciliation of GAAP to Non-GAAP Financial Information” in this presentation.

Record quarterly revenue; +20% Y/Y, +6% Q/QFPD achieves record revenue on strong high-end demand,
driven by AMOLEDIC improved on high-end memory and uptick in Asia mainstream; high-end logic softer Q/QChina revenue up 146% Y/Y & 6% Q/QNote: Q418 had 3 extra days than comparable quartersMargin compression due to IC GM dip, China
startup, greater qualification activityNet income attributable to Photronics, Inc. shareholders of $12.5M ($0.18/share)Cash balance of $329M on strong OCF and defer of capex payments into Q119Repurchased 1.8M shares for $16.3M in Q418 (2.6M
shares / $23.1M YTD)China investments on trackConstruction of critical systems completeTool move-in well underway; expect to be 90% complete (per plan) by end of Q119On schedule to begin production first half of 2019 Q4 2018
Summary 3 Successfully repositioned the business; China investments driving long-term, profitable growth
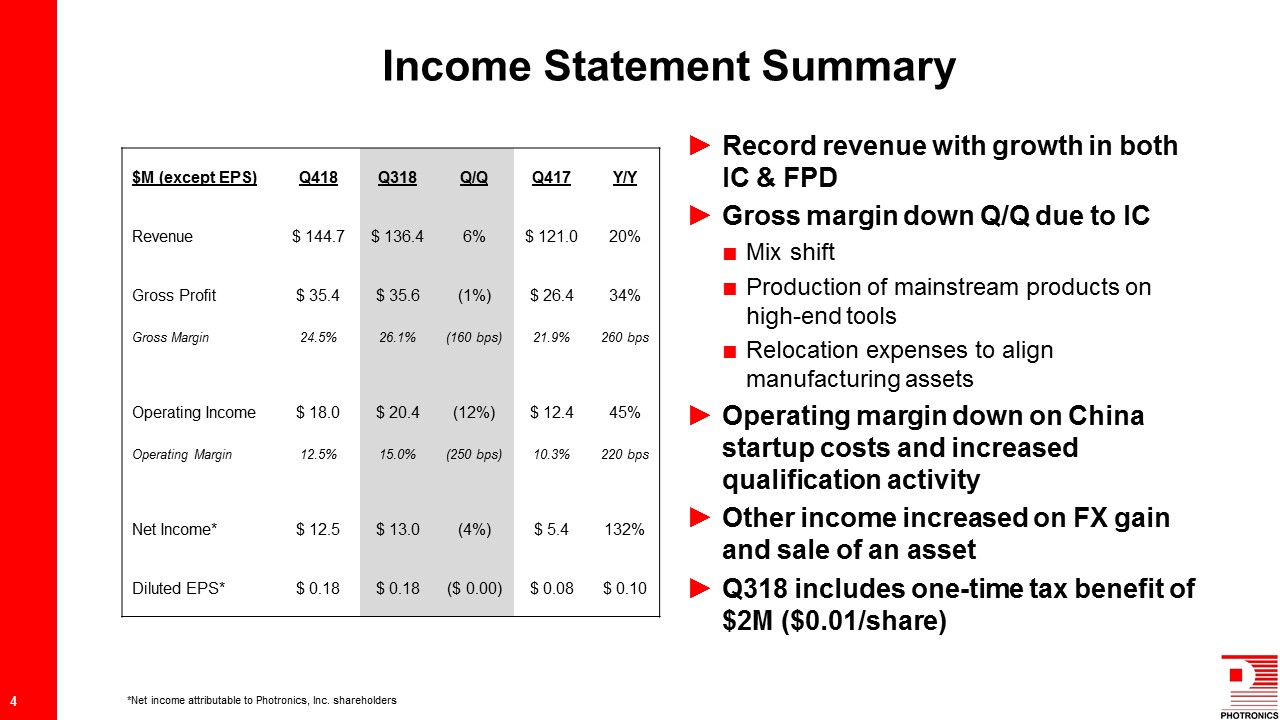
$M (except EPS) Q418 Q318 Q/Q Q417 Y/Y Revenue $ 144.7 $ 136.4 6% $ 121.0 20% Gross
Profit $ 35.4 $ 35.6 (1%) $ 26.4 34% Gross Margin 24.5% 26.1% (160 bps) 21.9% 260 bps Operating Income $ 18.0 $ 20.4 (12%) $ 12.4 45% Operating Margin 12.5% 15.0% (250 bps) 10.3% 220 bps Net Income* $ 12.5 $
13.0 (4%) $ 5.4 132% Diluted EPS* $ 0.18 $ 0.18 ($ 0.00) $ 0.08 $ 0.10 Record revenue with growth in both IC & FPDGross margin down Q/Q due to ICMix shiftProduction of mainstream products on high-end toolsRelocation expenses to
align manufacturing assetsOperating margin down on China startup costs and increased qualification activityOther income increased on FX gain and sale of an assetQ318 includes one-time tax benefit of $2M ($0.01/share) Income Statement
Summary 4 *Net income attributable to Photronics, Inc. shareholders
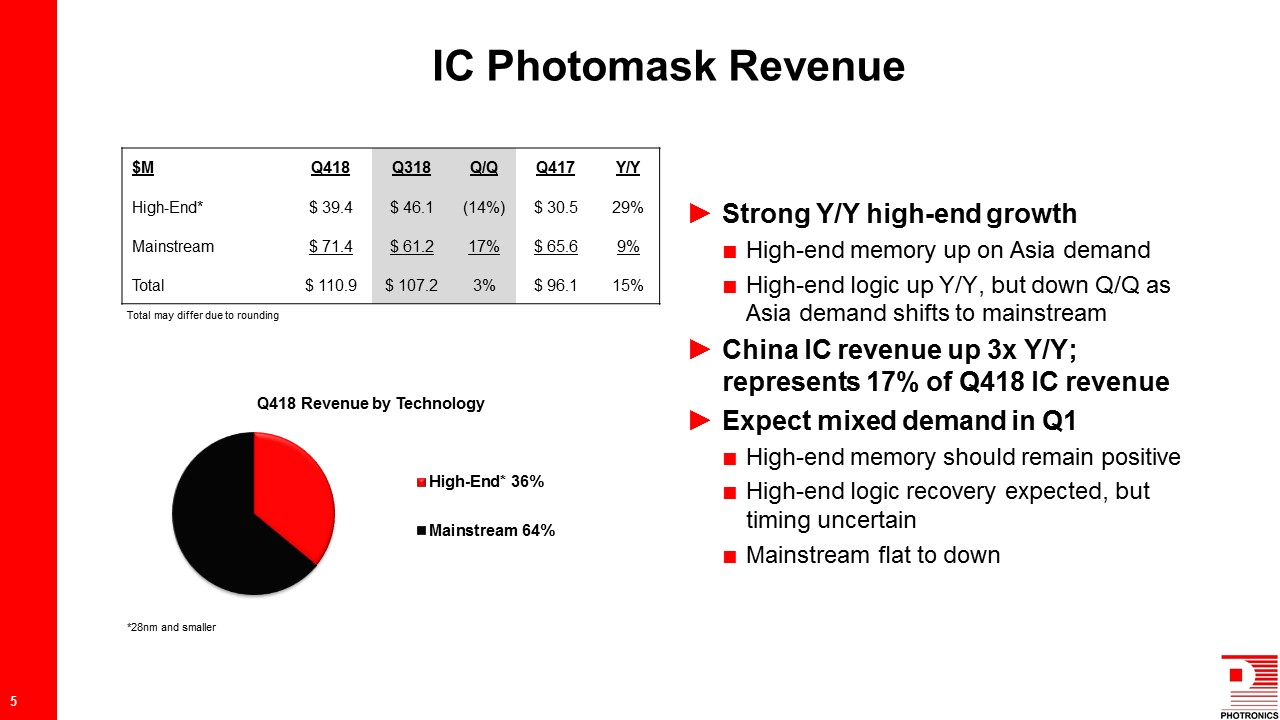
Strong Y/Y high-end growthHigh-end memory up on Asia demandHigh-end logic up Y/Y, but down Q/Q as Asia
demand shifts to mainstreamChina IC revenue up 3x Y/Y; represents 17% of Q418 IC revenueExpect mixed demand in Q1High-end memory should remain positiveHigh-end logic recovery expected, but timing uncertainMainstream flat to
down $M Q418 Q318 Q/Q Q417 Y/Y High-End* $ 39.4 $ 46.1 (14%) $ 30.5 29% Mainstream $ 71.4 $ 61.2 17% $ 65.6 9% Total $ 110.9 $ 107.2 3% $ 96.1 15% IC Photomask Revenue 5 *28nm and smaller Total may differ due to
rounding
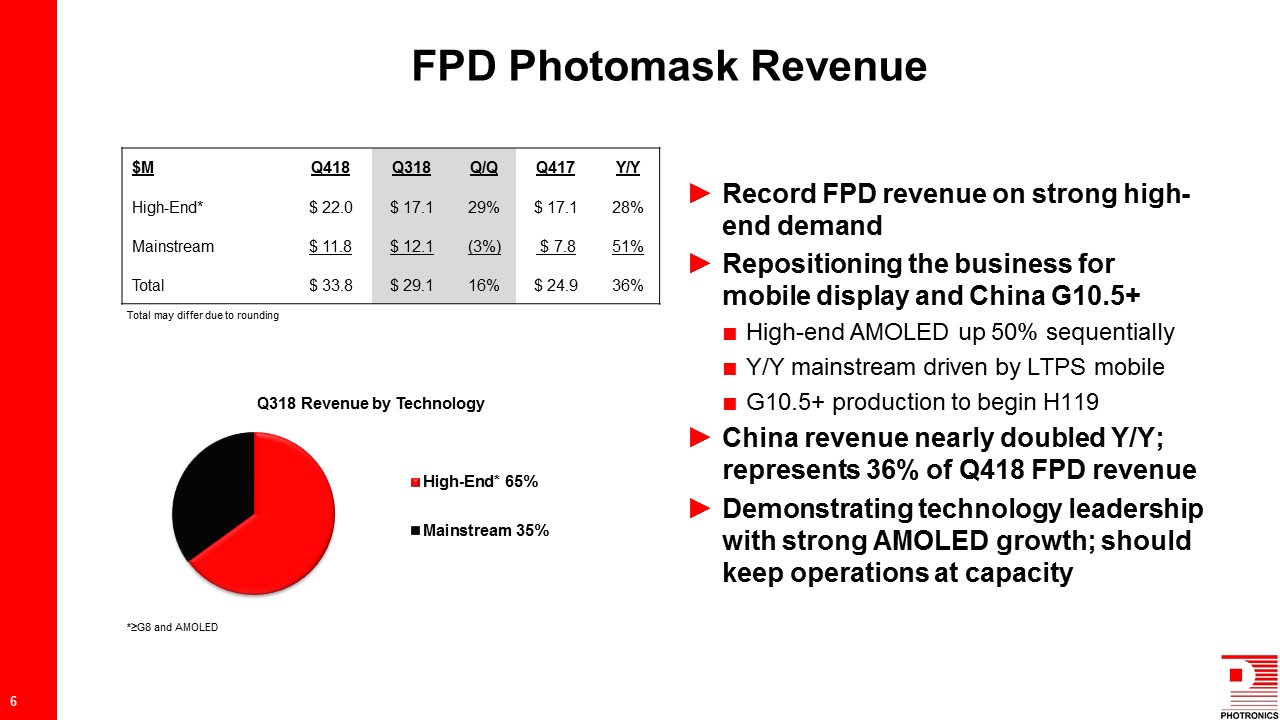
Record FPD revenue on strong high-end demandRepositioning the business for mobile display and China
G10.5+High-end AMOLED up 50% sequentiallyY/Y mainstream driven by LTPS mobileG10.5+ production to begin H119China revenue nearly doubled Y/Y; represents 36% of Q418 FPD revenueDemonstrating technology leadership with strong AMOLED growth;
should keep operations at capacity $M Q418 Q318 Q/Q Q417 Y/Y High-End* $ 22.0 $ 17.1 29% $ 17.1 28% Mainstream $ 11.8 $ 12.1 (3%) $ 7.8 51% Total $ 33.8 $ 29.1 16% $ 24.9 36% FPD Photomask Revenue 6 *≥G8 and
AMOLED Total may differ due to rounding
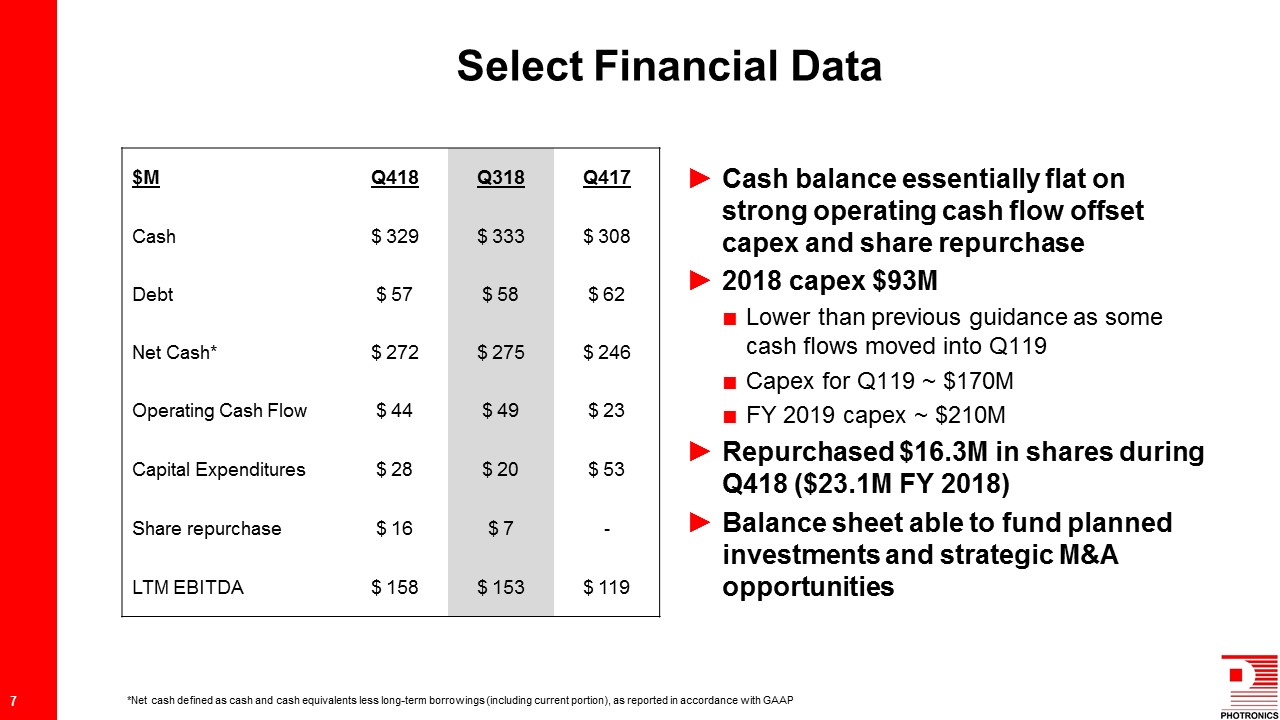
$M Q418 Q318 Q417 Cash $ 329 $ 333 $ 308 Debt $ 57 $ 58 $ 62 Net Cash* $ 272 $ 275 $
246 Operating Cash Flow $ 44 $ 49 $ 23 Capital Expenditures $ 28 $ 20 $ 53 Share repurchase $ 16 $ 7 - LTM EBITDA $ 158 $ 153 $ 119 Cash balance essentially flat on strong operating cash flow offset capex and share
repurchase2018 capex $93MLower than previous guidance as some cash flows moved into Q119Capex for Q119 ~ $170MFY 2019 capex ~ $210MRepurchased $16.3M in shares during Q418 ($23.1M FY 2018)Balance sheet able to fund planned investments and
strategic M&A opportunities Select Financial Data 7 *Net cash defined as cash and cash equivalents less long-term borrowings (including current portion), as reported in accordance with GAAP
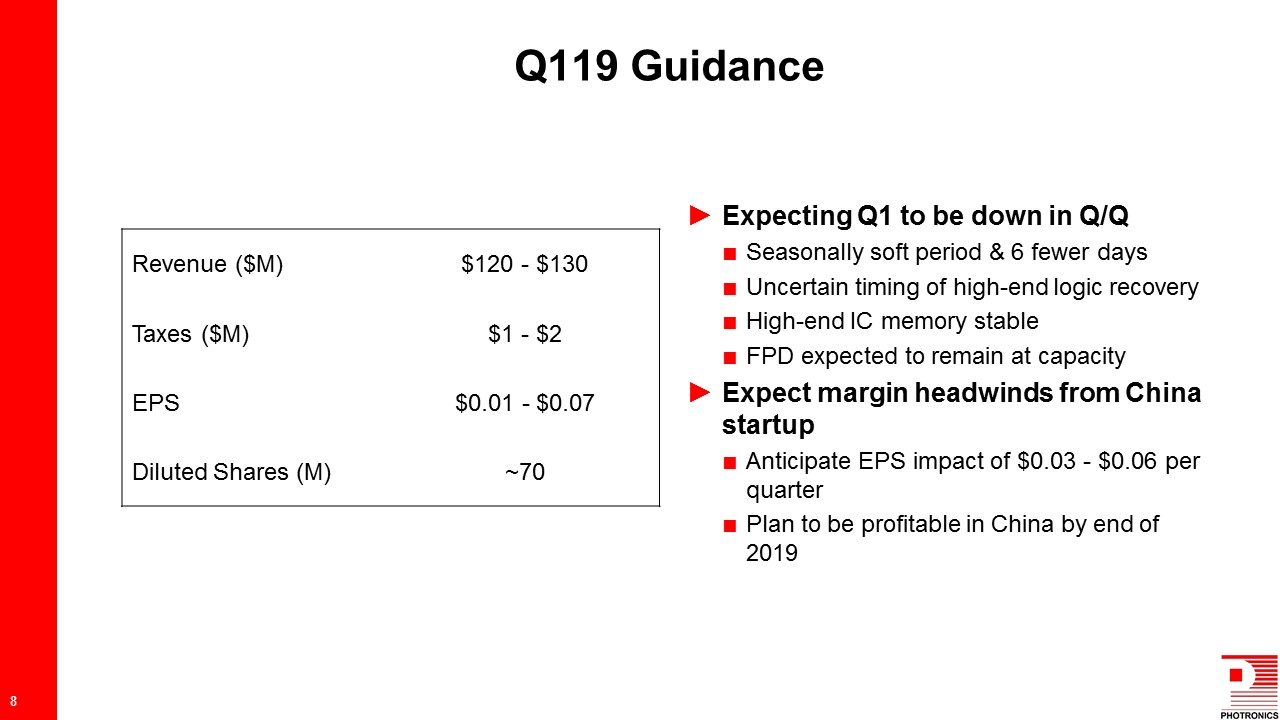
Revenue ($M) $120 - $130 Taxes ($M) $1 - $2 EPS $0.01 - $0.07 Diluted Shares (M) ~70 Expecting
Q1 to be down in Q/QSeasonally soft period & 6 fewer daysUncertain timing of high-end logic recoveryHigh-end IC memory stableFPD expected to remain at capacityExpect margin headwinds from China startupAnticipate EPS impact of $0.03 -
$0.06 per quarterPlan to be profitable in China by end of 2019 Q119 Guidance 8
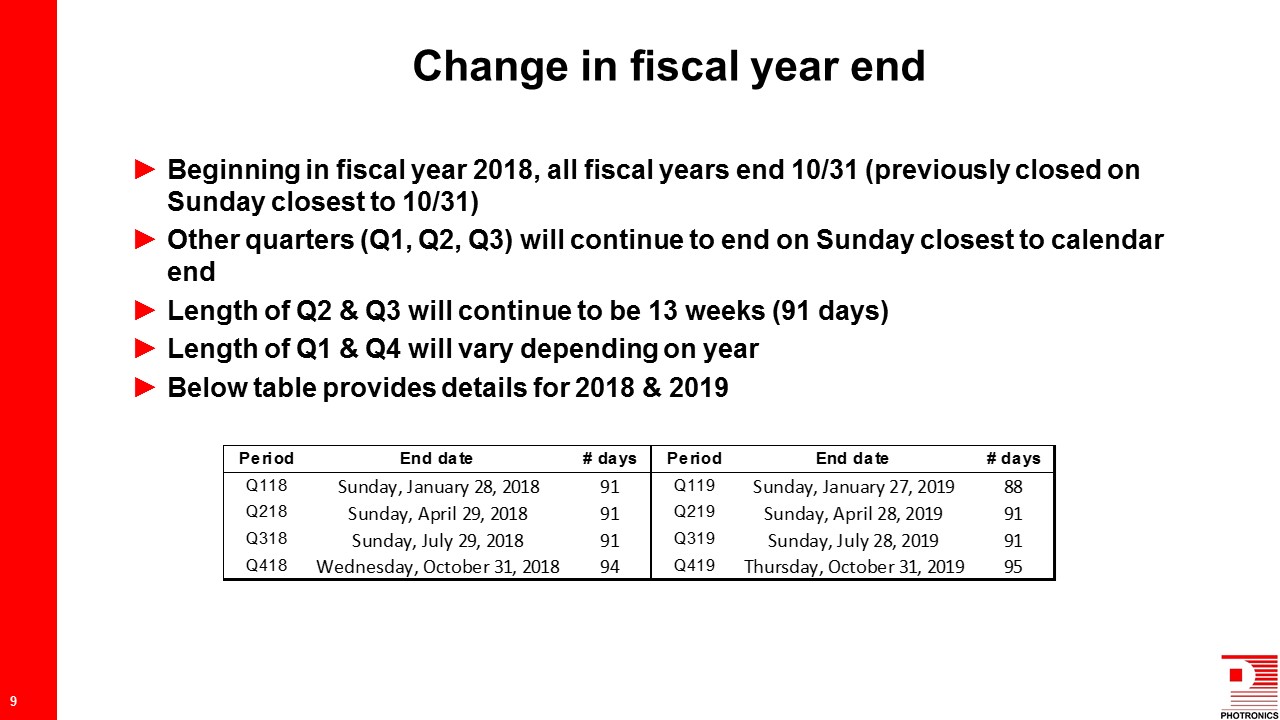
Beginning in fiscal year 2018, all fiscal years end 10/31 (previously closed on Sunday closest to
10/31)Other quarters (Q1, Q2, Q3) will continue to end on Sunday closest to calendar endLength of Q2 & Q3 will continue to be 13 weeks (91 days)Length of Q1 & Q4 will vary depending on yearBelow table provides details for 2018 &
2019 Change in fiscal year end 9

Thank you for your interest! For Additional Information:R. Troy Dewar, CFADirector, Investor
Relations203.740.5610tdewar@photronics.com
Appendix
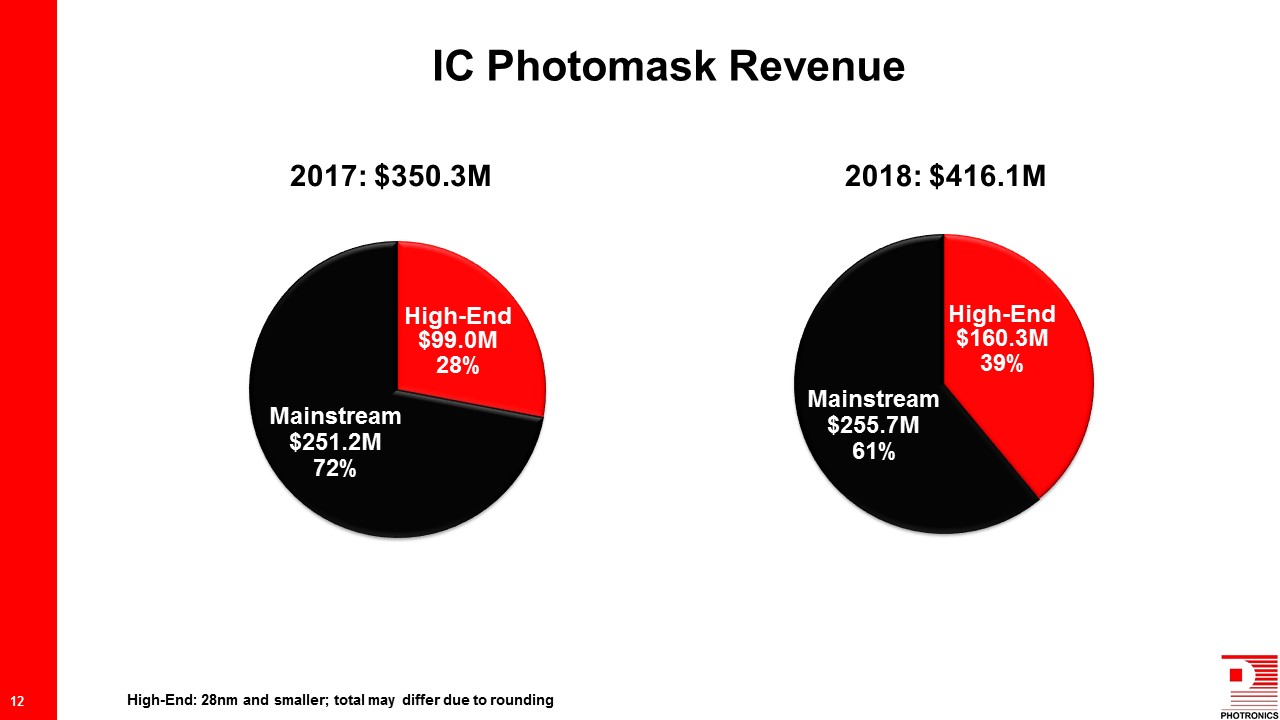
IC Photomask Revenue 12 Mainstream$255.7M61% High-End$160.3M39% High-End: 28nm and smaller; total
may differ due to rounding
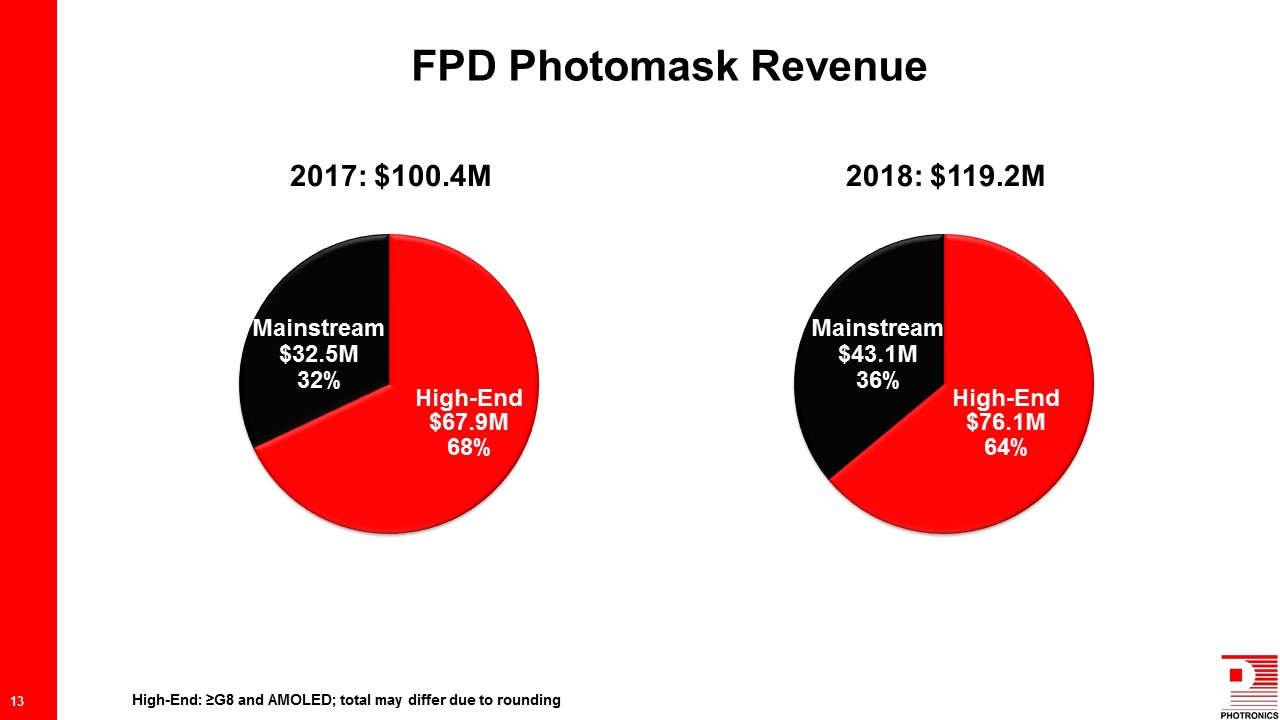
FPD Photomask Revenue 13 Mainstream$43.1M36% High-End$76.1M64% High-End: ≥G8 and AMOLED; total may
differ due to rounding Mainstream$32.5M32% High-End$67.9M68%

Non-GAAP Reconciliation

15