Attached files
| file | filename |
|---|---|
| 8-K - FORM 8-K - DELTA AIR LINES, INC. | delta_8k.htm |
Exhibit 99.1

INSERT NEW IMAGE Delta Finance Insights Jill Greer, Vice President – Investor Relations Julie Stewart , Managing Director – Investor Relations

Safe Harbor Statements in this presentation that are not historical facts, including statements regarding our estimates, expectations, be lie fs, intentions, projections or strategies for the future, may be "forward - looking statements" as defined in the Private Securities Litigation Reform Act of 199 5. All forward - looking statements involve a number of risks and uncertainties that could cause actual results to differ materially from the estimate s, expectations, beliefs, intentions, projections and strategies reflected in or suggested by the forward - looking statements. These risks and uncertainti es include, but are not limited to, the cost of aircraft fuel; the impact of fuel hedging activity including rebalancing our hedge portfolio, recordi ng mark - to - market adjustments or posting collateral in connection with our fuel hedge contracts; the availability of aircraft fuel; the performance of our sig nif icant investments in airlines in other parts of the world; the possible effects of accidents involving our aircraft; breaches or security lapses in our inform ati on technology systems; disruptions in our information technology infrastructure; our dependence on technology in our operations; the restrictions th at financial covenants in our financing agreements could have on our financial and business operations; labor issues; the effects of weather, natural disas ter s and seasonality on our business; the effects of an extended disruption in services provided by third party regional carriers; failure or inability o f i nsurance to cover a significant liability at Monroe’s Trainer refinery; the impact of environmental regulation on the Trainer refinery, including costs relat ed to renewable fuel standard regulations; our ability to retain senior management and key employees; damage to our reputation and brand if we are exposed to significant adverse publicity through social media; the effects of terrorist attacks or geopolitical conflict; competitive conditions in the airl ine industry; interruptions or disruptions in service at major airports at which we operate; the effects of extensive government regulation on our business; th e sensitivity of the airline industry to prolonged periods of stagnant or weak economic conditions; uncertainty in economic conditions and regulatory envi ron ment in the United Kingdom related to the exit of the United Kingdom from the European Union; and the effects of the rapid spread of contagious ill nesses. Additional information concerning risks and uncertainties that could cause differences between actual results and forward - lookin g statements is contained in our Securities and Exchange Commission filings, including our Annual Report on Form 10 - K for the fiscal year ended December 31, 2017 and our Quarterly Report on Form 10 - Q for the period ended March 31, 2018. Caution should be taken not to place undue reliance on our forward - looking statements, which represent our views only as of December 12, 2018, and which we have no current intention to update. 1

Impact of new accounting standard Addressing New Topics and Commonly Asked Modeling Questions 2 An increasingly diverse top line Aligns employee incentives with owners’ interests Core to Delta’s international strategy Complementary businesses that benefit earnings and cash flows Differences between cash and book tax rates Delta - led projects versus airport - financed projects Profit Sharing Joint Ventures & Equity Investments Ancillary Businesses & DGS Transaction Taxes Airport Investments Lease Accounting Revenue Disclosures Vertically integrated fuel supply chain Refinery

Enhanced Disclosures Providing Better Transparency 3 • Delta Finance Insights is intended to provide additional commentary on newer and unique financial considerations • We are committed to providing transparency for investors through our disclosures • In the March quarter, we provided two new disclosures: ‒ New line item for ancillary expenses, formerly a footnote ‒ Improved breakout of revenue, including loyalty revenue, in conjunction with implementation of new revenue recognition standard • In the September quarter, we presented disaggregation of ticket revenue in two categories: ‒ Main cabin ‒ Business cabin and premium products Committed to improving level of detail Delta 3Q18 Press Release: Delta 1Q18 Press Release:

4 Lease Accounting

Early Adoption of Lease Accounting Standard in the December Quarter 5 • Recognition of ~$6 billion incremental lease liabilities and right - of - use assets will be recorded on balance sheet • Adjustment to equity as of January 1, 2018 of ~$350 million • 2018E Adjusted Debt / EBITDAR 2 of 1.9x includes ~0.4x impact from inclusion of fixed lease liability Balance Sheet • Increases 2018 pre - tax income by ~$50 million after adjusting for profit sharing with no material impact to non - fuel CASM or margins • 5 - cent impact on full - year 2018 EPS, with ~ 1 - cent in 4Q18 • No year - over - year impact in 2019 after 2018 is recast Income Statement • Effects of new standard will be reflected as of January 1, 2018 by recasting the March, June and September quarters of 2018 • New standard requires leases to be recorded on the balance sheet as lease liabilities with corresponding right - of - use assets Impact primarily on balance sheet with modest P&L adjustment $ 3B $ 7B $ 1B $ 2B $ 1B 7x Rents Facilities Regional Aircraft Other Lease Obligation Lease Obligation vs. 7x Mainline Aircraft Rent 1 1 ~$7B o bligation includes ~$0.7B JFK construction obligation currently on the balance sheet as a liability to be included in operati ng lease liabilities in the future 2 Adjusted Debt / EBITDAR is calculated as on balance sheet debt plus estimated operating lease liabilities divided by TTM EBIT DA R. Adjusted for special items; non - GAAP financial measures reconciled in Appendix

6 Revenue Disclosures
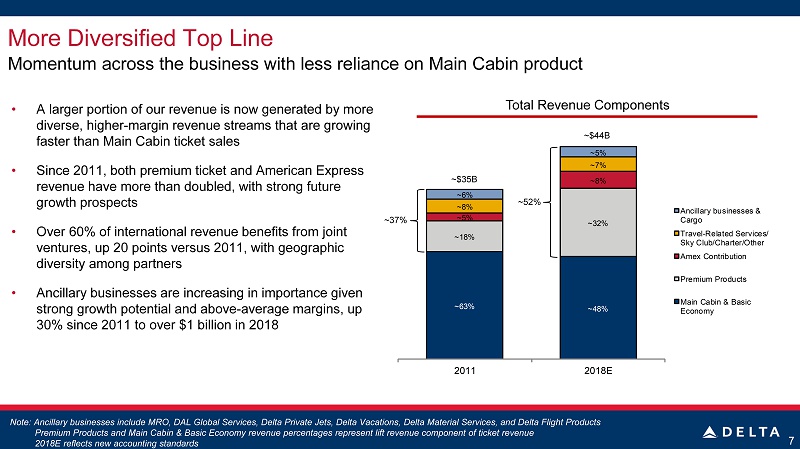
• A larger portion of our revenue is now generated by more diverse, higher - margin revenue streams that are growing faster than Main C abin ticket sales • Since 2011, both premium ticket and American Express revenue have more than doubled, with strong future growth prospects • Over 60% of international revenue benefits from joint ventures, up 20 points versus 2011, with geographic diversity among partners • Ancillary businesses are increasing in importance given strong growth potential and above - average margins, up 30% since 2011 to over $1 billion in 2018 More Diversified Top Line 7 Momentum across the business with less reliance on M ain Cabin product Note: Ancillary businesses include MRO, DAL Global Services, Delta Private Jets, Delta Vacations, Delta Material Services, and Delta Flight Products Premium Products and Main Cabin & Basic Economy revenue percentages represent lift revenue component of ticket revenue 2018E reflects new accounting standards ~63% ~48% ~18% ~32% ~5% ~8% ~8% ~7% ~6% ~5% 2011 2018E Ancillary businesses & Cargo Travel-Related Services/ Sky Club/Charter/Other Amex Contribution Premium Products Main Cabin & Basic Economy Total Revenue Components ~37% ~52% ~$35B ~$44B

Revenue Components of Disclosed Categories 8 Total Revenue Passenger Revenue Other Revenue Travel - Related Services Loyalty Travel Awards Ticket Premium Ticket Main Cabin Ancillary and Refinery Loyalty Misc. • Main • Basic Economy • Delta One • Delta Premium Select • Comfort+ • Flown portion of SkyMiles • Fees (bags, change, etc.) • MRO • Delta Vacations • Third - party refinery sales • Delta Private Jets (DPJ) • DAL Global Services (DGS) • Marketing component of SkyMiles • Lounge Fees • Codeshare N ote: Premium revenue based on cabin flown Cargo
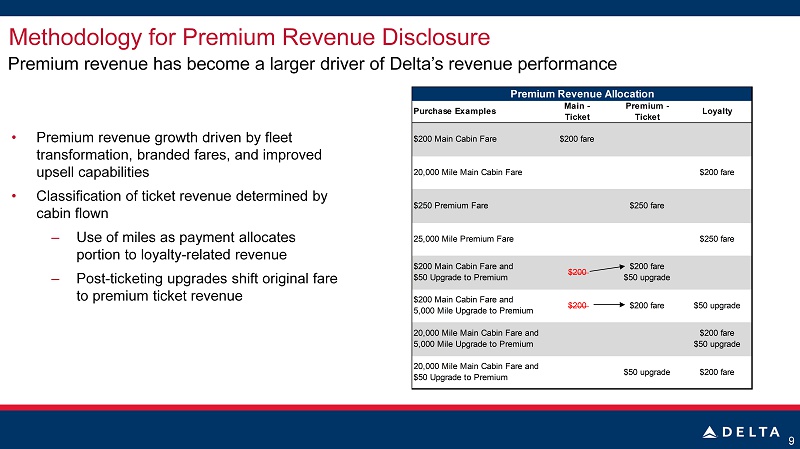
Methodology for Premium Revenue Disclosure 9 • Premium revenue growth driven by fleet transformation, branded fares, and improved upsell capabilities • Classification of ticket revenue determined by cabin flown ‒ Use of miles as payment allocates portion to loyalty - related revenue ‒ Post - ticketing upgrades shift original fare to premium ticket revenue Premium revenue has become a larger driver of Delta’s revenue performance Premium Revenue Allocation Purchase Examples Main - Ticket Premium - Ticket Loyalty $200 Main Cabin Fare $200 fare 20,000 Mile Main Cabin Fare $200 fare $250 Premium Fare $250 fare 25,000 Mile Premium Fare $250 fare $200 Main Cabin Fare and $50 Upgrade to Premium $200 $200 fare $50 upgrade $200 Main Cabin Fare and 5,000 Mile Upgrade to Premium $200 $200 fare $50 upgrade 20,000 Mile Main Cabin Fare and 5,000 Mile Upgrade to Premium $200 fare $50 upgrade 20,000 Mile Main Cabin Fare and $50 Upgrade to Premium $50 upgrade $200 fare

Updated 2017 Main Cabin and Premium Revenue (in millions) 2018 2017 $ Change% Change 2018 2017 $ Change% Change Ticket- Main cabin 5,873$ 5,546$ 327$ 6% 16,139$ 15,495$ 644$ 4% Ticket- Business cabin and premium products 3,680 3,266 414 13% 10,376 9,028 1,348 15% Loyalty travel awards 678 622 56 9% 1,976 1,826 150 8% Travel-related services 565 545 20 4% 1,617 1,576 41 3% Total passenger revenue 10,796$ 9,979$ 817$ 8% 30,107$ 27,924$ 2,183$ 8% Three Months Ended September 30, Nine Months Ended September 30, Methodology for Premium Revenue Disclosure (continued) 10 • Since 2016, premium ticket revenues have grown 24% as of September 30, 2018 • In 2018, Comfort+ revenue is automatically included in premium revenue given enhanced revenue reporting capabilities • Prior to this, base fares associated with upgrades to Comfort+ were included in Main C abin • For comparative purposes, revenue from base fares associated with upgrades to Comfort+ in 2017 is being reclassified to premium revenue ‒ 3Q18 year - over - year premium revenue growth rate is 13% as reclassified, compared to 19% previously reported ‒ Year - to - date (through September 30, 2018) growth rate is 15% as reclassified, compared to 20% previously reported Reclassifying portion of 2017 Comfort+ revenue

11 Joint Ventures & Equity Investments

Delta’s Joint Ventures and Equity Investments are Unique 12 Note: WestJet JV and proposed combined trans - Atlantic JV subject to completion and government approvals ~$3B Joint Venture ~$1B Joint Venture ~$11B Joint Venture 9% Equity stake ~$3B Joint Venture 49% Equity stake Pending Joint Venture Equity Joint Venture ~$1B Joint Venture 49% Equity stake 9% Equity stake 3% Equity stake Proposed Combined JV of ~$13B Comprehensive portfolio of global partnerships expands Delta’s global reach

JVs and Equity Investments Create Strong Commercial Cooperation Partner agreements ensure alignment of incentives Joint Ventures Equity Investments • Allow close cooperation and provide more choice for customers • Sharing of economic benefits drives customer - focused partner alignment • Antitrust immunity allows partners to legally coordinate, forming a fully cooperative partnership • Reinforce commitment to relationship with board - level participation • In addition to any joint v enture contribution in operating results, Delta’s portion of partner results is recognized in the non - operating line when ownership stake is greater than 20% 13

Driving Value Through Joint Ventures and Equity Investments Benefits from improved revenues, cost efficiencies and consolidation of partner earnings 14 Revenue for Delta - operated flights in JV flow through passenger revenue JV settlements flow through other revenue Delta realizes cost efficiencies through scale & scope – expenses for DL - operated flights in JV flow through operating expenses 49% of net i ncome for Aeromexico and Virgin Atlantic flow through non - op, giving Delta effectively 75% of the JV economics Delta 3Q18 Press Release Equity changes for <20% stakes are mark - to - market and flow through non - op, and are excluded from adjusted earnings
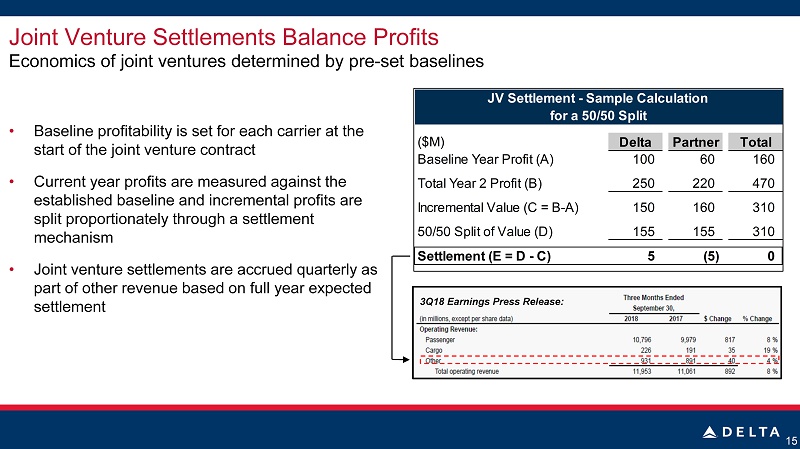
15 Economics of joint ventures determined by pre - set baselines Joint Venture Settlements Balance Profits ($M) Delta Partner Total Baseline Year Profit (A) 100 60 160 Total Year 2 Profit (B) 250 220 470 Incremental Value (C = B-A) 150 160 310 50/50 Split of Value (D) 155 155 310 Settlement (E = D - C) 5 (5) 0 JV Settlement - Sample Calculation for a 50/50 Split • Baseline profitability is set for each carrier at the start of the j oint venture contract • Current year profits are measured against the established baseline and incremental profits are split proportionately through a settlement mechanism • Joint venture settlements are accrued quarterly as part of other r evenue based on full year expected settlement 3Q18 Earnings Press Release:

Accounting for Ownership Stakes Delta currently owns 49% of Virgin Atlantic and Aeromexico 16 3Q18 Earnings Press Release: • Delta recognizes its 49% share of Aeromexico and Virgin Atlantic in miscellaneous non - operating • Fluctuations in partner profitability driven by economic factors, seasonality and currency need to be considered when modeling Delta’s non - operating expense ─ Virgin Atlantic and Aeromexico often earn the majority of their annual profits in the September quarter

17 Profit Sharing

Understanding Delta’s Employee Profit Sharing Program • Eligible profit sharing pool is determined by Delta’s adjusted pre - tax profits ─ Employees receive 10% of first $2.5 billion of eligible profits and 20% above that ─ Delta incurs employer taxes and other costs which add 2% to 2.5% at 10% level and 3% to 4% at 20% level • Profit sharing accrual is updated monthly 18 Rewarding employees through profit sharing is a unifying force $0.5B $1.1B $1.5B $1.1B $1.1B 2013 2014 2015 2016 2017 Annual Profit Sharing

Calculating Profit Sharing Illustrative profit sharing calculation using $5 billion of pre - tax income 19 Profit Sharing Pool Revenue: $ 44.0B Expenses (excluding profit sharing): $ 37.8B Revenue – Expenses = Profit Sharing Pool: $ 6.2B Profit Sharing Total $2.5B threshold = $2.5B x ~12.5% $0.3B Above threshold = $3.7B x ~23.5% $0.9B Profit Sharing Pool = $6.2B $1.2B Pre - Tax Income Revenue $ 44.0B Expenses (excluding profit sharing) $ 37.8B Profit Sharing $ 1.2B Pre - Tax Income $ 5.0B Blended Average Profit Sharing Rate Profit Sharing Total Profit Sharing Pool $1.2B $6.2B = = ~20% = = T otal =

20 Refinery
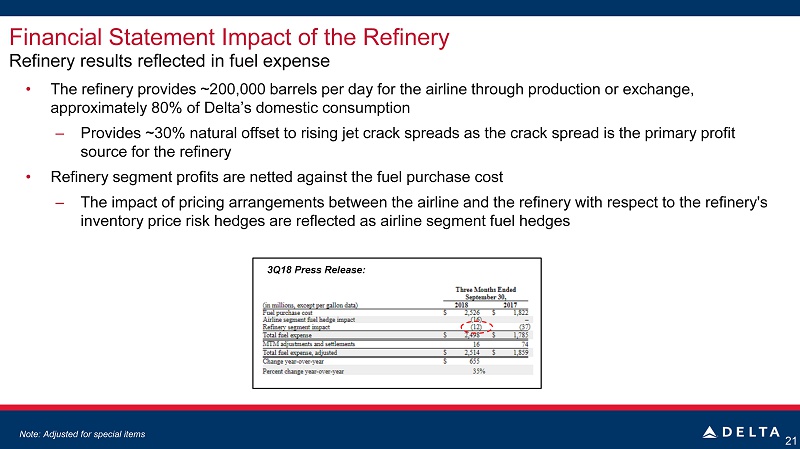
Financial Statement Impact of the Refinery • The refinery provides ~200,000 barrels per day for the airline through production or exchange, approximately 80% of Delta’s domestic consumption ‒ Provides ~30% natural offset to rising jet crack spreads as the crack spread is the primary profit source for the refinery • Refinery segment profits are netted against the fuel purchase cost ‒ The impact of pricing arrangements between the airline and the refinery with respect to the refinery's inventory price risk hedges are reflected as airline segment fuel hedges 21 Refinery results reflected in fuel expense 3Q18 Press Release: N ote: Adjusted for special items
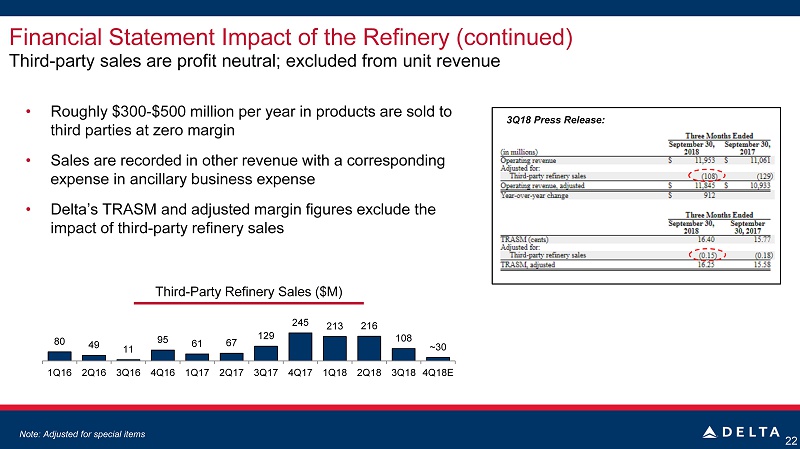
Financial Statement Impact of the Refinery (continued) • Roughly $ 300 - $500 million per year in products are sold to third parties at zero margin • Sales are recorded in other r evenue with a corresponding expense in ancillary business expense • Delta’s TRASM and adjusted margin figures exclude the impact of third - party refinery sales 22 Third - party sales are profit neutral; excluded from unit revenue 3Q18 Press Release: 80 49 11 95 61 67 129 245 213 216 108 ~30 1Q16 2Q16 3Q16 4Q16 1Q17 2Q17 3Q17 4Q17 1Q18 2Q18 3Q18 4Q18E Third - Party Refinery Sales ($M) N ote: Adjusted for special items
23 Ancillary Businesses & DGS Transaction

3Q18 ($M) (¢) Total Operating Expenses 10,311 14.15 Less: Aircraft Fuel (2,498) (3.43) Less: Ancillary Businesses and Refinery (410) (0.56) Less: Profit Sharing (395) (0.54) NF-CASM Expense Base 7,008 9.62 Capacity (ASMs) 72,875 NF-CASM excluding profit sharing 9.62¢ Delta's CASM-ex Calculation Impact of Delta’s Ancillary Businesses • Delta’s ancillary businesses include MRO, DAL Global Services (DGS), Delta Vacations , Delta Private Jets (DPJ ) and Delta Material Services (DMS) • Ancillary business are complementary to the airline operation, but have different seasonality and trends • Delta excludes expenses related to its ancillary businesses from CASM - ex fuel to allow for a clean comparison of the cost performance of the airline, as these costs are not directly impacted by capacity 24 Ancillary businesses are complementary to the airline and are earnings and cash flow positive

DAL Global Services Transaction Overview • DGS will be combined by year - end 2018 with a subsidiary of Argenbright Holdings to create a premier aviation and ground handling service provider − Delta will be an equity partner with a 49% stake in the combined company − Better positions DGS to grow aviation, security, and ground support equipment maintenance services Financial Impact: 2018: One - time gain in non - operating, finalized at transaction close 2019: Results from 49% equity interest stake to be recorded in operating expense as an offset to contracted services • Reduction in other revenue and ancillary expense • Minimal CASM impact due to shifting of certain expenses to contracted services 25
26 Taxes

Book Tax Rate Cash Tax Rate 10 - 12% 23 - 24% 27 Expect to be full cash taxpayer in 2020 Delta’s Cash Tax Rate is Below Book Tax Rate • Delta’s cash tax rate is significantly below its ~23 - 24% book tax rate due to: ─ Accelerated depreciation ─ Pension funding ─ Permanently reinvested foreign earnings • Under current tax law, Delta does not expect to be a full cash taxpayer until 2020 ─ Cash tax rate is expected to remain roughly 10 points below the book tax rate $8.3B $4.7B ~$2.5B 2016 2017 2018E Expected 2018 Book vs. Cash Tax Rate (Ex. N.O.L.’s) Net Operating Loss Carry Forwards
28 Airport Investments

• Delta approaches each construction project individually, working closely with airport partners • Airports have different structures for how they charge airlines fees and rents − Landing fees are assessed by landed weight and pay for airfield - related costs to construct, maintain, and operate runways and taxiways − R ents cover the cost to construct, maintain and operate landside assets ( primarily terminals and concourses), assessed by square feet leased or enplaned passengers Delta’s Airport Investments 29 LGA • • • • • • • • • • • • • • • • • • Delta maintains project control over cost and timeline • Cash or debt financing by Delta locks in ownership costs and avoids periodic rent increases • Provides greater control of customer service and operational disruption • Facility rents decline, depreciation increases (and interest expense, if financed) • Example: LGA Delta Managed / Financed • Delta maintains project control over cost and timeline • Costs paid up front or reimbursed by airport • Provides greater control of customer service and operational disruption • Airport issues bonds to fund construction • Airport recovers costs through rents/fees over lease term • Examples: ATL – Delta concourses, LAX Delta Managed / Airport Financed • Airport manages project and finances through bond offerings • Delta engages with airport to mitigate potential customer impact from construction • Delta has less input on costs, design • Airport recovers costs through rents/fees over lease term • Examples: ATL – Airfield, SLC, SEA Airport Managed / Financed Renovation funding of key airports including ATL, LAX, LGA, SEA, and SLC
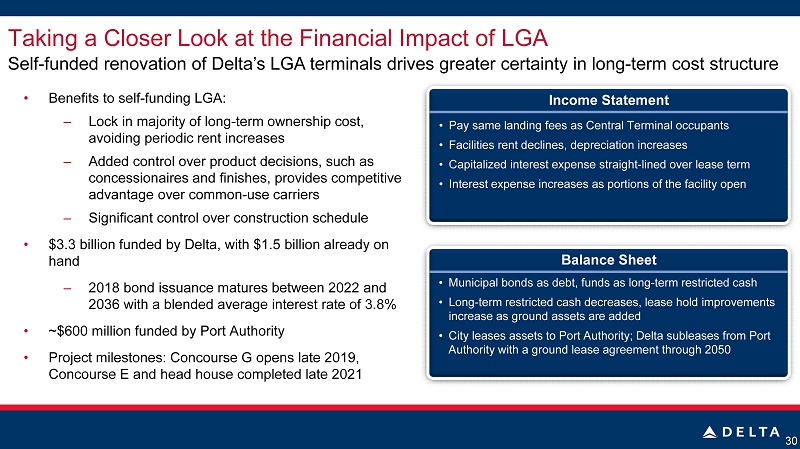
Taking a Closer Look at the Financial Impact of LGA 30 Self - funded renovation of Delta’s LGA terminals drives greater certainty in long - term cost structure • Benefits to self - funding LGA: ‒ Lock in majority of long - term ownership cost, avoiding periodic rent increases ‒ Added control over product decisions, such as concessionaires and finishes, provides competitive advantage over common - use carriers ‒ Significant control over construction schedule • $3.3 billion funded by Delta, with $1.5 billion already on hand ‒ 2018 bond issuance matures between 2022 and 2036 with a blended average interest rate of 3.8% • ~$600 million funded by Port Authority • Project milestones: Concourse G opens late 2019, Concourse E and head house completed late 2021 • Pay same landing fees as Central Terminal occupants • Facilities rent declines, depreciation increases • Capitalized interest expense straight - lined over lease term • Interest expense increases as portions of the facility open Income Statement • Municipal bonds as debt, funds as long - term restricted cash • Long - term restricted cash decreases, lease hold improvements increase as ground assets are added • City leases assets to Port Authority; Delta subleases from Port Authority with a ground lease agreement through 2050 Balance Sheet
32 Non - GAAP Reconciliations Non - GAAP Financial Measures Adjusted Debt to EBITDAR, adjusted Delta presents adjusted debt to EBITDAR, adjusted because management believes this metric is helpful to investors in assessing the company’s overall debt profile. Adjusted debt includes an estimate of the operating lease liability that will be on the balance sheet upon adoption of the new lease accounting standard. We adjust EBITDAR for an estimate of the fixed portion of operating leases to determine EBITDAR, adjusted. (Projected) December 31, 2018 ~ $8 Plus: LGA bonds ~ 1 Plus: Operating lease liability ~ 7 ~ $16 (Projected) Year Ended (in billions) December 31, 2018 GAAP operating income ~ $5 Adjusted for: Depreciation and amortization ~ 3 Fixed portion of operating lease expense ~ 1 EBITDAR, adjusted ~ $9 Adjusted Debt to EBITDAR, adjusted ~1.9x Adjusted debt and capital lease obligations (in billions) Debt and capital lease obligations The following tables show reconciliations of non-GAAP financial measures. The reasons Delta uses these measures are described below. Reconciliations may not calculate due to rounding. Delta sometimes uses information ("non-GAAP financial
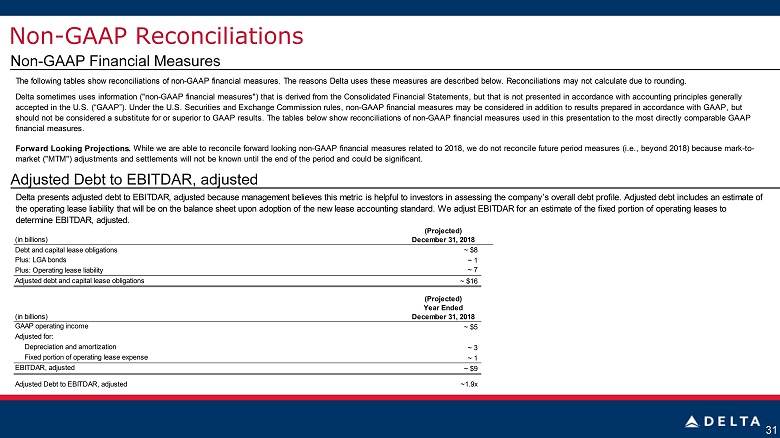
31 Non - GAAP Reconciliations Non - GAAP Financial Measures Adjusted Debt to EBITDAR, adjusted Delta presents adjusted debt to EBITDAR, adjusted because management believes this metric is helpful to investors in assessing the company’s overall debt profile. Adjusted debt includes an estimate of the operating lease liability that will be on the balance sheet upon adoption of the new lease accounting standard. We adjust EBITDAR for an estimate of the fixed portion of operating leases to determine EBITDAR, adjusted. (Projected) December 31, 2018 ~ $8 Plus: LGA bonds ~ 1 Plus: Operating lease liability ~ 7 ~ $16 (Projected) Year Ended (in billions) December 31, 2018 GAAP operating income ~ $5 Adjusted for: Depreciation and amortization ~ 3 Fixed portion of operating lease expense ~ 1 EBITDAR, adjusted ~ $9 Adjusted Debt to EBITDAR, adjusted ~1.9x Adjusted debt and capital lease obligations (in billions) Debt and capital lease obligations The following tables show reconciliations of non-GAAP financial measures. The reasons Delta uses these measures are described below. Reconciliations may not calculate due to rounding. Delta sometimes uses information ("non-GAAP financial measures") that is derived from the Consolidated Financial Statements, but that is not presented in accordance with accounting principles generally accepted in the U.S. (“GAAP”). Under the U.S. Securities and Exchange Commission rules, non-GAAP financial measures may be considered in addition to results prepared in accordance with GAAP, but should not be considered a substitute for or superior to GAAP results. The tables below show reconciliations of non-GAAP financial measures used in this presentation to the most directly comparable GAAP financial measures. Forward Looking Projections. While we are able to reconcile forward looking non-GAAP financial measures related to 2018, we do not reconcile future period measures (i.e., beyond 2018) because mark-to- market ("MTM") adjustments and settlements will not be known until the end of the period and could be significant.
measures") that is derived from the Consolidated Financial Statements, but that is not presented in accordance with accounting principles generally accepted in the U.S. (“GAAP”). Under the U.S. Securities and Exchange Commission rules, non-GAAP financial measures may be considered in addition to results prepared in accordance with GAAP, but should not be considered a substitute for or superior to GAAP results. The tables below show reconciliations of non-GAAP financial measures used in this presentation to the most directly comparable GAAP financial measures. Forward Looking Projections. While we are able to reconcile forward looking non-GAAP financial measures related to 2018, we do not reconcile future period measures (i.e., beyond 2018) because mark-to- market ("MTM") adjustments and settlements will not be known until the end of the period and could be significant.