Attached files
| file | filename |
|---|---|
| 8-K - 8-K - Arcosa, Inc. | a121218form8-k.htm |

Investor Presentation December 2018

Forward-Looking Statements Some statements in this presentation, which are not historical facts, are “forward-looking statements” as defined by the Private Securities Litigation Reform Act of 1995. Forward-looking statements include statements about Arcosa’s estimates, expectations, beliefs, intentions or strategies for the future. Arcosa uses the words “anticipates,” “assumes,” “believes,” “estimates,” “expects,” “intends,” “forecasts,” “may,” “will,” “should,” “guidance,” “outlook,” and similar expressions to identify these forward-looking statements. Forward-looking statements speak only as of the date of this presentation, and Arcosa expressly disclaims any obligation or undertaking to disseminate any updates or revisions to any forward-looking statement contained herein, except as required by federal securities laws. Forward-looking statements are based on management’s current views and assumptions and involve risks and uncertainties that could cause actual results to differ materially from historical experience or our present expectations, including but not limited to assumptions, risks and uncertainties regarding achievement of the expected benefits of Arcosa’s spin-off from Trinity; tax treatment of the spin-off; failure to successfully integrate the ACG Materials acquisition, or failure to achieve the expected benefits of the acquisition; market conditions and customer demand for Arcosa’s business products and services; the cyclical nature of, and seasonal or weather impact on, the industries in which Arcosa competes; competition and other competitive factors; governmental and regulatory factors; changing technologies; availability of growth opportunities; market recovery; improving margins; and Arcosa’s ability to execute its long-term strategy, and such forward-looking statements are not guarantees of future performance. For further discussion of such risks and uncertainties, see “Information Statement Summary”, “Risk Factors” and “Forward-Looking Statements” in the information statement filed as an exhibit to Arcosa’s Registration Statement on Form 10, as amended. 2 / Moving Infrastructure Forward — Investor Presentation, December 2018

How to Find Us OUR WEBSITE NYSE TICKER www.arcosa.com ACA HEADQUARTERS INVESTOR CONTACT Arcosa, Inc. InvestorResources@arcosa.com 500 North Akard Street Dallas, Tx 75201 3 / Moving Infrastructure Forward — Investor Presentation, December 2018

Agenda . Company overview and long term vision . Update on Stage 1 priorities 4 / Moving Infrastructure Forward — Investor Presentation, December 2018
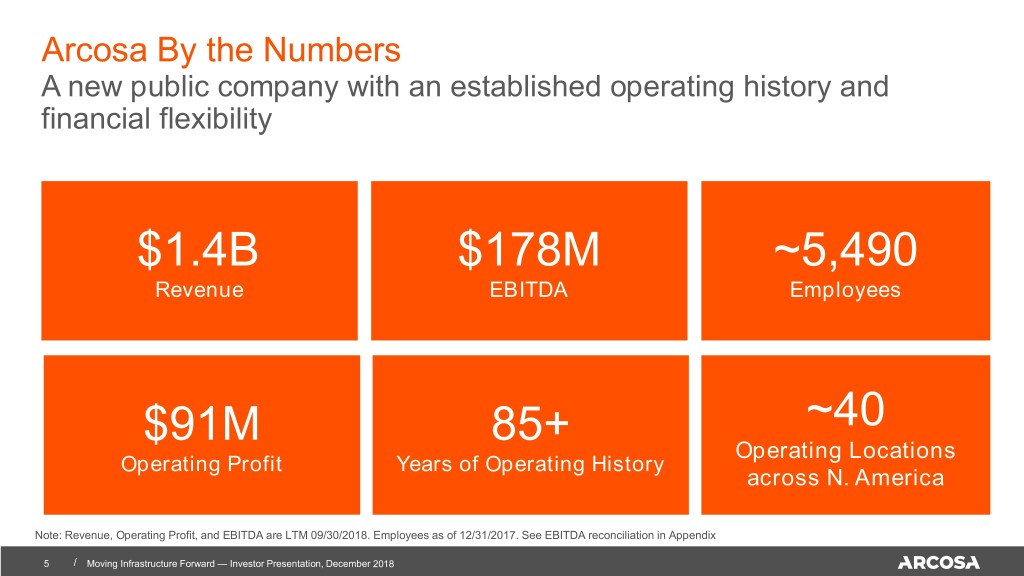
Arcosa By the Numbers A new public company with an established operating history and financial flexibility $1.4B $178M ~5,490 Revenue EBITDA Employees ~40 $91M 85+ Operating Locations Operating Profit Years of Operating History across N. America Note: Revenue, Operating Profit, and EBITDA are LTM 09/30/2018. Employees as of 12/31/2017. See EBITDA reconciliation in Appendix 5 / Moving Infrastructure Forward — Investor Presentation, December 2018
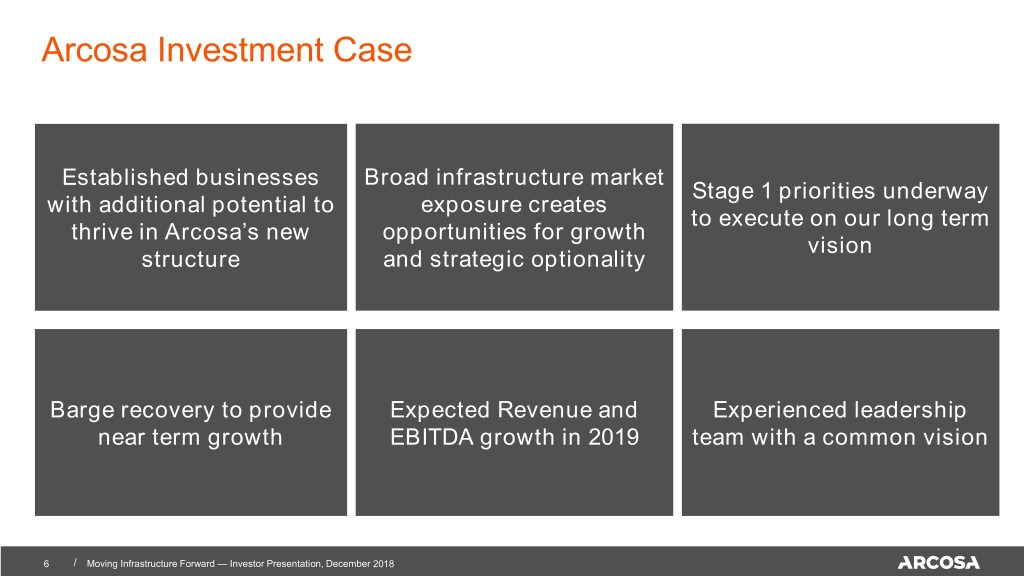
Arcosa Investment Case Established businesses Broad infrastructure market Stage 1 priorities underway with additional potential to exposure creates to execute on our long term thrive in Arcosa’s new opportunities for growth vision structure and strategic optionality Barge recovery to provide Expected Revenue and Experienced leadership near term growth EBITDA growth in 2019 team with a common vision 6 / Moving Infrastructure Forward — Investor Presentation, December 2018

Established businesses with additional potential to thrive in Arcosa’s new structure Markets CONSTRUCTION ENERGY TRANSPORTATION Revenue $291M $766M $381M Adj. EBITDA 27% 11% 16% margin AGGREGATES WIND TOWERS BARGES SPECIALTY UTILITY COMPONENTS MATERIALS STRUCTURES CONSTRUCTION STORAGE TANKS SITE SUPPORT Note: Revenue and Adj. EBITDA margin are LTM 09/30/2018. See Adjusted EBITDA reconciliation in Appendix 7 / Moving Infrastructure Forward — Investor Presentation, December 2018
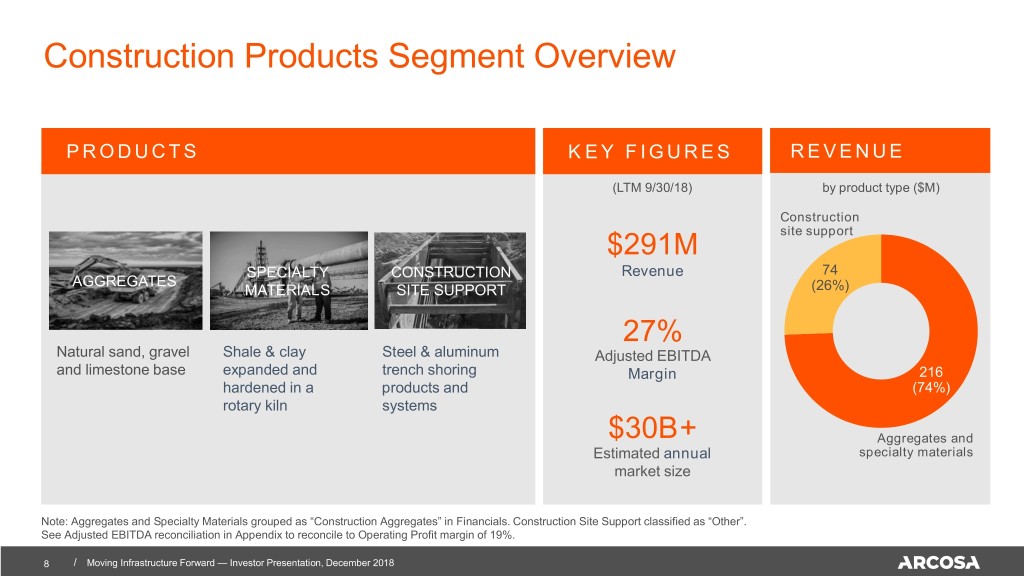
Construction Products Segment Overview PRODUCTS KEY FIGURES REVENUE (LTM 9/30/18) by product type ($M) Construction site support $291M SPECIALTY CONSTRUCTION Revenue 74 AGGREGATES MATERIALS SITE SUPPORT74 (26%) 27% Natural sand, gravel Shale & clay Steel & aluminum Adjusted EBITDA and limestone base expanded and trench shoring Margin 216 hardened in a products and (74%) rotary kiln systems $30B+ Aggregates and Estimated annual specialty materials market size Note: Aggregates and Specialty Materials grouped as “Construction Aggregates” in Financials. Construction Site Support classified as “Other”. See Adjusted EBITDA reconciliation in Appendix to reconcile to Operating Profit margin of 19%. 8 / Moving Infrastructure Forward — Investor Presentation, December 2018

Energy Equipment Segment Overview Products Key figures Revenue (LTM 9/30/18) by product type ($M) Storage tanks and other WIND TOWERS UTILITY STRUCTURES $766M 201 Revenue (26%) Storage 565 11% (74%) Adjusted EBITDA RESIDENTIAL/COMMERCIAL/ INDUSTRIAL SCALE & FIELD Margin AGRICULTURAL ERECTED STORAGE Utility structures STORAGE and wind towers $700M Backlog in Utility Structures and Wind Towers as of 09/30/18 See Adjusted EBITDA reconciliation in Appendix to reconcile to Operating Profit Margin of 4% 9 / Moving Infrastructure Forward — Investor Presentation, December 2018

Transportation Products Segment Overview PRODUCTS KEY FIGURES REVENUE (LTM 9/30/18) by product type ($M) $381M Barges TANK BARGES HOPPER BARGES FIBERGLASS Revenue COVERS 157 16% (41%) Adjusted EBITDA 224 RAILCAR INDUSTRIAL & Margin (59%) RAILCAR AXLES COUPLING MINING DEVICES COMPONENTS $5B+ Components Estimated annual market size $210M Backlog in Barges as of 09/30/18 See Adjusted EBITDA reconciliation in Appendix to reconcile with Operating Profit Margin of 11% 10 / Moving Infrastructure Forward — Investor Presentation, December 2018
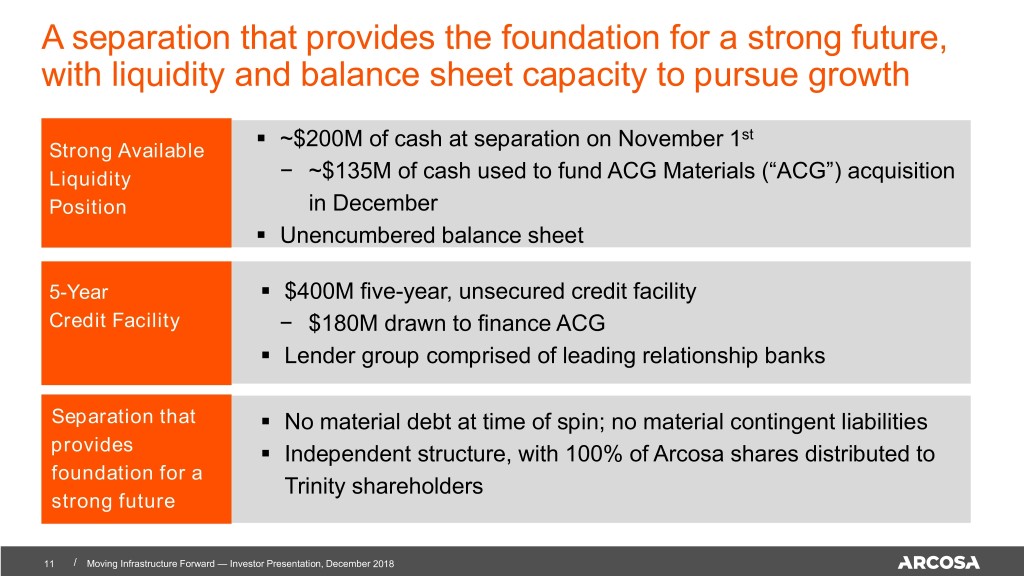
A separation that provides the foundation for a strong future, with liquidity and balance sheet capacity to pursue growth . ~$200M of cash at separation on November 1st Strong Available Liquidity − ~$135M of cash used to fund ACG Materials (“ACG”) acquisition Position in December . Unencumbered balance sheet 5-Year . $400M five-year, unsecured credit facility Credit Facility − $180M drawn to finance ACG . Lender group comprised of leading relationship banks Separation that . No material debt at time of spin; no material contingent liabilities provides . Independent structure, with 100% of Arcosa shares distributed to foundation for a Trinity shareholders strong future 11 / Moving Infrastructure Forward — Investor Presentation, December 2018

Long term vision for Arcosa Improve long term returns on invested Reduce the capital complexity and cyclicality of the Grow in attractive overall business markets where we can achieve sustainable competitive advantages 12 / Moving Infrastructure Forward — Investor Presentation, December 2018

Environmental, social, and governance impact Our board and leadership team are committed to ESG impact Safety and health Environment People & communities Governance Protecting the safety and We are stewards of Our people contribute to We are committed to the health of our people the environment and the communities in highest principles of guides us in everything committed to which they live and work corporate governance we do sustainability . Ethics Training and . Chairman and CEO . Safety Excellence . A leading producer of Certification programs roles are separated program rolled out to wind towers for . Extensive community . Management pay linked plants renewable power engagement programs to performance . Our trench shoring generation . Talent development . Commitment to products are used for . Arcosa headquarters is program to build the disclosure and worker protection in the LEED Gold, Energy skills and experience of transparency construction industry Star Certified our team . Instituted sustainability program to track environmental metrics 13 / Moving Infrastructure Forward — Investor Presentation, December 2018

Agenda . Company overview and long term vision . Update on Stage 1 Priorities 14 / Moving Infrastructure Forward — Investor Presentation, December 2018

At our October Investor Day, we laid out Arcosa’s Stage 1 Priorities… Grow Improve Expand Operate a flat Construction Energy Transport- and Products Equipment’s ation responsive organically and operational Products corporate through performance while organically as structure acquisitions pursuing barge and rail disciplined growth markets recover 15 / Moving Infrastructure Forward — Investor Presentation, December 2018

…and we have continued to make progress on our priorities Grow .A Completed $315M acquisition of ACG, growing Construction Products revenue by ~50% Construction . Turning focus to ACG integration and using it as a platform for Products additional value-creating capital deployment C On December 6th, . In Q4, divested two sub-scale businesses that were included in “Other” also announced Improve Energy Energy Equipment key elements of Equipment . Extending Continuous Improvement program from Wind Towers to rest capital allocation of Energy Equipment strategy: • $0.05 per Expand .B Announced re-opening of idled barge plant in Louisiana to prepare for share quarterly increased production in 2019 dividend • $50M share Transportation . Expanding components business to new customers and markets repurchase Products authorization Operate a flat . Outsourced certain corporate functions as part of separation . corporate Streamlined corporate structure to reduce layers structure FY 2019 guidance as of 11/01/18. Guidance does not include the impact from ACG Materials acquisition. See EBITDA reconciliation included in Appendix for reconciliation to 2019 Net Income range of $81-89M 16 / Moving Infrastructure Forward — Investor Presentation, December 2018

A ACG increases the scale of Arcosa’s Construction Products segment by approximately 50%, to $450 million Adds complementary, Diversifies customer base Accelerates growth into $152M scaled specialty materials across attractive end 1 specialty materials and LTM Revenue and aggregates platforms markets aggregates $32M Adds expertise in Strengthens pipeline of Brings top tier LTM Adjusted developing specialty acquisitions and organic management team to materials applications growth opportunities Arcosa EBITDA1 Multi-State Platform Diverse End Markets 24 Active Mines Other Building Products Agriculture 5 Production Facilities Energy Infrastructure Aggregate mines Infrastructure Production facilities Corporate HQ 1 Estimated LTM for 12 months ended 08/31/2018. See Adjusted EBITDA reconciliation in Appendix. Expected to be slightly accretive to FY19 17 / Moving Infrastructure Forward — Investor Presentation, December 2018

A The acquisition is aligned with Arcosa’s long term vision and Stage 1 Priorities Long Term Vision Stage 1 Priorities Grow Improve Expand Operate a flat Improve long Construction Energy Transport- and Products Equipment’s ation responsive Reduce the term returns organically operational Products corporate Grow in complexity on invested and through performance organically structure attractive and capital acquisitions while as barge and markets cyclicality of pursuing rail markets where we can the overall disciplined recover achieve business growth sustainable competitive advantages 18 / Moving Infrastructure Forward — Investor Presentation, December 2018

A ACG is a strategic acquisition for Arcosa’s Construction Products segment Aggregates Specialty Materials Construction Site Support 19 / Moving Infrastructure Forward — Investor Presentation, December 2018

A Adds complementary, scaled aggregates and specialty materials businesses to Arcosa’s current platforms Operations Products Geographic Footprint • 18 active Construction • Aggregates (sand, gravel, Materials locations and limestone base) • 11 aggregate • Lightweight aggregates mines • 7 lightweight Aggregate mines locations Lightweight locations • 29 active locations • Mined and crushed rock (aggregates, cement / • 24 aggregate retarder rock, fines) mines • Specialty milled (building • 5 production products, fertilizers) facilites • Specialty processed Aggregate mines (plasters, agricultural prills, Production facilities food/pharma) 20 / Moving Infrastructure Forward — Investor Presentation, December 2018
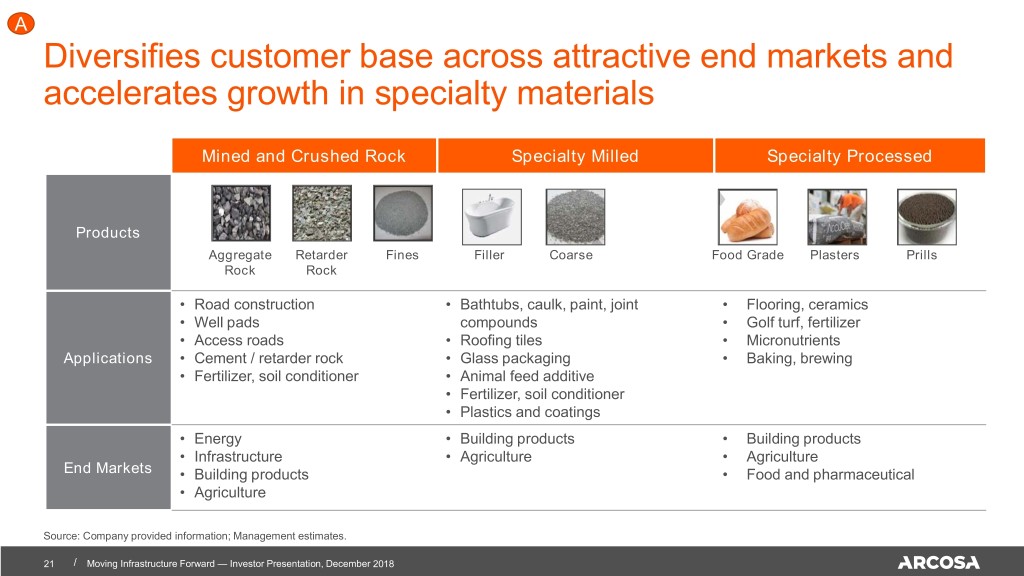
A Diversifies customer base across attractive end markets and accelerates growth in specialty materials Mined and Crushed Rock Specialty Milled Specialty Processed Products Aggregate Retarder Fines Filler Coarse Food Grade Plasters Prills Rock Rock • Road construction • Bathtubs, caulk, paint, joint • Flooring, ceramics • Well pads compounds • Golf turf, fertilizer • Access roads • Roofing tiles • Micronutrients Applications • Cement / retarder rock • Glass packaging • Baking, brewing • Fertilizer, soil conditioner • Animal feed additive • Fertilizer, soil conditioner • Plastics and coatings • Energy • Building products • Building products • Infrastructure • Agriculture • Agriculture End Markets • Building products • Food and pharmaceutical • Agriculture Source: Company provided information; Management estimates. 21 / Moving Infrastructure Forward — Investor Presentation, December 2018

A Transaction and Financing Summary • Purchase price of approximately $315 million funded with cash on-hand and $180M of borrowings under Arcosa’s $400 million five year, credit facility Financing • Transaction closed December 5, 2018 & Closing • Expected to be slightly accretive to earnings in 2019 • Arcosa expects to revisit its revenue and EBITDA guidance for fiscal year 2019, Accretion following additional clarity on purchase price accounting 22 / Moving Infrastructure Forward — Investor Presentation, December 2018
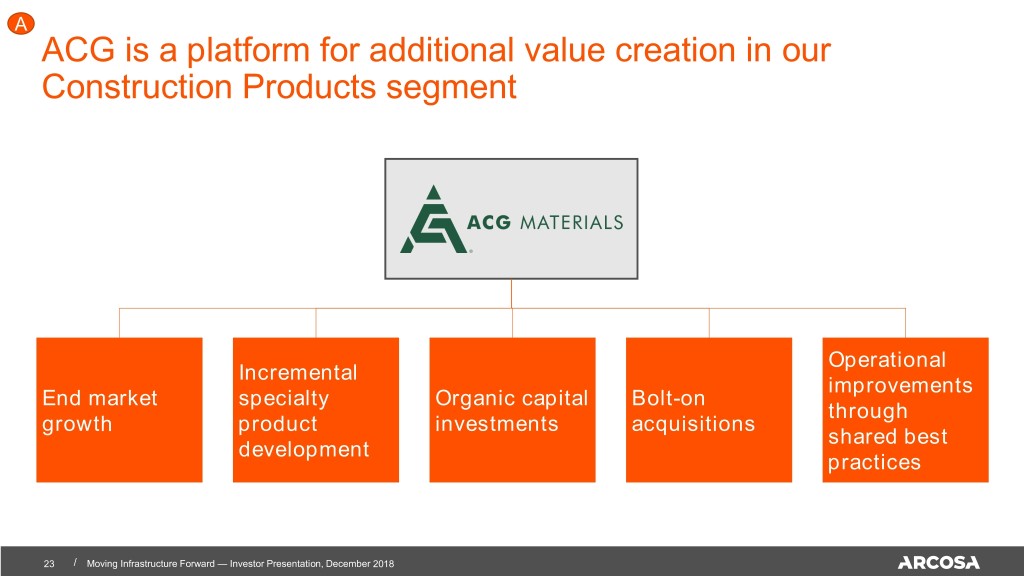
A ACG is a platform for additional value creation in our Construction Products segment Operational Incremental improvements End market specialty Organic capital Bolt-on through growth product investments acquisitions shared best development practices 23 / Moving Infrastructure Forward — Investor Presentation, December 2018

B Emerging barge recovery 2017-2018 were well below long term averages, but signs of recovery moving into 2019 Inland Barge business Revenue $ Millions 675 Adjusted EBITDA 639 653 577 548 • Healthy returns on capital over the cycle, as Adj. EBITDA / Assets 422 403 averaged 62% from 2010-2017 • Even in the significant downturn over the last several years, this business remained 158 170 profitable 132 124 128 113 104 75 54 14 12 2010 2011 2012 2013 2014 2015 2016 2017 2018(P) Source: Trinity financials for all historical periods. 2018 Projections based on 07/26/18 Trinity Industries, Inc. Guidance. See Adjusted EBITDA reconciliation in Appendix 24 / Moving Infrastructure Forward — Investor Presentation, December 2018

B Emerging barge recovery Recent orders have been strong, leading to announced re-opening of idled facility Inland Barge business Book to Bill ratio ($ Value of Orders Signed: $ Value of Orders Produced) . Recent book to bill ratios have 2.7 been strong, and above 1.0, in 4 of last 5 quarters 2.3 . 3Q18 customer activity also 1.9 included finalized supply Backlog agreements not included in backlog at this time Growing 1.2 0.8 1 . Continue to see healthy inquiry Backlog levels for a wide variety of liquid Shrinking 0.4 0.4 types 0.3 0.2 0.1 0.2 . Announced re-opening of idled 1Q16 2Q16 3Q16 4Q16 1Q17 2Q17 3Q17 4Q17 1Q18 2Q18 3Q18 facility in October to support demand conditions 25 / Moving Infrastructure Forward — Investor Presentation, December 2018

C Capital Allocation Priorities Dividend and share repurchase authorization add key elements of capital allocation strategy Organic investments Acquisitions Return of capital to shareholders . Capital expenditures averaged ~$84M . Announced ~$315M acquisition of . Announced key elements on annually in 2016 and 2017 ACG Materials, which increases the December 6th: annualized revenues of Construction . At October Investor Day, we . Quarterly dividend of $0.05 Products segment by approximately discussed similar trend for 2019: per share 50%, to $450 million . ~$50-60M of Maintenance CapEx . Share repurchase . Will continue to pursue pipeline of authorization of $50 million . Additional Growth CapEx will vary potential acquisitions in construction, through the end of 2020 based on opportunities energy, and transportation markets . Targeting short cash payback periods for internal investments 26 / Moving Infrastructure Forward — Investor Presentation, December 2018
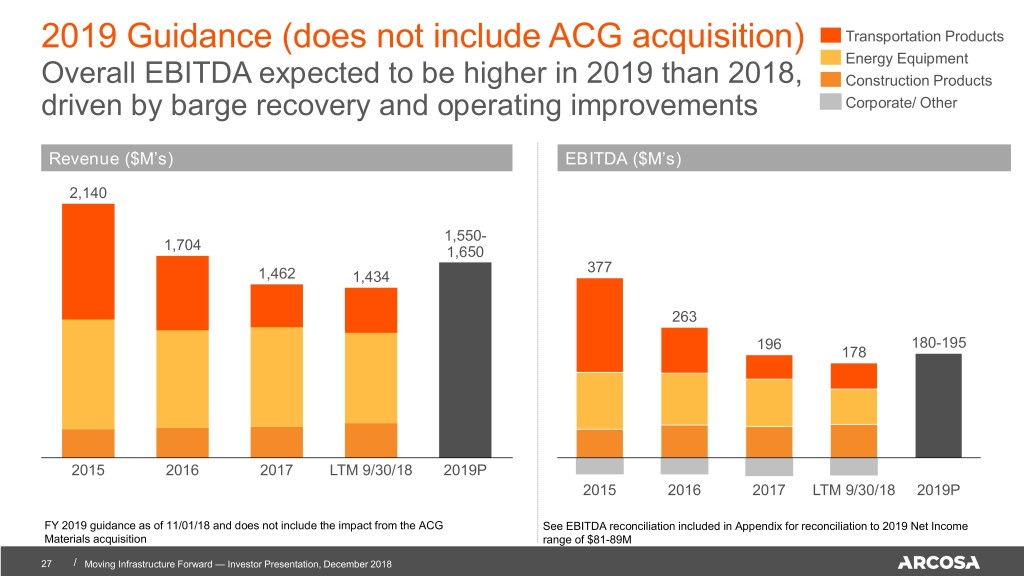
2019 Guidance (does not include ACG acquisition) Transportation Products Energy Equipment Overall EBITDA expected to be higher in 2019 than 2018, Construction Products driven by barge recovery and operating improvements Corporate/ Other Revenue ($M’s) EBITDA ($M’s) 2,140 1,550- 1,704 1,650 377 1,462 1,434 263 196 180-195 178 2015 2016 2017 LTM 9/30/18 2019P 2015 2016 2017 LTM 9/30/18 2019P FY 2019 guidance as of 11/01/18 and does not include the impact from the ACG See EBITDA reconciliation included in Appendix for reconciliation to 2019 Net Income Materials acquisition range of $81-89M 27 / Moving Infrastructure Forward — Investor Presentation, December 2018

Appendix
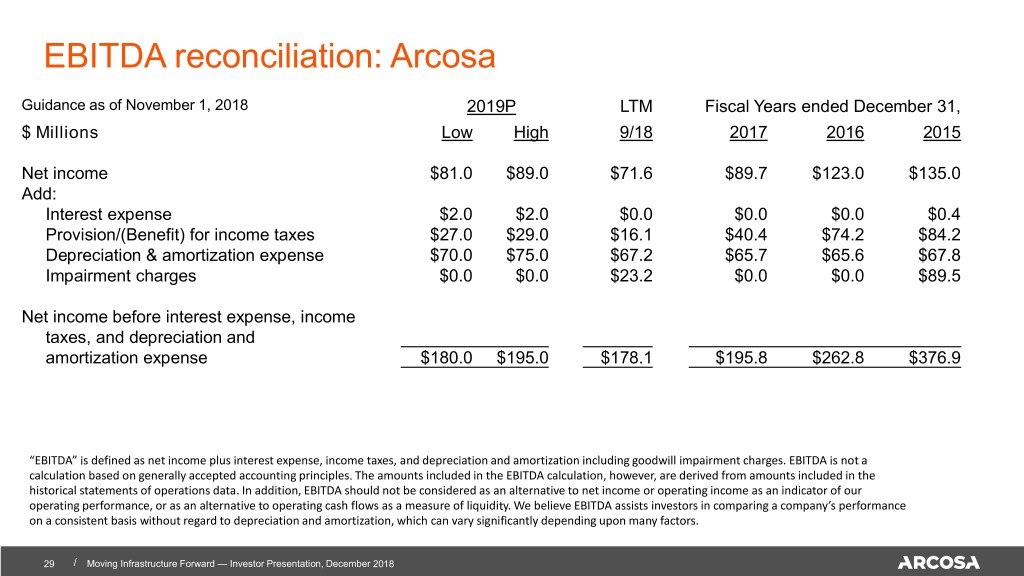
EBITDA reconciliation: Arcosa Guidance as of November 1, 2018 2019P LTM Fiscal Years ended December 31, $ Millions Low High 9/18 2017 2016 2015 Net income $81.0 $89.0 $71.6 $89.7 $123.0 $135.0 Add: Interest expense $2.0 $2.0 $0.0 $0.0 $0.0 $0.4 Provision/(Benefit) for income taxes $27.0 $29.0 $16.1 $40.4 $74.2 $84.2 Depreciation & amortization expense $70.0 $75.0 $67.2 $65.7 $65.6 $67.8 Impairment charges $0.0 $0.0 $23.2 $0.0 $0.0 $89.5 Net income before interest expense, income taxes, and depreciation and amortization expense $180.0 $195.0 $178.1 $195.8 $262.8 $376.9 “EBITDA” is defined as net income plus interest expense, income taxes, and depreciation and amortization including goodwill impairment charges. EBITDA is not a calculation based on generally accepted accounting principles. The amounts included in the EBITDA calculation, however, are derived from amounts included in the historical statements of operations data. In addition, EBITDA should not be considered as an alternative to net income or operating income as an indicator of our operating performance, or as an alternative to operating cash flows as a measure of liquidity. We believe EBITDA assists investors in comparing a company’s performance on a consistent basis without regard to depreciation and amortization, which can vary significantly depending upon many factors. 29 / Moving Infrastructure Forward — Investor Presentation, December 2018

Adjusted EBITDA reconciliation by Arcosa Segment LTM Fiscal Years ended December 31, $ Millions 9/18 2017 2016 2015 Construction Products Segment Operating Profit $56.5 $53.7 $59.3 $50.4 Add: Depreciation & amortization expense $20.4 $18.4 $16.0 $15.6 Adjusted EBITDA $76.9 $72.1 $75.3 $66.0 Energy Equipment Segment Operating Profit $27.7 $78.4 $87.7 $8.4 Add: Depreciation & amortization expense $30.2 $30.2 $31.7 $32.9 Add: Impairment charge $23.2 $0.0 $0.0 $89.5 Adjusted EBITDA $81.1 $108.6 $119.4 $130.8 Transportation Products Segment Operating Profit $43.3 $39.0 $87.3 $197.7 Add: Depreciation & amortization expense $16.6 $17.1 $17.9 $19.3 Adjusted EBITDA $59.9 $56.1 $105.2 $217.0 Operating Profit – Corporate ($36.2) ($39.4) ($33.5) ($38.7) Other, net expense ($3.6) ($1.6) ($3.6) $1.4 Add: Interest expense $0.0 $0.0 $0.0 $0.4 EBITDA $178.1 $195.8 $262.8 $376.9 “Adjusted EBITDA” is defined as segment operating profit plus depreciation and amortization including goodwill impairment charges. “Adjusted EBITDA Margin” is defined as Adjusted EBITDA divided by Revenue. Since income taxes and interest expense are not allocated to the segment level, they are not added back in the calculation of adjusted EBITDA. For a reconciliation of EBITDA to net income, see the accompanying EBITDA reconciliation. Adjusted EBITDA is not a calculation based on generally accepted accounting principles. The amounts included in the Adjusted EBITDA calculation, however, are derived from amounts included in the historical statements of operations data. In addition, Adjusted EBITDA should not be considered as an alternative to net income or operating income as an indicator of our operating performance, or as an alternative to operating cash flows as a measure of liquidity. We believe adjusted EBITDA assists investors in comparing a company’s performance on a consistent basis without regard to depreciation and amortization, which can vary significantly depending upon many factors. 30 / Moving Infrastructure Forward — Investor Presentation, December 2018

Adjusted EBITDA reconciliation: Trinity’s Historic Barge Segment $ Millions Fiscal Years ended December 31, 2018(P) (1) 2017 2016 2015 2014 Barge (FY14 – FY18(P)) Operating Profit $5.1 $6.4 $45.3 $117.0 $114.4 Add: Depreciation & amortization expense $7.3 $7.3 $8.4 $10.5 $9.3 Adjusted EBITDA $12.4 $13.7 $53.7 $127.5 $123.7 Fiscal Years ended December 31, Barge (FY10 – FY13) 2013 2012 2011 2010 Operating Profit $96.0 $124.7 $106.4 $69.0 Add: Depreciation & amortization expense $8.1 $7.6 $6.4 $5.5 Adjusted EBITDA $104.1 $132.3 $112.8 $74.5 (1) Based on Trinity Industries guidance provided on 7/26/2018; revenues of $170M and operating profit margin of 3%; depreciation assumed equal to FY 2017 level “Adjusted EBITDA” is defined as segment operating profit plus depreciation and amortization expense. Since income taxes and interest expense are not allocated to the segment level, they are not added back in the calculation of adjusted EBITDA. For a reconciliation of EBITDA to net income, see the accompanying EBITDA reconciliation. Adjusted EBITDA is not a calculation based on generally accepted accounting principles. The amounts included in the adjusted EBITDA calculation, however, are derived from amounts included in the historical statements of operations data. In addition, adjusted EBITDA should not be considered as an alternative to net income or operating income as an indicator of our operating performance, or as an alternative to operating cash flows as a measure of liquidity. We believe adjusted EBITDA assists investors in comparing a company’s performance on a consistent basis without regard to depreciation and amortization, which can vary significantly depending upon many factors. 31 / Moving Infrastructure Forward — Investor Presentation, December 2018

Adjusted EBITDA reconciliation: ACG Materials $ Millions (For the Trailing Twelve Months Ended August 31, 2018) Net income (1.8) Add: Interest expense 16.6 Provision/(benefit) for income taxes (3.9) Depreciation & amortization expense 15.4 Other adjustments 5.7 Adjusted EBITDA 32.0 “Adjusted EBITDA” is defined as ACG Material’s (“ACG”) net income plus interest expense, income taxes, depreciation and amortization, and other one-time or non- recurring expenses, including management fees, debt refinancing fees, and non-recurring professional fees. Adjusted EBITDA is not a calculation based on generally accepted accounting principles. The amounts included in the Adjusted EBITDA calculation, however, are derived from amounts included in the historical statements of operations data. In addition, Adjusted EBITDA should not be considered as an alternative to net income or operating income as an indicator of ACG’s operating performance, or as an alternative to operating cash flows as a measure of liquidity. We believe Adjusted EBITDA assists investors in comparing a company’s performance on a consistent basis without regard to depreciation and amortization and other expenses, which can vary significantly depending upon many factors. 32 / Moving Infrastructure Forward — Investor Presentation, December 2018

Investor Presentation December 2018
