Attached files
| file | filename |
|---|---|
| 8-K - CURRENT REPORT - ASPEN GROUP, INC. | aspu_8k.htm |
| EX-99.1 - PRESS RELEASE - ASPEN GROUP, INC. | aspu_ex99z1.htm |
EXHIBIT 99.2
Investor Presentation December, 2018Nasdaq: ASPU 1
Aspen Group, Inc. is an education technology holding company that leverages its infrastructure and expertise to allow its two universities, Aspen University and United States University, to deliver on the vision of making college affordable again. 2
Safe Harbor Statement Certain statements in this presentation and responses to various questions include forward-looking statements within the meaning of the Private Securities Litigation Reform Act of 1995, including statements regarding continued growth in nursing opportunities, projected monthly cash receipts, expected increase in our market share, expected efficiency of our marketing efforts, and our expectations and plans regarding our hybrid pre-licensure program and future related partnerships. in The words “believe,” “may,” “estimate,” “continue,” “anticipate,” “intend,” “should,” “plan,” “could,” “target,” “potential,” “is likely,” “will,” “expect” and similar expressions, as they relate to us, are intended to identify forward-looking statements. We have based these forward-looking statements largely on our current expectations and projections about future events and financial trends that we believe may affect our financial condition, results of operations, business strategy and financial needs.Important factors that could cause actual results to differ from those in the forward-looking statements include the continued demand for nurses, continued effectiveness of our online marketing, how students react to our hybrid pre-licensure BSN program over time, and the Company’s ability to enter into and maintain partnerships with health care organizations to establish new campuses and/or finance those campuses. Further information on our risk factors is contained in our press release issued on December 10, 2018 and our filings with the SEC, including our Form S-3, our Prospectus Supplement filed on April 19, 2018 and the Form 10-K for the fiscal year ended April 30, 2018. Any forward-looking statement made by us herein speaks only as of the date on which it is made. Factors or events that could cause our actual results to differ may emerge from time to time, and it is not possible for us to predict all of them. We undertake no obligation to publicly update any forward-looking statement, whether as a result of new information, future developments or otherwise, except as may be required by law.Regulation G - Non-GAAP Financial Measures This presentation includes a discussion of Adjusted EBITDA, a non-GAAP financial measure. Certain information regarding these non-GAAP financial measures (including reconciliations to GAAP) is provided in the Appendix to this presentation and on the Investor Relations section of the Aspen website at www.aspu.com. 3
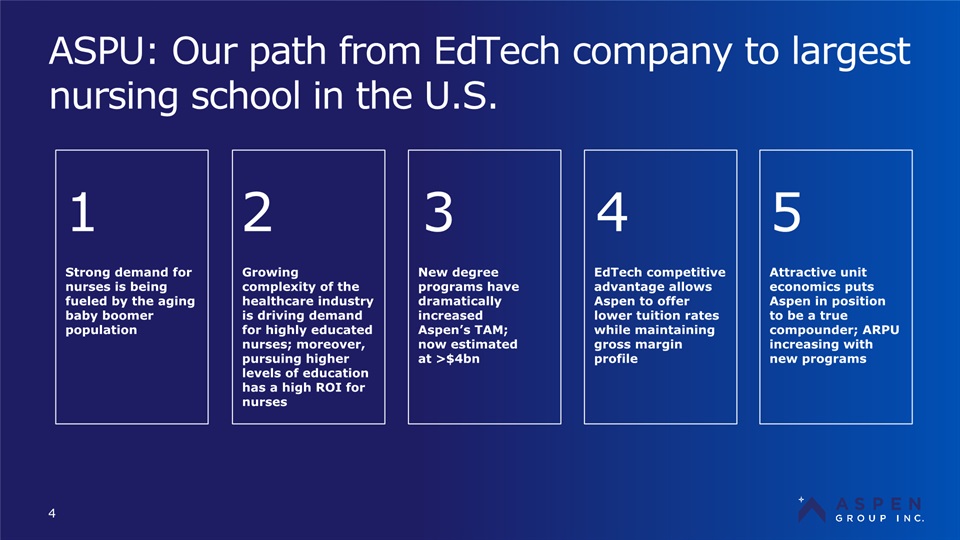
ASPU: Our path from EdTech company to largest nursing school in the U.S. 4 Strong demand for nurses is being fueled by the aging baby boomer population New degree programs have dramatically increased Aspen’s TAM; now estimated at >$4bn EdTech competitive advantage allows Aspen to offer lower tuition rates while maintaining gross margin profile Growing complexity of the healthcare industry is driving demand for highly educated nurses; moreover, pursuing higher levels of education has a high ROI for nurses Attractive unit economics puts Aspen in position to be a true compounder; ARPU increasing with new programs 1 2 3 4 5
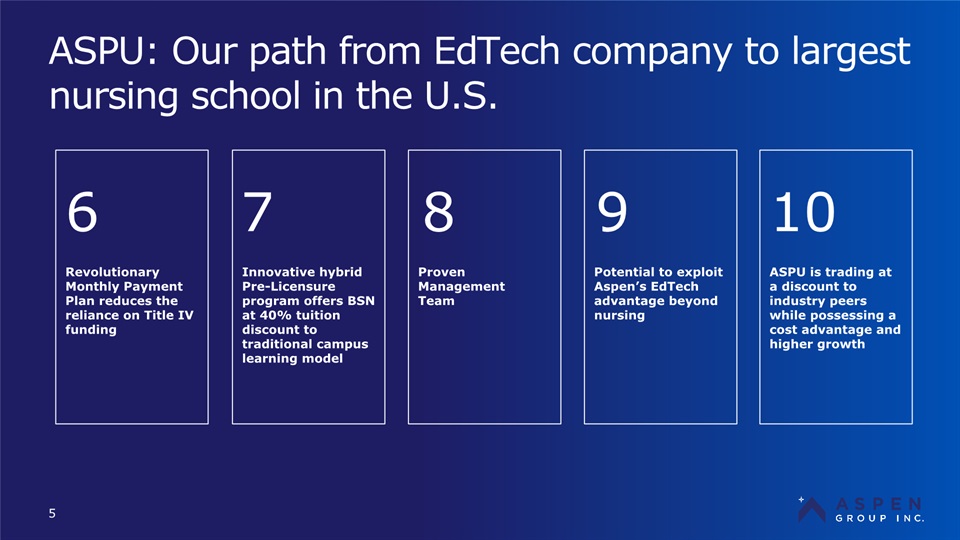
ASPU: Our path from EdTech company to largest nursing school in the U.S. 5 Revolutionary Monthly Payment Plan reduces the reliance on Title IV funding Proven Management Team Potential to exploit Aspen’s EdTech advantage beyond nursing Innovative hybrid Pre-Licensure program offers BSN at 40% tuition discount to traditional campus learning model ASPU is trading at a discount to industry peers while possessing a cost advantage and higher growth 6 7 8 9 10

Targeting the High GrowthNursing Profession 6
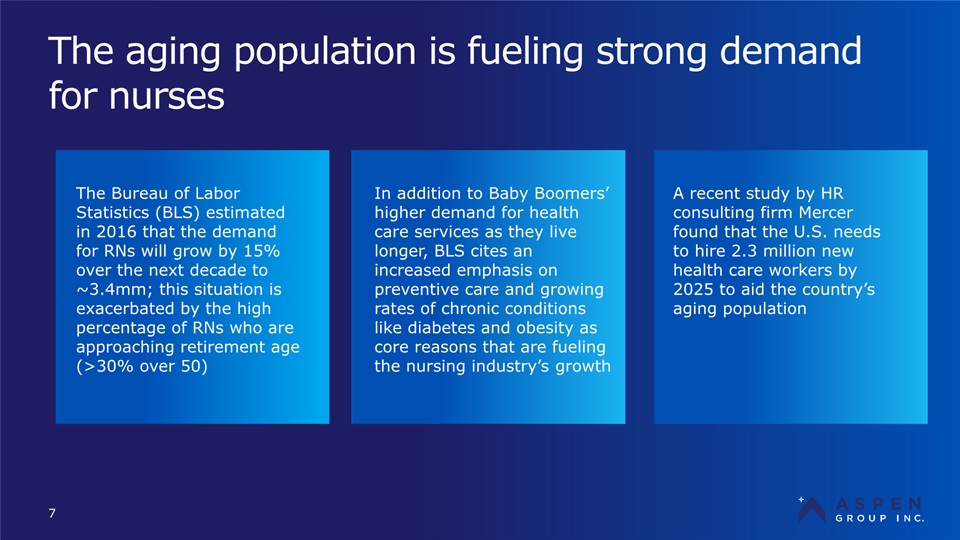
The aging population is fueling strong demand for nurses 7 The Bureau of Labor Statistics (BLS) estimated in 2016 that the demand for RNs will grow by 15% over the next decade to ~3.4mm; this situation is exacerbated by the high percentage of RNs who are approaching retirement age (>30% over 50) A recent study by HR consulting firm Mercer found that the U.S. needs to hire 2.3 million new health care workers by 2025 to aid the country’s aging population In addition to Baby Boomers’ higher demand for health care services as they live longer, BLS cites an increased emphasis on preventive care and growing rates of chronic conditions like diabetes and obesity as core reasons that are fueling the nursing industry’s growth
The aging population is fueling strong demand for nurses 8 ” “ –Yahoo Finance (August 2018) It may very well be the best time to be a nurse in the U.S. The job’s strong demand, relatively high pay, rewarding nature and low-risk of automation are all compelling incentives to pursue the career.
The aging population is fueling strong demand for nurses 9 ” “ –Martha Gimbel, Research Director at Indeed’s Hiring Lab If you look at the employment projections, health care occupations in general are going to be in high demand over the next decade. Nurses do appear to be really satisfied with their jobs.
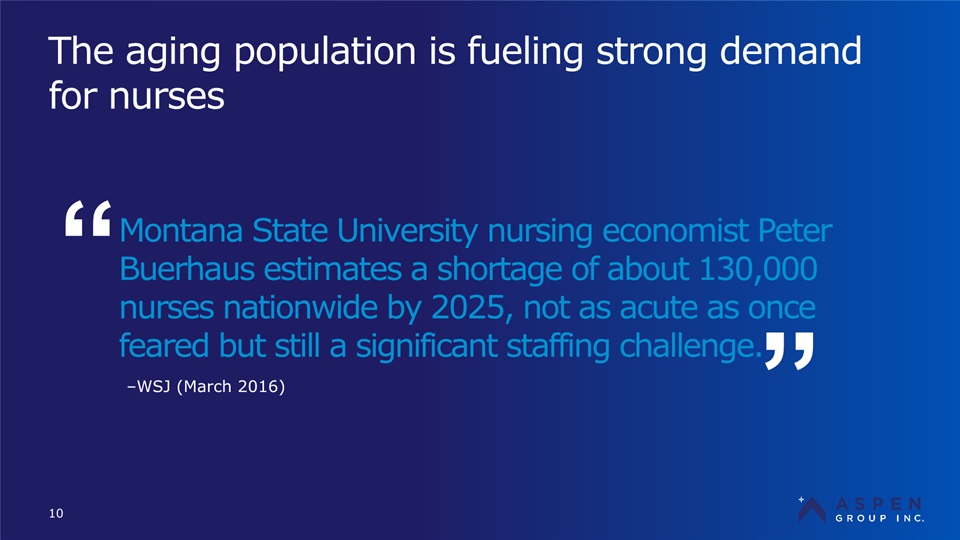
The aging population is fueling strong demand for nurses 10 ” “ –WSJ (March 2016) Montana State University nursing economist Peter Buerhaus estimates a shortage of about 130,000 nurses nationwide by 2025, not as acute as once feared but still a significant staffing challenge.

Highly educated nurses are in demand – with salaries to match 11 Further education in the nursing industry is highly regarded by employers and is seen as a reliable way for RNs to improve their career prospects The marketplace recognizes the value of additional education. ” “ –Peter Buerhaus, Jean Vallance Lecture in Nursing Innovation (March 2017)
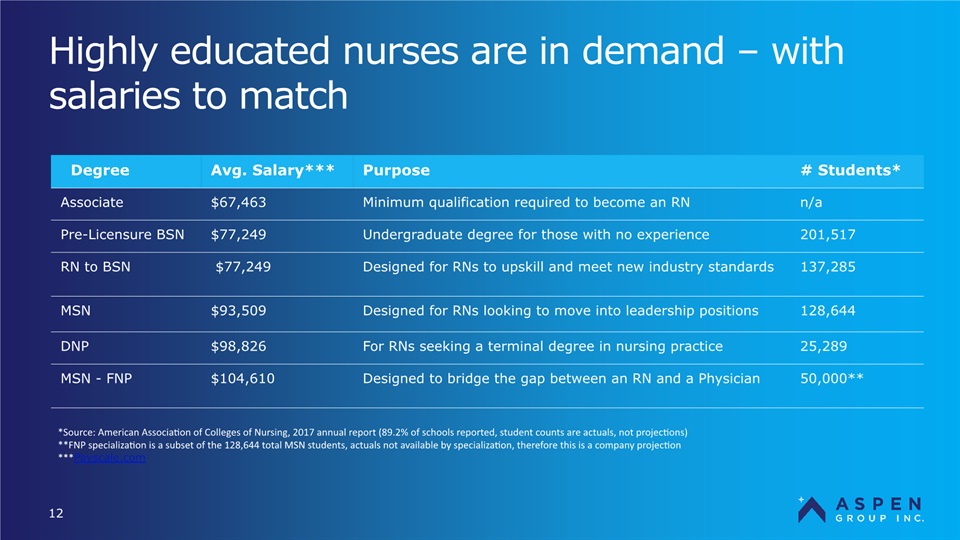
Highly educated nurses are in demand – with salaries to match 12 Degree Avg. Salary*** Purpose # Students* Associate $67,463 Minimum qualification required to become an RN n/a Pre-Licensure BSN $77,249 Undergraduate degree for those with no experience 201,517 RN to BSN $77,249 Designed for RNs to upskill and meet new industry standards 137,285 MSN $93,509 Designed for RNs looking to move into leadership positions 128,644 DNP $98,826 For RNs seeking a terminal degree in nursing practice 25,289 MSN - FNP $104,610 Designed to bridge the gap between an RN and a Physician 50,000** *Source: American Association of Colleges of Nursing, 2017 annual report (89.2% of schools reported, student counts are actuals, not projections)**FNP specialization is a subset of the 128,644 total MSN students, actuals not available by specialization, therefore this is a company projection***Payscale.com
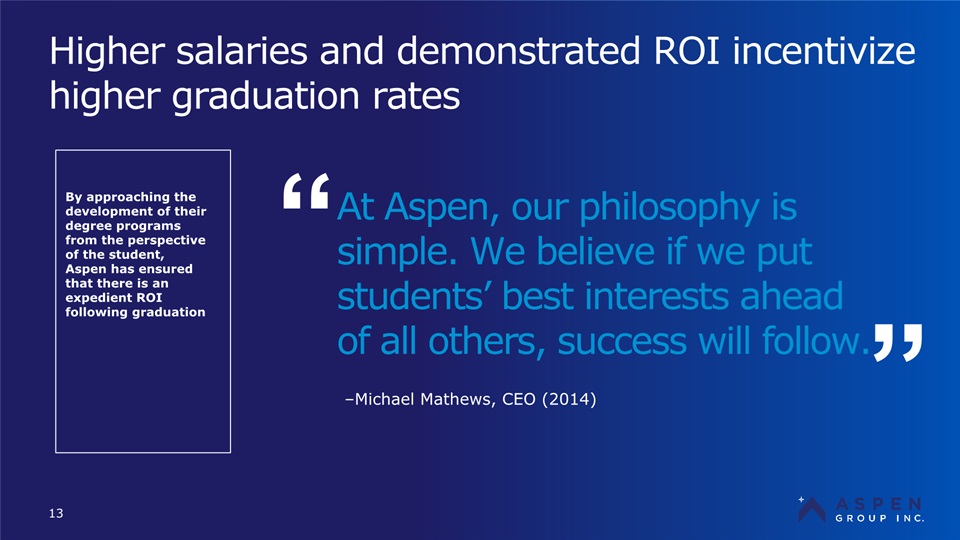
Higher salaries and demonstrated ROI incentivize higher graduation rates 13 By approaching the development of their degree programs from the perspective of the student, Aspen has ensured that there is an expedient ROI following graduation At Aspen, our philosophy is simple. We believe if we put students’ best interests ahead of all others, success will follow. ” “ –Michael Mathews, CEO (2014)

Higher salaries and demonstrated ROI incentivize higher graduation rates 14 Degree Program Tuition ($) Salary Uplift ($)* Payback (yrs) RN to BSN 9,750 9,786 1.00 MSN 11,700 16,260 0.72 DNP 18,900 21,577 0.88 MSN-FNP (USU) 27,000 27,361 0.98 These short payback periods demonstrate how by completing a low-cost degree program students can materially improve their financial position Source: Payscale.com
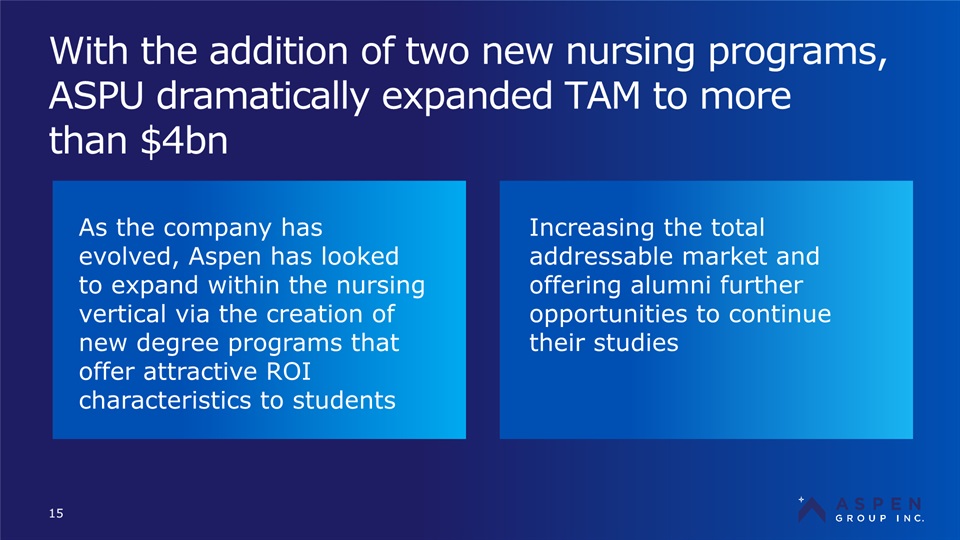
With the addition of two new nursing programs, ASPU dramatically expanded TAM to more than $4bn 15 As the company has evolved, Aspen has looked to expand within the nursing vertical via the creation of new degree programs that offer attractive ROI characteristics to students Increasing the total addressable market and offering alumni further opportunities to continue their studies
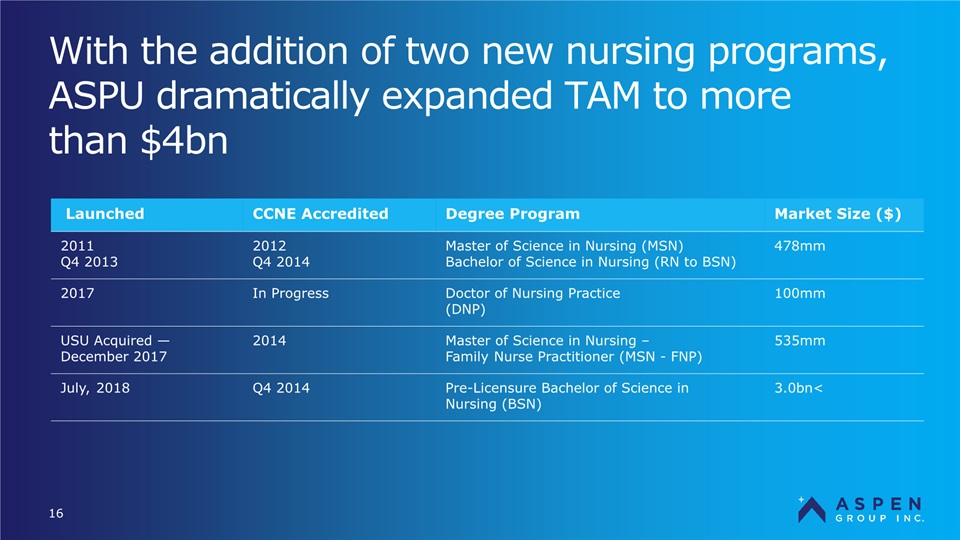
With the addition of two new nursing programs, ASPU dramatically expanded TAM to more than $4bn 16 Launched CCNE Accredited Degree Program Market Size ($) 2011 Q4 2013 2012 Q4 2014 Master of Science in Nursing (MSN)Bachelor of Science in Nursing (RN to BSN) 478mm 2017 In Progress Doctor of Nursing Practice(DNP) 100mm USU Acquired —December 2017 2014 Master of Science in Nursing – Family Nurse Practitioner (MSN - FNP) 535mm July, 2018 Q4 2014 Pre-Licensure Bachelor of Science in Nursing (BSN) >3.0bn
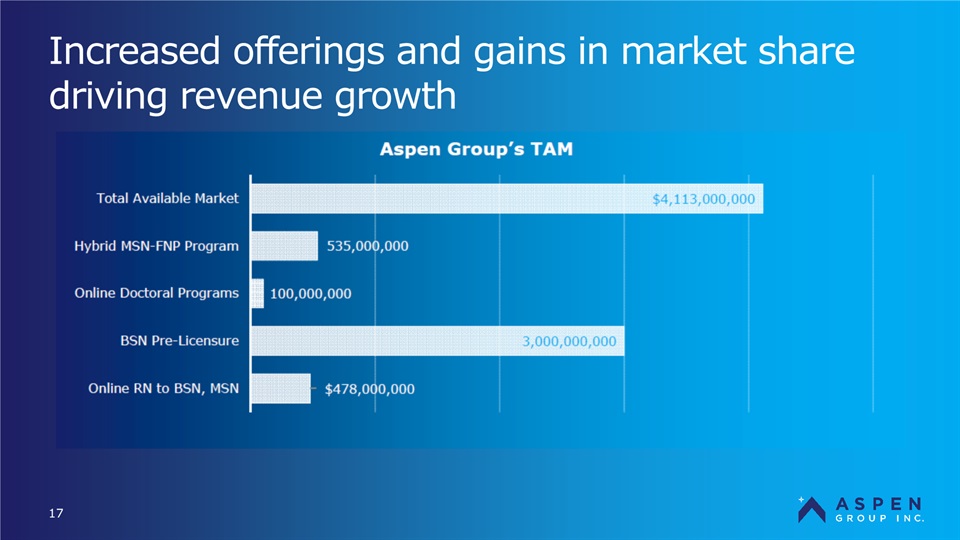
Increased offerings and gains in market share driving revenue growth 17
18 Disruptive Business ModelMaking College Affordable with Outstanding Student Outcomes
ASPU’s monthly payment plans are a revolutionary concept in for-profit education 19 The monthly payment plan “MPP” allows students to essentially pay as they go, reducing the reliance on Title IV government funding These plans have also proved popular with healthcare providers looking to upskill their employees Aspen’s low tuition fees are the key enabler of the MPP; when the cost of the degree is divided over the expected time to graduate, the monthly payment equates to an amount an RN could reasonably be expected to cover given their level of discretionary income
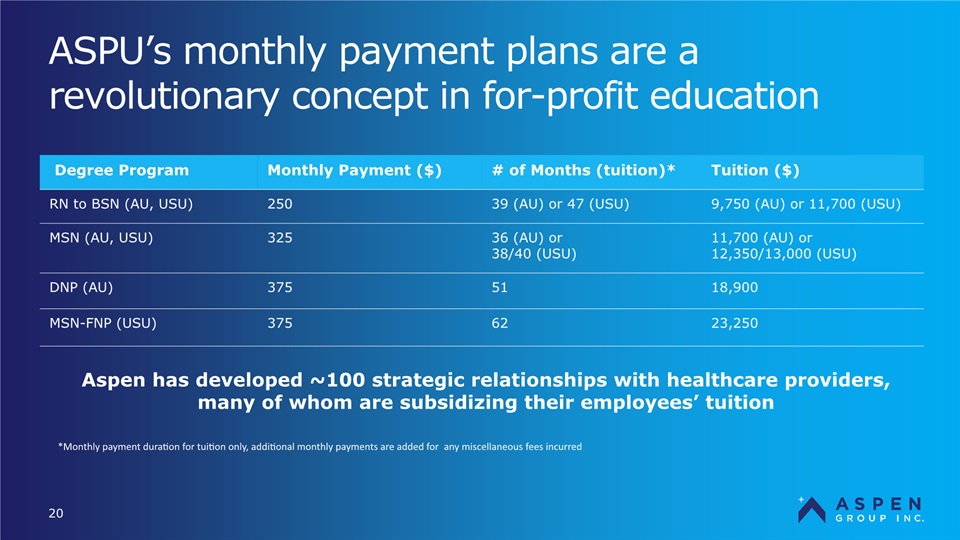
ASPU’s monthly payment plans are a revolutionary concept in for-profit education 20 Degree Program Monthly Payment ($) # of Months (tuition)* Tuition ($) RN to BSN (AU, USU) 250 39 (AU) or 47 (USU) 9,750 (AU) or 11,700 (USU) MSN (AU, USU) 325 36 (AU) or 38/40 (USU) 11,700 (AU) or 12,350/13,000 (USU) DNP (AU) 375 51 18,900 MSN-FNP (USU) 375 62 23,250 Aspen has developed ~100 strategic relationships with healthcare providers, many of whom are subsidizing their employees’ tuition *Monthly payment duration for tuition only, additional monthly payments are added for any miscellaneous fees incurred
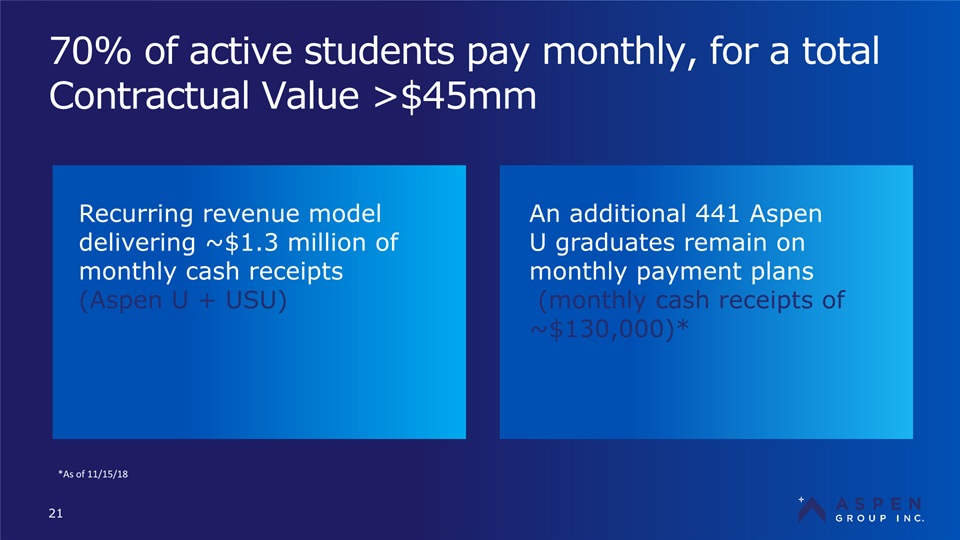
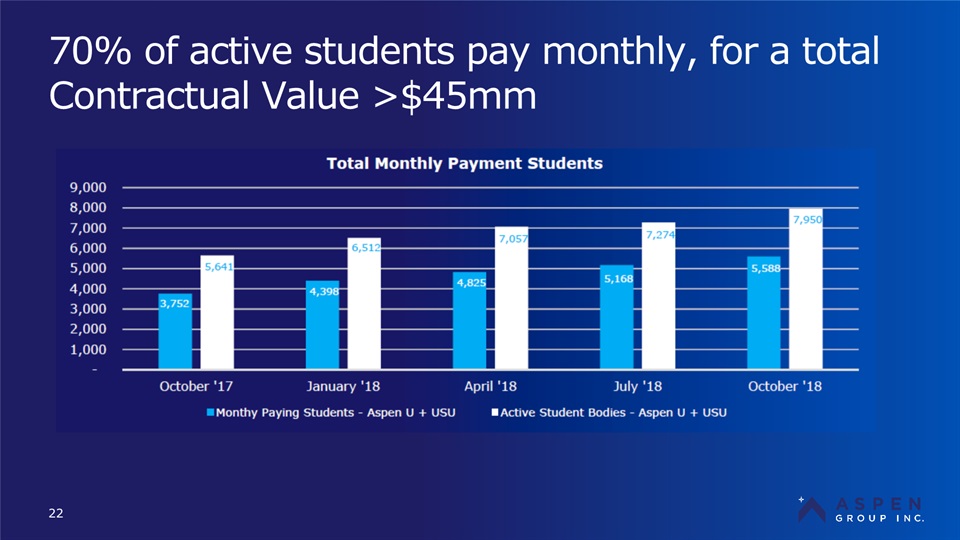
70% of active students pay monthly, for a total Contractual Value >$45mm 21 Recurring revenue model delivering ~$1.3 million of monthly cash receipts (Aspen U + USU) An additional 441 Aspen U graduates remain on monthly payment plans (monthly cash receipts of ~$130,000)* *As of 11/15/18
70% of active students pay monthly, for a total Contractual Value >$45mm 22
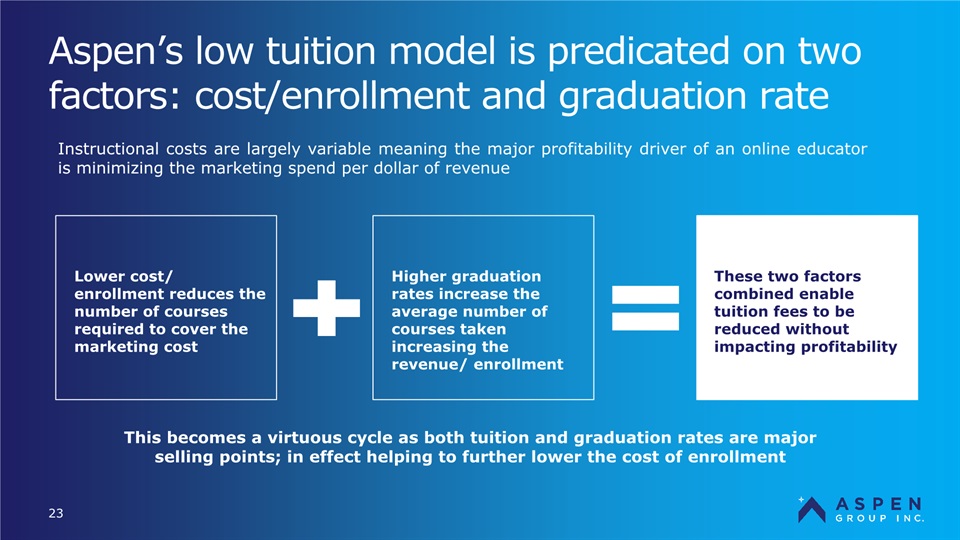
Aspen’s low tuition model is predicated on two factors: cost/enrollment and graduation rate 23 Lower cost/ enrollment reduces the number of courses required to cover the marketing cost Higher graduation rates increase the average number of courses taken increasing the revenue/ enrollment These two factors combined enable tuition fees to be reduced without impacting profitability This becomes a virtuous cycle as both tuition and graduation rates are major selling points; in effect helping to further lower the cost of enrollment Instructional costs are largely variable meaning the major profitability driver of an online educator is minimizing the marketing spend per dollar of revenue

Aspen’s low cost of enrollment is driven by its in-house internet advertising and CRM system 24 The durability of this competitive advantage can be seen in the industry-leading conversion rate The traditional marketing approach of an online educator has been to purchase leads from third party providers; whereas Aspen has differentiated itself from the outset by building an in-house internet advertising platform The CRM is then designed to take those leads and achieve best in class conversion rates via the use of an algorithm that recommends to enrollment advisors which potential students to engage with at the right time ~$150 Average Cost of Lead ASPEN ONLINE NURSING UNIT 12.5%* Conversion Rate $1,317* Cost/Enrollment *As of October 2018, six-month rolling averages
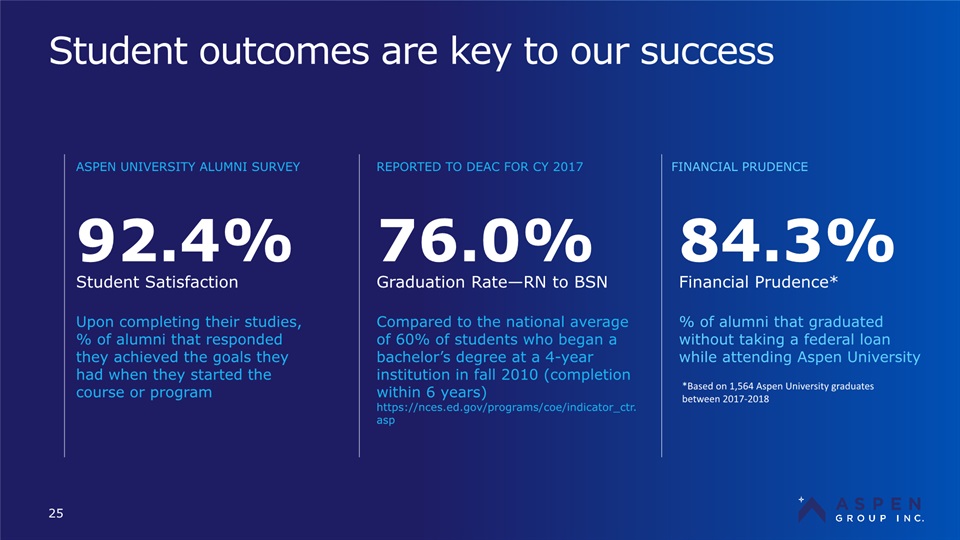
Student outcomes are key to our success 25 Upon completing their studies, % of alumni that responded they achieved the goals they had when they started the course or program 92.4% Student Satisfaction Compared to the national average of 60% of students who began a bachelor’s degree at a 4-year institution in fall 2010 (completion within 6 years) https://nces.ed.gov/programs/coe/indicator_ctr.asp 76.0% Graduation Rate—RN to BSN % of alumni that graduated without taking a federal loan while attending Aspen University 84.3% Financial Prudence* ASPEN UNIVERSITY ALUMNI SURVEY REPORTED TO DEAC FOR CY 2017 FINANCIAL PRUDENCE *Based on 1,564 Aspen University graduates between 2017-2018
EdTech Infrastucture Driving Industry Leading Operational Efficiency 26
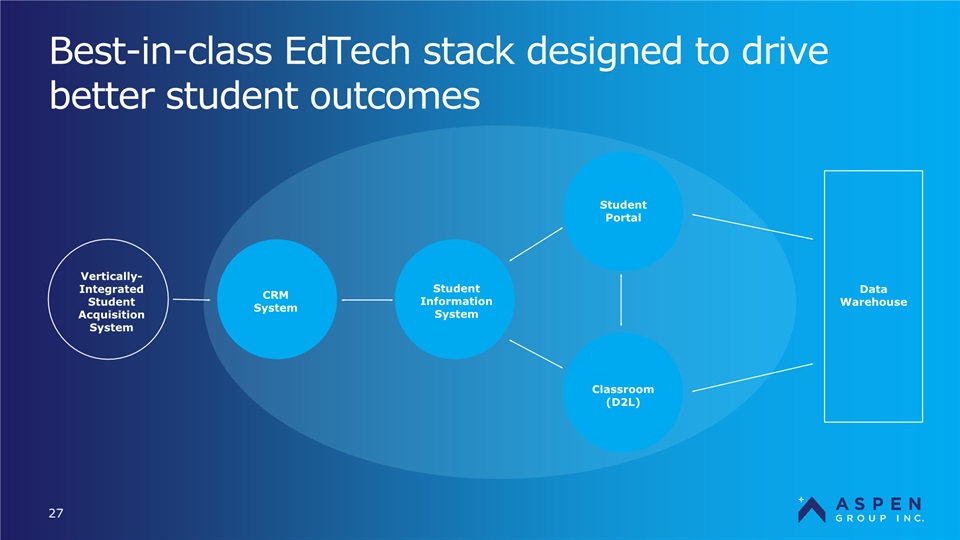
Best-in-class EdTech stack designed to drive better student outcomes 27 Vertically-Integrated Student Acquisition System Data Warehouse CRM System Student Information System Classroom (D2L) Student Portal
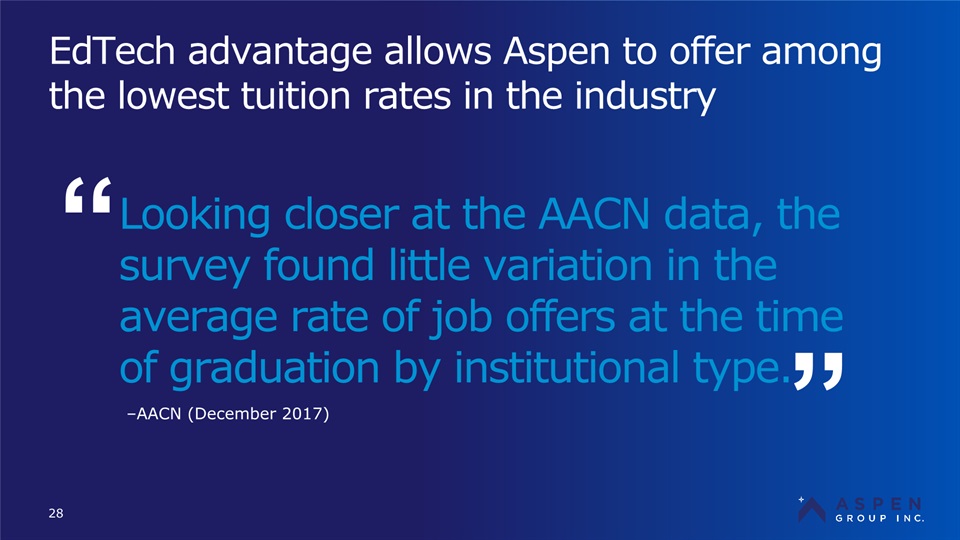
EdTech advantage allows Aspen to offer among the lowest tuition rates in the industry 28 ” “ –AACN (December 2017) Looking closer at the AACN data, the survey found little variation in the average rate of job offers at the time of graduation by institutional type.
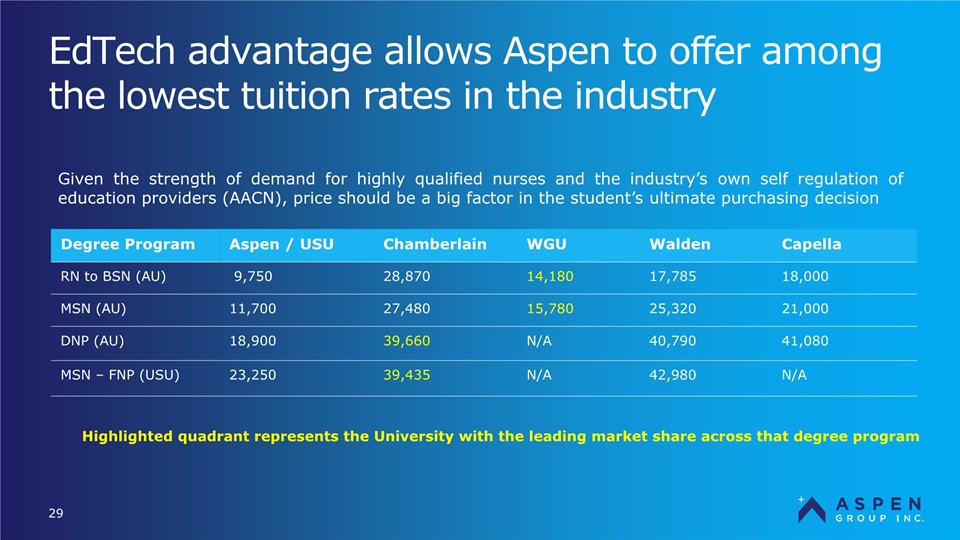
EdTech advantage allows Aspen to offer among the lowest tuition rates in the industry 29 Degree Program Aspen / USU Chamberlain WGU Walden Capella RN to BSN (AU) 9,750 28,870 14,180 17,785 18,000 MSN (AU) 11,700 27,480 15,780 25,320 21,000 DNP (AU) 18,900 39,660 N/A 40,790 41,080 MSN – FNP (USU) 23,250 39,435 N/A 42,980 N/A Highlighted quadrant represents the University with the leading market share across that degree program Given the strength of demand for highly qualified nurses and the industry’s own self regulation of education providers (AACN), price should be a big factor in the student’s ultimate purchasing decision

Aspen U quickly gained market share since BSN program achieved CCNE accreditation in FY’15 30 ASPU is well positioned to continue to increase share. The annual number of new students is estimated to be around 100,000 meaning in the TTMs Aspen’s run rate share of new students was ~4%. Aspen Group’s Market Share of the Post-Licensure Nursing Education Market
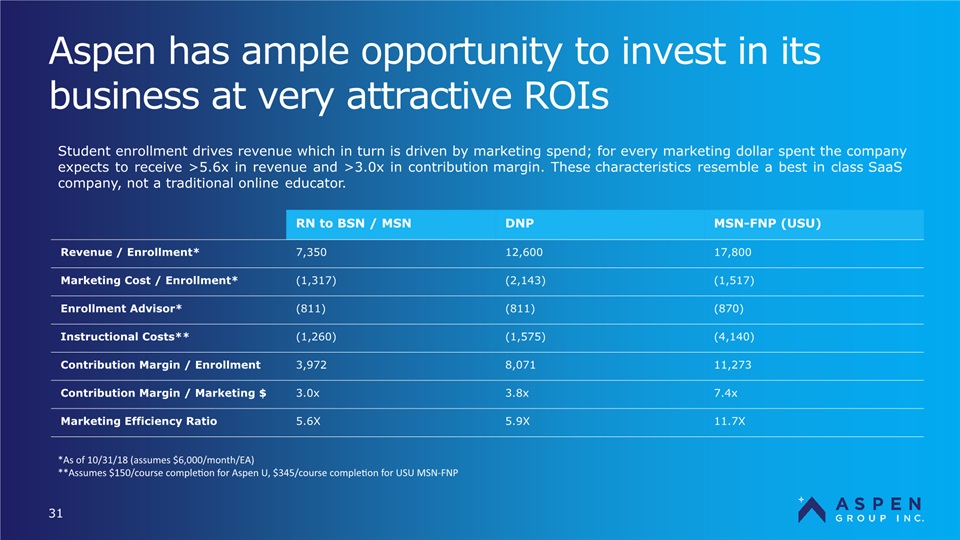
Aspen has ample opportunity to invest in its business at very attractive ROIs 31 RN to BSN / MSN DNP MSN-FNP (USU) Revenue / Enrollment* 7,350 12,600 17,800 Marketing Cost / Enrollment* (1,317) (2,143) (1,517) Enrollment Advisor* (811) (811) (870) Instructional Costs** (1,260) (1,575) (4,140) Contribution Margin / Enrollment 3,972 8,071 11,273 Contribution Margin / Marketing $ 3.0x 3.8x 7.4x Marketing Efficiency Ratio 5.6X 5.9X 11.7X *As of 10/31/18 (assumes $6,000/month/EA)**Assumes $150/course completion for Aspen U, $345/course completion for USU MSN-FNP Student enrollment drives revenue which in turn is driven by marketing spend; for every marketing dollar spent the company expects to receive >5.6x in revenue and >3.0x in contribution margin. These characteristics resemble a best in class SaaS company, not a traditional online educator.
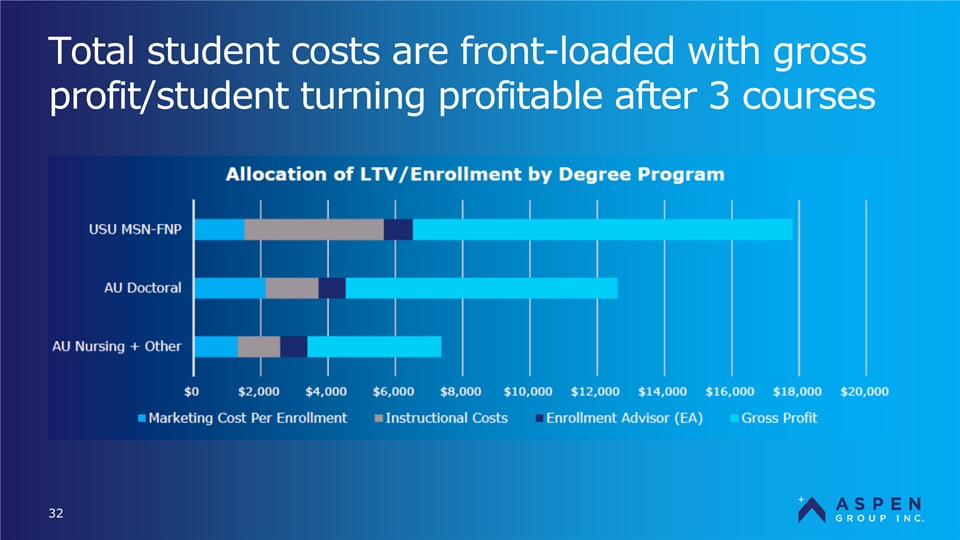
Total student costs are front-loaded with gross profit/student turning profitable after 3 courses 32
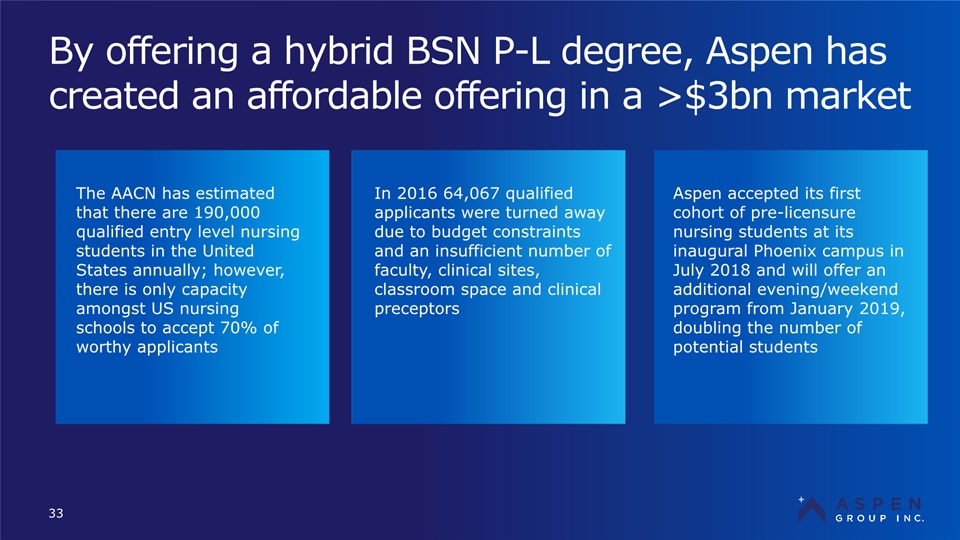
By offering a hybrid BSN P-L degree, Aspen has created an affordable offering in a >$3bn market 33 The AACN has estimated that there are 190,000 qualified entry level nursing students in the United States annually; however, there is only capacity amongst US nursing schools to accept 70% of worthy applicants Aspen accepted its first cohort of pre-licensure nursing students at its inaugural Phoenix campus in July 2018 and will offer an additional evening/weekend program from January 2019, doubling the number of potential students In 2016 64,067 qualified applicants were turned away due to budget constraints and an insufficient number of faculty, clinical sites, classroom space and clinical preceptors
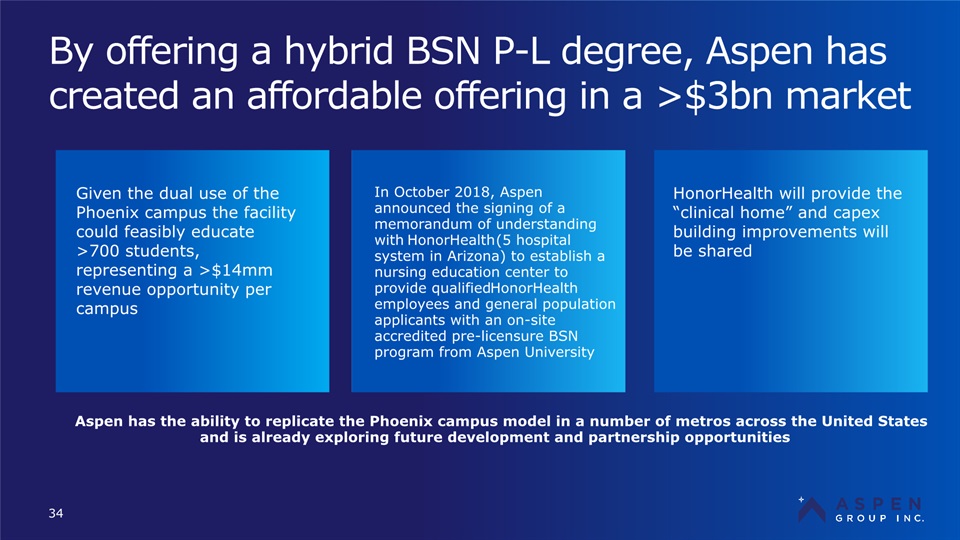
By offering a hybrid BSN P-L degree, Aspen has created an affordable offering in a >$3bn market 34 Given the dual use of the Phoenix campus the facility could feasibly educate >700 students, representing a >$14mm revenue opportunity per campus HonorHealth will provide the “clinical home” and capex building improvements will be shared In October 2018, Aspen announced the signing of a memorandum of understanding with HonorHealth (5 hospital system in Arizona) to establish a nursing education center to provide qualified HonorHealth employees and general population applicants with an on-site accredited pre-licensure BSN program from Aspen University Aspen has the ability to replicate the Phoenix campus model in a number of metros across the United States and is already exploring future development and partnership opportunities
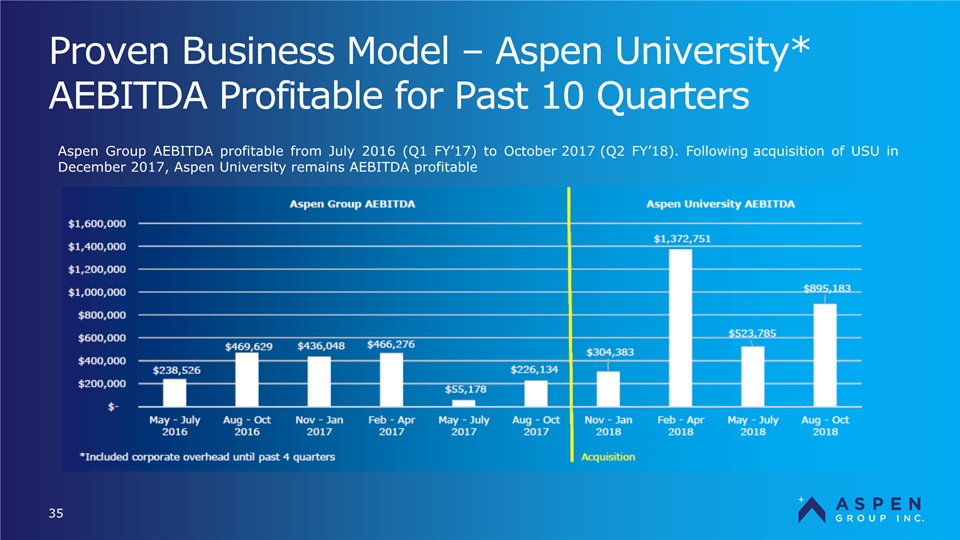
Proven Business Model – Aspen University* AEBITDA Profitable for Past 10 Quarters 35 Aspen Group AEBITDA profitable from July 2016 (Q1 FY’17) to October 2017 (Q2 FY’18). Following acquisition of USU in December 2017, Aspen University remains AEBITDA profitable
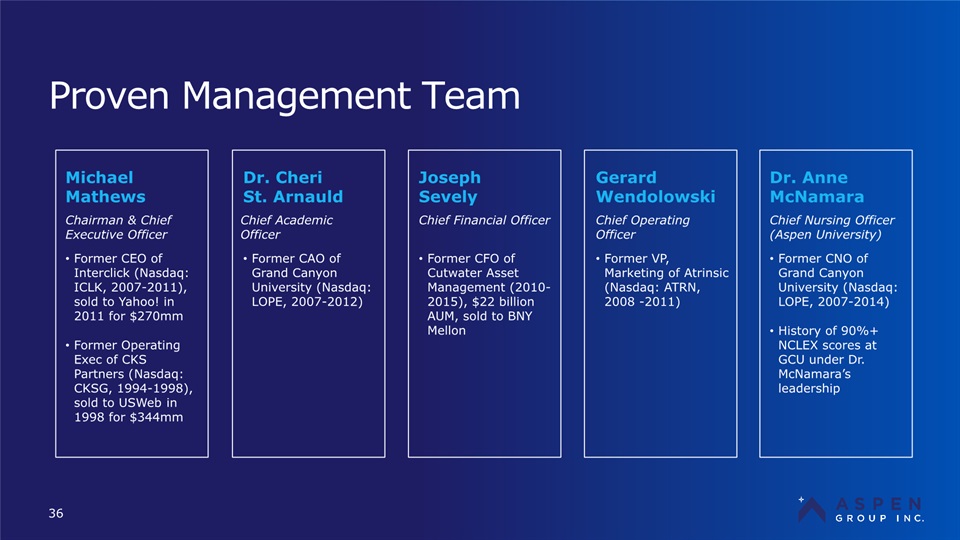
Proven Management Team 36 Former CEO of Interclick (Nasdaq: ICLK, 2007-2011), sold to Yahoo! in 2011 for $270mmFormer Operating Exec of CKS Partners (Nasdaq: CKSG, 1994-1998), sold to USWeb in 1998 for $344mm Michael Mathews Dr. Cheri St. Arnauld Chairman & Chief Executive Officer Former CAO of Grand Canyon University (Nasdaq: LOPE, 2007-2012) Chief Academic Officer Joseph Sevely Former CFO of Cutwater Asset Management (2010-2015), $22 billion AUM, sold to BNY Mellon Chief Financial Officer Gerard Wendolowski Former VP, Marketing of Atrinsic (Nasdaq: ATRN, 2008 -2011) Chief Operating Officer Dr. Anne McNamara Former CNO of Grand Canyon University (Nasdaq: LOPE, 2007-2014)History of 90%+ NCLEX scores at GCU under Dr. McNamara’s leadership Chief Nursing Officer (Aspen University)
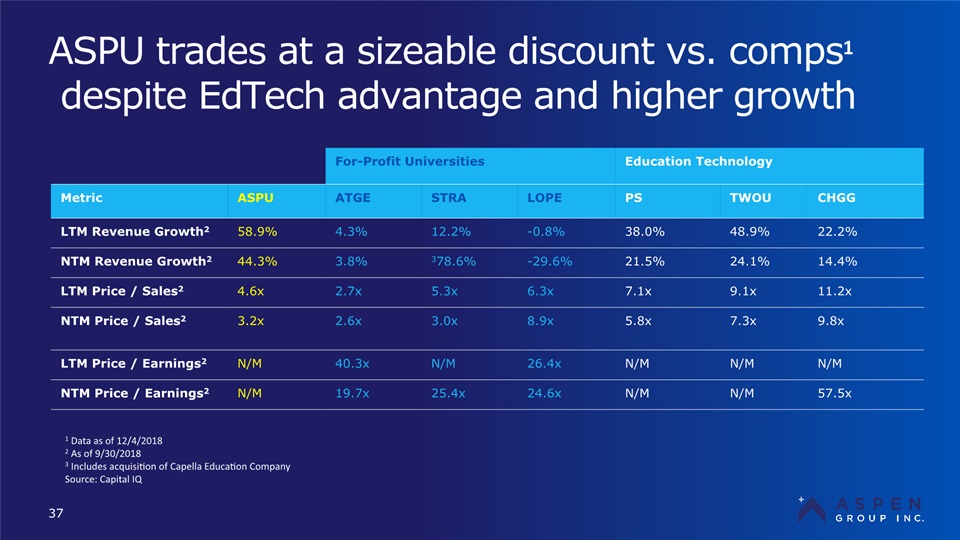
ASPU trades at a sizeable discount vs. comps1 despite EdTech advantage and higher growth 37 For-Profit Universities Education Technology Metric ASPU ATGE STRA LOPE PS TWOU CHGG LTM Revenue Growth2 58.9% 4.3% 12.2% -0.8% 38.0% 48.9% 22.2% NTM Revenue Growth2 44.3% 3.8% 78.6%3 -29.6% 21.5% 24.1% 14.4% LTM Price / Sales2 4.6x 2.7x 5.3x 6.3x 7.1x 9.1x 11.2x NTM Price / Sales2 3.2x 2.6x 3.0x 8.9x 5.8x 7.3x 9.8x LTM Price / Earnings2 N/M 40.3x N/M 26.4x N/M N/M N/M NTM Price / Earnings2 N/M 19.7x 25.4x 24.6x N/M N/M 57.5x 1 Data as of 12/4/20182 As of 9/30/20183 Includes acquisition of Capella Education CompanySource: Capital IQ
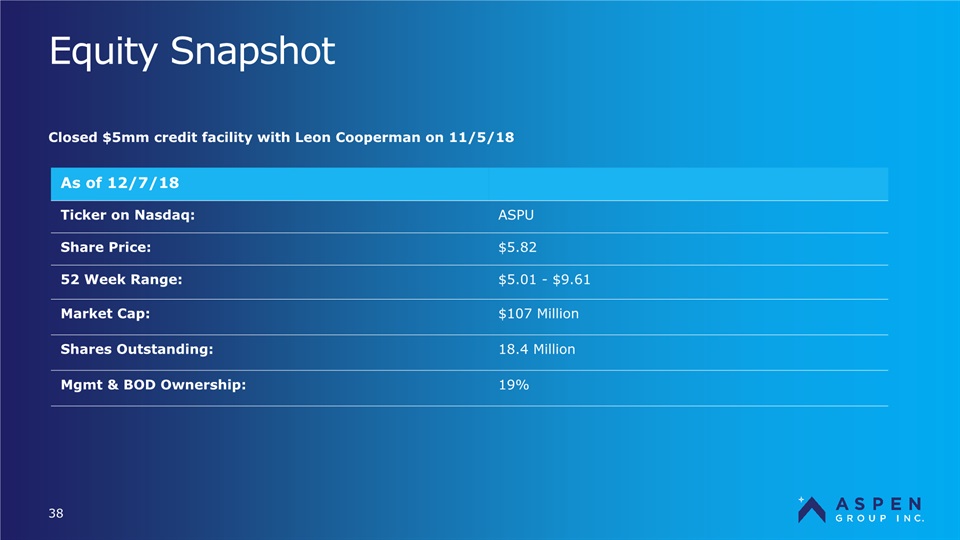
Equity Snapshot 38 As of 12/7/18 Ticker on Nasdaq: ASPU Share Price: $5.82 52 Week Range: $5.01 - $9.61 Market Cap: $107 Million Shares Outstanding: 18.4 Million Mgmt & BOD Ownership: 19% Closed $5mm credit facility with Leon Cooperman on 11/5/18
Appendix 39
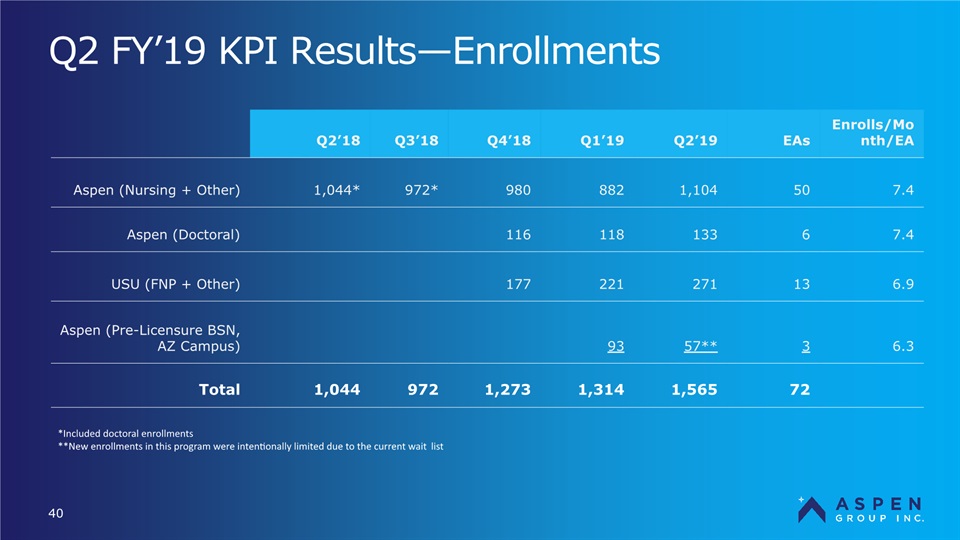
Q2 FY’19 KPI Results—Enrollments 40 Q2’18 Q3’18 Q4’18 Q1’19 Q2’19 EAs Enrolls/Month/EA Aspen (Nursing + Other) 1,044* 972* 980 882 1,104 50 7.4 Aspen (Doctoral) 116 118 133 6 7.4 USU (FNP + Other) 177 221 271 13 6.9 Aspen (Pre-Licensure BSN, AZ Campus) 93 57** 3 6.3 Total 1,044 972 1,273 1,314 1,565 72 *Included doctoral enrollments**New enrollments in this program were intentionally limited due to the current wait list
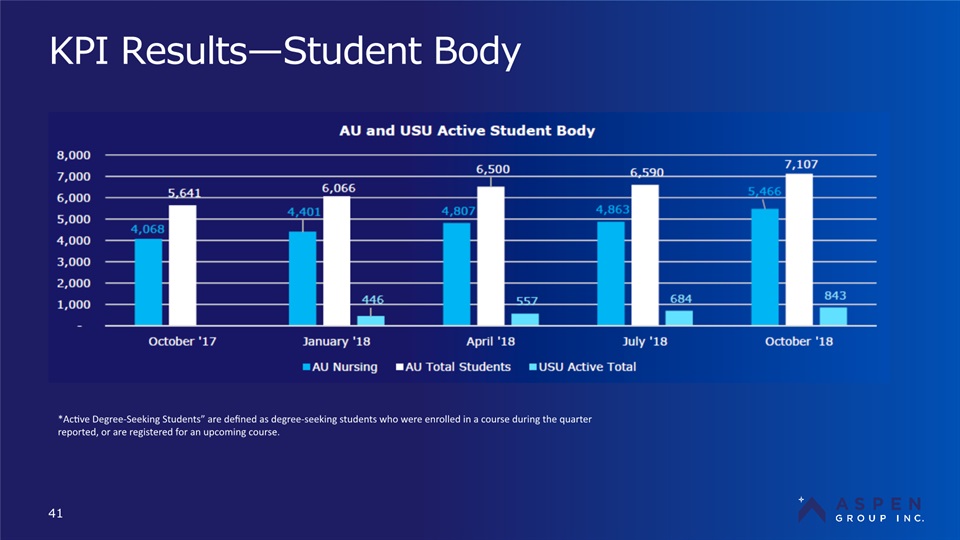
KPI Results—Student Body 41 *Active Degree-Seeking Students” are defined as degree-seeking students who were enrolled in a course during the quarter reported, or are registered for an upcoming course.
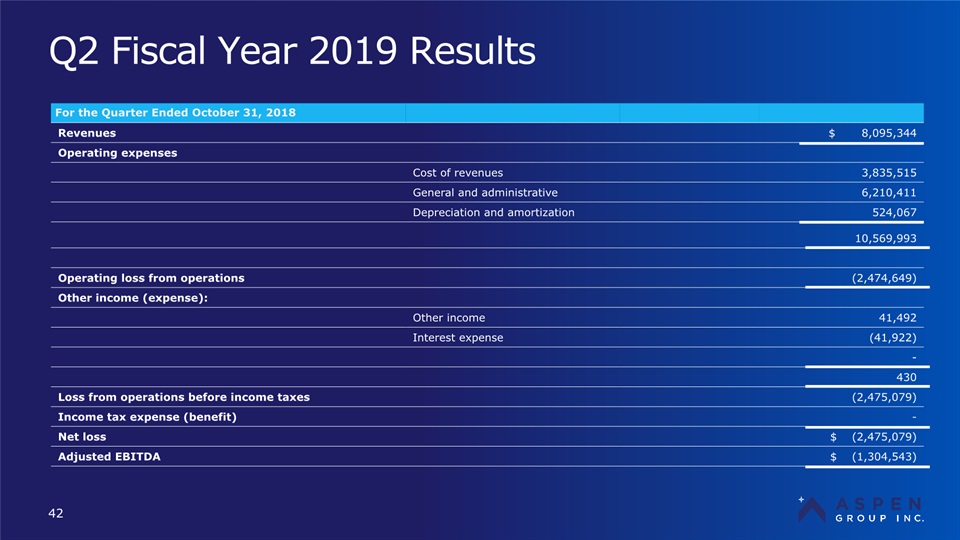
Q2 Fiscal Year 2019 Results 42 For the Quarter Ended October 31, 2018 Revenues $ 8,095,344 Operating expenses Cost of revenues 3,835,515 General and administrative 6,210,411 Depreciation and amortization 524,067 10,569,993 Operating loss from operations (2,474,649) Other income (expense): Other income 41,492 Interest expense (41,922) - 430 Loss from operations before income taxes (2,475,079) Income tax expense (benefit) - Net loss $ (2,475,079) Adjusted EBITDA $ (1,304,543)
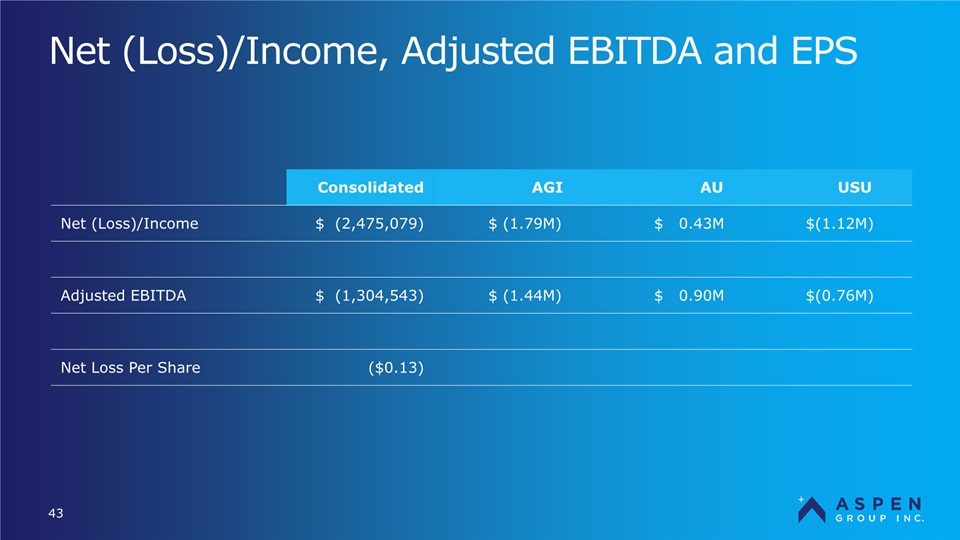
Net (Loss)/Income, Adjusted EBITDA and EPS 43 Consolidated AGI AU USU Net (Loss)/Income $ (2,475,079) $ (1.79M) $ 0.43M $(1.12M) Adjusted EBITDA $ (1,304,543) $ (1.44M) $ 0.90M $(0.76M) Net Loss Per Share ($0.13)
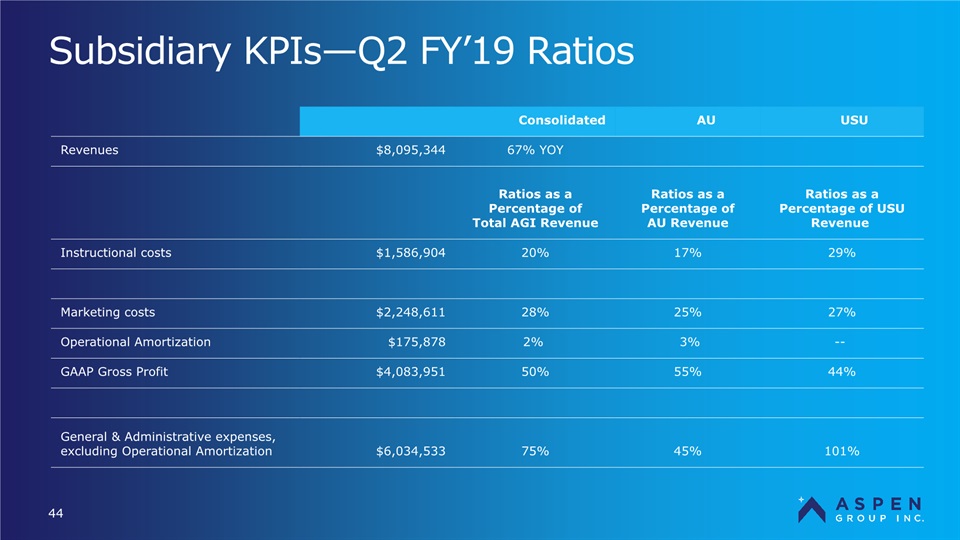
Subsidiary KPIs—Q2 FY’19 Ratios 44 Consolidated AU USU Revenues $8,095,344 67% YOY Ratios as a Percentage of Total AGI Revenue Ratios as a Percentage of AU Revenue Ratios as a Percentage of USU Revenue Instructional costs $1,586,904 20% 17% 29% Marketing costs $2,248,611 28% 25% 27% Operational Amortization $175,878 2% 3% -- GAAP Gross Profit $4,083,951 50% 55% 44% General & Administrative expenses, excluding Operational Amortization $6,034,533 75% 45% 101%
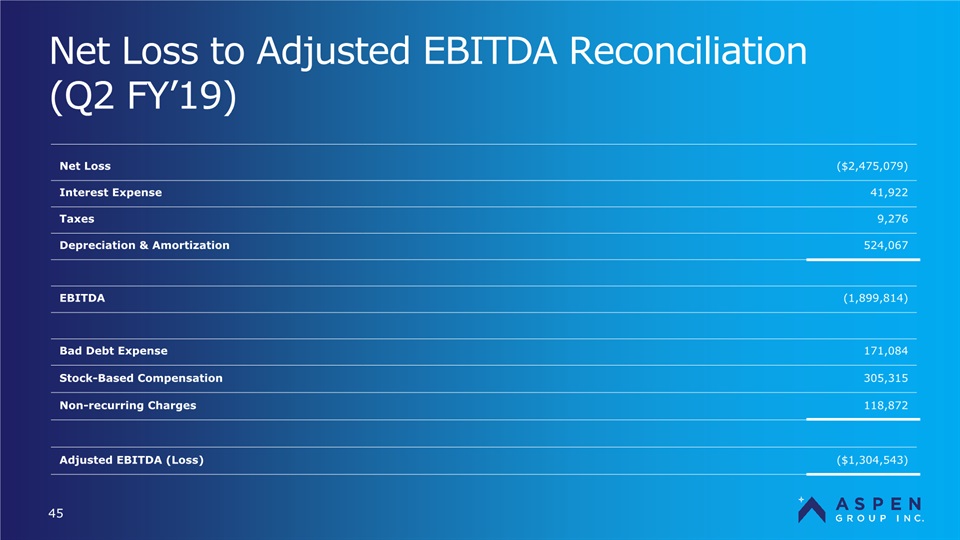
Net Loss to Adjusted EBITDA Reconciliation(Q2 FY’19) 45 Net Loss ($2,475,079) Interest Expense 41,922 Taxes 9,276 Depreciation & Amortization 524,067 EBITDA (1,899,814) Bad Debt Expense 171,084 Stock-Based Compensation 305,315 Non-recurring Charges 118,872 Adjusted EBITDA (Loss) ($1,304,543)