Attached files
| file | filename |
|---|---|
| EX-99.2 - EXHIBIT 99.2 - GENESCO INC | ex992earningsq3fy19.htm |
| EX-99.1 - EXHIBIT 99.1 - GENESCO INC | ex991earningsq3fy19.htm |
| 8-K - 8-K - GENESCO INC | a8-kearningsq3fy19.htm |

FY19 Third Quarter
Genesco Inc. FY19 Q3 Earnings Summary Results and Guidance December 6, 2018
Safe Harbor Statement Thispresentationcontainsforward-lookingstatements,includingthoseregardingtheperformanceoutlookfortheCompanyanditsindividualbusinesses(including,without limitation,sales,expenses,marginsandearnings)andallotherstatementsnotaddressingsolelyhistoricalfactsorpresentconditions.Actualresultscouldvarymaterially fromtheexpectationsreflectedinthesestatements.Anumberoffactorscouldcausedifferences. Theseincludeadjustmentstoestimatesandprojectionsreflectedin forward-lookingstatements,includingthelevelandtimingofpromotionalactivitynecessarytomaintaininventoriesatappropriatelevels;theCompany’sabilitytocomplete thesaleoftheLidsSportsGroupbusinessonacceptabletermsandthetimingofanysaletransaction;theimpositionoftariffsonimportedproductsorthedisallowanceof taxdeductionsonimportedproducts;disruptionsinproductsupplyordistribution;unfavorabletrendsinfuelcosts,foreignexchangerates,foreignlaborandmaterialcosts, andotherfactorsaffectingthecostofproducts;theeffectsoftheBritishdecisiontoexittheEuropeanUnion,includingpotentialeffectsonconsumerdemand,currency exchangerates,andthesupplychain;theeffectivenessoftheCompany'somnichannelinitiatives;costsassociatedwithchangesinminimumwageandovertime requirements;costassociatedwithwagepressureassociatedwithafullemploymentenvironmentintheU.S.andtheU.K.;weaknessintheconsumereconomyandretail industryfortheproductswesell;competitionintheCompany'smarkets,includingonlineandincludingcompetitionfromsomeoftheCompany’svendorsinboththe licensedsportsandbrandedfootwearmarkets;fashiontrends,includingthelackofnewfashiontrendsorproducts,thataffectthesalesorproductmarginsofthe Company'sretailproductofferings;weaknessinshoppingmalltrafficandchallengestotheviabilityofmallswheretheCompanyoperatesstores,relatedtoplannedclosings ofdepartmentstoresorotherfactorsandtheextentandpaceofgrowthofonlineshopping;theeffectsoftheimplementationoffederaltaxreformontheestimatedtax ratereflectedincertainforward-lookingstatements;changesinbuyingpatternsbysignificantwholesalecustomers;bankruptciesordeteriorationinfinancialconditionof significantwholesalecustomersortheinabilityofwholesalecustomersorconsumerstoobtaincredit;theCompany'sabilitytocontinuetocompleteandintegrate acquisitions,expanditsbusinessanddiversifyitsproductbase;changesinthetimingofholidaysorintheonsetofseasonalweatheraffectingperiod-to-periodsales comparisons;andtheperformanceofathleticteams,theparticipantsinmajorsportingeventssuchastheNBAfinals,SuperBowl,WorldSeries,andCollegeFootball Playoffs,developmentswithrespecttocertainindividualathletes,andothersports-relatedeventsorchangesthatmayaffectperiod-to-periodcomparisonsinthe Company'sLidsSportsGroupretailbusinesses.AdditionalfactorsthatcouldaffecttheCompany'sprospectsandcausedifferencesfromexpectationsincludetheabilityto build,open,staffandsupportadditionalretailstoresandtorenewleasesinexistingstoresandcontrolorloweroccupancycosts,andtoconductrequiredremodelingor refurbishmentonscheduleandatexpectedexpenselevels;deteriorationintheperformanceofindividualbusinessesoroftheCompany'smarketvaluerelativetoitsbook value,resultinginimpairmentsoffixedassetsorintangibleassetsorotheradversefinancialconsequencesandthetimingandamountofsuchimpairmentsorother consequences;unexpectedchangestothemarketfortheCompany'ssharesorfortheretailsectoringeneral;costsandreputationalharmasaresultofdisruptionsinthe Company’sbusinessorinformationtechnologysystemseitherbysecuritybreachesandincidentsorbypotentialproblemsassociatedwiththeimplementationofnewor upgradedsystems;andthecostandoutcomeoflitigation,investigationsandenvironmentalmattersinvolvingtheCompany.Additionalfactorsarecitedinthe"Risk Factors,""LegalProceedings"and"Management'sDiscussionandAnalysisofFinancialConditionandResultsofOperations"sectionsof,andelsewherein,ourSECfilings, copiesofwhichmaybeobtainedfromtheSECwebsite, www.sec.gov,orbycontactingtheinvestorrelationsdepartmentofGenescoviaourwebsite,www.genesco.com. ManyofthefactorsthatwilldeterminetheoutcomeofthesubjectmatterofthisreleasearebeyondGenesco'sabilitytocontrolorpredict.Genescoundertakesno obligationtoreleasepubliclytheresultsofanyrevisionstotheseforward-lookingstatementsthatmaybemadetoreflecteventsorcircumstancesafterthedatehereofor toreflecttheoccurrenceofunanticipatedevents.Forward-lookingstatementsreflecttheexpectationsoftheCompanyatthetimetheyaremade.TheCompanydisclaims anyobligationtoupdatesuchstatements.
Non-GAAP Financial Measures TheCompanyreportsconsolidatedfinancialresultsinaccordancewithgenerally acceptedaccountingprinciples(“GAAP”).However,tosupplementtheseconsolidated financialresultstheCompany’spresentationincludescertainnon-GAAPfinancial measuressuchasearningsandearningspershare.Thissupplementalinformation shouldnotbeconsideredinisolationasasubstituteforrelatedGAAPmeasures.The Companybelievesthatdisclosureofearningsandearningspersharefromcontinuing operationsadjustedfortheitemsnotreflectedinthepreviouslyannouncedexpectations willbemeaningfultoinvestors,especiallyinlightoftheimpactofsuchitemsonthe results.Reconciliationsofthenon-GAAPsupplementalinformationtothecomparable GAAPmeasurescanbefoundintheAppendix.
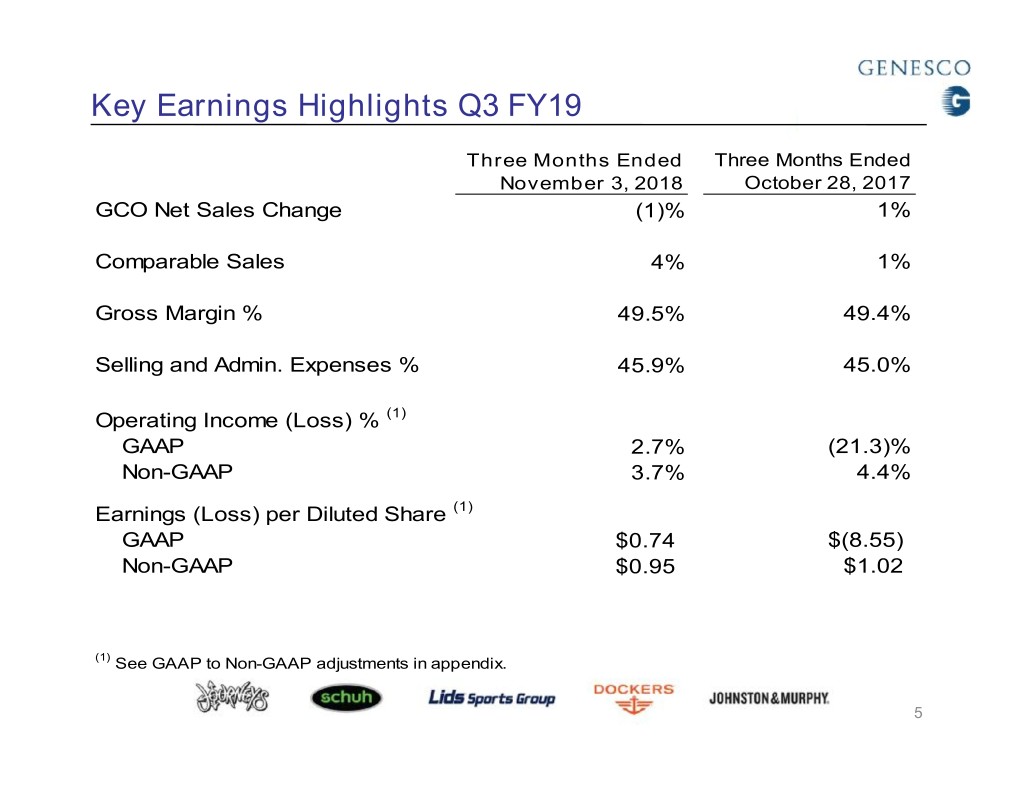
Key Earnings Highlights Q3 FY19 Three Months Ended Three Months Ended November 3, 2018 October 28, 2017 GCO Net Sales Change (1)% 1% Comparable Sales 4% 1% Gross Margin % 49.5% 49.4% Selling and Admin. Expenses % 45.9% 45.0% Operating Income (Loss) % (1) GAAP 2.7% (21.3)% Non-GAAP 3.7% 4.4% Earnings (Loss) per Diluted Share (1) GAAP $0.74 $(8.55) Non-GAAP $0.95 $1.02 (1) See GAAP to Non-GAAP adjustments in appendix. 5
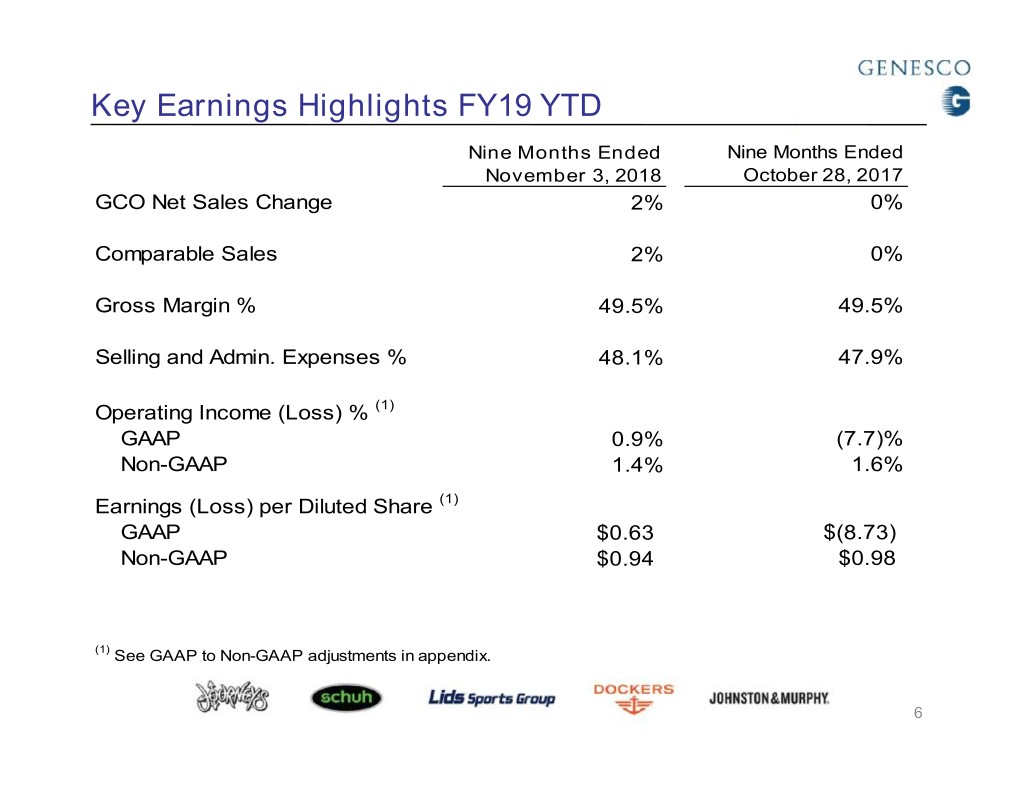
Key Earnings Highlights FY19 YTD Nine Months Ended Nine Months Ended November 3, 2018 October 28, 2017 GCO Net Sales Change 2% 0% Comparable Sales 2% 0% Gross Margin % 49.5% 49.5% Selling and Admin. Expenses % 48.1% 47.9% Operating Income (Loss) % (1) GAAP 0.9% (7.7)% Non-GAAP 1.4% 1.6% Earnings (Loss) per Diluted Share (1) GAAP $0.63 $(8.73) Non-GAAP $0.94 $0.98 (1) See GAAP to Non-GAAP adjustments in appendix. 6
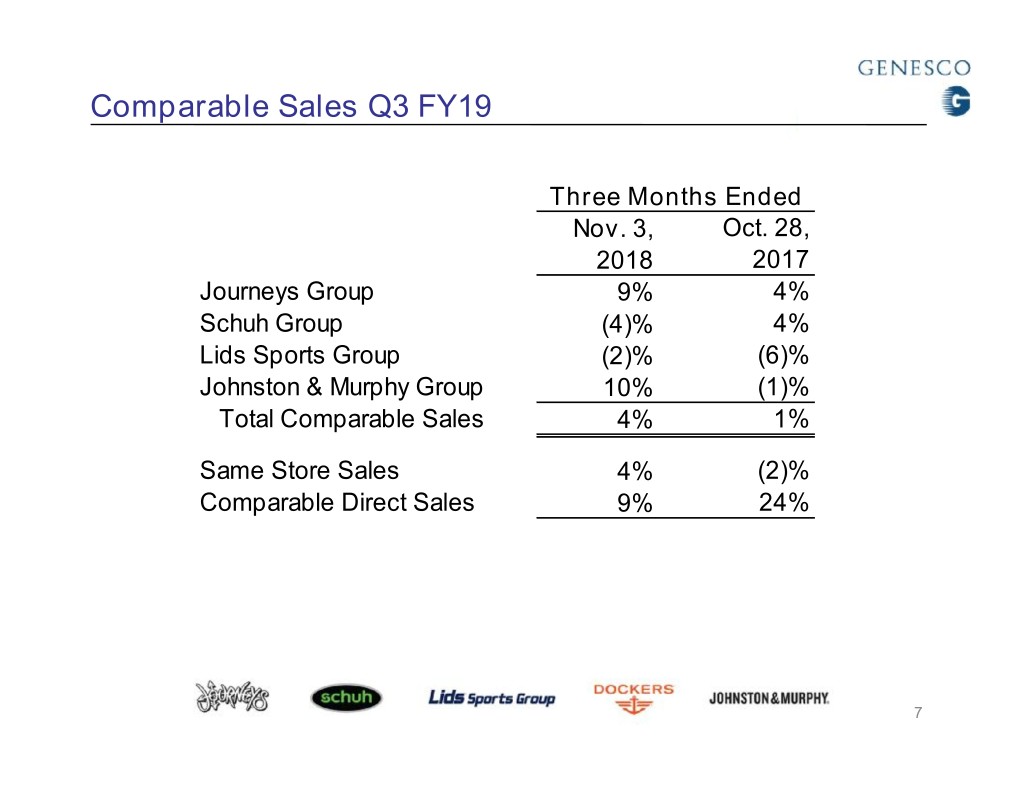
Comparable Sales Q3 FY19 Three Months Ended Nov. 3, Oct. 28, 2018 2017 Journeys Group 9% 4% Schuh Group (4)% 4% Lids Sports Group (2)% (6)% Johnston & Murphy Group 10% (1)% Total Comparable Sales 4% 1% Same Store Sales 4% (2)% Comparable Direct Sales 9% 24% 7
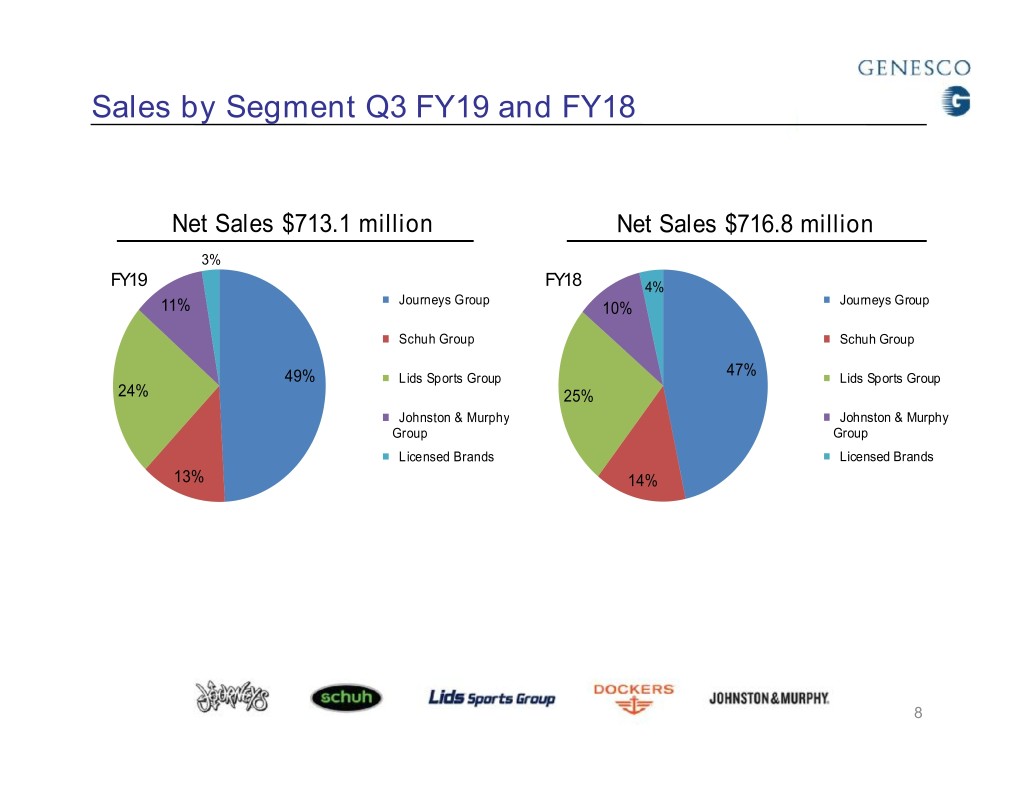
Sales by Segment Q3 FY19 and FY18 Net Sales $713.1 million Net Sales $716.8 million 3% FY19 FY18 4% Journeys Group 11% 10% Journeys Group Schuh Group Schuh Group 47% 49% Lids Sports Group Lids Sports Group 24% 25% Johnston & Murphy Johnston & Murphy Group Group Licensed Brands Licensed Brands 13% 14% 8
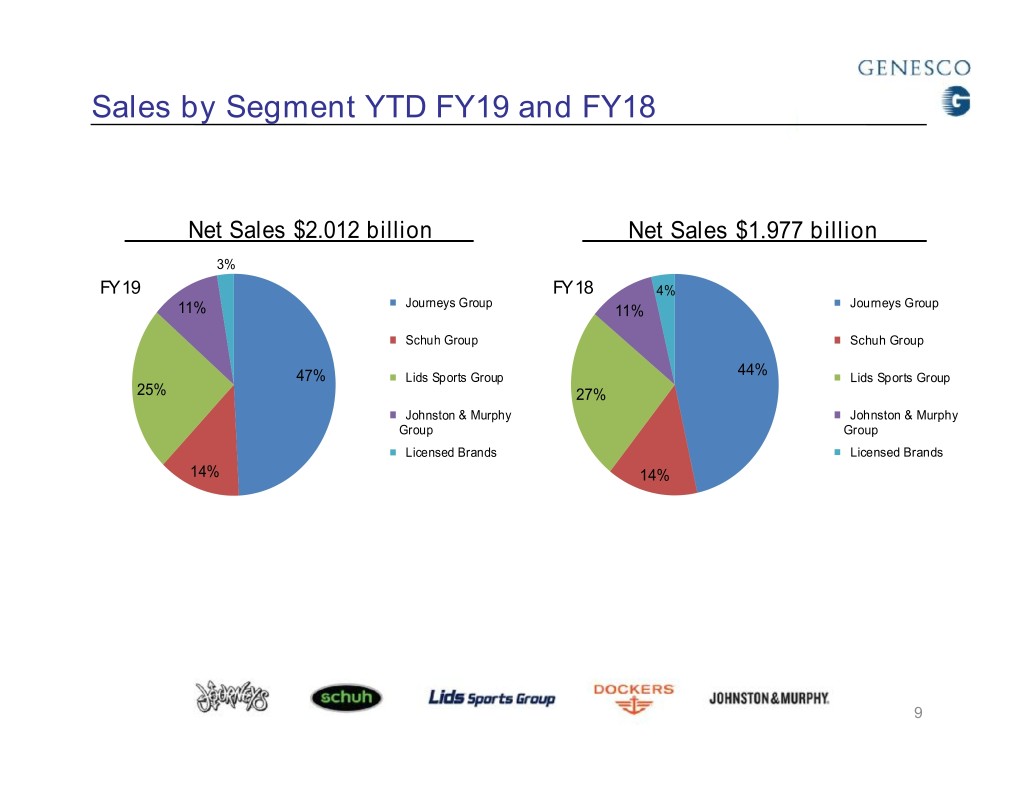
Sales by Segment YTD FY19 and FY18 Net Sales $2.012 billion Net Sales $1.977 billion 3% FY 19 FY 18 4% Journeys Group 11% 11% Journeys Group Schuh Group Schuh Group 44% 47% Lids Sports Group Lids Sports Group 25% 27% Johnston & Murphy Johnston & Murphy Group Group Licensed Brands Licensed Brands 14% 14% 9
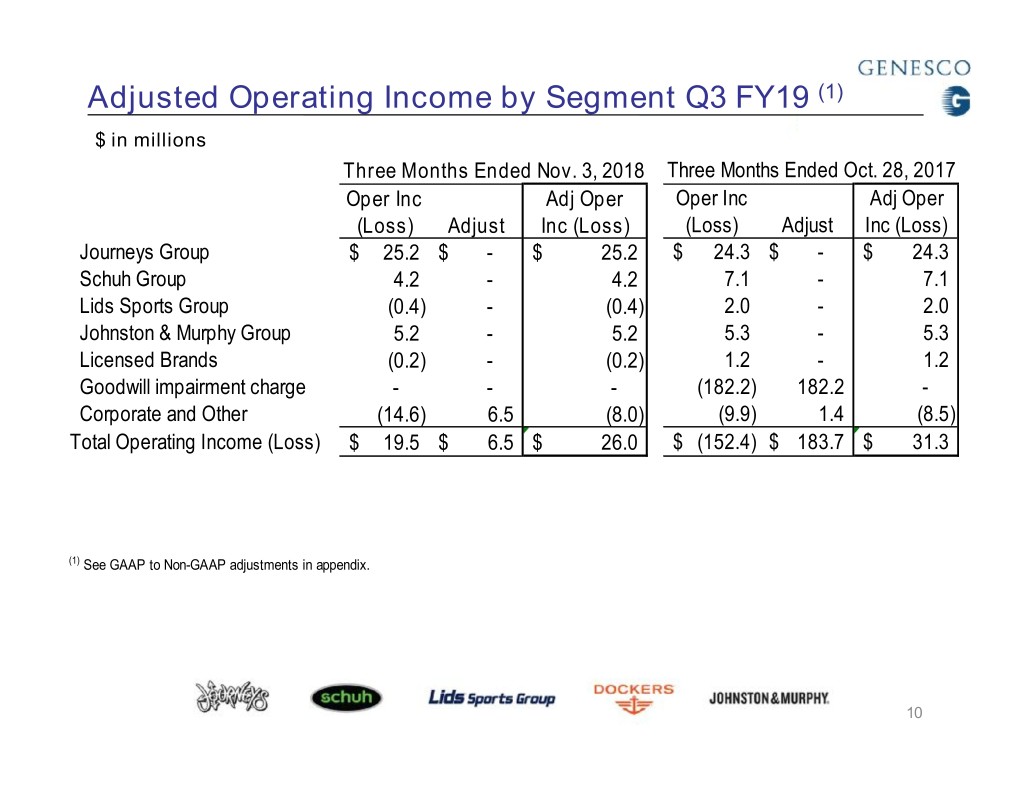
Adjusted Operating Income by Segment Q3 FY19 (1) $ in millions Three Months Ended Nov. 3, 2018 Three Months Ended Oct. 28, 2017 Oper Inc Adj Oper Oper Inc Adj Oper (Loss) Adjust Inc (Loss) (Loss) Adjust Inc (Loss) Journeys Group $ 25.2 $ - $ 25.2 $ 24.3 $ - $ 24.3 Schuh Group 4.2 - 4.2 7.1 - 7.1 Lids Sports Group (0.4) - (0.4) 2.0 - 2.0 Johnston & Murphy Group 5.2 - 5.2 5.3 - 5.3 Licensed Brands (0.2) - (0.2) 1.2 - 1.2 Goodwill impairment charge - - - (182.2) 182.2 - Corporate and Other (14.6) 6.5 (8.0) (9.9) 1.4 (8.5) Total Operating Income (Loss) $ 19.5 $ 6.5 $ 26.0 $ (152.4) $ 183.7 $ 31.3 (1) See GAAP to Non-GAAP adjustments in appendix. 10
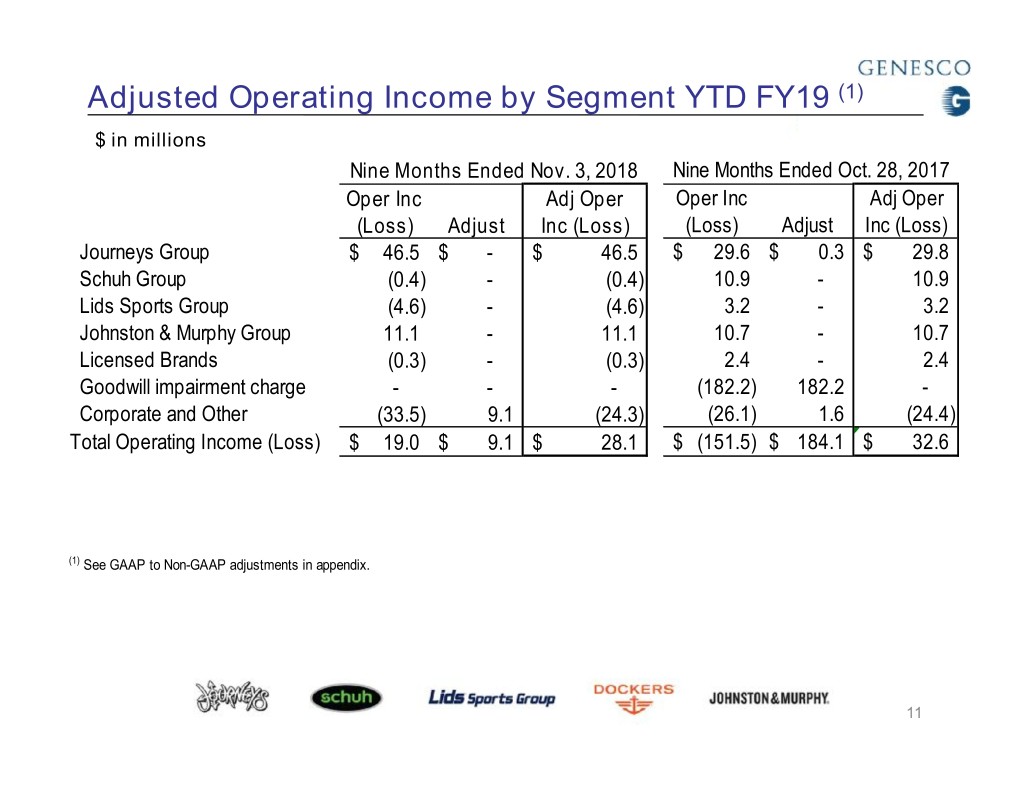
Adjusted Operating Income by Segment YTD FY19 (1) $ in millions Nine Months Ended Nov. 3, 2018 Nine Months Ended Oct. 28, 2017 Oper Inc Adj Oper Oper Inc Adj Oper (Loss) Adjust Inc (Loss) (Loss) Adjust Inc (Loss) Journeys Group $ 46.5 $ - $ 46.5 $ 29.6 $ 0.3 $ 29.8 Schuh Group (0.4) - (0.4) 10.9 - 10.9 Lids Sports Group (4.6) - (4.6) 3.2 - 3.2 Johnston & Murphy Group 11.1 - 11.1 10.7 - 10.7 Licensed Brands (0.3) - (0.3) 2.4 - 2.4 Goodwill impairment charge - - - (182.2) 182.2 - Corporate and Other (33.5) 9.1 (24.3) (26.1) 1.6 (24.4) Total Operating Income (Loss) $ 19.0 $ 9.1 $ 28.1 $ (151.5) $ 184.1 $ 32.6 (1) See GAAP to Non-GAAP adjustments in appendix. 11
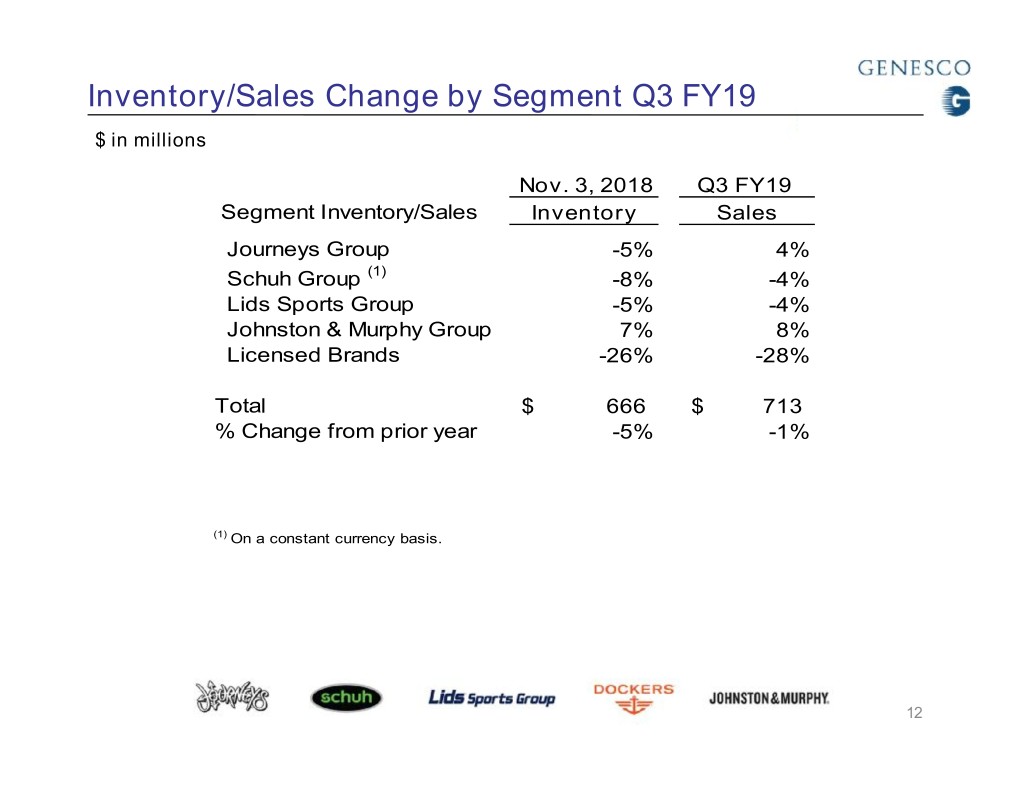
Inventory/Sales Change by Segment Q3 FY19 $ in millions Nov. 3, 2018 Q3 FY19 Segment Inventory/Sales Inventory Sales Journeys Group -5% 4% Schuh Group (1) -8% -4% Lids Sports Group -5% -4% Johnston & Murphy Group 7% 8% Licensed Brands -26% -28% Total $ 666 $ 713 % Change from prior year -5% -1% (1) On a constant currency basis. 12
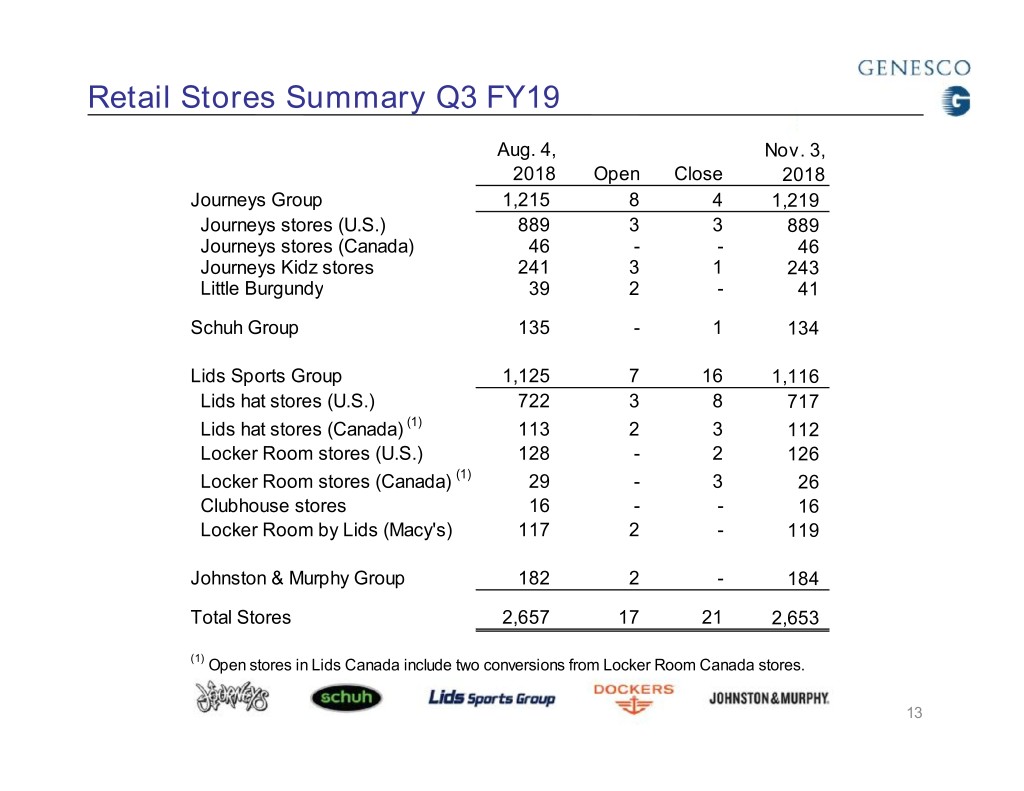
Retail Stores Summary Q3 FY19 Aug. 4, Nov. 3, 2018 Open Close 2018 Journeys Group 1,215 8 4 1,219 Journeys stores (U.S.) 889 3 3 889 Journeys stores (Canada) 46 - - 46 Journeys Kidz stores 241 3 1 243 Little Burgundy 39 2 - 41 Schuh Group 135 - 1 134 Lids Sports Group 1,125 7 16 1,116 Lids hat stores (U.S.) 722 3 8 717 Lids hat stores (Canada) (1) 113 2 3 112 Locker Room stores (U.S.) 128 - 2 126 Locker Room stores (Canada) (1) 29 - 3 26 Clubhouse stores 16 - - 16 Locker Room by Lids (Macy's) 117 2 - 119 Johnston & Murphy Group 182 2 - 184 Total Stores 2,657 17 21 2,653 (1) Open stores in Lids Canada include two conversions from Locker Room Canada stores. 13
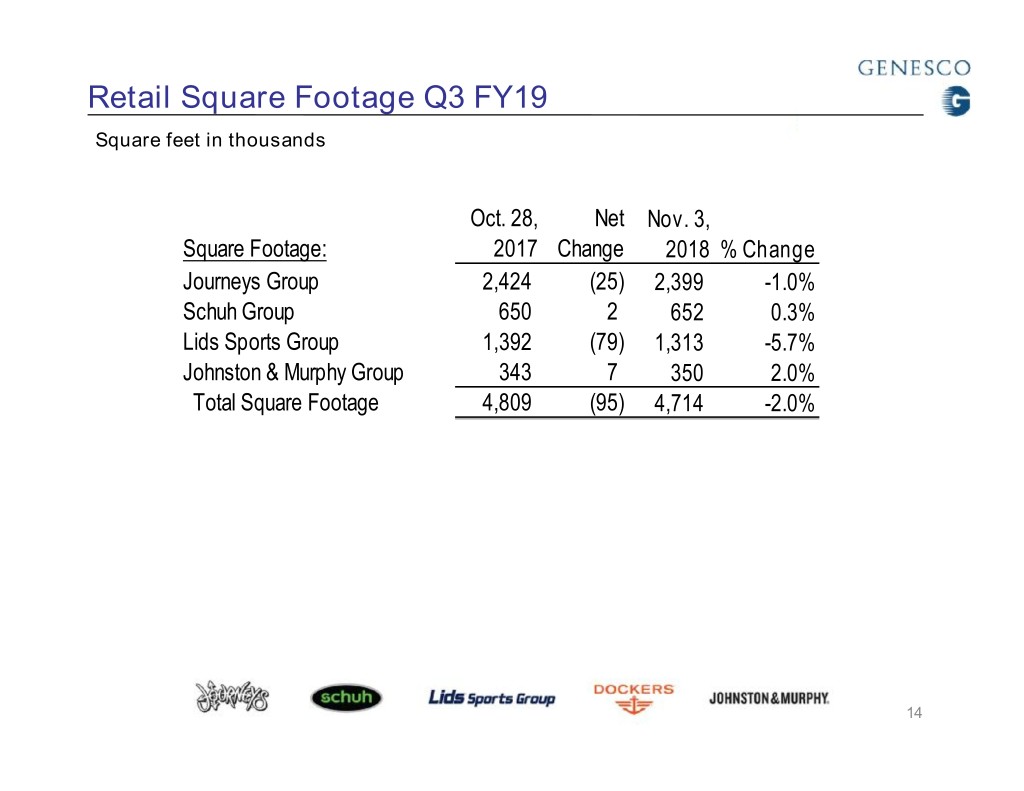
Retail Square Footage Q3 FY19 Square feet in thousands Oct. 28, Net Nov. 3, Square Footage: 2017 Change 2018% Change Journeys Group 2,424 (25) 2,399 -1.0% Schuh Group 650 2 652 0.3% Lids Sports Group 1,392 (79) 1,313 -5.7% Johnston & Murphy Group 343 7 350 2.0% Total Square Footage 4,809 (95) 4,714 -2.0% 14
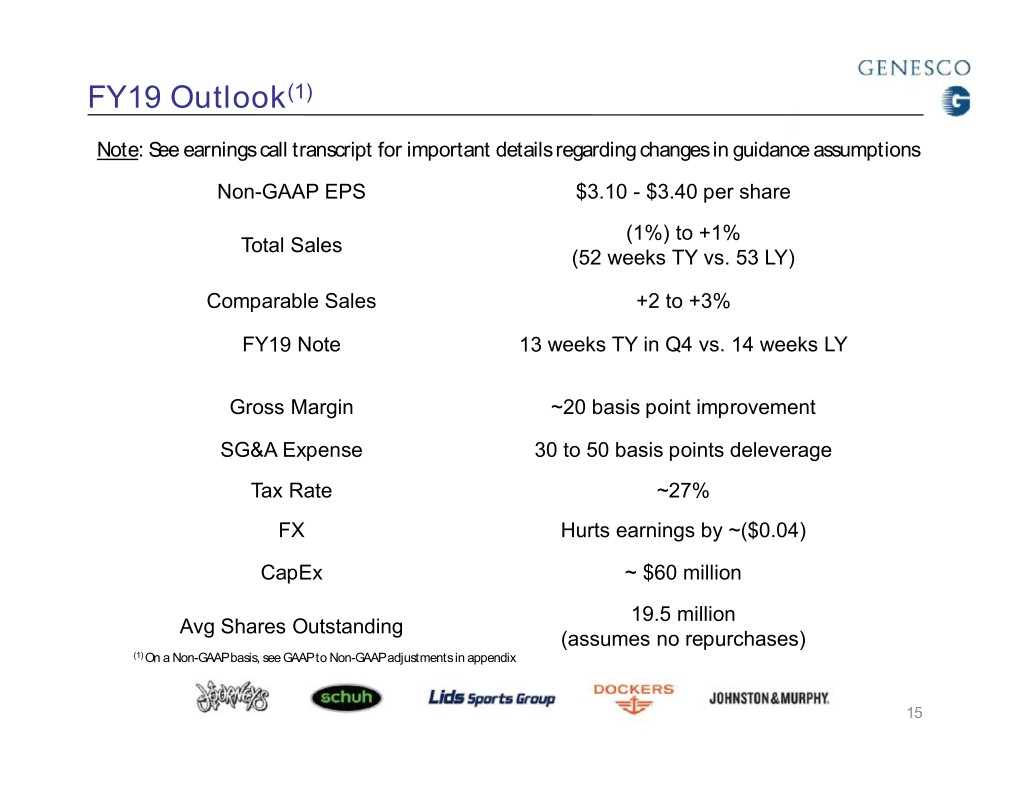
FY19 Outlook(1) Note: See earnings call transcript for important details regarding changes in guidance assumptions Non-GAAP EPS $3.10 -$3.40 per share (1%) to +1% TotalSales (52 weeks TY vs. 53 LY) Comparable Sales +2 to +3% FY19 Note 13 weeks TY in Q4 vs. 14 weeks LY Gross Margin ~20 basis point improvement SG&A Expense 30 to 50 basis points deleverage Tax Rate ~27% FX Hurtsearnings by ~($0.04) CapEx ~ $60 million 19.5 million AvgShares Outstanding (assumesno repurchases) (1) On a Non-GAAP basis, see GAAP to Non-GAAP adjustments in appendix 15
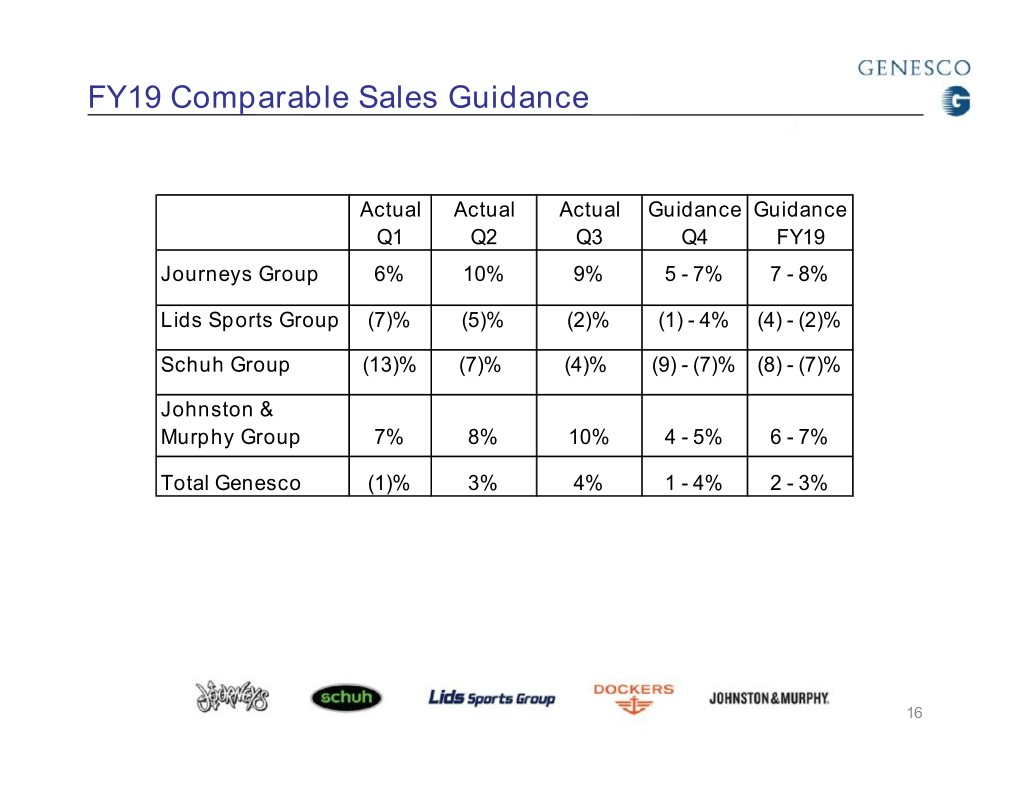
FY19 Comparable Sales Guidance Actual Actual Actual GuidanceGuidance Q1 Q2 Q3 Q4 FY19 Journeys Group 6% 10% 9% 5 - 7% 7 - 8% Lids Sports Group (7)% (5)% (2)% (1) - 4% (4) - (2)% Schuh Group (13)% (7)% (4)% (9) - (7)% (8) - (7)% Johnston & Murphy Group 7% 8% 10% 4 - 5% 6 - 7% Total Genesco (1)% 3% 4% 1 - 4% 2 - 3% 16
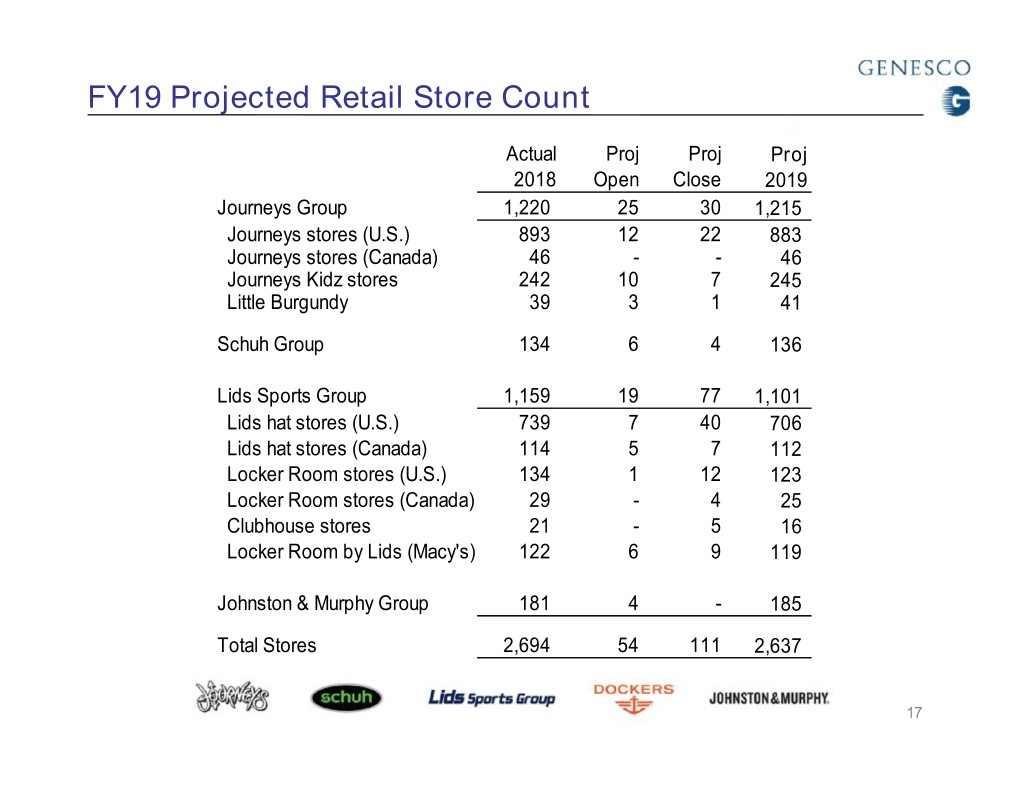
FY19 Projected Retail Store Count Actual Proj Proj Proj 2018 Open Close 2019 Journeys Group 1,220 25 30 1,215 Journeys stores (U.S.) 893 12 22 883 Journeys stores (Canada) 46 - - 46 Journeys Kidz stores 242 10 7 245 Little Burgundy 39 3 1 41 Schuh Group 134 6 4 136 Lids Sports Group 1,159 19 77 1,101 Lids hat stores (U.S.) 739 7 40 706 Lids hat stores (Canada) 114 5 7 112 Locker Room stores (U.S.) 134 1 12 123 Locker Room stores (Canada) 29 - 4 25 Clubhouse stores 21 - 5 16 Locker Room by Lids (Macy's) 122 6 9 119 Johnston & Murphy Group 181 4 - 185 Total Stores 2,694 54 111 2,637 17
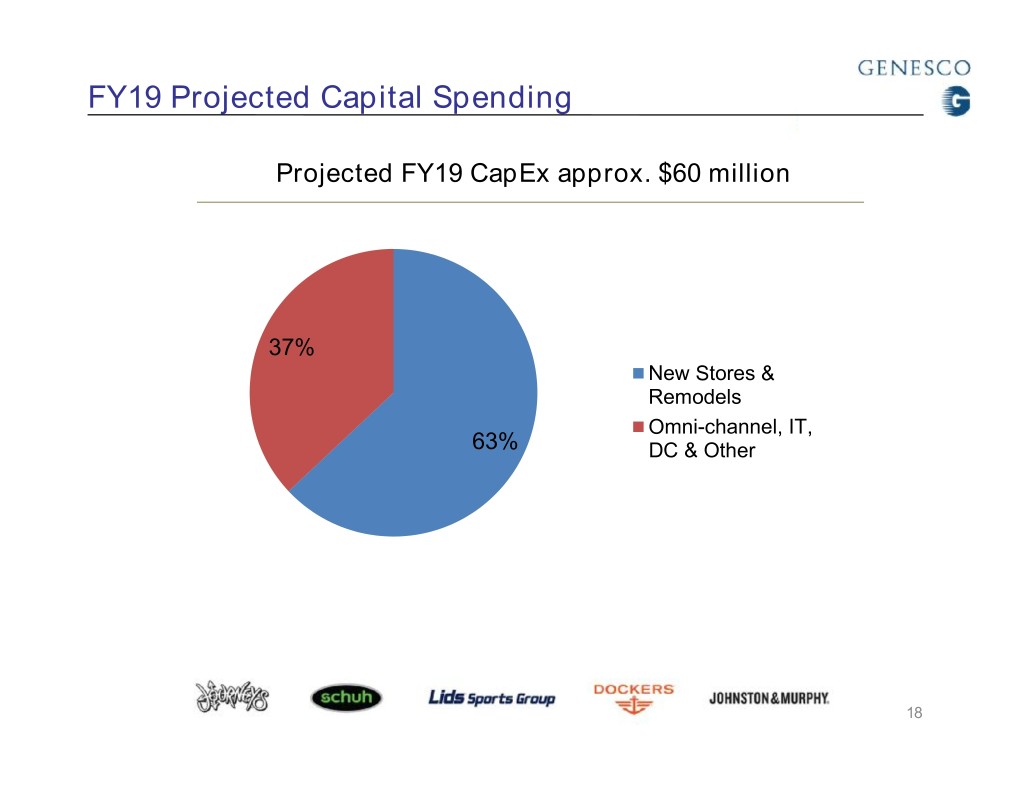
FY19 Projected Capital Spending Projected FY19 CapExapprox. $60 million 37% New Stores & Remodels Omni-channel, IT, 63% DC & Other 18
Appendix
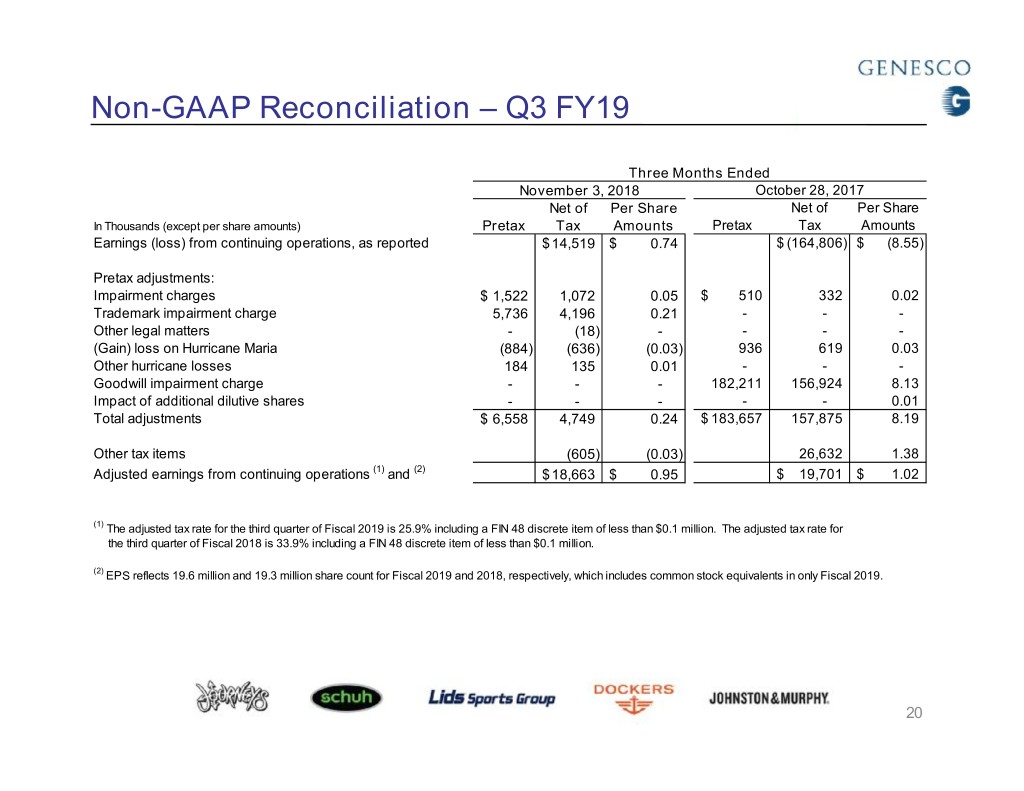
Non-GAAP Reconciliation –Q3 FY19 Three Months Ended November 3, 2018 October 28, 2017 Net of Per Share Net of Per Share In Thousands (except per share amounts) Pretax Tax Amounts Pretax Tax Amounts Earnings (loss) from continuing operations, as reported $ 14,519 $ 0.74 $ (164,806) $ (8.55) Pretax adjustments: Impairment charges $ 1,522 1,072 0.05 $ 510 332 0.02 Trademark impairment charge 5,736 4,196 0.21 - - - Other legal matters - ( 18) - - - - (Gain) loss on Hurricane Maria (884) (636) (0.03) 936 619 0.03 Other hurricane losses 184 1 35 0.01 - - - Goodwill impairment charge - - - 182,211 156,924 8.13 Impact of additional dilutive shares - - - - - 0.01 Total adjustments $ 6,558 4,749 0.24 $ 183,657 157,875 8.19 Other tax items (605) (0.03) 26,632 1.38 Adjusted earnings from continuing operations (1) and (2) $ 18,663 $ 0.95 $ 19,701 $ 1.02 (1) The adjusted tax rate for the third quarter of Fiscal 2019 is 25.9% including a FIN 48 discrete item of less than $0.1 million. The adjusted tax rate for the third quarter of Fiscal 2018 is 33.9% including a FIN 48 discrete item of less than $0.1 million. (2) EPS reflects 19.6 million and 19.3 million share count for Fiscal 2019 and 2018, respectively, which includes common stock equivalents in only Fiscal 2019. 20
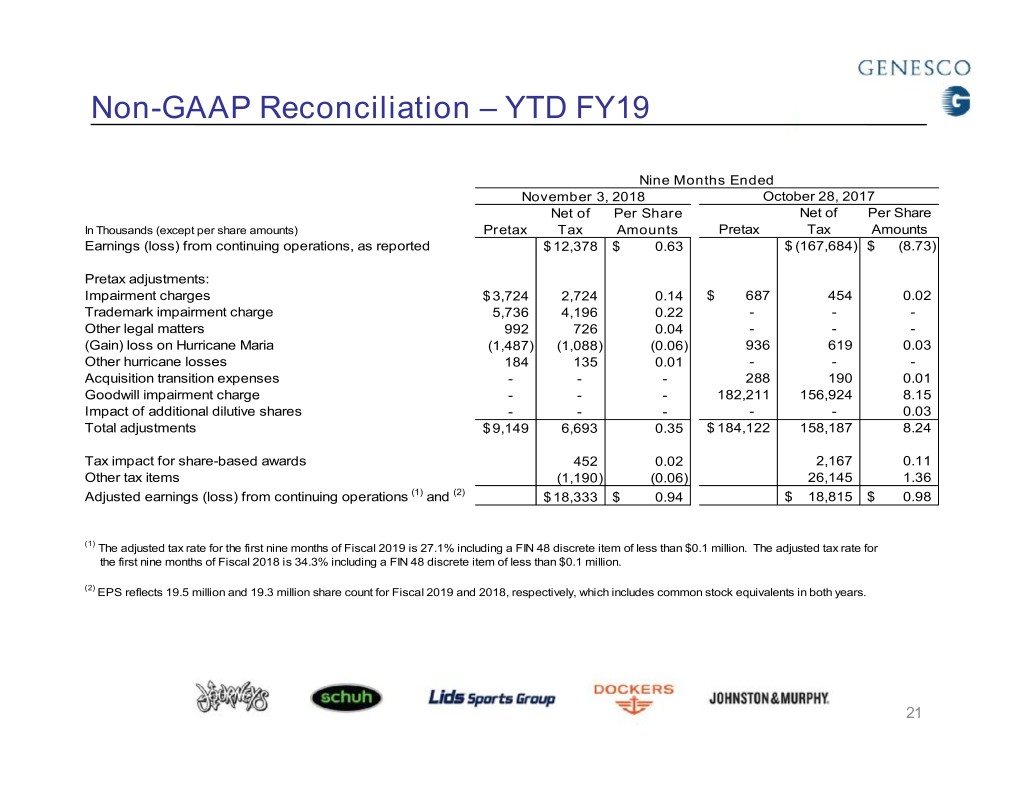
Non-GAAP Reconciliation –YTD FY19 Nine Months Ended November 3, 2018 October 28, 2017 Net of Per Share Net of Per Share In Thousands (except per share amounts) Pretax Tax Amounts Pretax Tax Amounts Earnings (loss) from continuing operations, as reported $ 12,378 $ 0.63 $ (167,684) $ (8.73) Pretax adjustments: Impairment charges $ 3,724 2,724 0.14 $ 687 454 0.02 Trademark impairment charge 5,736 4,196 0.22 - - - Other legal matters 992 726 0.04 - - - (Gain) loss on Hurricane Maria (1,487) (1,088) (0.06) 936 619 0.03 Other hurricane losses 184 135 0.01 - - - Acquisition transition expenses - - - 288 190 0.01 Goodwill impairment charge - - - 182,211 156,924 8.15 Impact of additional dilutive shares - - - - - 0.03 Total adjustments $ 9,149 6,693 0.35 $ 184,122 158,187 8.24 Tax impact for share-based awards 452 0.02 2,167 0.11 Other tax items (1,190) (0.06) 26,145 1.36 Adjusted earnings (loss) from continuing operations (1) and (2) $ 18,333 $ 0.94 $ 18,815 $ 0.98 (1) The adjusted tax rate for the first nine months of Fiscal 2019 is 27.1% including a FIN 48 discrete item of less than $0.1 million. The adjusted tax rate for the first nine months of Fiscal 2018 is 34.3% including a FIN 48 discrete item of less than $0.1 million. (2) EPS reflects 19.5 million and 19.3 million share count for Fiscal 2019 and 2018, respectively, which includes common stock equivalents in both years. 21
