Attached files
| file | filename |
|---|---|
| 8-K - FORM 8-K - US BANCORP \DE\ | d662695d8k.htm |
Goldman Sachs U.S. Financial Services Conference 2018 December 4, 2018 Terry Dolan Vice Chairman and Chief Financial Officer Andy Cecere Chairman, President and Chief Executive Officer Exhibit 99.1
The following information appears in accordance with the Private Securities Litigation Reform Act of 1995: Today’s presentation contains forward-looking statements about U.S. Bancorp. Statements that are not historical or current facts, including statements about beliefs and expectations, are forward-looking statements and are based on the information available to, and assumptions and estimates made by, management as of the date hereof. These forward-looking statements cover, among other things, anticipated future revenue and expenses and the future plans and prospects of U.S. Bancorp. Forward-looking statements involve inherent risks and uncertainties, and important factors could cause actual results to differ materially from those anticipated. Deterioration in general business and economic conditions or turbulence in domestic or global financial markets could adversely affect U.S. Bancorp’s revenues and the values of its assets and liabilities, reduce the availability of funding to certain financial institutions, lead to a tightening of credit, and increase stock price volatility. Stress in the commercial real estate markets, as well as a downturn in the residential real estate markets, could cause credit losses and deterioration in asset values. In addition, changes to statutes, regulations, or regulatory policies or practices could affect U.S. Bancorp in substantial and unpredictable ways. U.S. Bancorp’s results could also be adversely affected by changes in interest rates; deterioration in the credit quality of its loan portfolios or in the value of the collateral securing those loans; deterioration in the value of its investment securities; legal and regulatory developments; litigation; increased competition from both banks and non-banks; changes in the level of tariffs and other trade policies of the United States and its global trading partners; changes in customer behavior and preferences; breaches in data security; effects of mergers and acquisitions and related integration; effects of critical accounting policies and judgments; and management’s ability to effectively manage credit risk, market risk, operational risk, compliance risk, strategic risk, interest rate risk, liquidity risk and reputational risk. For discussion of these and other risks that may cause actual results to differ from expectations, refer to U.S. Bancorp’s Annual Report on Form 10-K for the year ended December 31, 2017, on file with the Securities and Exchange Commission, including the sections entitled “Risk Factors” and “Corporate Risk Profile” contained in Exhibit 13, and all subsequent filings with the Securities and Exchange Commission under Sections 13(a), 13(c), 14 or 15(d) of the Securities Exchange Act of 1934. However, factors other than these also could adversely affect U.S. Bancorp’s results, and the reader should not consider these factors to be a complete set of all potential risks or uncertainties. Forward-looking statements speak only as of the date hereof, and U.S. Bancorp undertakes no obligation to update them in light of new information or future events. This presentation includes non-GAAP financial measures to describe U.S. Bancorp’s performance. The calculations of these measures are provided in the Appendix. These disclosures should not be viewed as a substitute for operating results determined in accordance with GAAP, nor are they necessarily comparable to non-GAAP performance measures that may be presented by other companies. Forward-looking Statements and Additional Information
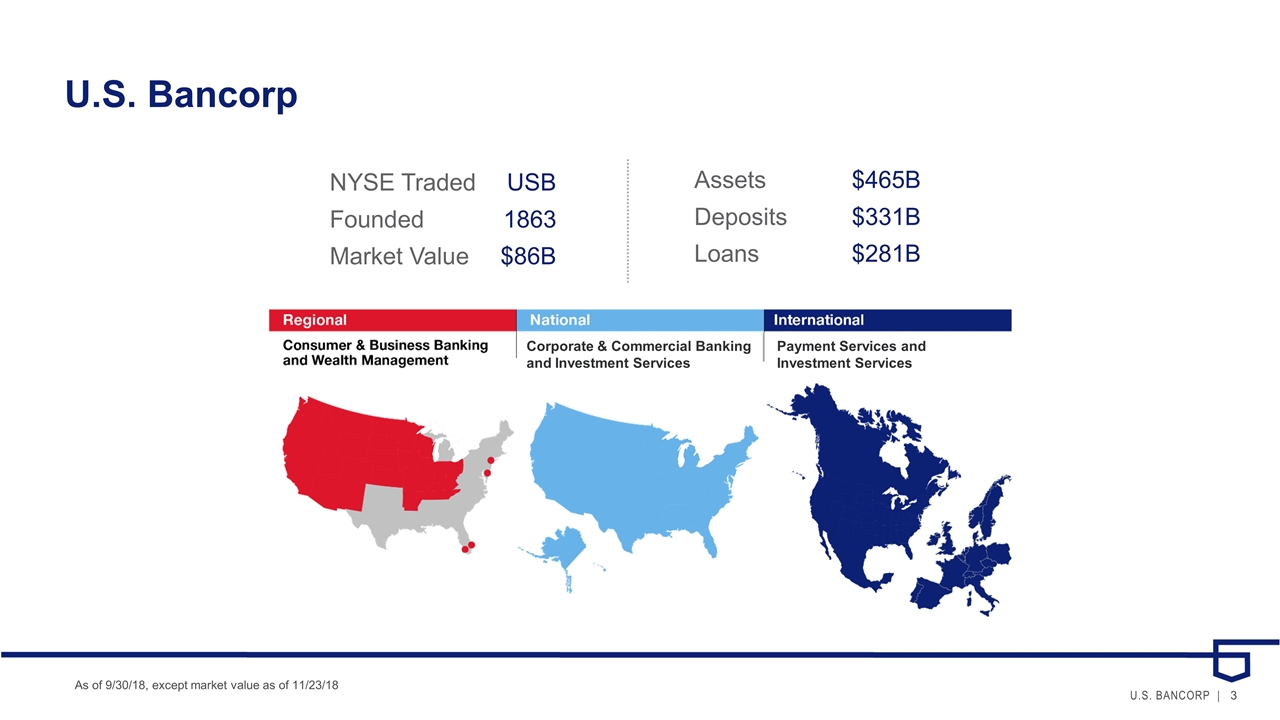
U.S. Bancorp As of 9/30/18, except market value as of 11/23/18 NYSE TradedUSB Founded 1863 Market Value $86B Assets $465B Deposits $331B Loans $281B Payment Services and Investment Services Corporate & Commercial Banking and Investment Services
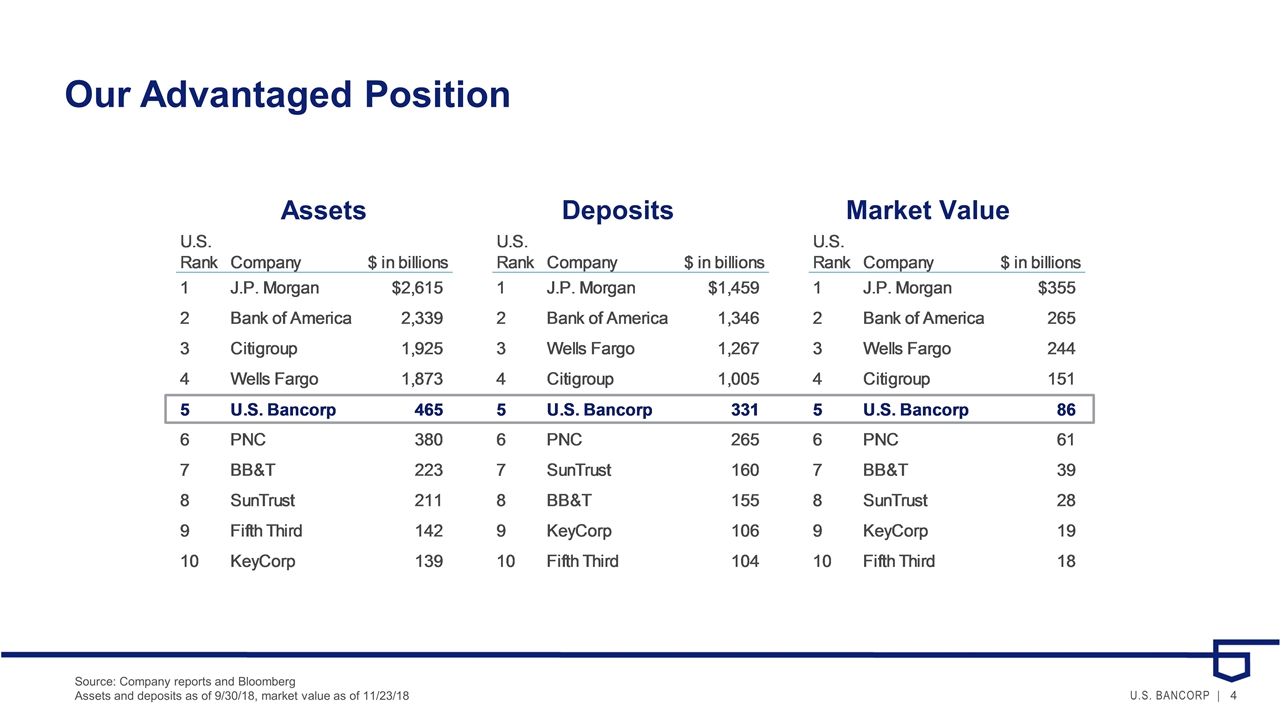
Our Advantaged Position Source: Company reports and Bloomberg Assets and deposits as of 9/30/18, market value as of 11/23/18 Assets Market Value Deposits
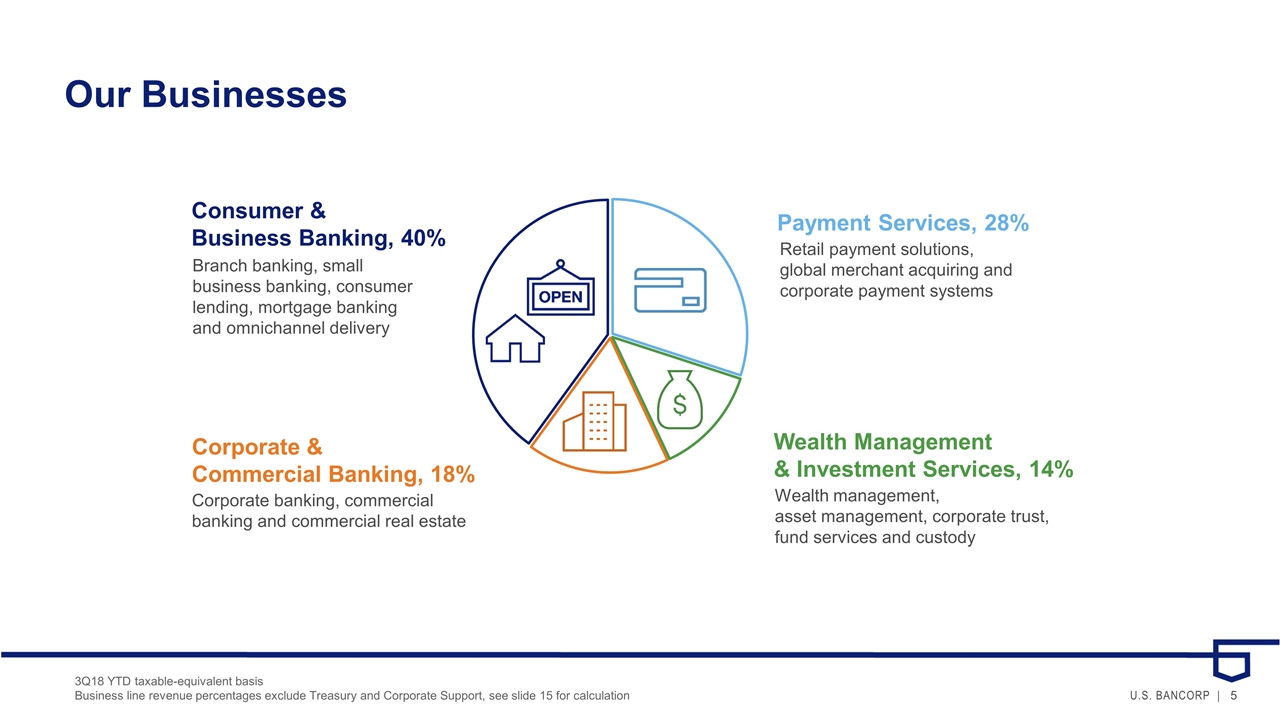
Our Businesses Consumer & Business Banking, 40% Branch banking, small business banking, consumer lending, mortgage banking and omnichannel delivery Payment Services, 28% Retail payment solutions, global merchant acquiring and corporate payment systems Corporate & Commercial Banking, 18% Corporate banking, commercial banking and commercial real estate Wealth Management & Investment Services, 14% Wealth management, asset management, corporate trust, fund services and custody 3Q18 YTD taxable-equivalent basis Business line revenue percentages exclude Treasury and Corporate Support, see slide 15 for calculation
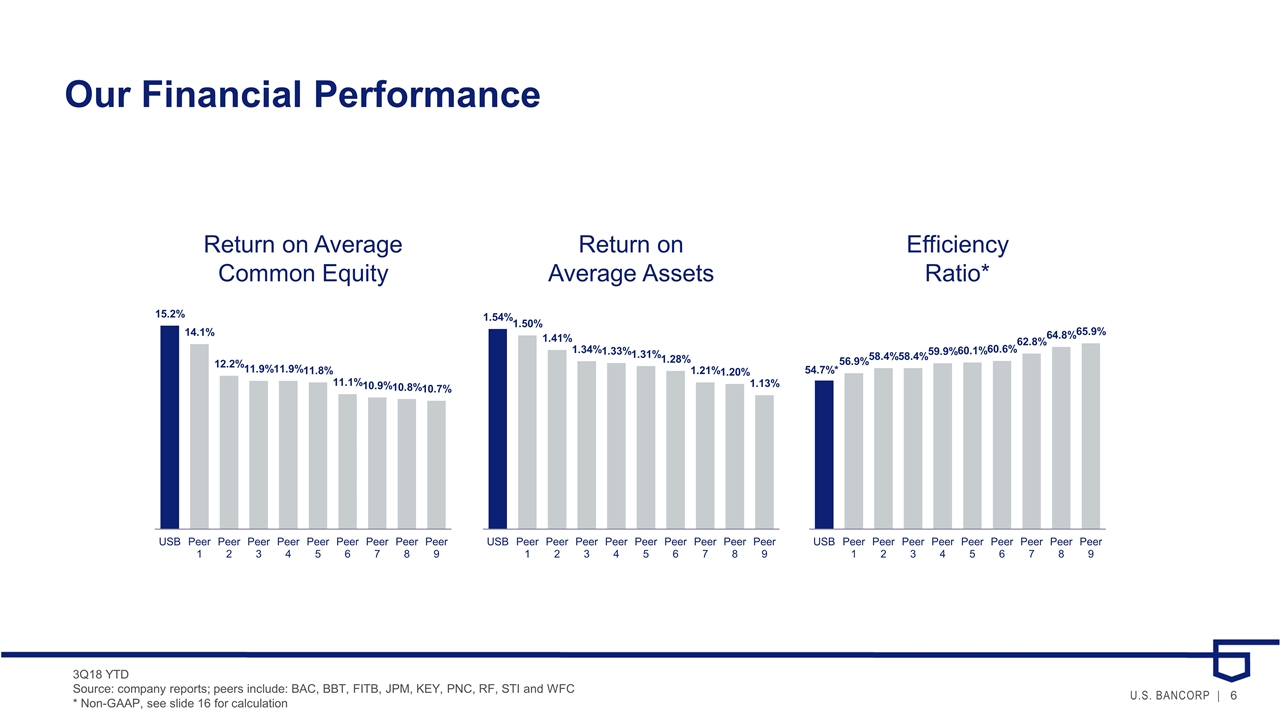
Our Financial Performance Return on Average Common Equity Return on Average Assets Efficiency Ratio* 3Q18 YTD Source: company reports; peers include: BAC, BBT, FITB, JPM, KEY, PNC, RF, STI and WFC * Non-GAAP, see slide 16 for calculation
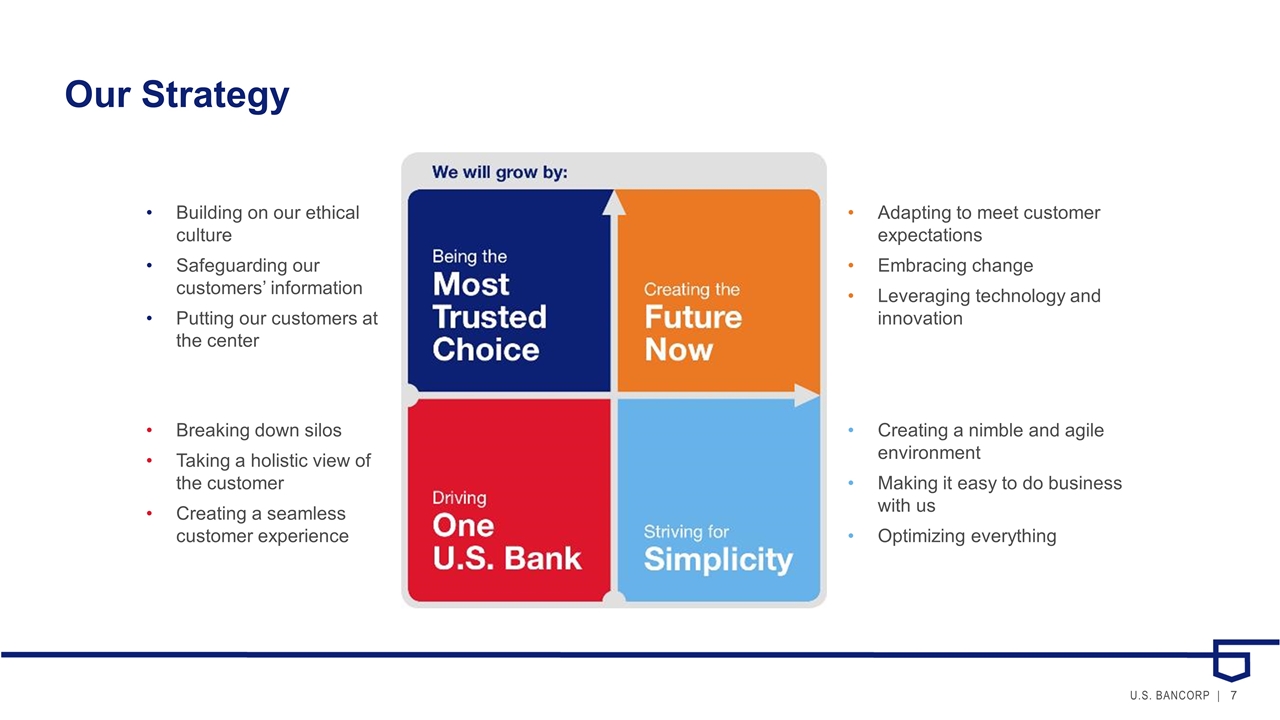
Our Strategy Adapting to meet customer expectations Embracing change Leveraging technology and innovation Creating a nimble and agile environment Making it easy to do business with us Optimizing everything Building on our ethical culture Safeguarding our customers’ information Putting our customers at the center Breaking down silos Taking a holistic view of the customer Creating a seamless customer experience
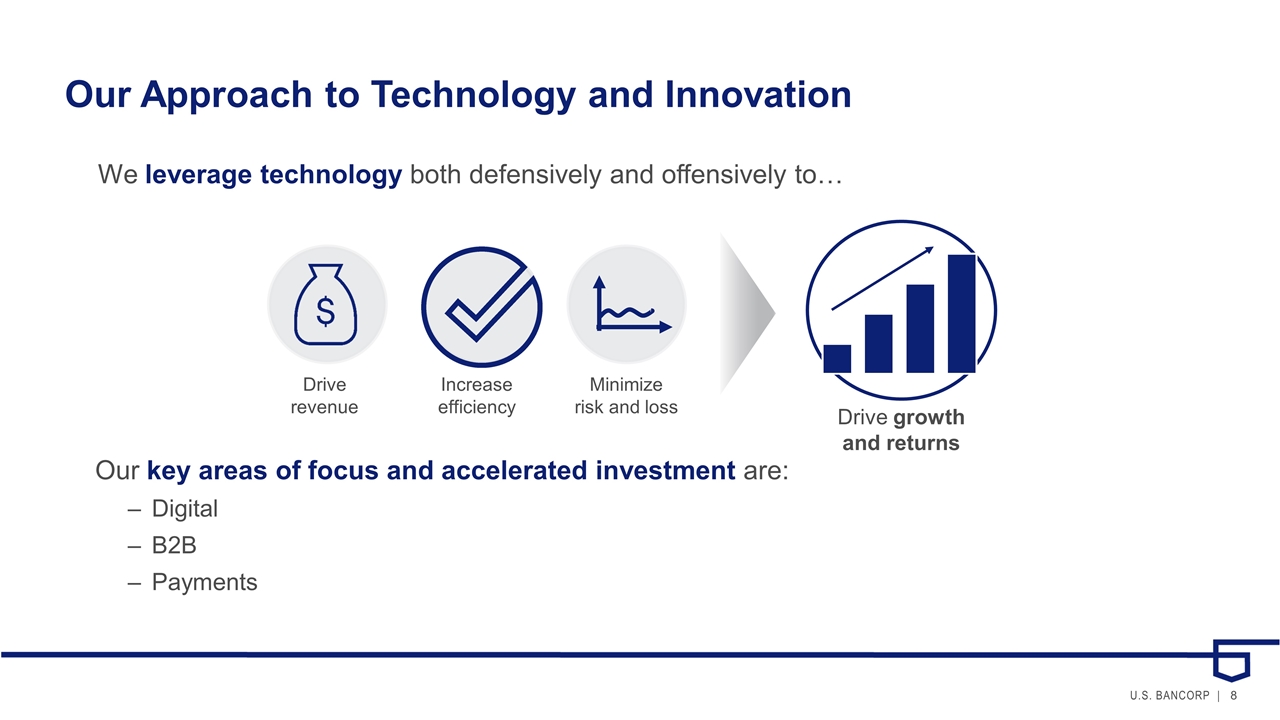
Our Approach to Technology and Innovation We leverage technology both defensively and offensively to… Drive growth and returns Drive revenue Increase efficiency Minimize risk and loss Our key areas of focus and accelerated investment are: Digital B2B Payments
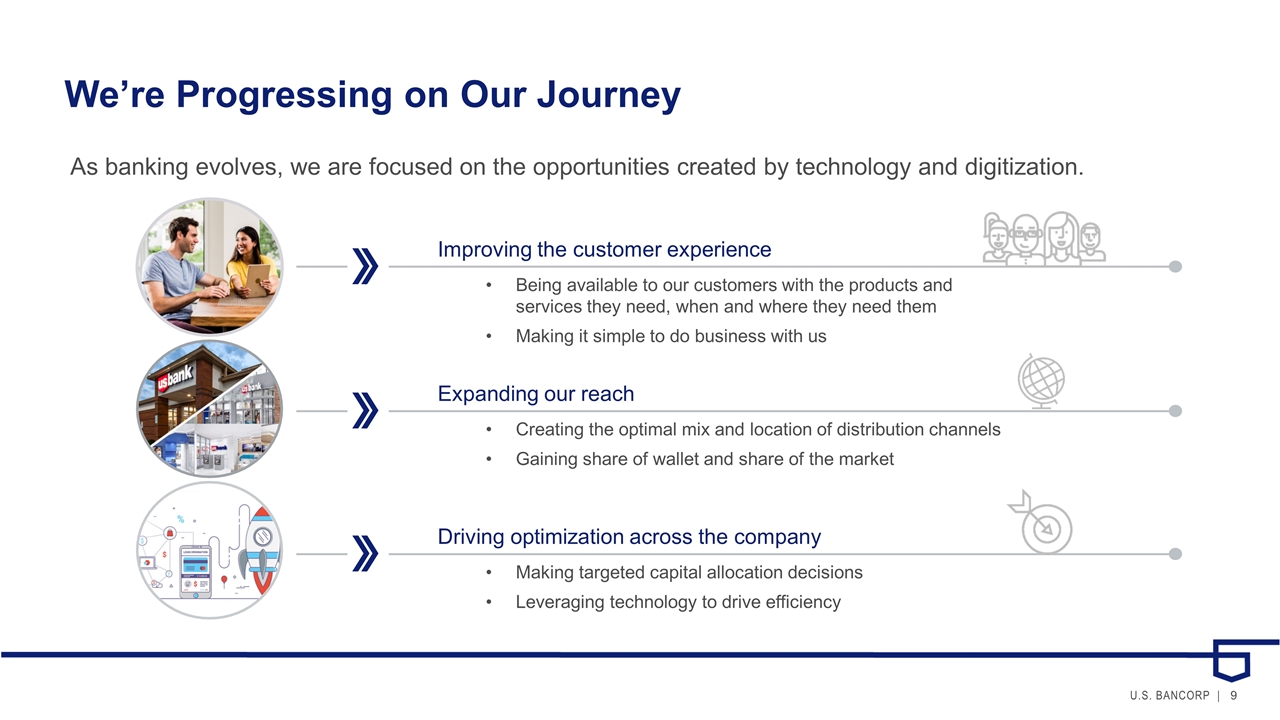
We’re Progressing on Our Journey Improving the customer experience Being available to our customers with the products and services they need, when and where they need them Making it simple to do business with us As banking evolves, we are focused on the opportunities created by technology and digitization. Expanding our reach Creating the optimal mix and location of distribution channels Gaining share of wallet and share of the market Driving optimization across the company Making targeted capital allocation decisions Leveraging technology to drive efficiency
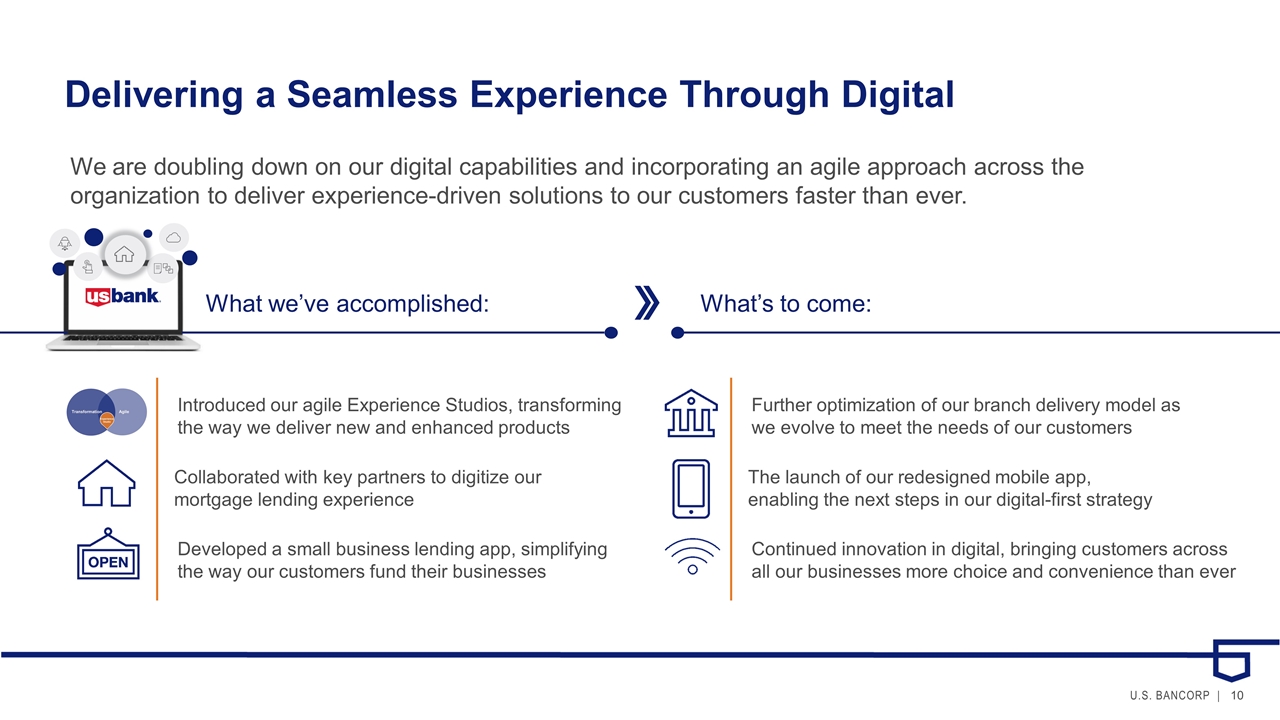
Delivering a Seamless Experience Through Digital We are doubling down on our digital capabilities and incorporating an agile approach across the organization to deliver experience-driven solutions to our customers faster than ever. What we’ve accomplished: What’s to come: The launch of our redesigned mobile app, enabling the next steps in our digital-first strategy Further optimization of our branch delivery model as we evolve to meet the needs of our customers Continued innovation in digital, bringing customers across all our businesses more choice and convenience than ever Collaborated with key partners to digitize our mortgage lending experience Introduced our agile Experience Studios, transforming the way we deliver new and enhanced products Developed a small business lending app, simplifying the way our customers fund their businesses
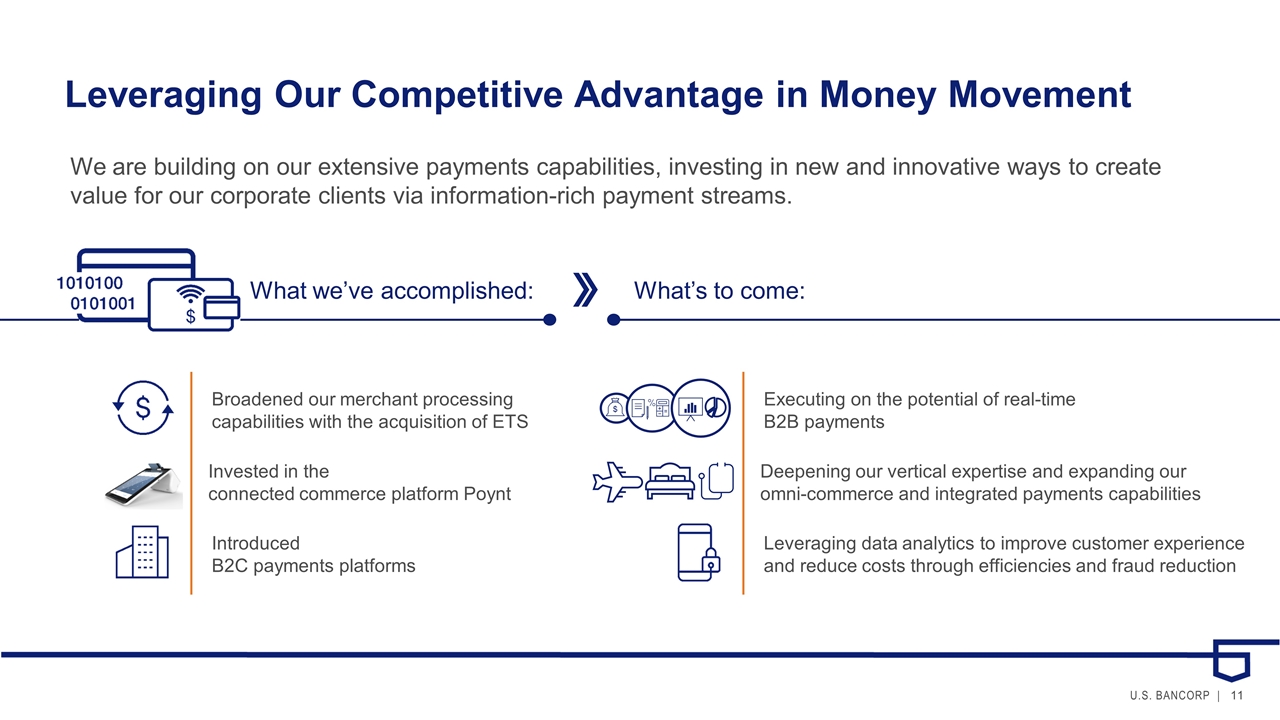
Leveraging Our Competitive Advantage in Money Movement What we’ve accomplished: Invested in the connected commerce platform Poynt Broadened our merchant processing capabilities with the acquisition of ETS What’s to come: Deepening our vertical expertise and expanding our omni-commerce and integrated payments capabilities Executing on the potential of real-time B2B payments We are building on our extensive payments capabilities, investing in new and innovative ways to create value for our corporate clients via information-rich payment streams. Introduced B2C payments platforms Leveraging data analytics to improve customer experience and reduce costs through efficiencies and fraud reduction
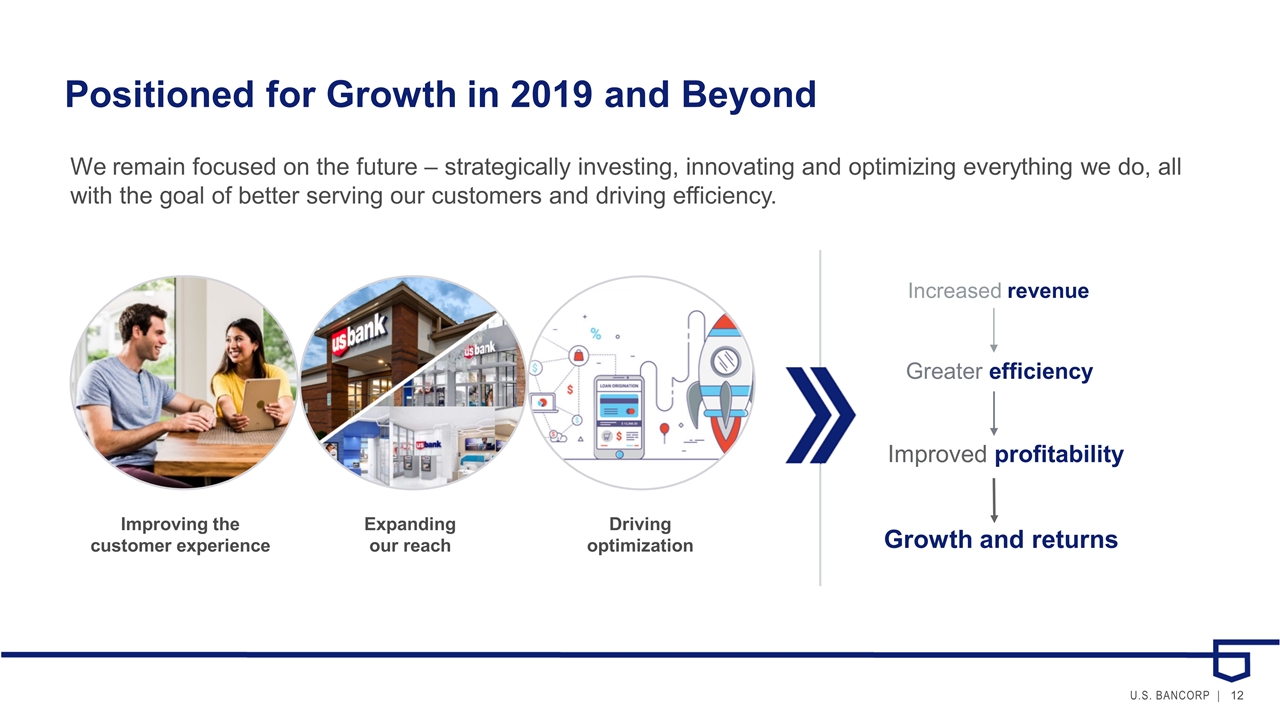
Positioned for Growth in 2019 and Beyond Increased revenue Greater efficiency Improved profitability Growth and returns We remain focused on the future – strategically investing, innovating and optimizing everything we do, all with the goal of better serving our customers and driving efficiency. Improving the customer experience Expanding our reach Driving optimization
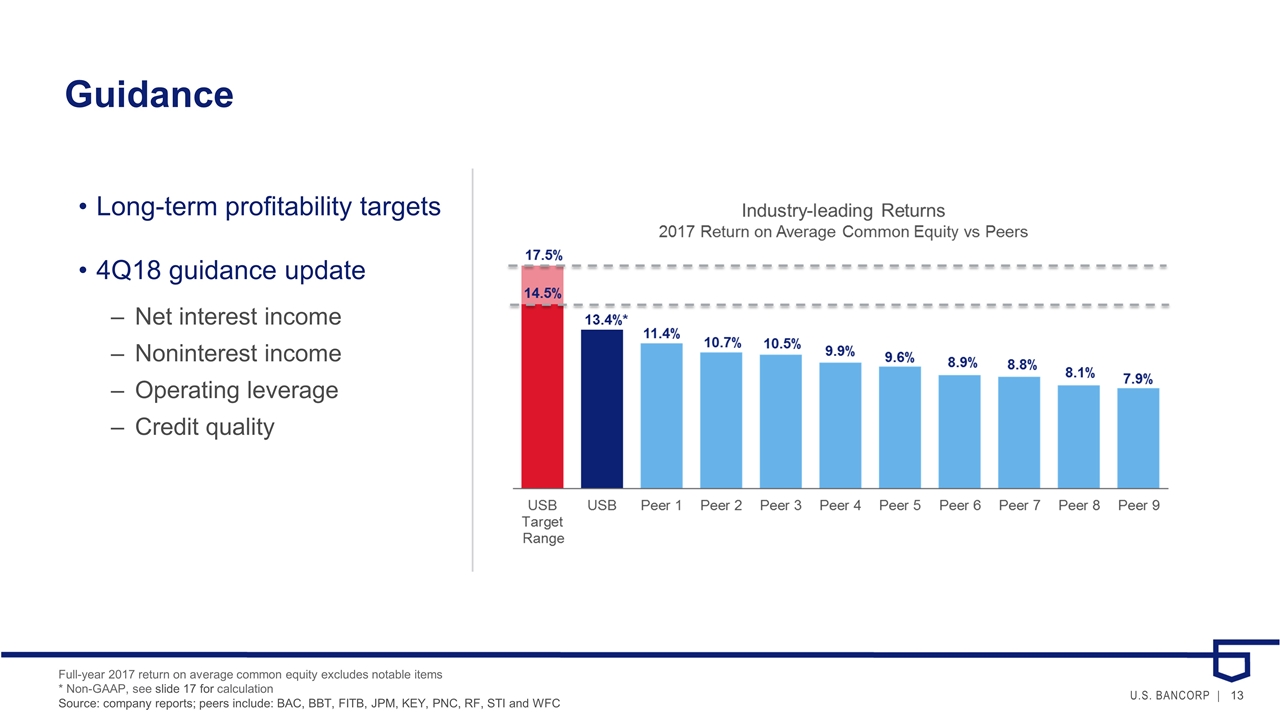
Guidance Long-term profitability targets 4Q18 guidance update Net interest income Noninterest income Operating leverage Credit quality Full-year 2017 return on average common equity excludes notable items * Non-GAAP, see slide 17 for calculation Source: company reports; peers include: BAC, BBT, FITB, JPM, KEY, PNC, RF, STI and WFC
Appendix
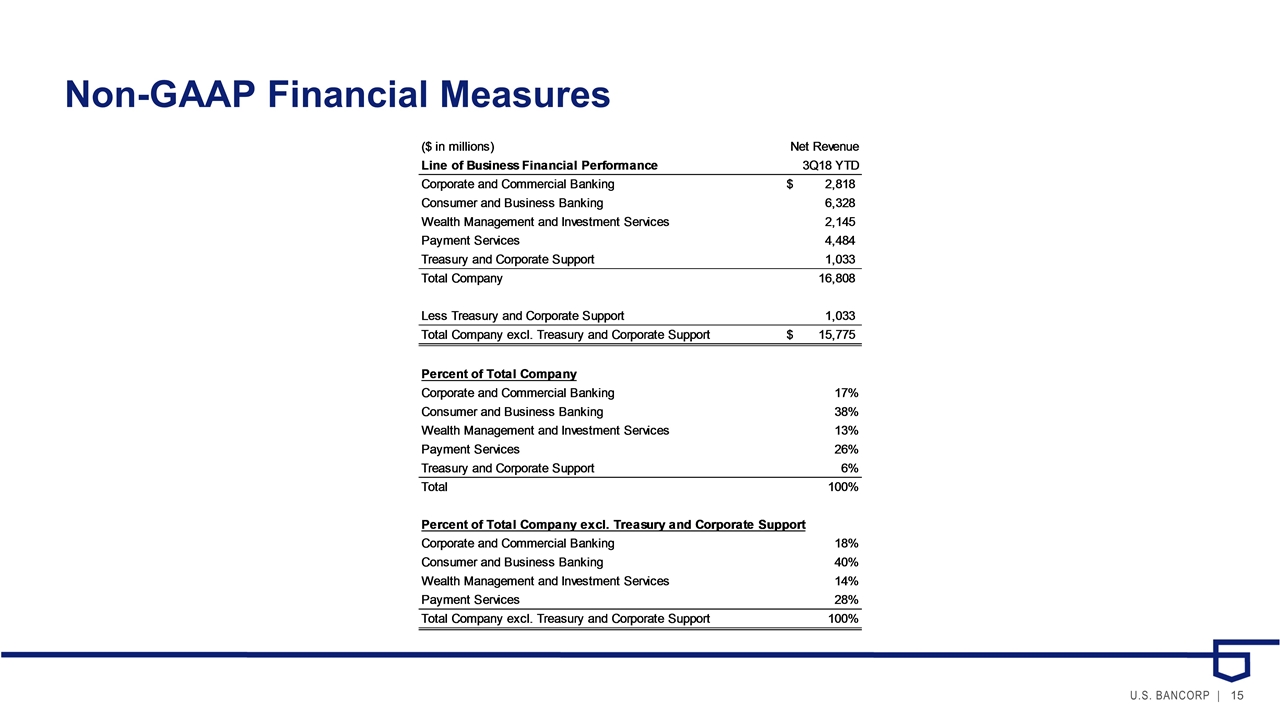
Non-GAAP Financial Measures
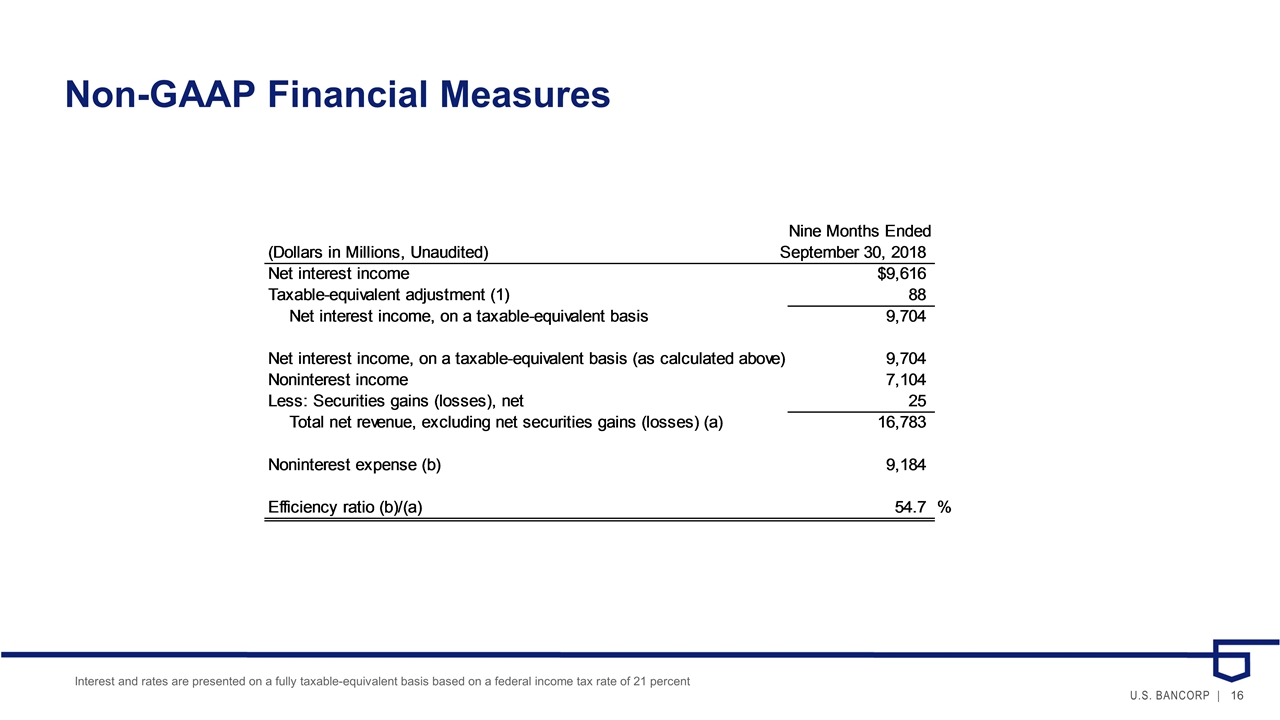
Non-GAAP Financial Measures Interest and rates are presented on a fully taxable-equivalent basis based on a federal income tax rate of 21 percent
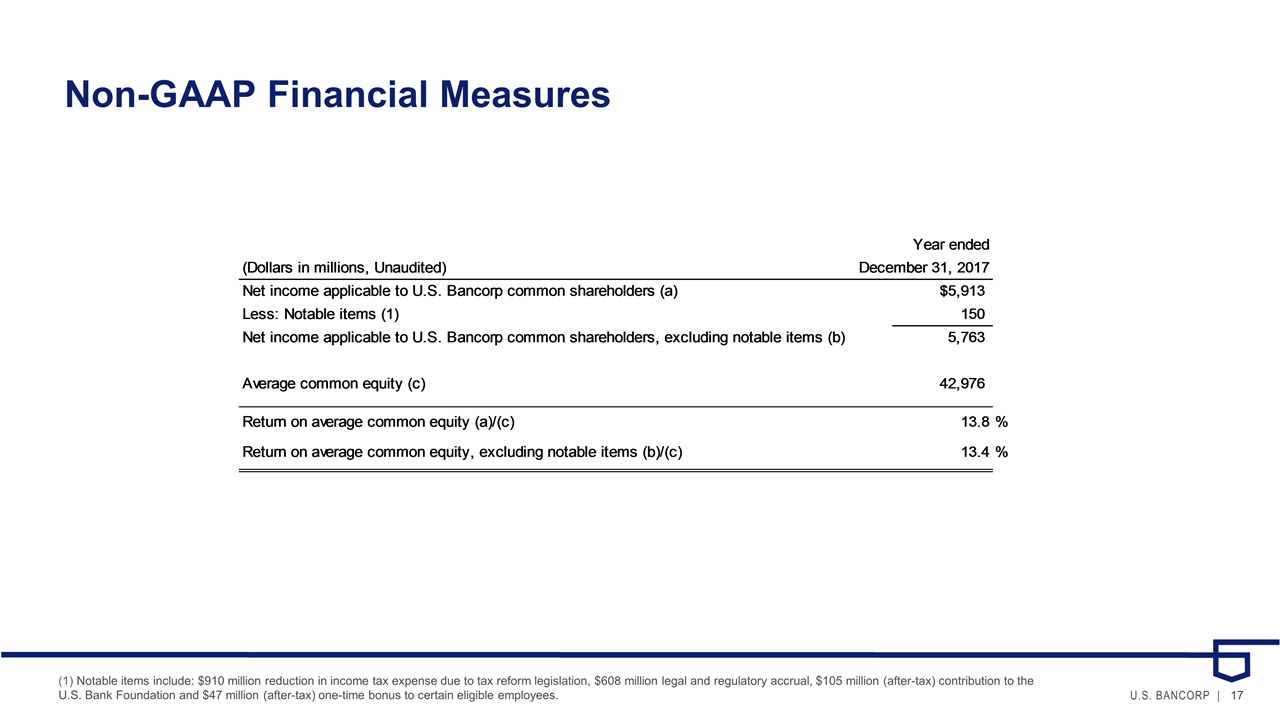
Non-GAAP Financial Measures (1) Notable items include: $910 million reduction in income tax expense due to tax reform legislation, $608 million legal and regulatory accrual, $105 million (after-tax) contribution to the U.S. Bank Foundation and $47 million (after-tax) one-time bonus to certain eligible employees.
