Attached files
| file | filename |
|---|---|
| EX-99.1 - EXHIBIT 99.1 - R F INDUSTRIES LTD | tv508425_ex99-1.htm |
| 8-K - FORM 8-K - R F INDUSTRIES LTD | tv508425_8k.htm |
Exhibit 99.2

© 2018 RF Industries Ltd. | 1 Leading Designer and Manufacturer of Interconnect Products NASDAQ: RFIL
© 2018 RF Industries Ltd. | 2 Forward - looking statements contained in this presentation involve risks and uncertainties, as well as assumptions that, if they never materialize or prove incorrect, could cause our results to differ materially and adversely from those expressed or implied by such forward - looking statements . Forward - looking statements may include, but are not limited to, statements relating to our outlook or expectations for earnings, revenues, expenses, asset quality, volatility of our common stock, financial condition or other future financial or business performance, strategies, expectations, or business prospects, or the impact of legal, regulatory or supervisory matters on our business, results of operations or financial condition . Forward - looking statements can be identified by the use of words such as “estimate,” “plan,” “project,” “forecast,” “intend,” “expect,” “anticipate,” “believe,” “seek,” “target” or similar expressions . Forward - looking statements reflect our judgment based on currently available information and involve a number of risks and uncertainties that could cause actual results to differ materially from those described in the forward - looking statements . Factors that could cause or contribute to such differences include, but are not limited to, those discussed in the section titled “Risk Factors” in our Form 10 - K filed with the SEC and any subsequent filings under the Exchange Act and in our other SEC filings . Additionally, there may be other factors that could preclude us from realizing the predictions made in the forward - looking statements . We operate in a continually changing business environment and new factors emerge from time to time . We cannot predict such factors or assess the impact, if any, of such factors on our financial position or results of operations . All forward - looking statements included in this presentation speak only as of the date of this presentation and you are cautioned not to place undue reliance on any such forward - looking statements . Except as required by law, we undertake no obligation to publicly update or release any revisions to these forward - looking statements to reflect any events or circumstances after the date of this presentation or to reflect the occurrence of unanticipated events . This presentation does not constitute an offer to sell or buy securities, and no offer or sale will be made in any state or jurisdiction in which such offer or sale would be unlawful prior to registration or qualification under the securities laws of any such state or jurisdiction . Safe Harbor Statement

© 2018 RF Industries Ltd. | 3 Executive Team Mark Turfler Senior Vice President and CFO ▪ Joined: June 2013 Robert Dawson President and CEO ▪ Joined: July 2017 ▪ Added to Board: July 2018 Prior Industry Experience 2014 - 2016 President and CEO, Vision Technology Services 2007 – 2013 TESSCO Technologies, VP of Sales 2000 – 2007 NetForce Solutions (acquired by TESSCO) Finance Experience 35 years of accounting and finance experience PricewaterhouseCoopers Certified Public Accountant Wireless/Telecom industry experience

© 2018 RF Industries Ltd. | 4 Under new CEO, we’ve seen significant improvement to our results!* $30.9 $30.2 $30.9 $58.5 2015 2016 2017 2018 Revenue (in millions) ** $1.0 ($4.1) $0.4 $5.8 2015 2016 2017 2018 Net Income (in millions) * Includes Comnet results; ** Based on preliminary unaudited financial results **

© 2018 RF Industries Ltd. | 5 : RFIL Headquarters San Diego, CA +2 production locations in Northeast • Corning Gold Program • ISO 9001: 2008 Certified Founded 1979 IPO 1984 Employees 203 Statistics 11/29/18 Stock Price $8.83 52 Week Low - High $2.25 / $12.75 Avg. Vol. (3 months) 169K Shares Outstanding 9.3M Insider Holdings 4% Institutional Holdings 27% Market Cap $83M Return on Capital (TTM) 16% Return on Equity (TTM) 23% Customers: Distribution 4,000 – 5,000 OEM 450+ Dividend: 33 consecutive quarterly dividends o f at least $0.02 / share

© 2018 RF Industries Ltd. | 6 RF Coaxial Connectors RF Coaxial Adapters Low PIM Products Passive Components Coaxial Cable Assemblies Fiber Optic Cable Assemblies FTTA Cable Assemblies Wiring Harnesses

© 2018 RF Industries Ltd. | 7 ; Cell Tower Site Materials Design, Engineer and Build Hybrid Fiber & Power Cables for 4G and 5G Network Deployment (You can’t buy this stuff “off the shelf”!) ; Distributed Antenna System (DAS) Our components are used to provide enhanced wireless coverage in commercial office buildings, offices, hotels, hospitals, stadiums, and more.
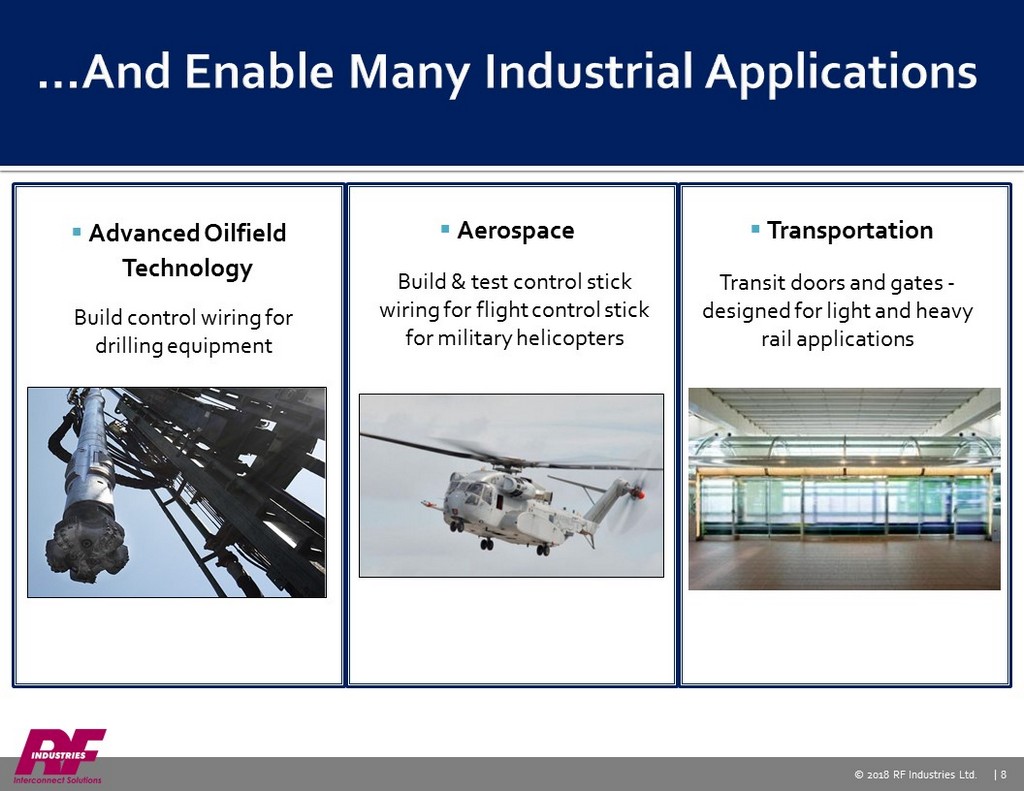
© 2018 RF Industries Ltd. | 8 ▪ Advanced Oilfield Technology ▪ Aerospace Build control wiring for drilling equipment Build & test control stick wiring for flight control stick for military helicopters ▪ Transportation Transit doors and gates - designed for light and heavy rail applications

© 2018 RF Industries Ltd. | 9 OEM opportunities in markets like defense, transportation, agriculture, and oil & gas N.A. Cable Assembly Market = $33.4B ₂ Global Connector Market = $80.4B by 2023 ₁ 5G Build - Out Spend = $130B in 2024 ₃ DAS Market = $8B growing to $18B in 2026 ⁴ 1 Source: Lucintel , February 2018 2 Source: Bishop & Associates, May 2017 3 Source : Deloitte, July 2017 4 Source: Transparency Market Research, August 2018

© 2018 RF Industries Ltd. | 10 Distribution – 60% Biggest opportunities are in distribution centric markets (force multiplier) • Access to thousands of customers • No A/R collection issues (99% of sales are in US and Canada) • No inventory obsolescence issues • Focus on what we do best Direct/OEM – 40% • Highly customized cable assemblies and wiring harnesses that “disappear” into other people’s products • Leverage our long standing relationships with these blue chip customers to be a part of their long - term business

© 2018 RF Industries Ltd. | 11 Distribution Partners OEM Customers

Our Value Proposition and Differentiation Who’s Our Competition? Large Competitors Small Competitors Local/Regional ▪ Fast – Faster lead times than larger competitors ▪ Flexible – Customized product (labor intensive; can’t buy off the shelf) ▪ High Quality – High quality product (ISO 9001 certified; Corning Gold House certified, no failures in the field) ▪ Competitive Pricing – Typically has better pricing than its competition and more margin for the channel partner © 2018 RF Industries Ltd. | 12 Multinational with Broad Offering

© 2018 RF Industries Ltd. | 13 Annual Financial Performance* $30.9 $30.2 $30.9 $58.5 2015 2016 2017 2018 (with Comnet) (in millions) $1.0 ($4.1) $0.4 $5.8 2015 2016 2017 2018 (with Comnet) (in millions) $22.5 $21.6 $23.0 $50.0 2015 2016 2017 2018 (w/o Comnet) (in millions) $0.4 ($4.5) $0.2 $6.0 2015 2016 2017 2018 (w/o Comnet) (in millions) Revenue Income from Continuing Ops. +34% - 2% +2% +89% Year - over - Year Growth Rate - 3% - 4% +6% +117% Year - over - Year Growth Rate 3.2% - 13.5% 1.2% 10.0% Net Margin 1.8% - 20.8% 0.1% 12.0% N et Margin * 2018 results based on preliminary unaudited financial results

© 2018 RF Industries Ltd. | 14 $6.3 $4.3 $5.2 $16.3 2015 2016 2017 2018 Cash Balances (in millions) Balance Sheet Supports Growth* $ in millions Oct. 31, 2017 Oct.31 , 2018 Cash $5.2 $16.3 Total Assets $25.1 $ 32.5 Stockholders’ Equity $21.4 $27.8 Total Debt $0 $0 *Excludes Comnet

© 2018 RF Industries Ltd. | 15 ▪ Organic ▪ Run rate business ▪ Core fast - turn production ▪ 10 - 15 % annual growth ▪ Project business transitioning to long - term relationships ▪ Get our product spec’d in customer projects and included on customer BOMs ▪ Deliver a quality, customized solution where others cannot ▪ Convert this into run rate business ▪ Inorganic ▪ Active M&A mode ▪ Diversify customer base ▪ Good cultural fit with management talent ▪ Reliable proprietary product that does not overlap what we currently sell ▪ Relevant customer base/market segment
© 2018 RF Industries Ltd. | 16 ; Our products are everywhere and make lots of things work ; Recent results have rewarded shareholders with higher stock price plus a long - standing dividend ▪ Revenue growth, margin growth, profit growth ; Our new sales model is driving growth ; We’re faster and more flexible while delivering high quality customized products and solutions ; We have the promise of 5G ahead of us in the wireless market

© 2018 RF Industries Ltd. | 17 ; Building a platform for long term growth ; Deliver more consistent and predictable results ; Leverage distribution and OEM relationships for organic growth ; Strategic M&A

© 2018 RF Industries Ltd. | 18 NASDAQ: RFIL
© 2018 RF Industries Ltd. | 19 RF Industries, Ltd. Mark Turfler SVP/CFO (858) 549 - 6340 rfi@rfindustries.com MKR Group Inc. Todd Kehrli Analyst/Investor Contact (323) 468 - 2300 rfil@mkr - group.com

© 2018 RF Industries Ltd. | 20
© 2018 RF Industries Ltd. | 21

Income Statement © 2018 RF Industries Ltd. | 22 2018 2017 2016 2015 Q3 YTD Full Year Full Year Full Year (in millions) Unaudited Audited Audited Audited Net sales 46.6$ 30.9$ 30.2$ 30.9$ Cost of sales 30.9 22.2 21.8 20.4 Gross profit 15.7 8.7 8.4 10.5 Operating expenses: Engineering 1.3 0.8 0.7 0.8 Selling and general 7.7 7.5 9.6 8.9 Goodwill and other intangible asset impairment - - 2.8 - Total operating expenses 9.0 8.3 13.1 9.7 Pretax income 6.7 0.4 (4.7) 0.8 Provision for income taxes 1.3 0.1 (0.7) 0.1 Income (loss) from continuing operations 5.4 0.3 (4.0) 0.7 Income (loss) from discontinued operations, net of tax - 0.1 (0.1) 0.3 Consolidated net income (loss) 5.4 0.4 (4.1) 1.0 Diluted earnings per share Continuing operations 0.57$ 0.03$ (0.46)$ 0.08$ Discontinued operations 0.00 0.01 (0.01) 0.03 Net income (loss) per share 0.57$ 0.04$ (0.47)$ 0.11$ Weighted average shares outstanding Diluted 9,442,612 8,915,764 8,786,510 8,862,217

Balance Sheet © 2018 RF Industries Ltd. | 23 July 31, 2018 2017 2016 2015 (in millions) Unaudited Audited Audited Audited ASSETS: Current assets: Cash and cash equivalents 11.6$ 6.0$ 5.3$ 7.6$ Trade accounts receivable, net 5.9 3.9 4.1 4.0 Inventories 6.9 6.1 6.0 6.9 Other current assets 0.9 0.8 1.4 1.2 Total current assets 25.3 16.8 16.8 19.7 Non-current assets: Property and equipment, net 0.6 0.7 0.8 0.9 Goodwill 3.2 3.2 3.2 5.9 Intangibles, net 2.6 3.0 3.6 4.3 Non-amortizable intangibles 1.2 1.2 1.2 1.4 Other LT assets - 0.2 0.2 0.1 Total Assets 32.9$ 25.1$ 25.8$ 32.3$ LIABILITIES AND STOCKHOLDERS' EQUITY: Current liabilities: Accounts payable 1.8$ 1.4$ 1.1$ 1.5$ Accrued expenses 3.5 2.2 2.8 2.9 Total current liabilities 5.3 3.6 3.9 4.4 Non-current liabilities: Deferred tax liabilities 0.2 0.1 0.4 1.1 Other long-term liabilities - - 0.1 0.4 Total liabilities 5.5 3.7 4.4 5.9 Equity: Common stock 0.1 0.1 0.1 0.1 Additional paid-in capital 20.9 19.7 19.4 19.1 Retained earnings 6.4 1.6 1.9 7.2 Total Equity 27.4 21.4 21.4 26.4 Total Liabilities & Stockholders' Equity 32.9$ 25.1$ 25.8$ 32.3$ October 31,
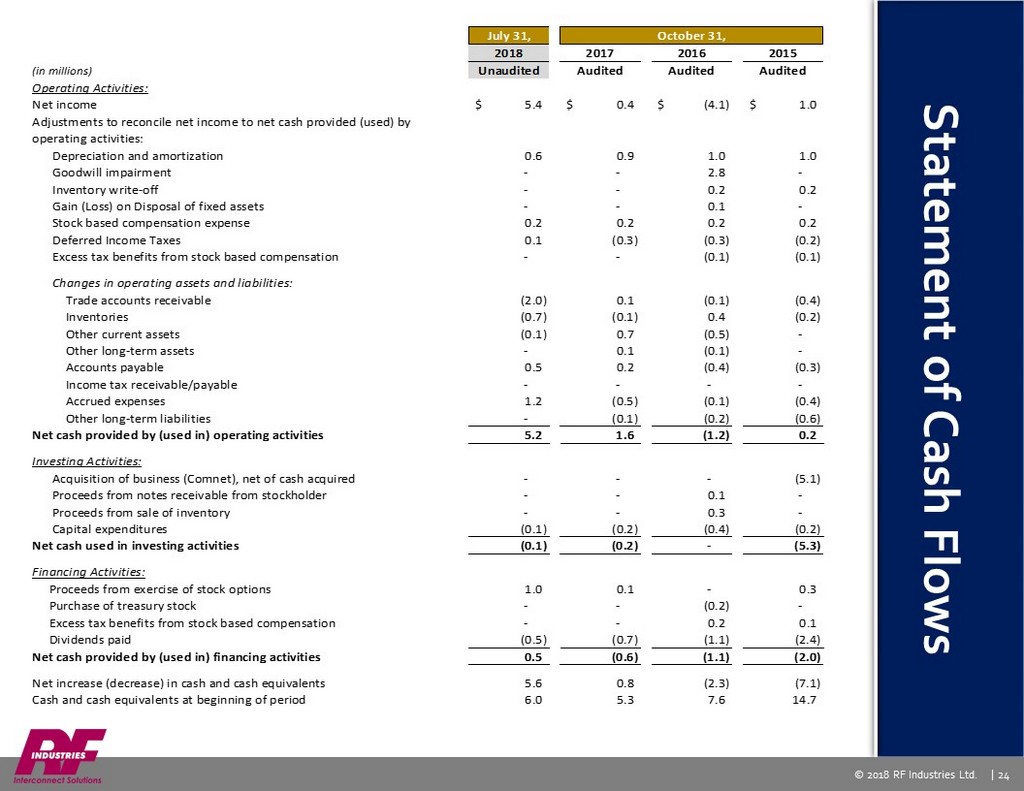
Statement of Cash Flows © 2018 RF Industries Ltd. | 24 July 31, 2018 2017 2016 2015 (in millions) Unaudited Audited Audited Audited Operating Activities: Net income 5.4$ 0.4$ (4.1)$ 1.0$ Adjustments to reconcile net income to net cash provided (used) by operating activities: Depreciation and amortization 0.6 0.9 1.0 1.0 Goodwill impairment - - 2.8 - Inventory write-off - - 0.2 0.2 Gain (Loss) on Disposal of fixed assets - - 0.1 - Stock based compensation expense 0.2 0.2 0.2 0.2 Deferred Income Taxes 0.1 (0.3) (0.3) (0.2) Excess tax benefits from stock based compensation - - (0.1) (0.1) Changes in operating assets and liabilities: Trade accounts receivable (2.0) 0.1 (0.1) (0.4) Inventories (0.7) (0.1) 0.4 (0.2) Other current assets (0.1) 0.7 (0.5) - Other long-term assets - 0.1 (0.1) - Accounts payable 0.5 0.2 (0.4) (0.3) Income tax receivable/payable - - - - Accrued expenses 1.2 (0.5) (0.1) (0.4) Other long-term liabilities - (0.1) (0.2) (0.6) Net cash provided by (used in) operating activities 5.2 1.6 (1.2) 0.2 Investing Activities: Acquisition of business (Comnet), net of cash acquired - - - (5.1) Proceeds from notes receivable from stockholder - - 0.1 - Proceeds from sale of inventory - - 0.3 - Capital expenditures (0.1) (0.2) (0.4) (0.2) Net cash used in investing activities (0.1) (0.2) - (5.3) Financing Activities: Proceeds from exercise of stock options 1.0 0.1 - 0.3 Purchase of treasury stock - - (0.2) - Excess tax benefits from stock based compensation - - 0.2 0.1 Dividends paid (0.5) (0.7) (1.1) (2.4) Net cash provided by (used in) financing activities 0.5 (0.6) (1.1) (2.0) Net increase (decrease) in cash and cash equivalents 5.6 0.8 (2.3) (7.1) Cash and cash equivalents at beginning of period 6.0 5.3 7.6 14.7 October 31,

Income Statement (Quarterly) © 2018 RF Industries Ltd. | 25 Q1 Q2 Q3 YTD Q1 Q2 Q3 Q4 YTD (in millions) Audited Net sales 10.3$ 22.4$ 13.9$ 46.6$ 6.6$ 7.6$ 7.8$ 8.9$ 30.9$ Cost of sales 7.3 14.3 9.3 30.9 4.7 5.7 5.6 6.2 22.2 Gross profit 3.0 8.1 4.6 15.7 1.9 1.9 2.2 2.7 8.7 Operating expenses: Engineering 0.3 0.7 0.3 1.3 0.2 0.2 0.2 0.2 0.8 Selling and general 2.1 3.5 2.1 7.7 2.0 1.7 1.8 2.0 7.5 Total operating expenses 2.4 4.2 2.4 9.0 2.2 1.9 2.0 2.2 8.3 Pretax income 0.6 3.9 2.2 6.7 (0.3) - 0.2 0.5 0.4 Provision for income taxes 0.1 0.7 0.5 1.3 (0.1) - - 0.2 0.1 Income from continuing operations 0.5 3.2 1.7 5.4 (0.2) - 0.2 0.3 0.3 Income from discontinued operations, net of tax - - - - - 0.1 - - 0.1 Consolidated net income (loss) 0.5 3.2 1.7 5.4 (0.2) 0.1 0.2 0.3 0.4 Diluted earnings per share Continuing operations 0.05$ 0.34$ 0.18$ 0.57$ (0.03)$ 0.00$ 0.02$ 0.03$ 0.03$ Discontinued operations 0.00 0.00 0.00 0.00 0.01 0.01 0.00 0.00 0.01 Net income (loss) per share 0.05$ 0.34$ 0.18$ 0.57$ (0.02)$ 0.01$ 0.02$ 0.03$ 0.04$ Weighted average shares outstanding Diluted 9,099,301 9,386,194 9,729,608 9,442,612 8,834,747 8,877,201 8,915,794 9,015,412 8,915,764 2018 2017 Unaudited Unaudited
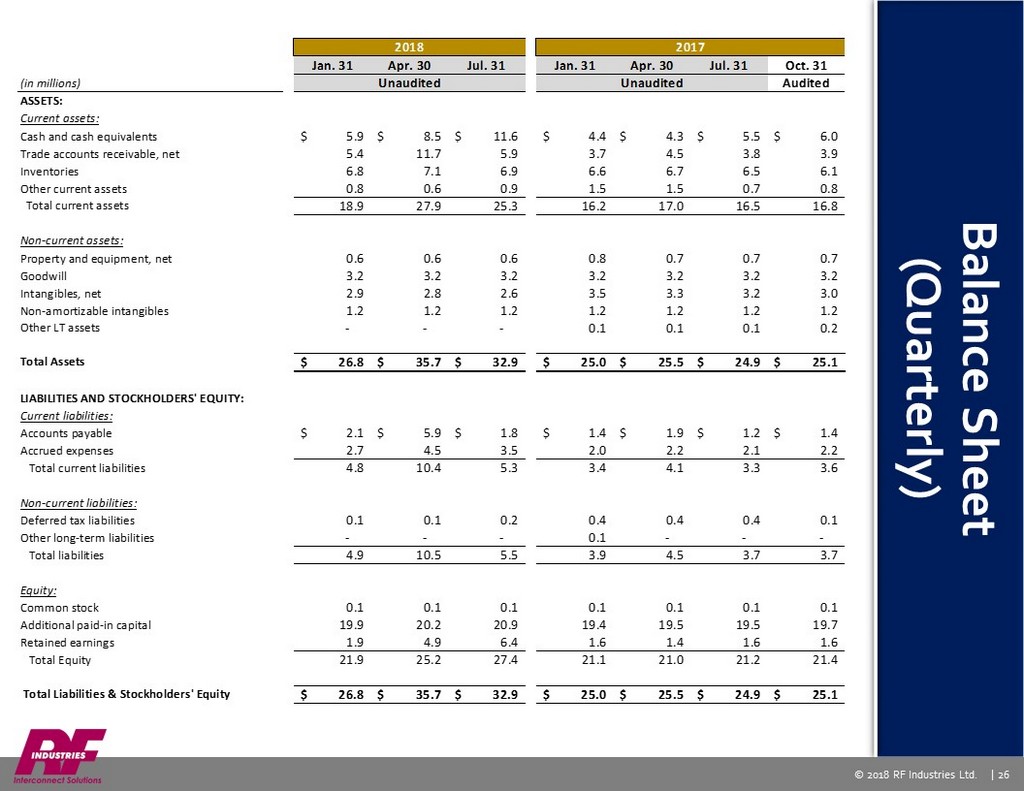
Balance Sheet (Quarterly) © 2018 RF Industries Ltd. | 26 Jan. 31 Apr. 30 Jul. 31 Jan. 31 Apr. 30 Jul. 31 Oct. 31 (in millions) Audited ASSETS: Current assets: Cash and cash equivalents 5.9$ 8.5$ 11.6$ 4.4$ 4.3$ 5.5$ 6.0$ Trade accounts receivable, net 5.4 11.7 5.9 3.7 4.5 3.8 3.9 Inventories 6.8 7.1 6.9 6.6 6.7 6.5 6.1 Other current assets 0.8 0.6 0.9 1.5 1.5 0.7 0.8 Total current assets 18.9 27.9 25.3 16.2 17.0 16.5 16.8 Non-current assets: Property and equipment, net 0.6 0.6 0.6 0.8 0.7 0.7 0.7 Goodwill 3.2 3.2 3.2 3.2 3.2 3.2 3.2 Intangibles, net 2.9 2.8 2.6 3.5 3.3 3.2 3.0 Non-amortizable intangibles 1.2 1.2 1.2 1.2 1.2 1.2 1.2 Other LT assets - - - 0.1 0.1 0.1 0.2 Total Assets 26.8$ 35.7$ 32.9$ 25.0$ 25.5$ 24.9$ 25.1$ LIABILITIES AND STOCKHOLDERS' EQUITY: Current liabilities: Accounts payable 2.1$ 5.9$ 1.8$ 1.4$ 1.9$ 1.2$ 1.4$ Accrued expenses 2.7 4.5 3.5 2.0 2.2 2.1 2.2 Total current liabilities 4.8 10.4 5.3 3.4 4.1 3.3 3.6 Non-current liabilities: Deferred tax liabilities 0.1 0.1 0.2 0.4 0.4 0.4 0.1 Other long-term liabilities - - - 0.1 - - - Total liabilities 4.9 10.5 5.5 3.9 4.5 3.7 3.7 Equity: Common stock 0.1 0.1 0.1 0.1 0.1 0.1 0.1 Additional paid-in capital 19.9 20.2 20.9 19.4 19.5 19.5 19.7 Retained earnings 1.9 4.9 6.4 1.6 1.4 1.6 1.6 Total Equity 21.9 25.2 27.4 21.1 21.0 21.2 21.4 Total Liabilities & Stockholders' Equity 26.8$ 35.7$ 32.9$ 25.0$ 25.5$ 24.9$ 25.1$ 2018 2017 Unaudited Unaudited

Statement of Cash Flows (Quarterly) © 2018 RF Industries Ltd. | 27 Q1 Q2 Q3 YTD Q1 Q2 Q3 Q4 YTD (in millions) Audited Operating Activities: Net income 0.5$ 3.2$ 1.7$ 5.4$ (0.2)$ 0.1$ 0.2$ 0.3$ 0.4$ Adjustments to reconcile net income to net cash provided (used) by operating activities: Depreciation and amortization 0.2 0.2 0.2 0.6 0.2 0.2 0.3 0.2 0.9 Stock based compensation expense 0.1 - 0.1 0.2 0.1 - - 0.1 0.2 Deferred Income Taxes - - 0.1 0.1 - - - (0.3) (0.3) Changes in operating assets and liabilities: Trade accounts receivable (1.5) (6.4) 5.9 (2.0) 0.3 (0.8) 0.7 (0.1) 0.1 Inventories (0.7) (0.2) 0.2 (0.7) (0.5) (0.1) 0.2 0.3 (0.1) Other current assets - 0.2 (0.3) (0.1) (0.1) 0.1 0.7 - 0.7 Other long-term assets - - - - - - - 0.1 0.1 Accounts payable 0.7 3.8 (4.0) 0.5 0.2 0.5 (0.6) 0.1 0.2 Income tax receivable/payable 0.1 0.4 (0.5) - - - - - - Accrued expenses 0.4 1.3 (0.5) 1.2 (0.8) 0.2 - 0.1 (0.5) Other long-term liabilities - - - - - (0.1) - - (0.1) Net cash provided by (used in) operating activities (0.2) 2.5 2.9 5.2 (0.8) 0.1 1.5 0.8 1.6 Investing Activities: Capital expenditures - - (0.1) (0.1) - - (0.1) (0.1) (0.2) Net cash used in investing activities - - (0.1) (0.1) - - (0.1) (0.1) (0.2) Financing Activities: Proceeds from exercise of stock options 0.2 0.3 0.5 1.0 - - - - - Dividends paid (0.1) (0.2) (0.2) (0.5) (0.1) (0.2) (0.2) (0.2) (0.7) Net cash provided by (used in) financing activities 0.1 0.1 0.3 0.5 (0.1) (0.2) (0.2) (0.2) (0.7) Net increase (decrease) in cash and cash equivalents (0.1) 2.6 3.1 5.6 (0.9) (0.1) 1.2 0.5 0.7 Cash and cash equivalents at beginning of period 6.0 5.9 8.5 6.0 5.3 4.4 4.3 5.5 5.3 Cash and cash equivalents at end of period 5.9$ 8.5$ 11.6$ 11.6$ 4.4$ 4.3$ 5.5$ 6.0$ 6.0$ 2018 2017 Unaudited Unaudited
© 2018 RF Industries Ltd. | 28

Income Statement © 2018 RF Industries Ltd. | 29 2018 2017 2016 2015 Q3 YTD Full Year Full Year Full Year (in millions) Unaudited Audited Audited Audited Net sales 40.3$ 23.0$ 21.6$ 22.5$ Cost of sales 26.2 16.0 15.3 13.8 Gross profit 14.1 7.0 6.3 8.7 Operating expenses: Engineering 1.2 0.8 0.8 0.9 Selling and general 6.6 6.0 7.9 7.2 Goodwill and other intangible asset impairment - - 2.8 - Total operating expenses 7.8 6.8 11.5 8.1 Pretax income 6.3 0.2 (5.2) 0.6 Provision for income taxes 1.2 - (0.7) 0.2 Income (loss) from continuing operations 5.1 0.2 (4.5) 0.4 Income from discontinued operations, net of tax 0.3 0.2 0.4 0.6 Consolidated net income (loss) 5.4 0.4 (4.1) 1.0 Diluted earnings per share Continuing operations 0.54$ 0.02$ (0.51)$ 0.04$ Discontinued operations 0.03 0.02 0.05 0.07 Net income (loss) per share 0.57$ 0.04$ (0.46)$ 0.11$ Weighted average shares outstanding Diluted 9,442,612 8,915,764 8,786,510 8,862,217

Balance Sheet © 2018 RF Industries Ltd. | 30 July 31, 2018 2017 2016 2015 (in millions) Unaudited Audited Audited Audited ASSETS: Current assets: Cash and cash equivalents 10.5$ 5.2$ 4.3$ 6.3$ Trade accounts receivable, net 5.1 2.9 2.5 2.9 Inventories 6.3 5.6 5.4 6.5 Other current assets 0.8 0.5 1.5 0.8 Deferred tax assets - - - 0.4 Current assets held for sale 2.5 2.6 3.2 2.9 Total current assets 25.2 16.8 16.9 19.8 Non-current assets: Property and equipment, net 0.5 0.6 0.6 0.8 Goodwill 1.3 1.3 1.3 4.0 Intangibles, net 1.4 1.6 1.9 2.3 Non-amortizable intangibles 0.7 0.7 0.7 0.8 Other LT assets - 0.1 0.1 - Noncurrent assets held for sale 3.8 4.0 4.4 4.6 Total Assets 32.9$ 25.1$ 25.9$ 32.3$ LIABILITIES AND STOCKHOLDERS' EQUITY: Current liabilities: Accounts payable 1.4$ 1.0$ 0.6$ 1.0$ Accrued expenses 3.2 1.8 2.3 2.3 Current liabilities held for sale 0.7 0.8 1.1 1.1 Total current liabilities 5.3 3.6 4.0 4.4 Non-current liabilities: Deferred tax liabilities 0.2 0.1 0.4 1.1 Other long-term liabilities - - 0.1 0.4 Total liabilities 5.5 3.7 4.5 5.9 Equity: Common stock 0.1 0.1 0.1 0.1 Additional paid-in capital 20.9 19.7 19.4 19.1 Retained earnings 6.4 1.6 1.9 7.2 Total Equity 27.4 21.4 21.4 26.4 Total Liabilities & Stockholders' Equity 32.9$ 25.1$ 25.9$ 32.3$ October 31,
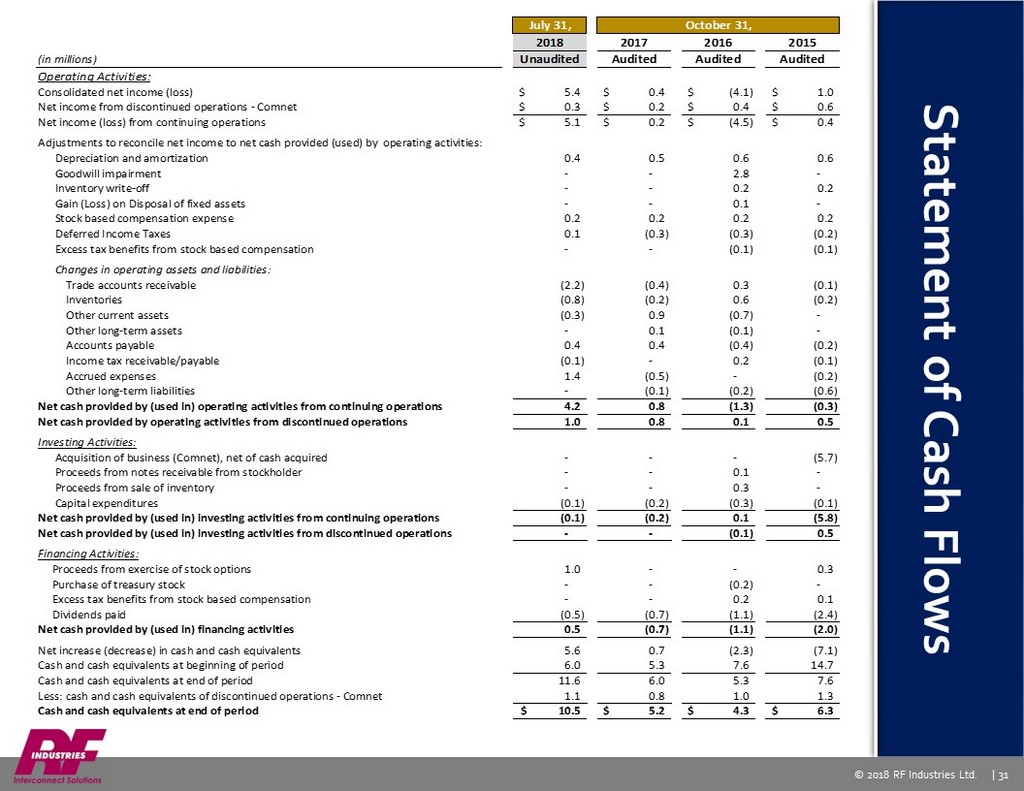
Statement of Cash Flows © 2018 RF Industries Ltd. | 31 July 31, 2018 2017 2016 2015 (in millions) Unaudited Audited Audited Audited Operating Activities: Consolidated net income (loss) 5.4$ 0.4$ (4.1)$ 1.0$ Net income from discontinued operations - Comnet 0.3$ 0.2$ 0.4$ 0.6$ Net income (loss) from continuing operations 5.1$ 0.2$ (4.5)$ 0.4$ Adjustments to reconcile net income to net cash provided (used) by operating activities: Depreciation and amortization 0.4 0.5 0.6 0.6 Goodwill impairment - - 2.8 - Inventory write-off - - 0.2 0.2 Gain (Loss) on Disposal of fixed assets - - 0.1 - Stock based compensation expense 0.2 0.2 0.2 0.2 Deferred Income Taxes 0.1 (0.3) (0.3) (0.2) Excess tax benefits from stock based compensation - - (0.1) (0.1) Changes in operating assets and liabilities: Trade accounts receivable (2.2) (0.4) 0.3 (0.1) Inventories (0.8) (0.2) 0.6 (0.2) Other current assets (0.3) 0.9 (0.7) - Other long-term assets - 0.1 (0.1) - Accounts payable 0.4 0.4 (0.4) (0.2) Income tax receivable/payable (0.1) - 0.2 (0.1) Accrued expenses 1.4 (0.5) - (0.2) Other long-term liabilities - (0.1) (0.2) (0.6) Net cash provided by (used in) operating activities from continuing operations 4.2 0.8 (1.3) (0.3) Net cash provided by operating activities from discontinued operations 1.0 0.8 0.1 0.5 Investing Activities: Acquisition of business (Comnet), net of cash acquired - - - (5.7) Proceeds from notes receivable from stockholder - - 0.1 - Proceeds from sale of inventory - - 0.3 - Capital expenditures (0.1) (0.2) (0.3) (0.1) Net cash provided by (used in) investing activities from continuing operations (0.1) (0.2) 0.1 (5.8) Net cash provided by (used in) investing activities from discontinued operations - - (0.1) 0.5 Financing Activities: Proceeds from exercise of stock options 1.0 - - 0.3 Purchase of treasury stock - - (0.2) - Excess tax benefits from stock based compensation - - 0.2 0.1 Dividends paid (0.5) (0.7) (1.1) (2.4) Net cash provided by (used in) financing activities 0.5 (0.7) (1.1) (2.0) Net increase (decrease) in cash and cash equivalents 5.6 0.7 (2.3) (7.1) Cash and cash equivalents at beginning of period 6.0 5.3 7.6 14.7 Cash and cash equivalents at end of period 11.6 6.0 5.3 7.6 Less: cash and cash equivalents of discontinued operations - Comnet 1.1 0.8 1.0 1.3 Cash and cash equivalents at end of period 10.5$ 5.2$ 4.3$ 6.3$ October 31,
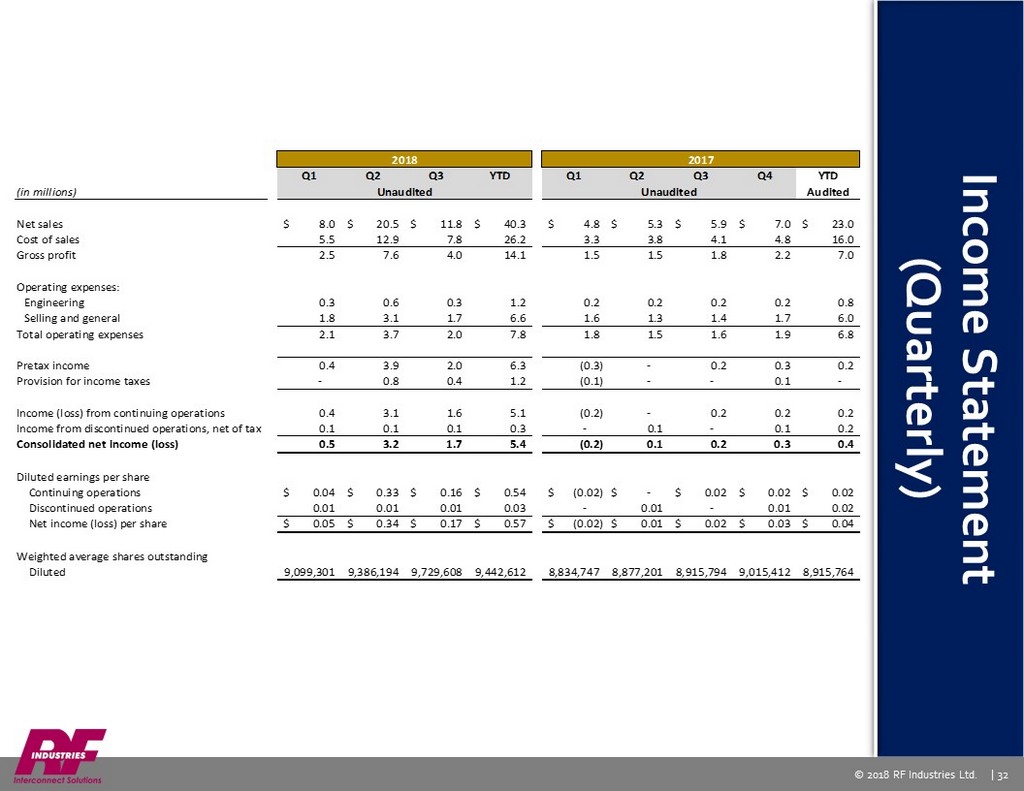
Income Statement (Quarterly) © 2018 RF Industries Ltd. | 32 Q1 Q2 Q3 YTD Q1 Q2 Q3 Q4 YTD (in millions) Audited Net sales 8.0$ 20.5$ 11.8$ 40.3$ 4.8$ 5.3$ 5.9$ 7.0$ 23.0$ Cost of sales 5.5 12.9 7.8 26.2 3.3 3.8 4.1 4.8 16.0 Gross profit 2.5 7.6 4.0 14.1 1.5 1.5 1.8 2.2 7.0 Operating expenses: Engineering 0.3 0.6 0.3 1.2 0.2 0.2 0.2 0.2 0.8 Selling and general 1.8 3.1 1.7 6.6 1.6 1.3 1.4 1.7 6.0 Total operating expenses 2.1 3.7 2.0 7.8 1.8 1.5 1.6 1.9 6.8 Pretax income 0.4 3.9 2.0 6.3 (0.3) - 0.2 0.3 0.2 Provision for income taxes - 0.8 0.4 1.2 (0.1) - - 0.1 - Income (loss) from continuing operations 0.4 3.1 1.6 5.1 (0.2) - 0.2 0.2 0.2 Income from discontinued operations, net of tax 0.1 0.1 0.1 0.3 - 0.1 - 0.1 0.2 Consolidated net income (loss) 0.5 3.2 1.7 5.4 (0.2) 0.1 0.2 0.3 0.4 Diluted earnings per share Continuing operations 0.04$ 0.33$ 0.16$ 0.54$ (0.02)$ -$ 0.02$ 0.02$ 0.02$ Discontinued operations 0.01 0.01 0.01 0.03 - 0.01 - 0.01 0.02 Net income (loss) per share 0.05$ 0.34$ 0.17$ 0.57$ (0.02)$ 0.01$ 0.02$ 0.03$ 0.04$ Weighted average shares outstanding Diluted 9,099,301 9,386,194 9,729,608 9,442,612 8,834,747 8,877,201 8,915,794 9,015,412 8,915,764 2018 2017 Unaudited Unaudited

Balance Sheet (Quarterly) © 2018 RF Industries Ltd. | 33 Jan. 31 Apr. 30 Jul. 31 Jan. 31 Apr. 30 Jul. 31 Oct. 31 (in millions) Audited ASSETS: Current assets: Cash and cash equivalents 4.9$ 7.1$ 10.5$ 3.3$ 3.4$ 4.4$ 5.2$ Trade accounts receivable, net 4.0 10.9 5.1 2.4 2.8 2.6 2.9 Inventories 6.3 6.6 6.3 5.8 5.8 5.8 5.6 Other current assets 0.7 0.5 0.8 1.6 1.5 0.8 0.5 Current assets held for sale 2.9 2.8 2.5 3.1 3.5 2.9 2.6 Total current assets 18.8 27.9 25.2 16.2 17.0 16.5 16.8 Non-current assets: Property and equipment, net 0.5 0.5 0.5 0.6 0.5 0.5 0.6 Goodwill 1.3 1.3 1.3 1.3 1.3 1.3 1.3 Intangibles, net 1.6 1.5 1.4 1.8 1.8 1.7 1.6 Non-amortizable intangibles 0.7 0.7 0.7 0.7 0.7 0.7 0.7 Other LT assets - - - 0.1 0.1 0.1 0.1 Noncurrent asset held for sale 3.9 3.8 3.8 4.3 4.1 4.1 4.0 Total Assets 26.8$ 35.7$ 32.9$ 25.0$ 25.5$ 24.9$ 25.1$ LIABILITIES AND STOCKHOLDERS' EQUITY: Current liabilities: Accounts payable 1.6$ 5.7$ 1.4$ 0.8$ 0.8$ 0.7$ 1.0$ Accrued expenses 2.4 4.1 3.2 1.7 1.7 1.8 1.8 Current liabilities held for sale 0.8 0.6 0.7 0.9 1.6 0.8 0.8 Total current liabilities 4.8 10.4 5.3 3.4 4.1 3.3 3.6 Non-current liabilities: Deferred tax liabilities 0.1 0.1 0.2 0.4 0.4 0.4 0.1 Other long-term liabilities - - - 0.1 - - - Total liabilities 4.9 10.5 5.5 3.9 4.5 3.7 3.7 Equity: Common stock 0.1 0.1 0.1 0.1 0.1 0.1 0.1 Additional paid-in capital 19.9 20.2 20.9 19.4 19.5 19.5 19.7 Retained earnings 1.9 4.9 6.4 1.6 1.4 1.6 1.6 Total Equity 21.9 25.2 27.4 21.1 21.0 21.2 21.4 Total Liabilities & Stockholders' Equity 26.8$ 35.7$ 32.9$ 25.0$ 25.5$ 24.9$ 25.1$ 2018 2017 UnauditedUnaudited

Statement of Cash Flows (Quarterly) © 2018 RF Industries Ltd. | 34 Q1 Q2 Q3 YTD Q1 Q2 Q3 Q4 YTD (in millions) Audited Operating Activities: Consolidated net income (loss) 0.5$ 3.2$ 1.7$ 5.4$ (0.2)$ 0.1$ 0.2$ 0.3$ 0.4$ Net income from discontinued operations - Comnet 0.1$ 0.1$ 0.1$ 0.3$ -$ 0.1$ -$ 0.1$ 0.2$ Net income (loss) from continuing operations 0.4$ 3.1$ 1.6$ 5.1$ (0.2)$ -$ 0.2$ 0.2$ 0.2$ Adjustments to reconcile net income to net cash provided (used) by operating activities: Depreciation and amortization 0.1 0.1 0.2 0.4 0.1 0.1 0.2 0.1 0.5 Stock based compensation expense 0.1 - 0.1 0.2 0.1 - - 0.1 0.2 Deferred Income Taxes - - 0.1 0.1 - - - (0.3) (0.3) Changes in operating assets and liabilities: Trade accounts receivable (1.1) (6.9) 5.8 (2.2) 0.1 (0.4) 0.1 (0.2) (0.4) Inventories (0.8) (0.3) 0.3 (0.8) (0.5) - - 0.3 (0.2) Other current assets (0.2) 0.2 (0.3) (0.3) (0.1) 0.1 0.7 0.2 0.9 Other long-term assets - - - - - 0.1 - - 0.1 Accounts payable 0.6 4.1 (4.3) 0.4 0.2 - - 0.2 0.4 Income tax receivable/payable - 0.4 (0.5) (0.1) - - - - - Accrued expenses 0.6 1.3 (0.5) 1.4 (0.6) 0.1 - - (0.5) Other long-term liabilities - - - - - (0.1) - - (0.1) Net cash provided by (used in) operating activities from continuing operations (0.3) 2.0 2.5 4.2 (0.9) (0.1) 1.2 0.6 0.8 Net cash provided by operating activities from discontinued operations 0.1 0.4 0.5 1.0 0.1 0.2 0.3 0.2 0.8 Investing Activities: Capital expenditures - - (0.1) (0.1) - - (0.1) (0.1) (0.2) Net cash used in investing activities from continuing operations - - (0.1) (0.1) - - (0.1) (0.1) (0.2) Net cash used in investing activities from discontinued operations - - - - - - - - - Financing Activities: Proceeds from exercise of stock options 0.2 0.3 0.5 1.0 - - - - - Dividends paid (0.1) (0.2) (0.2) (0.5) (0.1) (0.2) (0.2) (0.2) (0.7) Net cash provided by (used in) financing activities 0.1 0.1 0.3 0.5 (0.1) (0.2) (0.2) (0.2) (0.7) Net increase (decrease) in cash and cash equivalents (0.1) 2.5 3.2 5.6 (0.9) (0.1) 1.2 0.5 0.7 Cash and cash equivalents at beginning of period 6.0 5.9 8.5 6.0 5.3 4.4 4.3 5.5 5.3 Cash and cash equivalents at end of period 5.9 8.4 11.7 11.6 4.4 4.3 5.5 6.0 6.0 Less: cash and cash equivalents of discontinued operations - Comnet 1.0 1.3 1.2 1.1 1.1 0.9 1.1 0.8 0.8 2018 2017 Unaudited Unaudited