Attached files
| file | filename |
|---|---|
| 8-K - 8-K - ABERCROMBIE & FITCH CO /DE/ | q32018form8-kearningsrelea.htm |
| EX-99.4 - EXHIBIT 99.4 - ABERCROMBIE & FITCH CO /DE/ | q32018earningstranscript.htm |
| EX-99.2 - EXHIBIT 99.2 - ABERCROMBIE & FITCH CO /DE/ | q32018quarterlyhistory.htm |
| EX-99.1 - EXHIBIT 99.1 - ABERCROMBIE & FITCH CO /DE/ | q32018earningsrelease.htm |

INVESTOR PRESENTATION THIRD QUARTER 2018

SAFE HARBOR STATEMENT UNDER THE PRIVATE SECURITIES LITIGATION REFORM ACT OF 1995 A&F cautions that any forward-looking statements (as such term is defined in the Private Securities Litigation Reform Act of 1995) contained in this presentation or made by management or spokespeople of A&F involve risks and uncertainties and are subject to change based on various important factors, many of which may be beyond the company's control. Words such as "estimate," "project," "plan," "believe," "expect," "anticipate," "intend," and similar expressions may identify forward-looking statements. Except as may be required by applicable law, we assume no obligation to publicly update or revise our forward-looking statements. The factors disclosed in "ITEM 1A. RISK FACTORS" of A&F's Annual Report on Form 10-K for the fiscal year ended February 3, 2018 and in A&F's subsequently filed quarterly reports on Form 10-Q, in some cases have affected, and in the future could affect, the company's financial performance and could cause actual results for the 2018 fiscal year and beyond to differ materially from those expressed or implied in any of the forward-looking statements included in this presentation or otherwise made by management. OTHER INFORMATION The following presentation includes certain adjusted non-GAAP financial measures. Additional details about non-GAAP financial measures and a reconciliation of GAAP financial measures to non-GAAP financial measures is included in the news release issued by the company on November 29, 2018, which is available in the "Investors" section of the company's website, located at corporate.abercrombie.com. As used in the presentation, "GAAP" refers to accounting principles generally accepted in the United States of America. As used in the presentation, "Abercrombie" refers to the company's Abercrombie & Fitch and abercrombie kids brands. All dollar and share amounts are in 000’s unless otherwise stated. Sub-totals and totals may not foot due to rounding. Net income and net income per share financial measures included herein are attributable to Abercrombie & Fitch Co., excluding net income attributable to noncontrolling interests. 2

OUR JOURNEY STABILIZE TRANSFORM AND GROW ACCELERATE GROWTH • BUILT THE FOUNDATION • COMPARABLE SALES GROWTH • EXPAND GLOBALLY • RETURNED TO GROWTH • GROSS PROFIT RATE EXPANSION • TAKE SHARE IN THE U.S. • CENTERED AROUND THE CUSTOMER • LEVERAGE EXPENSES • DEVELOP PLAYBOOKS TO ALIGN PRODUCT, VOICE & EXPERIENCE 3

OUR TRANSFORMATION INITIATIVES CONTINUED GLOBAL STORE NETWORK OPTIMIZATION • RIGHTSIZING STORE FLEET AND ADAPTING TO THE EVOLVING ROLE OF THE STORE AS CUSTOMERS' SHOPPING PREFERENCES SHIFT ENHANCING DIGITAL AND OMNICHANNEL CAPABILITIES • CREATING BEST-IN-CLASS CUSTOMER EXPERIENCES WHILE GROWING PROFITABLY ACROSS CHANNELS CONCEPT TO CUSTOMER - SUPPLY CHAIN SPEED & EFFICIENCY • INVEST IN CAPABILITIES TO POSITION SUPPLY CHAIN FOR GREATER SPEED, AGILITY AND FLEXIBILITY • LEVERAGE DATA AND ANALYTICS TO OFFER THE RIGHT PRODUCT AT THE RIGHT TIME AND THE RIGHT PRICE OPTIMIZATION OF MARKETING INVESTMENTS • BETTER LEVERAGE DATA, INCLUDING OUR LOYALTY PROGRAMS, TO ENGAGE WITH CUSTOMERS ACROSS CHANNELS • DRIVE MORE EFFICIENT AND EFFECTIVE MARKETING SPEND 4

OUR FISCAL 2020 TARGETS LOW SINGLE-DIGIT SALES CAGR • POSITIVE COMPARABLE SALES • GLOBAL MARKET EXPANSION DOUBLE FISCAL 2017 ADJUSTED NON-GAAP EBIT MARGIN OF 2.9% • MODEST GROSS PROFIT RATE EXPANSION • OPERATING EXPENSE LEVERAGE 5

Q3 2018 CEO COMMENTARY "We are pleased with our third quarter performance, our fifth consecutive quarter of positive comparable sales, with growth across both of our brands. We delivered 3% comparable sales growth on top of 4% last year, with continued gross profit rate stabilization. Our strong U.S omnichannel business, and 16% global digital sales growth, confirm that our playbooks are working. As expected, we had a solid start to the holiday season, demonstrating the effectiveness of our continued focus on the customer. We are well-positioned to deliver top-line growth, gross profit rate expansion and operating expense leverage for the full year." Fran Horowitz, Chief Executive Officer 6

Q3 P&L SUMMARY % OF NET % OF NET 2018 SALES 2017 SALES NET SALES $861,194 100.0% $859,112 100.0% GROSS PROFIT 527,819 61.3% 526,627 61.3% OPERATING EXPENSE 489,696 56.9% 503,957 58.7% OTHER OPERATING INCOME, NET (1,557) (0.2)% (70) 0.0% OPERATING INCOME 39,680 4.6% 22,740 2.6% INTEREST EXPENSE, NET 2,857 0.3% 4,571 0.5% INCOME BEFORE INCOME TAXES 36,823 4.3% 18,169 2.1% INCOME TAX EXPENSE 12,047 1.4% 7,553 0.9% NET INCOME $23,919 2.8% $10,075 1.2% NET INCOME PER SHARE BASIC $0.36 $0.15 DILUTED $0.35 $0.15 WEIGHTED-AVERAGE SHARES OUTSTANDING BASIC 66,818 68,512 DILUTED 68,308 69,425 7

Q3 ADJUSTED P&L SUMMARY* % OF NET % OF NET 2018 SALES 2017 SALES NET SALES $861,194 100.0% $859,112 100.0% GROSS PROFIT 527,819 61.3% 526,627 61.3% OPERATING EXPENSE 492,701 57.2% 489,407 57.0% OTHER OPERATING INCOME, NET (1,557) (0.2)% (70) 0.0% OPERATING INCOME 36,675 4.3% 37,290 4.3% INTEREST EXPENSE, NET 2,857 0.3% 4,571 0.5% INCOME BEFORE INCOME TAXES 33,818 3.9% 32,719 3.8% INCOME TAX EXPENSE 10,578 1.2% 11,670 1.4% NET INCOME $22,383 2.6% $20,508 2.4% NET INCOME PER SHARE BASIC $0.33 $0.30 DILUTED $0.33 $0.30 WEIGHTED-AVERAGE SHARES OUTSTANDING BASIC 66,818 68,512 DILUTED 68,308 69,425 * The Q3 Adjusted P&L Summary for the current and prior periods are presented on an adjusted non-GAAP basis, and excludes the effect of certain items set out on page 9. 8

Q3 ADJUSTED NON-GAAP RECONCILIATION 2018 EXCLUDED 2018 GAAP ITEMS NON-GAAP MARKETING, GENERAL & ADMINISTRATION (1) $117,181 $(3,005) $120,186 OPERATING INCOME 39,680 3,005 36,675 INCOME BEFORE INCOME TAXES 36,823 3,005 33,818 INCOME TAX EXPENSE (3) 12,047 1,469 10,578 NET INCOME $23,919 $1,536 $22,383 NET INCOME PER DILUTED SHARE $0.35 $0.02 $0.33 DILUTED WEIGHTED-AVERAGE SHARES OUTSTANDING 68,308 68,308 2017 EXCLUDED 2017 GAAP ITEMS NON-GAAP MARKETING, GENERAL & ADMINISTRATION (1) $124,533 $11,070 $113,463 ASSET IMPAIRMENT (2) 3,480 3,480 — OPERATING INCOME 22,740 (14,550) 37,290 INCOME BEFORE INCOME TAXES 18,169 (14,550) 32,719 INCOME TAX EXPENSE (3) 7,553 (4,117) 11,670 NET INCOME $10,075 $(10,433) $20,508 NET INCOME PER DILUTED SHARE $0.15 $(0.15) $0.30 DILUTED WEIGHTED-AVERAGE SHARES OUTSTANDING 69,425 69,425 (1) Excluded items consist of benefits of $3.0 million and charges of $11.1 million related to certain legal matters for the current and prior year, respectively. (2) Excluded items consist of store asset impairment charges of $3.5 million. (3) Excluded items consist of discrete net tax charges of $0.4 million related to the Tax Cuts and Jobs Act of 2017 for the current year, and the tax effect of excluded items, calculated as the difference between the tax provision on a GAAP basis and an adjusted non-GAAP basis. 9

Q3 NET SALES INCREASED TO $861M YTD DESPITE ADVERSE IMPACTS FROM THE CALENDAR SHIFT AND CHANGES IN FOREIGN CURRENCY ABERCROMBIE BRAND ABE40.9%RCRO MBIE 40.2% HOLLISTER ABERCROMBIE HOHOLLISTERLLISTER C CO.O. $515M $346M 59.1%59. 8% • 59.8% OF TOTAL NET SALES • 40.2% OF TOTAL NET SALES • NET SALES UP 1% FROM LAST YEAR • NET SALES DOWN 1% FROM LAST YEAR INTERNATIONAL ABERCROMBIE 40.2% 36.6% GEOGRAPHY HUNITEDOLLIST STATESER CO. 63.4%59 .8% UNITED STATES INTERNATIONAL $563M $299M • 65.3% OF TOTAL NET SALES • 34.7% OF TOTAL NET SALES • NET SALES UP 1% FROM LAST YEAR • NET SALES DOWN 2% FROM LAST YEAR 10

Q3 COMPARABLE SALES UP 3%* YTD EXCLUDING ADVERSE IMPACTS FROM THE CALENDAR SHIFT AND CHANGES IN FOREIGN CURRENCY EXCHANGE RATES ABERCROMBIE ABE40.9%RCRO MBIE 40.2% HOHOLLISTERLLISTER C CO.O. 59.1%59. 8% 4% 6% -3% HOLLISTER INTERNATIONAL UNITED STATES INTERNATIONAL ABERCROMBIE 40.2% 36.6% 1% ABERCROMBIE HUNITEDOLLIST STATESER CO. 63.4%59 .8% * Comparable sales are calculated on a constant currency basis and exclude revenue other than store and online sales. Due to the calendar shift resulting from the 53rd week in fiscal 2017, comparable sales for the third quarter ended November 3, 2018 are compared to the 13 weeks ended November 4, 2017. 11

Q3 OPERATING EXPENSE GAAP % OF NET GAAP % OF NET 2018 SALES 2017 SALES Δ bps (3) STORE OCCUPANCY (1) $154,593 18.0% $165,911 19.3% (130) ALL OTHER (2) 217,266 25.2% 210,033 24.4% 80 STORES AND DISTRIBUTION 371,859 43.2% 375,944 43.8% (60) MARKETING, GENERAL & ADMINISTRATIVE 117,181 13.6% 124,533 14.5% (90) ASSET IMPAIRMENT 656 0.1% 3,480 0.4% (30) TOTAL $489,696 56.9% $503,957 58.7% (180) NON-GAAP % OF NET NON-GAAP % OF NET 2018* SALES 2017* SALES Δ bps (3) STORE OCCUPANCY (1) $154,593 18.0% $165,911 19.3% (130) ALL OTHER (2) 217,266 25.2% 210,033 24.4% 80 STORES AND DISTRIBUTION 371,859 43.2% 375,944 43.8% (60) MARKETING, GENERAL & ADMINISTRATIVE 120,186 14.0% 113,463 13.2% 80 ASSET IMPAIRMENT 656 0.1% — —% 10 TOTAL $492,701 57.2% $489,407 57.0% 20 * Q3 adjusted non-GAAP operating expense for the current and prior periods are presented on an adjusted non-GAAP basis, and excludes the effect of certain items set out of page 9. (1) Includes rent, other landlord charges, utilities, depreciation and other occupancy expense. (2) Includes selling payroll, store management and support, other store expense, direct-to-consumer expense, and distribution center costs. (3) Rounded based on reported percentages. 12

SHARE REPURCHASES AND DIVIDENDS SHARE REPURCHASES NUMBER OF AVERAGE SHARES COST COST DIVIDENDS TOTAL Q1 2018 778.2 $18,670 $23.99 $13,642 $32,312 Q2 2018 969.1 25,000 25.80 13,554 38,554 Q3 2018 1,184.5 25,000 21.11 13,354 38,354 YEAR TO DATE 2018 2,931.7 $68,670 $23.42 $40,550 $109,220 SHARE REPURCHASES NUMBER OF AVERAGE SHARES COST COST DIVIDENDS TOTAL Q1 2017 — $— $— $13,554 $13,554 Q2 2017 — — — 13,605 13,605 Q3 2017 — — — 13,617 13,617 YEAR TO DATE 2017 — $— $— $40,776 $40,776 13

879 STORES GLOBALLY AS OF Q3 2018 EXCLUDING 14 INTERNATIONAL FRANCHISE STORES ACROSS BRANDS 120 18 CANADA EUROPE 684 9 48 UNITED STATES MIDDLE EAST ASIA 547 HOLLISTER 332 ABERCROMBIE 14

Q3 STORE COUNT ACTIVITY UNITED MIDDLE TOTAL COMPANY TOTAL STATES CANADA EUROPE ASIA EAST END OF Q2 2018 870 679 18 117 47 9 OPENINGS 11 7 — 3 1 — CLOSINGS (2) (2) — — — — END OF Q3 2018 879 684 18 120 48 9 HOLLISTER (1) END OF Q2 2018 540 396 11 100 28 5 OPENINGS 7 4 — 2 1 — CLOSINGS — — — — — — END OF Q3 2018 547 400 11 102 29 5 ABERCROMBIE (2) END OF Q2 2018 330 283 7 17 19 4 OPENINGS 4 3 — 1 — — CLOSINGS (2) (2) — — — — END OF Q3 2018 332 284 7 18 19 4 (1) Excludes eight and seven international franchise stores as of November 3, 2018 and August 4, 2018, respectively. (2) Locations with abercrombie kids carveouts within Abercrombie & Fitch stores are represented as a single store count. Excludes six international franchise stores as of each of November 3, 2018 and August 4, 2018. 15

Q3 NEW STORE OPENINGS BRAND CENTER CITY DATE DIVER CITY TOKYO, JAPAN 8/31/2018 SANTA ROSA SANTA ROSA, CALIFORNIA 9/14/2018 MALL AT UNIVERSITY TOWN CENTER SARASOTA, FLORIDA 9/14/2018 HOLLISTER SPRINGFIELD TOWN CENTER ALEXANDRIA, VIRGINIA 10/12/2018 GREEN ACRES VALLEY STREAM, NEW YORK 10/12/2018 OLYMPIA MUNICH, GERMANY 10/19/2018 WATERFRONT BREMEN BREMEN, GERMANY 10/26/2018 USC VILLAGE LOS ANGELES, CALIFORNIA 8/13/2018 A&F OSU GATEWAY DISTRICT COLUMBUS, OHIO 8/18/2018 TRAFFORD MANCHESTER, UNITED KINGDOM 9/4/2018 kids WILLOWBROOK WAYNE, NEW JERSEY 10/5/2018 16

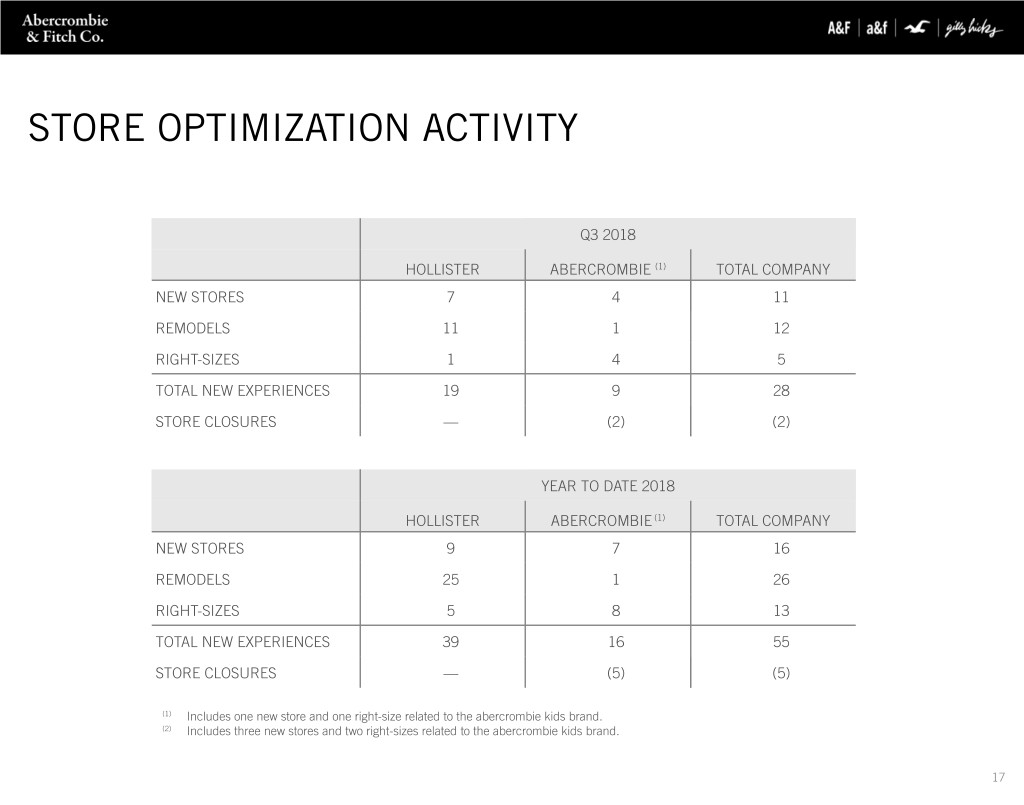
STORE OPTIMIZATION ACTIVITY Q3 2018 HOLLISTER ABERCROMBIE (1) TOTAL COMPANY NEW STORES 7 4 11 REMODELS 11 1 12 RIGHT-SIZES 1 4 5 TOTAL NEW EXPERIENCES 19 9 28 STORE CLOSURES — (2) (2) YEAR TO DATE 2018 HOLLISTER ABERCROMBIE (1) TOTAL COMPANY NEW STORES 9 7 16 REMODELS 25 1 26 RIGHT-SIZES 5 8 13 TOTAL NEW EXPERIENCES 39 16 55 STORE CLOSURES — (5) (5) (1) Includes one new store and one right-size related to the abercrombie kids brand. (2) Includes three new stores and two right-sizes related to the abercrombie kids brand. 17

FULL YEAR STORE OPTIMIZATION OUTLOOK WE PLAN TO DELIVER APPROXIMATELY 70 ENGAGING NEW CUSTOMER EXPERIENCES IN FISCAL 2018 THROUGH PROTOTYPES, NEW STORE FORMATS AND REMODELS WHILE ALSO RIGHT-SIZING OR CLOSING SOME OF OUR LESS PRODUCTIVE STORES. HOLLISTER ABERCROMBIE (1) TOTAL COMPANY NEW STORES 13 9 22 REMODELS 28 1 29 RIGHT-SIZES 5 11 16 TOTAL NEW EXPERIENCES 46 21 67 STORE CLOSURES (2) UP TO 40 (1) Includes six new abercrombie kids experiences, including three new stores and three right-sizes. (2) Final number dependent on lease negotiations and business outcomes. 18

Q4 2018 OUTLOOK OUTLOOK NET SALES (1) DOWN MID SINGLE DIGITS CALENDAR SHIFT & LOSS OF FISCAL 2017'S 53RD WEEK $60M ADVERSE IMPACT TO NET SALES CHANGES IN FOREIGN CURRENCY $15M ADVERSE IMPACT TO NET SALES COMPARABLE SALES (2) UP LOW SINGLE DIGITS GROSS PROFIT RATE (3) FLAT TO UP SLIGHTLY GAAP OPERATING EXPENSE (4) DOWN 1% TO 2% OTHER OPERATING INCOME, NET APPROXIMATELY $2M EFFECTIVE TAX RATE MID-TO-UPPER 20S WEIGHTED AVERAGE DILUTED SHARES (5) APPROXIMATELY 68M SHARES (1) Includes the adverse impacts from the calendar shift and loss of 2017's 53rd week of approximately $60 million and from changes in foreign currency exchange rates of approximately $15 million. (2) Comparable sales are calculated on a constant currency basis. Due to the calendar shift resulting from the 53rd week in fiscal 2017, comparable sales for the 13 weeks ended February 2, 2019 are compared to the 13 weeks ended February 3, 2018. (3) As compared to fiscal 2017 gross profit rate of 58.4%. (4) As compared to fiscal 2017 adjusted non-GAAP operating expense of $561 million. Excludes other operating income, net. (5) Excludes the effect of potential share buybacks. 19

FULL YEAR 2018 OUTLOOK PREVIOUS OUTLOOK CURRENT OUTLOOK NET SALES (1) UP 2% TO 4% * LOSS OF FISCAL 2017'S 53RD WEEK $40M ADVERSE IMPACT TO NET SALES * CHANGES IN FOREIGN CURRENCY $20M BENEFIT TO NET SALES $10M BENEFIT TO NET SALES COMPARABLE SALES (2) UP 2% TO 4% * GROSS PROFIT RATE (3) UP SLIGHTLY * GAAP OPERATING EXPENSE (4) UP APPROXIMATELY 2.5% UP APPROXIMATELY 2% NON-GAAP OPERATING EXPENSE (5) UP APPROXIMATELY 1.7% UP APPROXIMATELY 1.5% WEIGHTED AVERAGE DILUTED SHARES (6) APPROXIMATELY 69M SHARES * EFFECTIVE TAX RATE MID-TO-UPPER 30S * CAPITAL EXPENDITURES $135M TO $140M APPROXIMATELY $145M * No change from the previous outlook. (1) Includes the adverse impact from the loss of 2017's 53rd week of approximately $40 million, partially offset by benefits from changes in foreign currency exchange rates of approximately $10 million. (2) Comparable sales are calculated on a constant currency basis. Due to the calendar shift resulting from the 53rd week in fiscal 2017, comparable sales for the 52 weeks ended February 2, 2019 are compared to the 52 weeks ended February 3, 2018. (3) As compared to fiscal 2017 gross profit rate of 59.7%. (4) Excludes other operating income, net. Relative to previous outlook, the current outlook includes third quarter pre-tax benefits of $3.0 million related to certain legal matters. (5) Excludes other operating income, net, and the effect of approximately $11 million of net pre-tax charges this year related to store asset impairment and certain legal matters. (6) Excludes the effect of potential share buybacks. 20

APPENDIX 21

MARKETING INITIATIVES WON BILLBOARD LIVE MUSIC AWARD FOR COLLABORATION WITH KHALID ABERCROMBIE LAUNCHED FULLY INTEGRATED MARKETING CAMPAIGN FOR KEY 22 OUTERWEAR PRODUCT, THE ULTRA COAT ABERCROMBIE KIDS ANNOUNCED PARTNERSHIP WITH GIULIANA RANCIC

CONTINUING TO EXPAND GILLY HICKS GLOBALLY THROUGH THE ROLLOUT OF CARVEOUTS, SIDE-BY-SIDE STORES AND LAUNCHING THE BRAND ON ALIBABA'S TMALL 23

ROLLING OUT SIDE-BY-SIDE CONCEPT STORES RECENT GILLY HICKS CARVEOUTS INCLUDE: Easton Town Center in Columbus, Ohio Glendale Galleria in Glendale, California Diver City in Tokyo, Japan Ernst August Galerie in Hanover, Germany International APM in Shanghai, China 24 CONTINUING TO REMODEL & OPEN NEW STORES WITH CARVEOUTS CELEBRATED GILLY HICKS T-MALL LAUNCH AT A POP UP SHOP IN SHANGHAI

ABERCROMBIE KIDS CREATING ENGAGING EXPERIENCES THROUGH PROTOTYPE STORES WITH THE MOST RECENT OPENING AT EASTON TOWN CENTER IN COLUMBUS, OHIO 25

DEVELOPING A LOCAL CUSTOMER BASE INTERNATIONALLY BY LEVERAGING OUR GROWING LOYALTY PROGRAMS AND OPENING SMALLER, MALL-BASED PROTOTYPE STORES IN EUROPE, INCLUDING OUR NEW STORE IN MANCHESTER WHICH OPENED DURING THE THIRD QUARTER 26

