Attached files
| file | filename |
|---|---|
| 8-K - FORM 8-K - Charah Solutions, Inc. | d663498d8k.htm |

Investor Presentation November 2018 Exhibit 99.1
Disclaimer Forward Looking Statements This presentation and our accompanying comments include “forward-looking statements” within the meaning of the Private Securities Litigation Reform Act of 1995. These forward-looking statements may be identified by words such as “may,” “will,” “expect,” “intend,” “anticipate,” “believe,” “estimate,” “plan,” “project,” “could,” “should,” “would,” “continue,” “seek,” “target,” “guidance,” “outlook,” “if current trends continue,” “optimistic,” “forecast” and other similar words. Such statements include, but are not limited to, statements about future financial and operating results, the Company’s plans, objectives, estimates, expectations, and intentions, estimates and strategies for the future, and other statements that are not historical facts. These forward-looking statements are based on our current objectives, beliefs and expectations, and they are subject to significant risks and uncertainties that may cause actual results and financial position and timing of certain events to differ materially from the information in the forward-looking statements. These risks and uncertainties include, but are not limited to, those set forth in the Company’s Registration Statement on Form S-1 filed on June 4, 2018 with the Securities and Exchange Commission (“SEC”) and in our other reports filed from time to time with the SEC. There may be other factors of which we are not currently aware that may affect matters discussed in the forward-looking statements and may also cause actual results to differ materially from those discussed. We do not assume any obligation to publicly update or supplement any forward-looking statement to reflect actual results, changes in assumptions or changes in other factors affecting these forward-looking statements other than as required by law. Any forward-looking statements speak only as of the date hereof or as of the dates indicated in the statements. Non-GAAP Financial Measures Included in this presentation are certain non-GAAP financial measures designed to complement the financial information presented in accordance with GAAP because management believes such measures are useful to investors. The non-GAAP financial measures are not determined in accordance with GAAP and should not be considered a substitute for performance measures determined in accordance with GAAP. The calculations of the non-GAAP financial measures are subjective, based on management’s belief as to which items should be included or excluded in order to provide the most reasonable and comparable view of the underlying operating performance of the business. We may, from time to time, modify the amounts used to determine our non-GAAP financial measures. When applicable, management’s discussion and analysis includes specific consideration for items that comprise the reconciliations of its non-GAAP financial measures. Reconciliation of non-GAAP financial measures are included in the Supplemental Slides in the Appendix of this presentation. Market & Industry Data This presentation includes industry and trade data, forecasts and information that was prepared based, in part, upon data, forecasts and information obtained from independent trade associations, industry publications and surveys and other independent sources available to the Company. Some data also are based on the Company’s good faith estimates, which are derived from management’s knowledge of the industry and from independent sources. These third-party publications and surveys generally state that the information included therein has been obtained from sources believed to be reliable, but that the publications and surveys can give no assurance as to the accuracy or completeness of such information. The Company has not independently verified any of the data from third-party sources nor has it ascertained the underlying economic assumptions on which such data are based.
Why Invest in Charah Solutions? Valuation Discount Stock trading at a substantial discount to peer group averages of 11.2x – 17.1x Expect double-digit free cash flow yield in 2019 Newly public company; market does not yet appreciate growth potential Substantial Growth Potential More than $3 billion in bids outstanding (multi-year revenue opportunity); timing 2H 2019 and beyond New technology offering expected to provide competitive advantage in 2H 2019 and beyond Improving Cash Flow and Balance Sheet Expected significant free cash flow generation in 2019 (Brickhaven contract completion) Ample liquidity ($36 million as of 9/30/18; to increase by mid-2019) Plan to further reduce debt and have excess cash available for growth Net leverage ratio of 2.5x (as of 9/30/18) LTM EV/EBITDA average multiple is 12.9x (Environmental Services 11.6x, Industrial Services 11.8x, Misc. Commercial Services 17.1x, Construction Materials 11.2x). Source: Factset 11/26/18 Based on closing stock price on November 23, 2018 and 3Q 2018 LTM Adjusted EBITDA of $96M Each 1-point Increase in EV / EBITDA Multiple ~ $3.30 / share or 50%2 Industry Comps Suggest Significant Upside Potential1
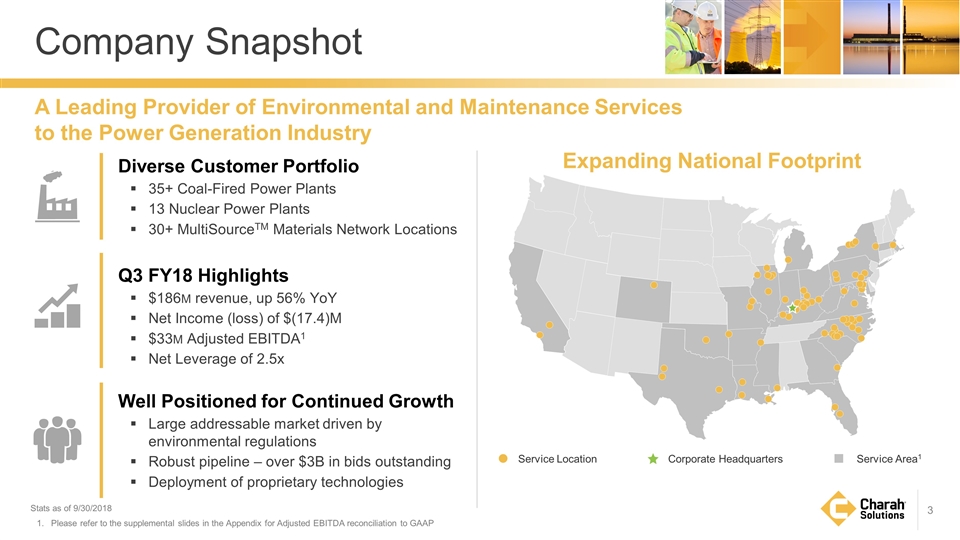
A Leading Provider of Environmental and Maintenance Services to the Power Generation Industry Service Location Corporate Headquarters Service Area1 Expanding National Footprint Diverse Customer Portfolio 35+ Coal-Fired Power Plants 13 Nuclear Power Plants 30+ MultiSourceTM Materials Network Locations Q3 FY18 Highlights $186M revenue, up 56% YoY Net Income (loss) of $(17.4)M $33M Adjusted EBITDA1 Net Leverage of 2.5x Well Positioned for Continued Growth Large addressable market driven by environmental regulations Robust pipeline – over $3B in bids outstanding Deployment of proprietary technologies Company Snapshot Stats as of 9/30/2018 Please refer to the supplemental slides in the Appendix for Adjusted EBITDA reconciliation to GAAP
Investment Highlights Contract-Based Financial Model Provides Long-Term Stability and Financial Protection Long-term partnerships with leading power generators; ~90% renewal rates in Fossil Services Cost-reimbursable or unit-price contracts; no commodity exposure; little cyclicality to business Strong balance sheet (net leverage of 2.5x) and ample liquidity; contract-related payment in 1H 2019 to enable further delevering and result in excess cash available for growth Leading Provider of Broad Suite of Services Industry-leading quality, safety and compliance record Provide services critical to continued power plant operations and environmental compliance Uniquely positioned with customers seeking to consolidate service providers Robust Growth Strategy with More than $3 Billion in Bids Outstanding Capitalize on growing need for remediation of coal ash Increase market share and expand range of service offerings Execute on technology deployment to enhance competitive position
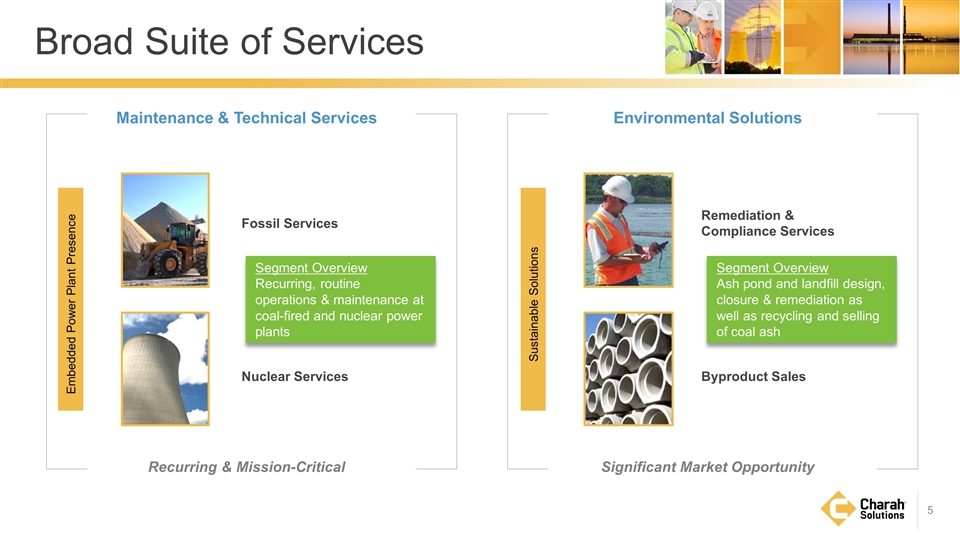
Byproduct Sales Remediation & Compliance Services Maintenance & Technical Services Recurring & Mission-Critical Broad Suite of Services Environmental Solutions Significant Market Opportunity Embedded Power Plant Presence Sustainable Solutions Nuclear Services Fossil Services Segment Overview Recurring, routine operations & maintenance at coal-fired and nuclear power plants Segment Overview Ash pond and landfill design, closure & remediation as well as recycling and selling of coal ash
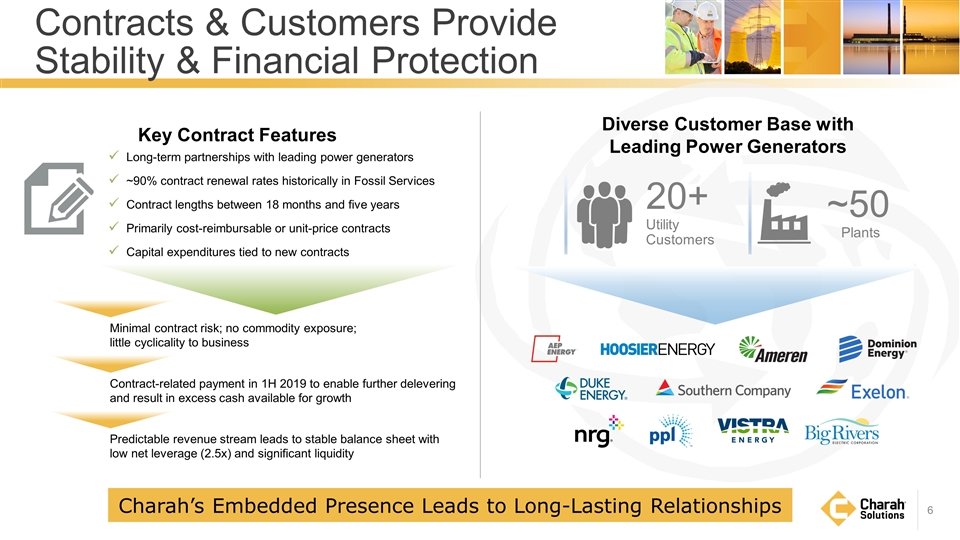
Diverse Customer Base with Leading Power Generators Key Contract Features Contracts & Customers Provide Stability & Financial Protection Charah’s Embedded Presence Leads to Long-Lasting Relationships 20+ Utility Customers ~50 Plants Long-term partnerships with leading power generators ~90% contract renewal rates historically in Fossil Services Contract lengths between 18 months and five years Primarily cost-reimbursable or unit-price contracts Capital expenditures tied to new contracts Minimal contract risk; no commodity exposure; little cyclicality to business Contract-related payment in 1H 2019 to enable further delevering and result in excess cash available for growth Predictable revenue stream leads to stable balance sheet with low net leverage (2.5x) and significant liquidity
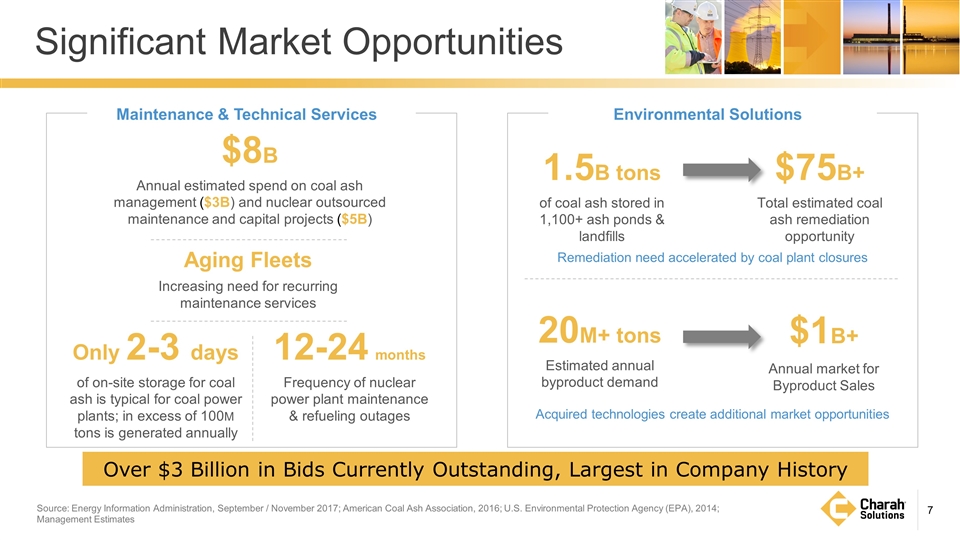
Source: Energy Information Administration, September / November 2017; American Coal Ash Association, 2016; U.S. Environmental Protection Agency (EPA), 2014; Management Estimates Significant Market Opportunities Aging Fleets Increasing need for recurring maintenance services $75B+ Total estimated coal ash remediation opportunity $1B+ Annual market for Byproduct Sales Only 2-3 days of on-site storage for coal ash is typical for coal power plants; in excess of 100M tons is generated annually 12-24 months Frequency of nuclear power plant maintenance & refueling outages 1.5B tons of coal ash stored in 1,100+ ash ponds & landfills Maintenance & Technical Services Environmental Solutions 20M+ tons Estimated annual byproduct demand $8B Annual estimated spend on coal ash management ($3B) and nuclear outsourced maintenance and capital projects ($5B) Acquired technologies create additional market opportunities Remediation need accelerated by coal plant closures Over $3 Billion in Bids Currently Outstanding, Largest in Company History
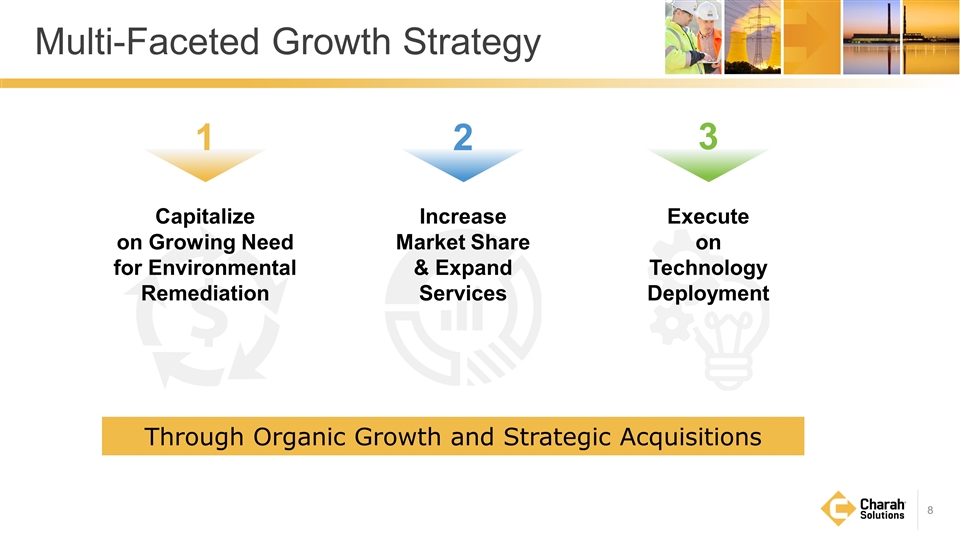
Through Organic Growth and Strategic Acquisitions Multi-Faceted Growth Strategy Increase Market Share & Expand Services 2 Capitalize on Growing Need for Environmental Remediation 1 Execute on Technology Deployment 3
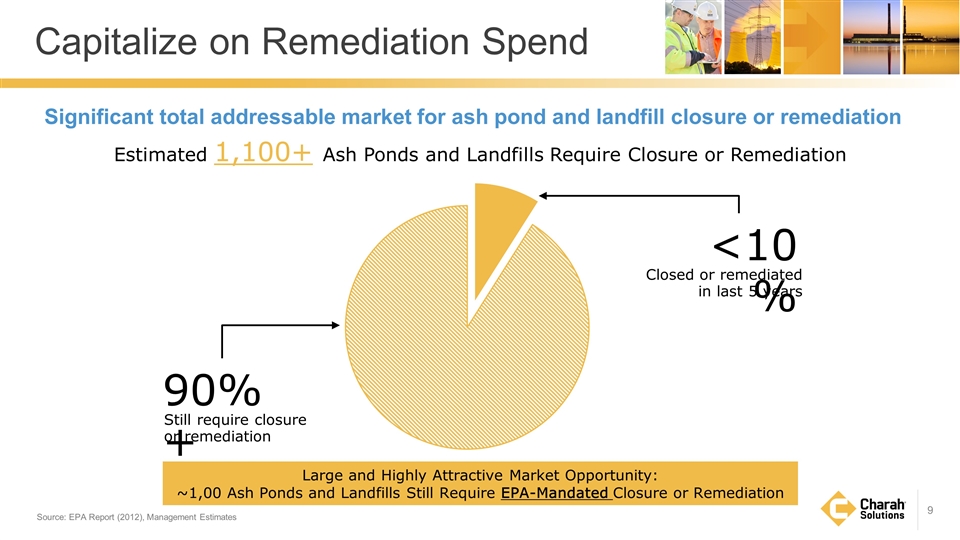
Capitalize on Remediation Spend Significant total addressable market for ash pond and landfill closure or remediation Estimated 1,100+ Ash Ponds and Landfills Require Closure or Remediation 90%+ Still require closure or remediation <10% Closed or remediated in last 5 years Large and Highly Attractive Market Opportunity: ~1,00 Ash Ponds and Landfills Still Require EPA-Mandated Closure or Remediation Source: EPA Report (2012), Management Estimates
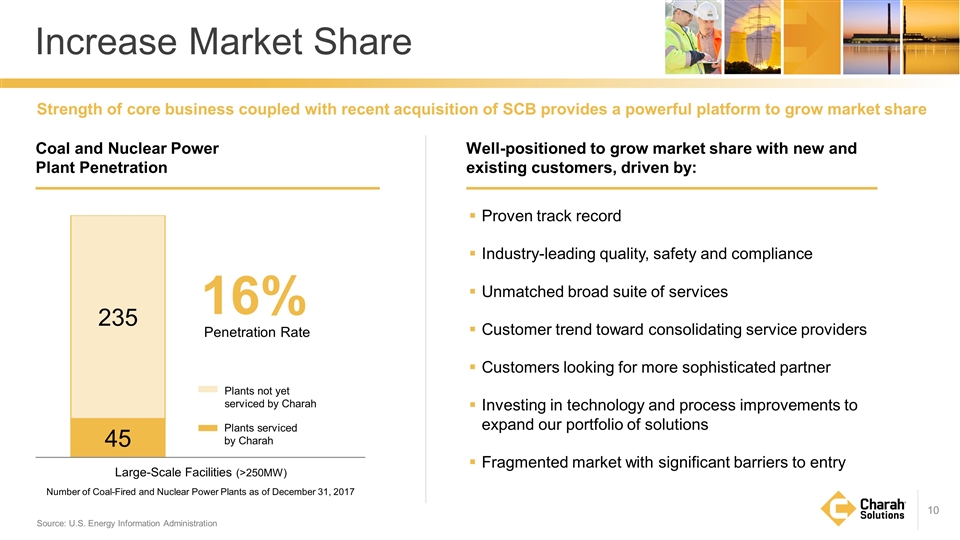
Source: U.S. Energy Information Administration Increase Market Share Number of Coal-Fired and Nuclear Power Plants as of December 31, 2017 Plants not yet serviced by Charah Plants serviced by Charah 16% Penetration Rate Large-Scale Facilities (>250MW) Well-positioned to grow market share with new and existing customers, driven by: Proven track record Industry-leading quality, safety and compliance Unmatched broad suite of services Customer trend toward consolidating service providers Customers looking for more sophisticated partner Investing in technology and process improvements to expand our portfolio of solutions Fragmented market with significant barriers to entry Coal and Nuclear Power Plant Penetration Strength of core business coupled with recent acquisition of SCB provides a powerful platform to grow market share
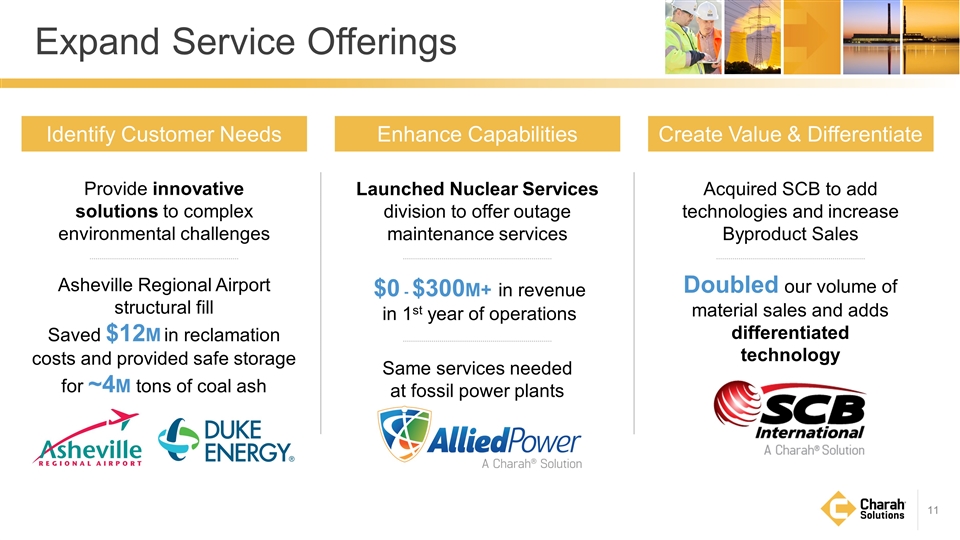
Acquired SCB to add technologies and increase Byproduct Sales Doubled our volume of material sales and adds differentiated technology Create Value & Differentiate Launched Nuclear Services division to offer outage maintenance services $0 - $300M+ in revenue in 1st year of operations Same services needed at fossil power plants Enhance Capabilities Provide innovative solutions to complex environmental challenges Asheville Regional Airport structural fill Saved $12M in reclamation costs and provided safe storage for ~4M tons of coal ash Identify Customer Needs Expand Service Offerings
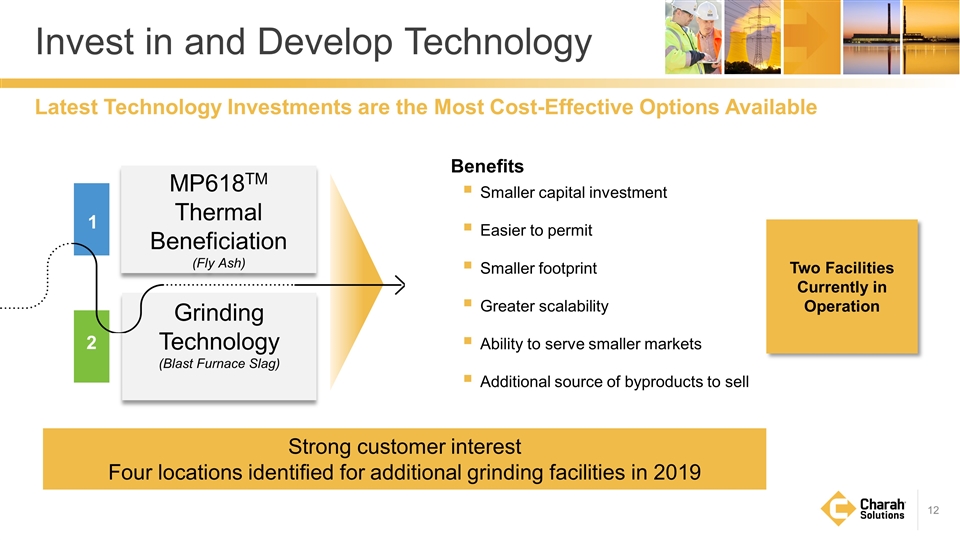
1 2 Invest in and Develop Technology MP618TM Thermal Beneficiation (Fly Ash) Grinding Technology (Blast Furnace Slag) Strong customer interest Four locations identified for additional grinding facilities in 2019 Latest Technology Investments are the Most Cost-Effective Options Available Benefits Smaller capital investment Easier to permit Smaller footprint Greater scalability Ability to serve smaller markets Additional source of byproducts to sell Two Facilities Currently in Operation
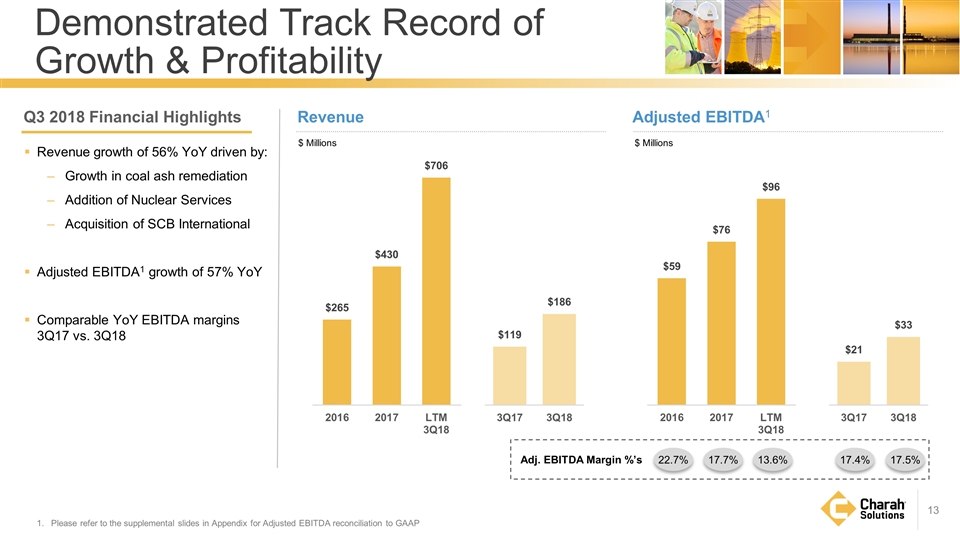
Revenue growth of 56% YoY driven by: Growth in coal ash remediation Addition of Nuclear Services Acquisition of SCB International Adjusted EBITDA1 growth of 57% YoY Comparable YoY EBITDA margins 3Q17 vs. 3Q18 Please refer to the supplemental slides in Appendix for Adjusted EBITDA reconciliation to GAAP Revenue $ Millions Adjusted EBITDA1 $ Millions Demonstrated Track Record of Growth & Profitability Q3 2018 Financial Highlights 17.7% 13.6% 17.4% 17.5% 22.7% Adj. EBITDA Margin %’s
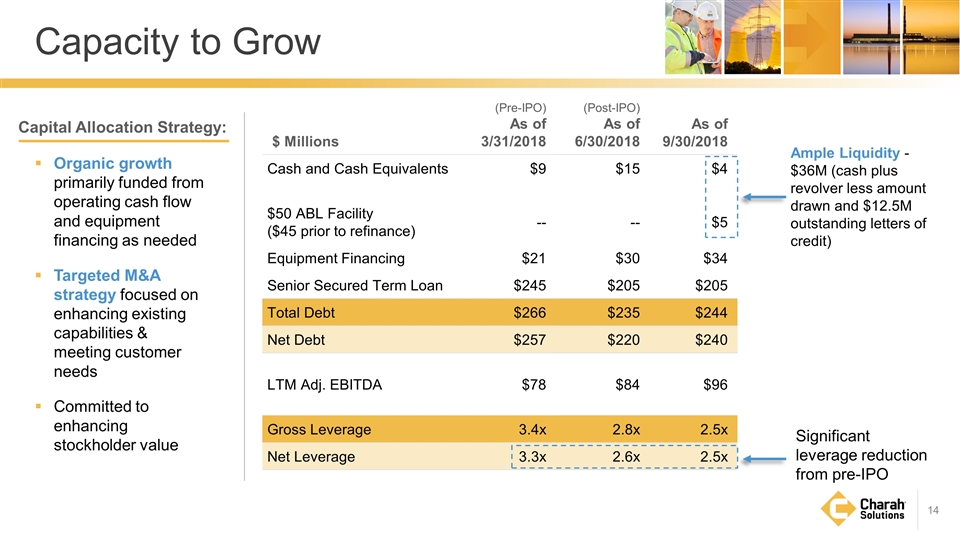
$ Millions (Pre-IPO) As of 3/31/2018 (Post-IPO) As of 6/30/2018 As of 9/30/2018 Cash and Cash Equivalents $9 $15 $4 $50 ABL Facility ($45 prior to refinance) -- -- $5 Equipment Financing $21 $30 $34 Senior Secured Term Loan $245 $205 $205 Total Debt $266 $235 $244 Net Debt $257 $220 $240 LTM Adj. EBITDA $78 $84 $96 Gross Leverage 3.4x 2.8x 2.5x Net Leverage 3.3x 2.6x 2.5x Capacity to Grow Organic growth primarily funded from operating cash flow and equipment financing as needed Targeted M&A strategy focused on enhancing existing capabilities & meeting customer needs Committed to enhancing stockholder value Capital Allocation Strategy: Ample Liquidity - $36M (cash plus revolver less amount drawn and $12.5M outstanding letters of credit) Significant leverage reduction from pre-IPO
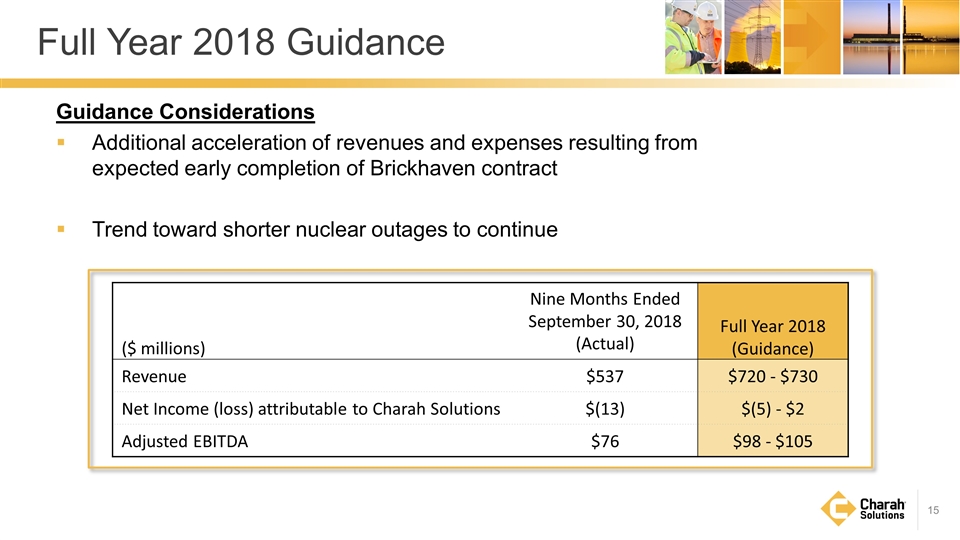
Full Year 2018 Guidance ($ millions) Nine Months Ended September 30, 2018 (Actual) Full Year 2018 (Guidance) Revenue $537 $720 - $730 Net Income (loss) attributable to Charah Solutions $(13) $(5) - $2 Adjusted EBITDA $76 $98 - $105 Guidance Considerations Additional acceleration of revenues and expenses resulting from expected early completion of Brickhaven contract Trend toward shorter nuclear outages to continue
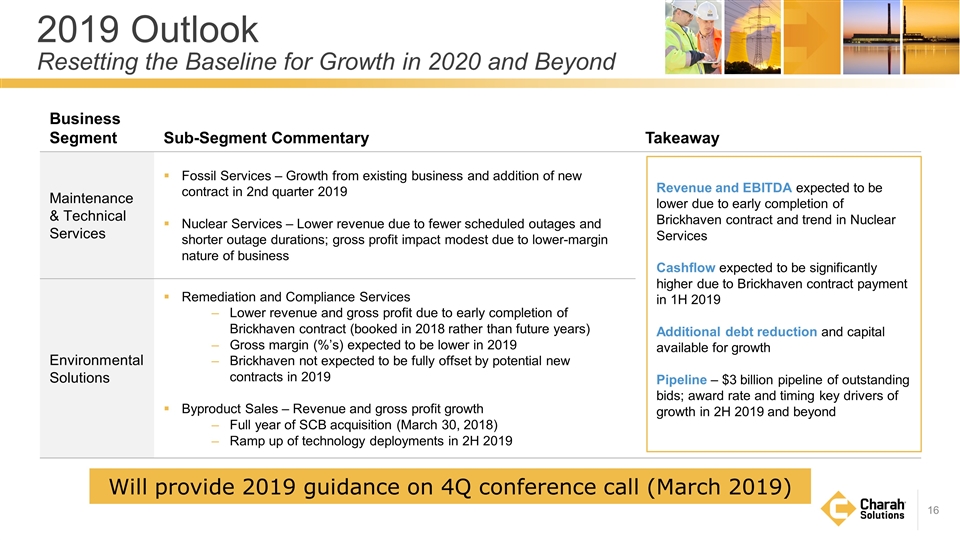
2019 Outlook Resetting the Baseline for Growth in 2020 and Beyond Will provide 2019 guidance on 4Q conference call (March 2019) Business Segment Sub-Segment Commentary Takeaway Maintenance & Technical Services Fossil Services – Growth from existing business and addition of new contract in 2nd quarter 2019 Nuclear Services – Lower revenue due to fewer scheduled outages and shorter outage durations; gross profit impact modest due to lower-margin nature of business Environmental Solutions Remediation and Compliance Services Lower revenue and gross profit due to early completion of Brickhaven contract (booked in 2018 rather than future years) Gross margin (%’s) expected to be lower in 2019 Brickhaven not expected to be fully offset by potential new contracts in 2019 Byproduct Sales – Revenue and gross profit growth Full year of SCB acquisition (March 30, 2018) Ramp up of technology deployments in 2H 2019 Revenue and EBITDA expected to be lower due to early completion of Brickhaven contract and trend in Nuclear Services Cashflow expected to be significantly higher due to Brickhaven contract payment in 1H 2019 Additional debt reduction and capital available for growth Pipeline – $3 billion pipeline of outstanding bids; award rate and timing key drivers of growth in 2H 2019 and beyond
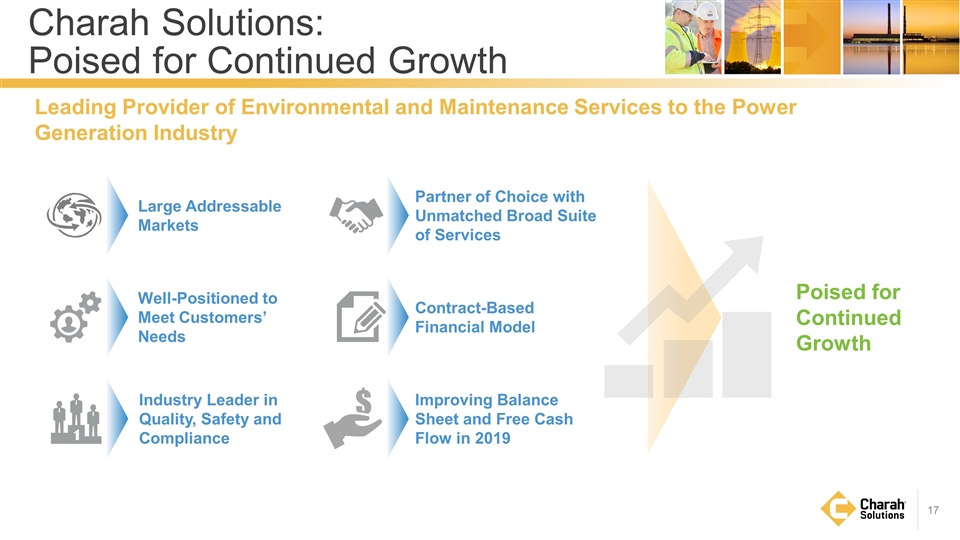
Poised for Continued Growth Charah Solutions: Poised for Continued Growth Leading Provider of Environmental and Maintenance Services to the Power Generation Industry Well-Positioned to Meet Customers’ Needs Contract-Based Financial Model Industry Leader in Quality, Safety and Compliance Improving Balance Sheet and Free Cash Flow in 2019 Partner of Choice with Unmatched Broad Suite of Services Large Addressable Markets
APPENDIX
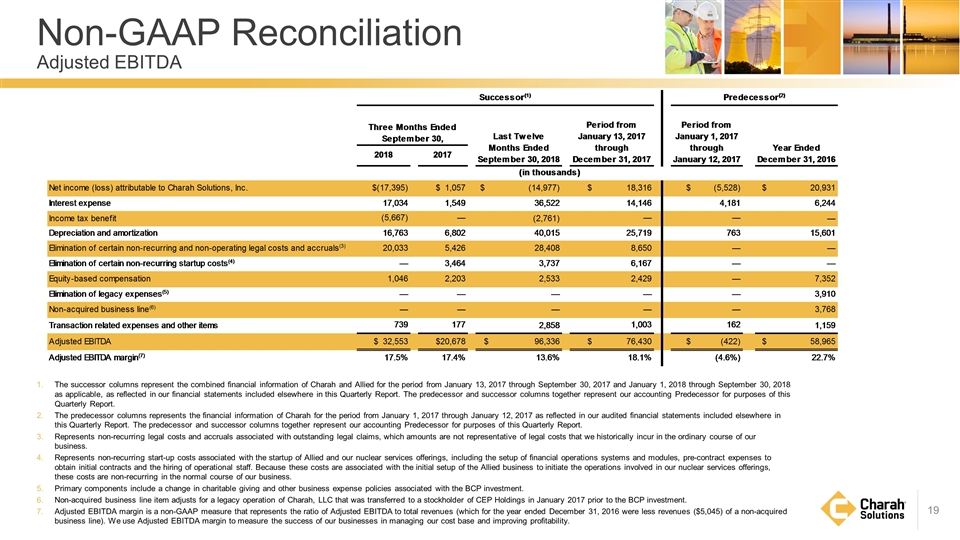
Non-GAAP Reconciliation Adjusted EBITDA The successor columns represent the combined financial information of Charah and Allied for the period from January 13, 2017 through September 30, 2017 and January 1, 2018 through September 30, 2018 as applicable, as reflected in our financial statements included elsewhere in this Quarterly Report. The predecessor and successor columns together represent our accounting Predecessor for purposes of this Quarterly Report. The predecessor columns represents the financial information of Charah for the period from January 1, 2017 through January 12, 2017 as reflected in our audited financial statements included elsewhere in this Quarterly Report. The predecessor and successor columns together represent our accounting Predecessor for purposes of this Quarterly Report. Represents non-recurring legal costs and accruals associated with outstanding legal claims, which amounts are not representative of legal costs that we historically incur in the ordinary course of our business. Represents non-recurring start-up costs associated with the startup of Allied and our nuclear services offerings, including the setup of financial operations systems and modules, pre-contract expenses to obtain initial contracts and the hiring of operational staff. Because these costs are associated with the initial setup of the Allied business to initiate the operations involved in our nuclear services offerings, these costs are non-recurring in the normal course of our business. Primary components include a change in charitable giving and other business expense policies associated with the BCP investment. Non-acquired business line item adjusts for a legacy operation of Charah, LLC that was transferred to a stockholder of CEP Holdings in January 2017 prior to the BCP investment. Adjusted EBITDA margin is a non-GAAP measure that represents the ratio of Adjusted EBITDA to total revenues (which for the year ended December 31, 2016 were less revenues ($5,045) of a non-acquired business line). We use Adjusted EBITDA margin to measure the success of our businesses in managing our cost base and improving profitability. Successor(1) Predecessor(2) Three Months EndedSeptember 30, Last Twelve Months Ended September 30, 2018 Period from January 13, 2017 through December 31, 2017 Period from January 1, 2017 through January 12, 2017 Year Ended December 31, 2016 2018 2017 (in thousands) Net income (loss) attributable to Charah Solutions, Inc. $,-17,395 $1,057 $,-14,977,031 $18,316 $-5,528 $20,931 Interest expense 17034 1549 36,522,280 14146 4181 6,244 Income tax benefit -5667 — -2,761,096 — — — Depreciation and amortization 16763 6802 40,015,467 25719 763 15,601 Elimination of certain non-recurring and non-operating legal costs and accruals(3) 20033 5426 28,407,835.5 8650 — — Elimination of certain non-recurring startup costs(4) — 3464 3,737,355 6167 — — Equity-based compensation 1046 2203 2,533,234 2429 — 7,352 Elimination of legacy expenses(5) — — — — — 3,910 Non-acquired business line(6) — — — — — 3,768 Transaction related expenses and other items 739 177 2,858,192.7800000003 1003 162 1,159 Adjusted EBITDA $32,553 $20,678 $96,336,237.280000001 $76,430 $-,422 $58,965 Adjusted EBITDA margin(7) 0.17499999999999999 0.17399999999999999 0.13600000000000001 0.18099999999999999 -4.6% 0.22700000000000001
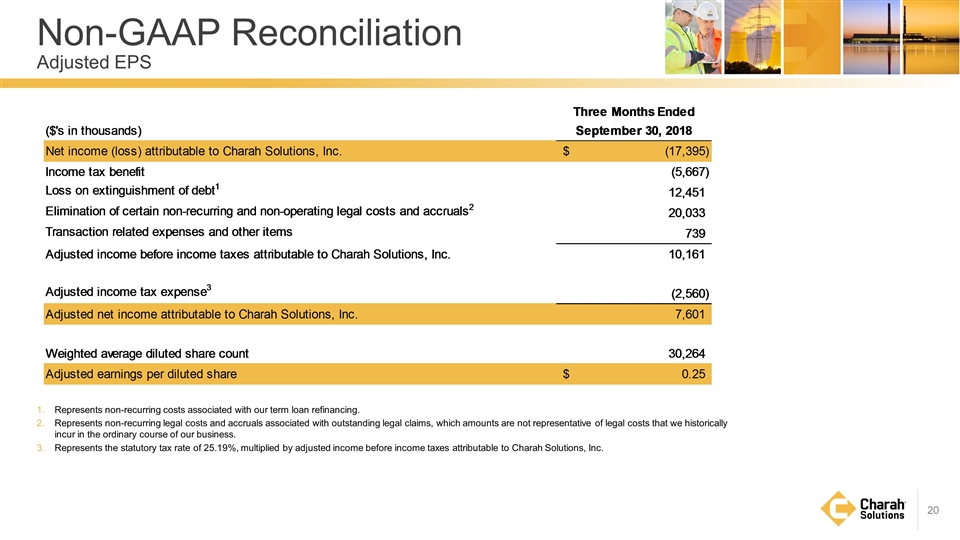
Non-GAAP Reconciliation Adjusted EPS Represents non-recurring costs associated with our term loan refinancing. Represents non-recurring legal costs and accruals associated with outstanding legal claims, which amounts are not representative of legal costs that we historically incur in the ordinary course of our business. Represents the statutory tax rate of 25.19%, multiplied by adjusted income before income taxes attributable to Charah Solutions, Inc. Three Months EndedSeptember 30, 2018 ($'s in thousands) Three Months Ended September 30, 2018 Net Income to Charah Solutions -7,137,812 Net income (loss) attributable to Charah Solutions, Inc. $,-17,395 Share Count 30,264,426 Income tax benefit -5,667 EPS $-0.23584825299511711 Loss on extinguishment of debt1 12,451 Elimination of certain non-recurring and non-operating legal costs and accruals2 20,033 Add Backs: Transaction related expenses and other items 739 Write off of debt issuance costs 10,348,080 Adjusted income before income taxes attributable to Charah Solutions, Inc. 10,161 Prepayment penalty 2,103,125 Non-recurring legal and startup costs 8,033,298.5 Adjusted income tax expense3 -2,559.5559000000003 Transaction related expenses and other items ,739,020.78 Adjusted net income attributable to Charah Solutions, Inc. 7,601.4440999999997 Total Add Backs 21,223,524.280000001 Tax Rate 0.2311 Weighted average diluted share count 30,264 Tax Effected Add Backs 16,318,767.818892002 Adjusted earnings per diluted share $0.25117116375892146 Normalization of Deferred Tax True Up -1,505,296 Total Add Backs for Normalized Net Income 14,813,471.818892002 Normalized Net Income 7,675,659.8188920021 Share Count 30,264,426 Normalized EPS $0.25361987102917471
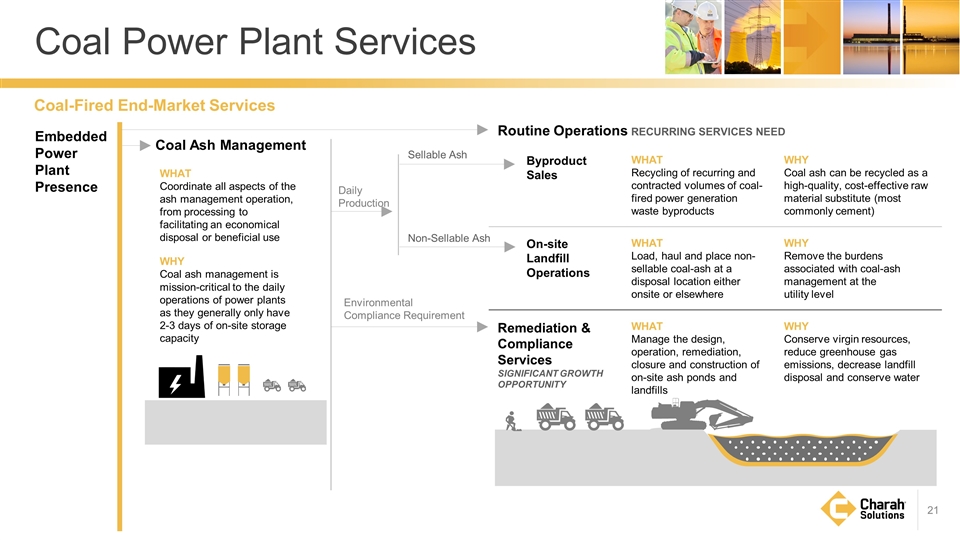
Routine Operations RECURRING SERVICES NEED Byproduct Sales WHAT Recycling of recurring and contracted volumes of coal-fired power generation waste byproducts WHY Coal ash can be recycled as a high-quality, cost-effective raw material substitute (most commonly cement) On-site Landfill Operations WHAT Load, haul and place non-sellable coal-ash at a disposal location either onsite or elsewhere WHY Remove the burdens associated with coal-ash management at the utility level Remediation & Compliance Services SIGNIFICANT GROWTH OPPORTUNITY WHAT Manage the design, operation, remediation, closure and construction of on-site ash ponds and landfills WHY Conserve virgin resources, reduce greenhouse gas emissions, decrease landfill disposal and conserve water Coal-Fired End-Market Services WHAT Coordinate all aspects of the ash management operation, from processing to facilitating an economical disposal or beneficial use WHY Coal ash management is mission-critical to the daily operations of power plants as they generally only have 2-3 days of on-site storage capacity Embedded Power Plant Presence Coal Ash Management Sellable Ash Environmental Compliance Requirement Non-Sellable Ash Daily Production Coal Power Plant Services
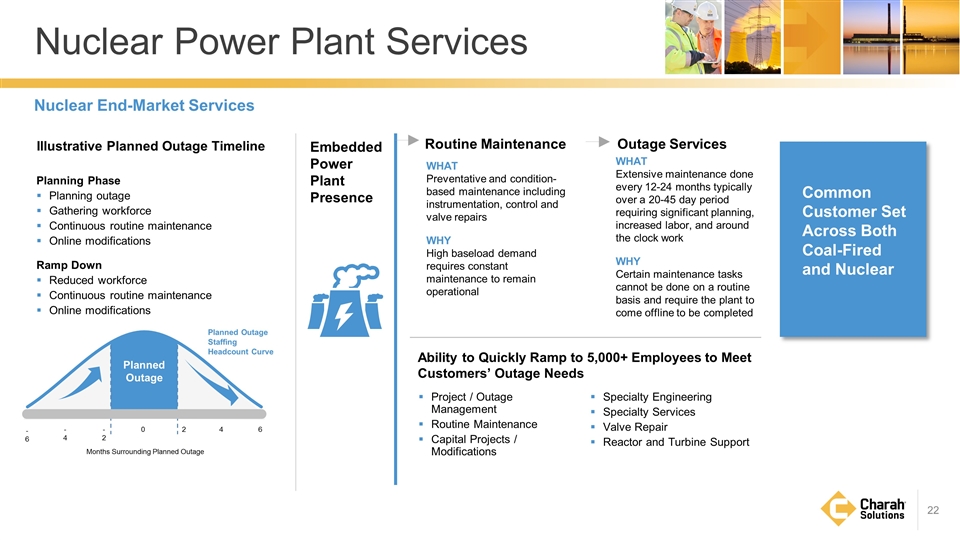
Illustrative Planned Outage Timeline Planning Phase Planning outage Gathering workforce Continuous routine maintenance Online modifications Ramp Down Reduced workforce Continuous routine maintenance Online modifications -6 -4 -2 0 2 4 6 Planned Outage Planned Outage Staffing Headcount Curve Months Surrounding Planned Outage WHAT Preventative and condition-based maintenance including instrumentation, control and valve repairs WHY High baseload demand requires constant maintenance to remain operational WHAT Extensive maintenance done every 12-24 months typically over a 20-45 day period requiring significant planning, increased labor, and around the clock work WHY Certain maintenance tasks cannot be done on a routine basis and require the plant to come offline to be completed Outage Services Project / Outage Management Routine Maintenance Capital Projects / Modifications Specialty Engineering Specialty Services Valve Repair Reactor and Turbine Support Nuclear End-Market Services Embedded Power Plant Presence Routine Maintenance Ability to Quickly Ramp to 5,000+ Employees to Meet Customers’ Outage Needs Common Customer Set Across Both Coal-Fired and Nuclear Nuclear Power Plant Services
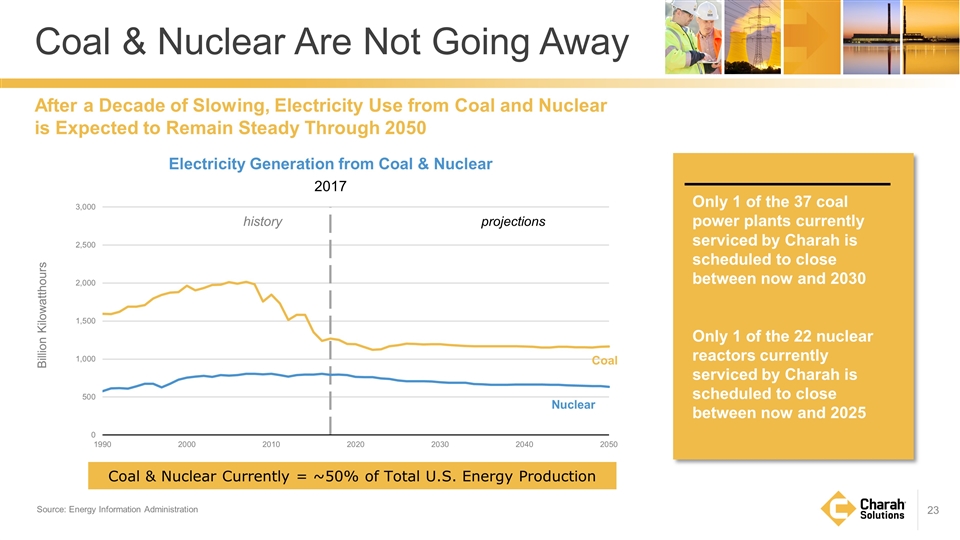
Coal & Nuclear Are Not Going Away Source: Energy Information Administration After a Decade of Slowing, Electricity Use from Coal and Nuclear is Expected to Remain Steady Through 2050 history projections 2017 Electricity Generation from Coal & Nuclear Billion Kilowatthours Only 1 of the 37 coal power plants currently serviced by Charah is scheduled to close between now and 2030 Only 1 of the 22 nuclear reactors currently serviced by Charah is scheduled to close between now and 2025 Coal & Nuclear Currently = ~50% of Total U.S. Energy Production
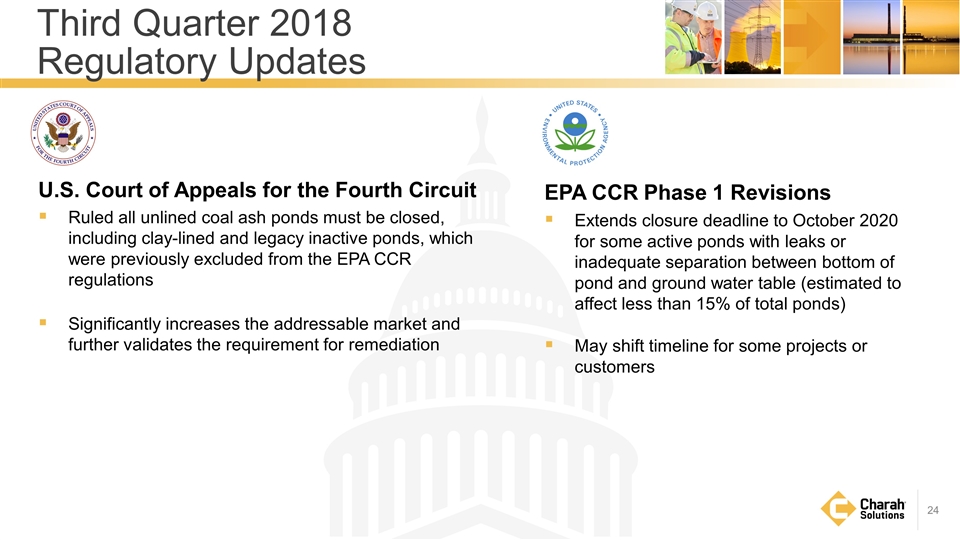
Third Quarter 2018 Regulatory Updates U.S. Court of Appeals for the Fourth Circuit Ruled all unlined coal ash ponds must be closed, including clay-lined and legacy inactive ponds, which were previously excluded from the EPA CCR regulations Significantly increases the addressable market and further validates the requirement for remediation EPA CCR Phase 1 Revisions Extends closure deadline to October 2020 for some active ponds with leaks or inadequate separation between bottom of pond and ground water table (estimated to affect less than 15% of total ponds) May shift timeline for some projects or customers
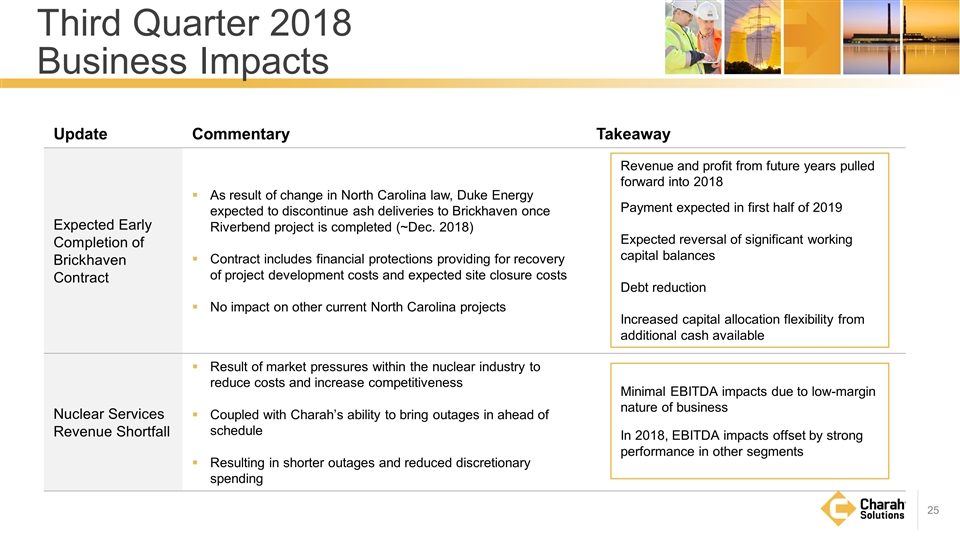
Third Quarter 2018 Business Impacts Update Commentary Takeaway Expected Early Completion of Brickhaven Contract As result of change in North Carolina law, Duke Energy expected to discontinue ash deliveries to Brickhaven once Riverbend project is completed (~Dec. 2018) Contract includes financial protections providing for recovery of project development costs and expected site closure costs No impact on other current North Carolina projects Nuclear Services Revenue Shortfall Result of market pressures within the nuclear industry to reduce costs and increase competitiveness Coupled with Charah’s ability to bring outages in ahead of schedule Resulting in shorter outages and reduced discretionary spending Revenue and profit from future years pulled forward into 2018 Payment expected in first half of 2019 Expected reversal of significant working capital balances Debt reduction Increased capital allocation flexibility from additional cash available Minimal EBITDA impacts due to low-margin nature of business In 2018, EBITDA impacts offset by strong performance in other segments
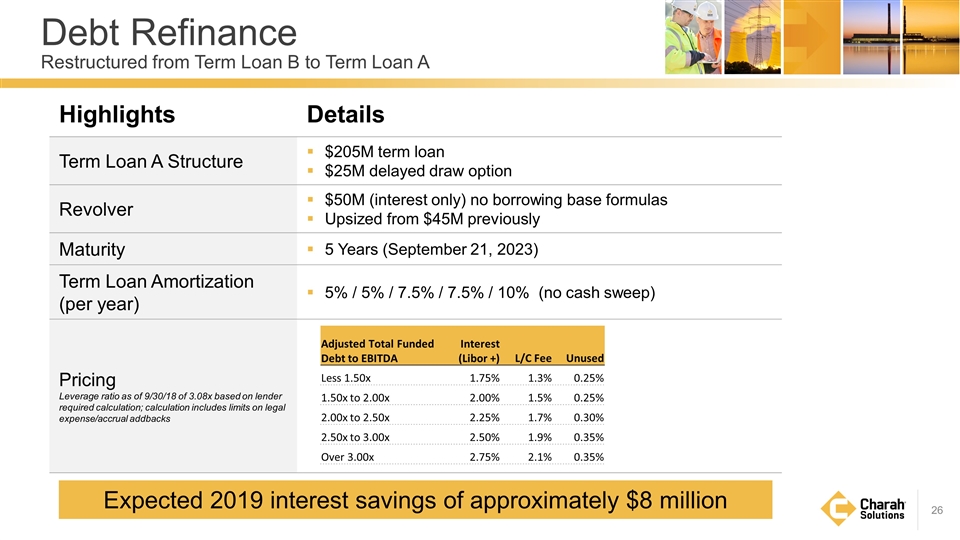
Debt Refinance Restructured from Term Loan B to Term Loan A Highlights Details Term Loan A Structure $205M term loan $25M delayed draw option Revolver $50M (interest only) no borrowing base formulas Upsized from $45M previously Maturity 5 Years (September 21, 2023) Term Loan Amortization (per year) 5% / 5% / 7.5% / 7.5% / 10% (no cash sweep) Pricing Leverage ratio as of 9/30/18 of 3.08x based on lender required calculation; calculation includes limits on legal expense/accrual addbacks Adjusted Total Funded Debt to EBITDA Interest (Libor +) L/C Fee Unused Less 1.50x 1.75% 1.3% 0.25% 1.50x to 2.00x 2.00% 1.5% 0.25% 2.00x to 2.50x 2.25% 1.7% 0.30% 2.50x to 3.00x 2.50% 1.9% 0.35% Over 3.00x 2.75% 2.1% 0.35% Expected 2019 interest savings of approximately $8 million
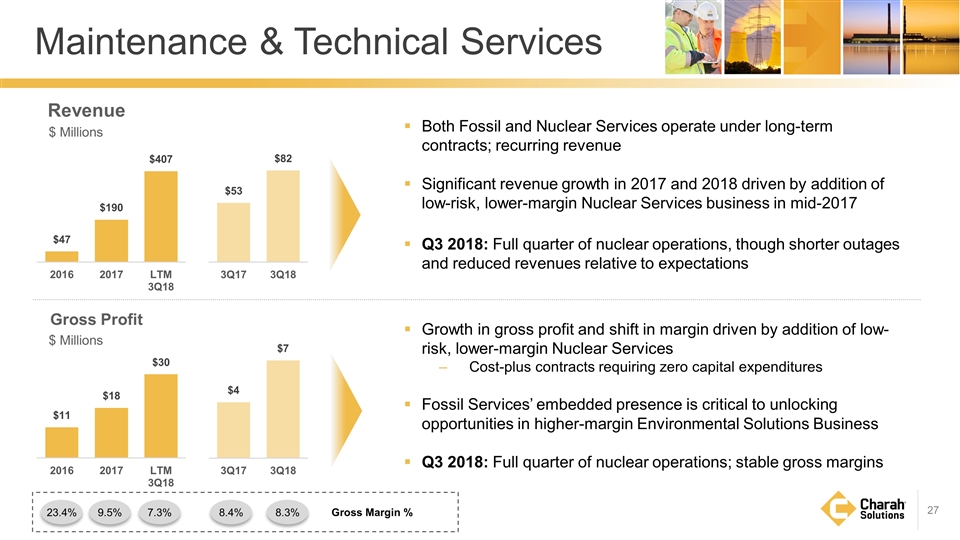
Revenue Gross Profit Maintenance & Technical Services Both Fossil and Nuclear Services operate under long-term contracts; recurring revenue Significant revenue growth in 2017 and 2018 driven by addition of low-risk, lower-margin Nuclear Services business in mid-2017 Q3 2018: Full quarter of nuclear operations, though shorter outages and reduced revenues relative to expectations Growth in gross profit and shift in margin driven by addition of low-risk, lower-margin Nuclear Services Cost-plus contracts requiring zero capital expenditures Fossil Services’ embedded presence is critical to unlocking opportunities in higher-margin Environmental Solutions Business Q3 2018: Full quarter of nuclear operations; stable gross margins $ Millions $ Millions 23.4% 9.5% 7.3% 8.4% 8.3% Gross Margin %
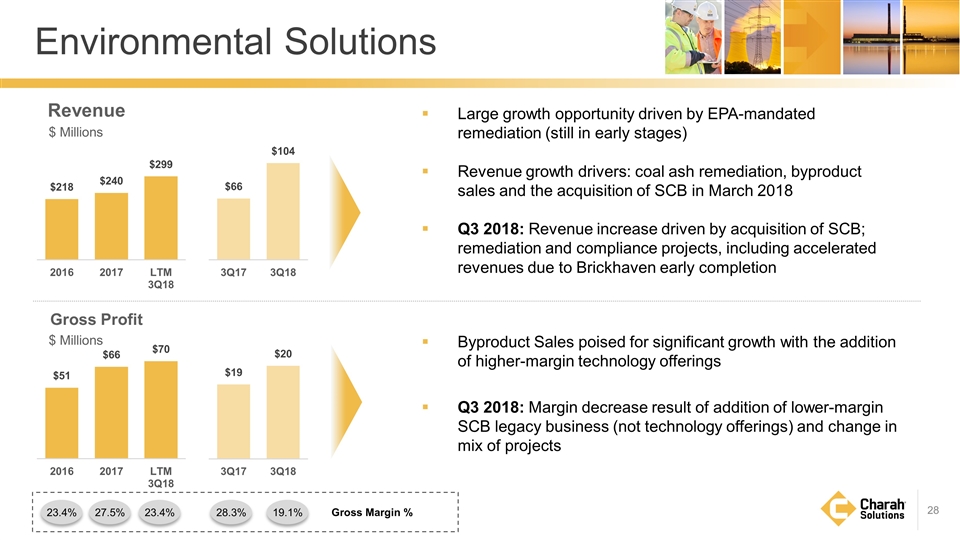
Environmental Solutions Large growth opportunity driven by EPA-mandated remediation (still in early stages) Revenue growth drivers: coal ash remediation, byproduct sales and the acquisition of SCB in March 2018 Q3 2018: Revenue increase driven by acquisition of SCB; remediation and compliance projects, including accelerated revenues due to Brickhaven early completion Byproduct Sales poised for significant growth with the addition of higher-margin technology offerings Q3 2018: Margin decrease result of addition of lower-margin SCB legacy business (not technology offerings) and change in mix of projects Revenue Gross Profit $ Millions $ Millions 23.4% 27.5% 23.4% 28.3% 19.1% Gross Margin %
