Attached files
| file | filename |
|---|---|
| EX-32.2 - EX-32.2 - BrightView Holdings, Inc. | bv-ex322_6.htm |
| EX-32.1 - EX-32.1 - BrightView Holdings, Inc. | bv-ex321_7.htm |
| EX-31.2 - EX-31.2 - BrightView Holdings, Inc. | bv-ex312_8.htm |
| EX-31.1 - EX-31.1 - BrightView Holdings, Inc. | bv-ex311_9.htm |
| EX-23.1 - EX-23.1 - BrightView Holdings, Inc. | bv-ex231_382.htm |
UNITED STATES
SECURITIES AND EXCHANGE COMMISSION
Washington, D.C. 20549
FORM 10-K
(Mark One)
|
☒ |
ANNUAL REPORT PURSUANT TO SECTION 13 OR 15(d) OF THE SECURITIES EXCHANGE ACT OF 1934 |
For the fiscal year ended September 30, 2018
OR
|
☐ |
TRANSITION REPORT PURSUANT TO SECTION 13 OR 15(d) OF THE SECURITIES EXCHANGE ACT OF 1934 FOR THE TRANSITION PERIOD FROM TO |
Commission File Number 001-38579
BrightView Holdings, Inc.
(Exact name of Registrant as specified in its Charter)
|
Delaware |
|
46-4190788 |
|
( State or other jurisdiction of incorporation or organization) |
|
(I.R.S. Employer Identification No.) |
|
401 Plymouth Road Suite 500 Plymouth Meeting, Pennsylvania |
|
19462 |
|
(Address of principal executive offices) |
|
(Zip Code) |
Registrant’s telephone number, including area code: (484) 567-7204
Securities registered pursuant to Section 12(b) of the Act:
|
Title of Each Class |
|
Name of exchange on which registered |
|
Common Stock, Par Value $0.01 Per Share |
|
New York Stock Exchange |
Securities registered pursuant to Section 12(g) of the Act: None
Indicate by check mark if the registrant is a well-known seasoned issuer, as defined in Rule 405 of the Securities Act. Yes ☐ No ☒
Indicate by check mark if the registrant is not required to file reports pursuant to Section 13 or Section 15(d) of the Act. Yes ☐ No ☒
Indicate by check mark whether the Registrant: (1) has filed all reports required to be filed by Section 13 or 15(d) of the Securities Exchange Act of 1934 during the preceding 12 months (or for such shorter period that the Registrant was required to file such reports), and (2) has been subject to such filing requirements for the past 90 days. Yes ☒ No ☐
Indicate by check mark whether the Registrant has submitted electronically every Interactive Data File required to be submitted pursuant to Rule 405 of Regulation S-T (§232.405 of this chapter) during the preceding 12 months (or for such shorter period that the Registrant was required to submit such files). Yes ☒ No ☐
Indicate by check mark if disclosure of delinquent filers pursuant to Item 405 of Regulation S-K (§229.405) is not contained herein, and will not be contained, to the best of Registrant’s knowledge, in definitive proxy or information statements incorporated by reference in Part III of this Form 10-K or any amendment to this Form 10-K. ☒
Indicate by check mark whether the registrant is a large accelerated filer, an accelerated filer, a non-accelerated filer, smaller reporting company, or an emerging growth company. See the definitions of “large accelerated filer,” “accelerated filer,” “smaller reporting company,” and “emerging growth company” in Rule 12b-2 of the Exchange Act.
|
Large accelerated filer |
|
☐ |
|
Accelerated filer |
|
☐ |
|
|
|
|
|
|||
|
Non-accelerated filer |
|
☒ |
|
Smaller reporting company |
|
☐ |
|
|
|
|
|
|
|
|
|
Emerging growth company |
|
☐ |
|
|
|
|
If an emerging growth company, indicate by check mark if the registrant has elected not to use the extended transition period for complying with any new or revised financial accounting standards provided pursuant to Section 13(a) of the Exchange Act. ☐
Indicate by check mark whether the Registrant is a shell company (as defined in Rule 12b-2 of the Exchange Act). Yes ☐ No ☒
BrightView Holdings, Inc. completed the initial public offering of its common stock on July 2, 2018. Accordingly, there was no public market for the registrant’s common stock as of March 31, 2018, the last business day of the registrant’s most recently completed second fiscal quarter. As of October 31, 2018, the aggregate value of the registrant’s common stock held by non-affiliates was approximately $442.8 million, based on the number of shares held by non-affiliates as of October 31, 2018 and the closing price of the registrant’s common stock on the New York Stock Exchange on that date.
The number of shares of Registrant’s Common Stock outstanding as of October 31, 2018 was 104,469,663.
DOCUMENTS INCORPORATED BY REFERENCE
Portions of the Registrant’s Definitive Proxy Statement relating to the Annual Meeting of Shareholders, scheduled to be held on March 26, 2019, are incorporated by reference into Part III of this Report.
|
|
|
Page |
|
|
|
|
|
Item 1. |
1 |
|
|
Item 1A. |
9 |
|
|
Item 1B. |
26 |
|
|
Item 2. |
26 |
|
|
Item 3. |
26 |
|
|
Item 4. |
26 |
|
|
|
|
|
|
|
|
|
|
Item 5. |
27 |
|
|
Item 6. |
28 |
|
|
Item 7. |
Management’s Discussion and Analysis of Financial Condition and Results of Operations |
32 |
|
Item 7A. |
54 |
|
|
Item 8. |
55 |
|
|
Item 9. |
Changes in and Disagreements With Accountants on Accounting and Financial Disclosure |
55 |
|
Item 9A. |
55 |
|
|
Item 9B. |
55 |
|
|
|
|
|
|
|
|
|
|
Item 10. |
56 |
|
|
Item 11. |
56 |
|
|
Item 12. |
Security Ownership of Certain Beneficial Owners and Management and Related Stockholder Matters |
56 |
|
Item 13. |
Certain Relationships and Related Transactions, and Director Independence |
56 |
|
Item 14. |
56 |
|
|
|
|
|
|
|
|
|
|
Item 15. |
57 |
|
|
Item 16. |
57 |
|
|
|
62 |
SPECIAL NOTE REGARDING FORWARD-LOOKING STATEMENTS
This Annual Report on Form 10-K (this “Form 10-K”) contains “forward-looking statements” within the meaning of the safe harbor provision of the U.S. Private Securities Litigation Reform Act of 1995, Section 27A of the Securities Act of 1933, as amended (the “Securities Act”), and Section 21E of the Securities Exchange Act of 1934, as amended (the “Exchange Act”), which are subject to the “safe harbor” created by those sections. All statements, other than statements of historical facts included in this Form 10-K, including statements concerning our plans, objectives, goals, beliefs, business strategies, future events, business conditions, results of operations, financial position, business outlook, business trends and other information, may be forward-looking statements.
Words such as “believes,” “expects,” “may,” “will,” “should,” “seeks,” “intends,” “plans,” “estimates,” or “anticipates,” and variations of such words or similar expressions are intended to identify forward-looking statements. The forward-looking statements are not historical facts, or guarantees of future performance and are based upon our current expectations, beliefs, estimates and projections, and various assumptions, many of which, by their nature, are inherently uncertain and beyond our control. Our expectations, beliefs, and projections are expressed in good faith and we believe there is a reasonable basis for them. However, there can be no assurance that management’s expectations, beliefs and projections will result or be achieved and actual results may vary materially from what is expressed in or indicated by the forward-looking statements.
There are a number of risks, uncertainties and other important factors, many of which are beyond our control, that could cause our actual results to differ materially from the forward-looking statements contained in this Form 10-K. Such risks, uncertainties and other important factors that could cause actual results to differ include, among others, the risks, uncertainties and factors set forth under the heading “Business”, “Risk Factors” and “Management’s Discussion and Analysis of Financial Condition and Results of Operations” and elsewhere in this Form 10-K. New risk factors and uncertainties may emerge from time to time, and it is not possible for management to predict all risk factors and uncertainties. Some of the key factors that could cause actual results to differ from our expectations include risks related to:
|
|
• |
general economic and financial conditions; |
|
|
• |
competitive industry pressures; |
|
|
• |
the failure to retain certain current customers, renew existing customer contracts and obtain new customer contracts; |
|
|
• |
a determination by customers to reduce their outsourcing or use of preferred vendors; |
|
|
• |
the dispersed nature of our operating structure; |
|
|
• |
our ability to implement our business strategies and achieve our growth objectives; |
|
|
• |
acquisition and integration risks; |
|
|
• |
the seasonal nature of our landscape maintenance services; |
|
|
• |
our dependence on weather conditions; |
|
|
• |
increases in prices for raw materials and fuel; |
|
|
• |
any failure to accurately estimate the overall risks, requirements or costs when we bid on or negotiate contracts that are ultimately awarded to us; |
|
|
• |
product shortages and the loss of key suppliers; |
|
|
• |
the conditions and periodic fluctuations of real estate markets, including residential and commercial construction; |
|
|
• |
our ability to retain our executive management and other key personnel; |
|
|
• |
our ability to attract and retain trained workers and third-party contractors and re-employ seasonal workers; |
|
|
• |
any failure to properly verify employment eligibility of our employees; |
|
|
• |
subcontractors taking actions that harm our business; |
|
|
• |
our recognition of future impairment charges; |
|
|
• |
laws and governmental regulations, including those relating to employees, wage and hour, immigration, human health and safety and transportation; |
|
|
• |
environmental, health and safety laws and regulations; |
|
|
• |
the impact of any adverse litigation judgments or settlements resulting from legal proceedings relating to our business operations; |
|
|
• |
increase in on-job accidents involving employees; |
|
|
• |
any failure, inadequacy, interruption, security failure or breach of our information technology systems; |
|
|
• |
any failure to protect the security of personal information about our customers, employees and third parties; |
|
|
• |
our ability to adequately protect our intellectual property; |
|
|
• |
occurrence of natural disasters, terrorist attacks or other external events; |
|
|
• |
our ability to generate sufficient cash flow to satisfy our significant debt service obligations; |
|
|
• |
our ability to obtain additional financing to fund future working capital, capital expenditures, investments or acquisitions, or other general corporate requirements; |
|
|
• |
restrictions imposed by our debt agreements that limit our flexibility in operating our business; |
|
|
• |
increases in interest rates increasing the cost of servicing our substantial indebtedness; and |
|
|
• |
increases in costs and requirements imposed as a result of becoming a public company. |
We caution you that the risks, uncertainties, and other factors referenced above may not contain all of the risks, uncertainties and other factors that are important to you. In addition, we cannot assure you that we will realize the results, benefits, or developments that we expect or anticipate or, even if substantially realized, that they will result in the consequences or affect us or our business in the way expected. We undertake no obligation to publicly update or revise any forward-looking statements to reflect subsequent events or circumstances, any change in assumptions, beliefs or expectations or any change in circumstances upon which any such forward-looking statements are based, except as required by law.
BrightView Holdings, Inc. is a holding company that conducts substantially all of its activity through its direct, wholly-owned operating subsidiary, BrightView Landscapes, LLC (“BrightView”) and its consolidated subsidiaries. The holding company and BrightView are collectively referred to on Form 10-K (the “Annual Report”) as “we,” “us,” “our,” “ourselves,” “Company,” or “BrightView.” BrightView is controlled by affiliates of Kohlberg Kravis Roberts & Co. Inc. (“KKR”) and affiliates of MSD Partners, L.P. (“MSD Partners”). KKR and MSD Partners are collectively referred to herein as the “Sponsors.” The Company was formed through a series of transactions entered into by KKR to acquire the Company on December 18, 2013 (“the KKR Acquisition”).
Our Company
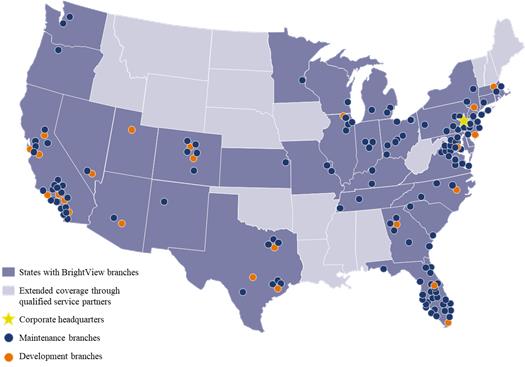
We are the largest provider of commercial landscaping services in the United States, with revenues more than 10 times those of our next largest commercial landscaping competitor. We provide commercial landscaping services, ranging from landscape maintenance and enhancements to tree care and landscape development. We operate through a differentiated and integrated national service model which systematically delivers services at the local level by combining our network of over 200 branches with a qualified service partner network. Our branch delivery model underpins our position as a single-source end-to-end landscaping solution provider to our diverse customer base at the national, regional and local levels, which we believe represents a significant competitive advantage. We believe our commercial customer base understands the financial and reputational risk associated with inadequate landscape maintenance and considers our services to be essential and non-discretionary.
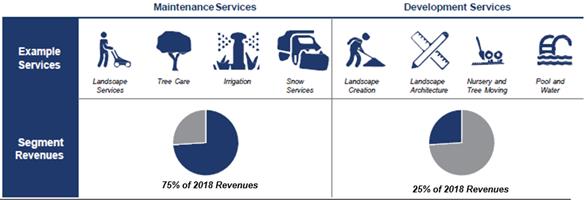
We operate through two segments: Maintenance Services and Development Services. Our maintenance services are primarily self-performed through our national branch network and are route-based in nature. Our development services are comprised of sophisticated design, coordination and installation of landscapes at some of the most recognizable corporate, athletic and university complexes and showcase highly visible work that is paramount to our customers’ perception of our brand as a market leader.
As the number one player in the highly attractive and growing $63 billion commercial landscape maintenance and snow removal market, we believe our size and scale present several compelling value propositions for our customers, and allow us to offer a single-source landscaping services solution to a diverse group of commercial customers across all 50 U.S. states and Puerto Rico. We serve a broad range of end market verticals, including corporate and commercial properties, HOAs, public parks, hotels and resorts, hospitals and other healthcare facilities, educational institutions, restaurants and retail, and golf courses, among others. Our diverse customer base includes approximately 13,000 office parks and corporate campuses, 9,000 residential communities, and 450 educational institutions. We believe that due to our unmatched geographic scale and breadth of service offerings, we are the only commercial landscaping services provider able to service clients whose geographically disperse locations require a broad range of landscaping services delivered consistently and with high quality. Our top ten customers accounted for approximately 10% of our fiscal 2018 revenues, with no single customer accounting for more than 2% of our fiscal 2018 revenues. Our customers consistently trust us with their most complex and demanding landscaping projects, including the iconic example of the ongoing maintenance of Fiat Chrysler America’s U.S. headquarters, which was recently honored with the Grand Award for Turf Maintenance by the National Association of Landscape Professionals.
Our business model is characterized by stable, recurring revenues, a scalable operating model, strong and improving operating margins, limited capital expenditures and low working capital requirements that together generate significant Free Cash Flow. For the year ended September 30, 2018, we generated net service revenues of $2,353.6 million, net loss of $15.1 million and Adjusted EBITDA of $300.1 million, with a net loss margin of 0.6% and an Adjusted EBITDA margin of 12.8%.
1
We deliver our broad range of services through two operating segments: Maintenance Services and Development Services. We serve a geographically diverse set of customers through our strategically located network of branches in 31 U.S. states and, through our qualified service partner network, we are able to efficiently provide nationwide coverage in all 50 U.S. states and Puerto Rico, as illustrated below.
Maintenance Services Overview
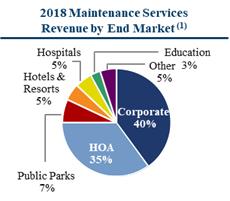
Our Maintenance Services segment delivers a full suite of recurring commercial landscaping services ranging from mowing, gardening, mulching and snow removal, to more horticulturally advanced services, such as water management, irrigation maintenance, tree care, golf course maintenance and specialty turf maintenance. Our maintenance services customers include Fortune 500 corporate campuses and commercial properties, HOAs, public parks, leading international hotels and resorts, airport authorities, municipalities, hospitals and other healthcare facilities, educational institutions, restaurants and retail, and golf courses, among others. The chart below illustrates the diversity of our Maintenance Services revenues:
|
(1) |
Reflects the year ended September 30, 2018. |
2
In addition to contracted maintenance services, we also have a strong track record of providing value-added landscape enhancements, defined as supplemental, non-contract specified maintenance or improvement services which are typically sold on-site to our maintenance services customers. These landscape enhancements typically have a predictable level of demand related to our amount of contracted revenue with a customer.
We have a strong maintenance presence in both evergreen and seasonal markets. Evergreen markets are defined as those which require year-round landscape maintenance. As part of our Maintenance Services growth plan, we are actively targeting evergreen geographies, such as California, Florida and Texas, where there are a number of secular demographic trends, such as population growth and business expansion, which represent a compelling growth opportunity.
In our seasonal markets, we are also a leading provider of snow removal services. These route-based snow removal services provide us with a valuable counter-seasonal source of revenues, allowing us to better utilize our crews and certain equipment during the winter months. Our capabilities as a rapid-response, reliable service provider further strengthens our relationships with our customers, all of which have an immediate and critical need for snow removal services. Property managers also enjoy several benefits by using the same service provider for snow removal and landscape maintenance services, including consistency of service, single-source vendor efficiency and volume discount savings. This allows us to actively maintain relationships with key customers in seasonal markets. A portion of our snow removal business is contracted each year under fixed fee servicing arrangements that are subject to guaranteed minimum payments regardless of the season’s snowfall.
The performance of our snow removal services business, however, is correlated with the amount of snowfall and number of snowfall events in a given season. We benchmark our performance against ten- and thirty-year averages, as annual snowfall amounts modulate around these figures.
Cumulative Annual Snowfall in BrightView Locations Over Time (1)

|
(1) |
Reflects cumulative annual snowfall at locations where BrightView has a presence. |
For the year ended September 30, 2018, in Maintenance Services, we generated net service revenues of $1,774.8 million and Segment Adjusted EBITDA of $289.8 million, with a Segment Adjusted EBITDA Margin of 16.3%.
Development Services Overview
Through our Development Services segment, we provide landscape architecture and development services for new facilities and significant redesign projects. Specific services include project design and management services, landscape architecture, landscape installation, irrigation installation, tree nursery and installation, pool and water features and sports field services, among others. These complex and specialized offerings showcase our technical expertise across a broad range of end market verticals.
We perform our services across the full spectrum of project sizes, with landscape development projects generally ranging from $100,000 to over $10 million, with an average size of approximately $1 million.
3
Depending on the scope of the work, the contracts can vary in length from 2-3 months to up to 2-3 years. We largely self-perform our work, and we subcontract certain services where we have strategically decided not to allocate resources, such as fencing, lighting and parking lot construction. We believe that our capabilities as a single-source landscape development provider represent a point of comfort for our customers who can be certain that we are managing their landscape development project from inception to completion.
In our Development Services business, we are typically hired by general contractors with whom we maintain strong relationships as a result of our superior technical and project management capabilities. We believe the quality of our work is also well-regarded by our end-customers, some of whom directly request that their general contractors utilize our services when outsourcing their landscape development projects. Similar to our maintenance contracts, we leverage our proven cost estimation framework and proactive cost management tactics to optimize the profitability of the work we perform under fixed rate development contracts.
For the year ended September 30, 2018, in Development Services, we generated net service revenues of $583.3 million and Segment Adjusted EBITDA of $78.7 million, with a Segment Adjusted EBITDA Margin of 13.5%.
Our History
In 2013, affiliates of KKR acquired our predecessor business, Brickman Holding Group, Inc. In 2014, we acquired ValleyCrest Holding Co. (“ValleyCrest Acquisition”) and changed our name to BrightView. As a result of the ValleyCrest Acquisition, BrightView nearly doubled in size and gained national coverage. Our predecessor companies have long histories in the landscaping industry, with Brickman Holding Group, Inc. founded in 1939 and ValleyCrest Holding Co. founded in 1949.
In 2016, we reconstituted our senior leadership team, including hiring a new chief executive officer and a new chief financial officer. Our management team refocused our strategy to realign with the fundamental strengths of our business. BrightView has undergone an organizational transformation recentered around a branch-centric model, empowering leaders at the local and regional levels, and supporting branch locations with appropriate back office functions and an effective corporate framework.
In July 2018, we completed the initial public offering of our common stock (the “IPO”). Our common stock trades on the New York Stock Exchange under the symbol “BV”. Our principal executive offices are located at 401 Plymouth Road, Suite 500, Plymouth Meeting, Pennsylvania 19462.
Market Opportunity
Commercial Landscaping Services Industry
The landscape services industry consists of landscape maintenance and development services, as well as a number of related ancillary services such as tree care and snow removal, for both commercial and residential customers. BrightView operates only within the commercial sectors of each of the landscape maintenance, landscape development and snow removal industries. Commercial landscape maintenance, including snow removal, represents a $63 billion industry that is characterized by a number of attractive market drivers. The industry benefits from commercial customers’ need to provide consistently accessible and aesthetically-pleasing environments. Due to the essential and non-discretionary need of these recurring services, the commercial landscape maintenance services and snow removal services industries have, and are expected to continue to, exhibit stable and predictable growth.
Highlighting the consistency of this growth, the combined industry is expected to grow at a 3% CAGR from 2012 through 2022, as depicted in the chart below:
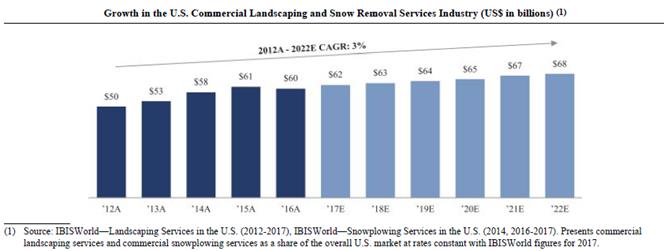
4
In addition to its stable characteristics, the industry is also highly fragmented. Despite being the largest provider of commercial landscaping services, we currently hold only a 2.8% market share, representing a significant opportunity for future consolidation. According to the 2017 IBISWorld Report, there are over 500,000 enterprises providing landscape maintenance services in the United States. Approximately three-quarters of the industry participants are classified as sole proprietors, with a limited set of companies having the capabilities to operate on a regional or national scale. The chart below illustrates the segmentation of the landscape maintenance industry and highlights BrightView’s coverage of the non-residential sectors of the industry:

Steady growth in the commercial property markets has underpinned the commercial landscaping industry’s growth. Unlike individual residential customers, HOAs and military housing managers possess the same sophistication and expectation of high-quality services as corporations, and thus are more inclined to outsource landscaping needs to professional, scaled companies.
Key Trends and Industry Drivers
We believe we are well-positioned to capitalize on the following key industry trends that are expected to drive stable and growing demand for our landscaping services:
|
|
• |
Outsourcing. To reduce expenditures and increase operational flexibility, businesses, institutions and governments are increasingly outsourcing non-core processes, such as landscape maintenance. |
|
|
• |
Sole-Sourcing. An increasing number of businesses have made an effort to lower costs and improve quality through a reduction in the number of suppliers or service vendors they hire. Companies have begun to award “sole-source” contracts to full-service vendors who are able to meet expanded requirements. |
|
|
• |
Enhanced Quality Demands. Customers are increasingly raising their expectations regarding the quality of the work performed by their landscape maintenance providers and on the variety of services offered. As demands continue to rise, market share will accrue to those providers who have the expertise, quality of service and institutional procedures to meet these enhanced expectations. |
|
|
• |
Increased Focus on Corporate Campus Environments. Corporations have increasingly invested in creating a unique and welcoming atmosphere for employees, clients and tenants by enhancing their corporate campus environments. Irrespective of whether a headquarters or corporate campus is located in an urban area or suburban area, we believe that companies are increasingly viewing their exterior landscaping as a competitive differentiator and are making significant investments to create visually appealing outdoor spaces. |
|
|
• |
Growth of Private Non-residential Construction. Over the next five years, the overall U.S. landscape maintenance industry is projected to be supported by rising construction and economic activity. According to the 2017 IBISWorld Report, private non-residential construction is forecasted to grow at an annualized rate of 4.1% over the five years leading to 2022. We believe growth in commercial construction promotes growth in commercial landscape maintenance and development services. |
5
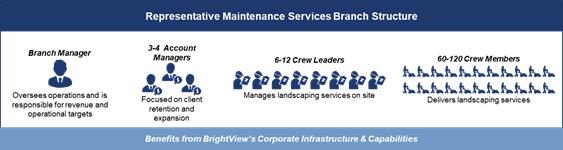
Our core operating strategy is to systematically deliver our services on a local level. Our organization is designed to allow our branch-level management teams to focus on identifying revenue opportunities and delivering high quality services to customers, with the support of a national organization to provide centralized core functions, such as human resources, procurement and other process-driven management functions.
Our maintenance services model is grounded in our branch network. For example, a representative maintenance services branch typically serves 40-150 customers across 200-300 sites, generating between $4 million and $12 million in annual revenues. Each branch is led by a branch manager, who focuses on performance drivers, such as customer satisfaction, crew retention, safety and tactical procurement. Branch managers are supported by account managers, who focus on managing crew leaders, customer retention and sales of landscape enhancement services. In addition to our network of branch managers and account managers, our platform is differentiated by a highly experienced team of operational senior vice presidents and vice presidents, organized regionally, with an average tenure of 17 years. These team members are responsible for leading, teaching and developing branch managers as well as maintaining adherence to key operational strategies. Our senior operating personnel also foster a culture of engagement and emphasize promotion from within, which has played a key role in making BrightView the employer of choice within the broader landscape maintenance industry.
Our scale supports centralizing key functions, which enables our branch and account managers to focus their efforts on fostering deep relationships with customers, delivering excellent service and finding new revenue opportunities. As branches grow and we win new business, our branch model is easily scalable within an existing, well-developed market-based management structure with supporting corporate infrastructure.
We supplement our branch network with our qualified service partner network, which is managed by our BrightView Enterprise Service team, or BES. Through our BES platform, we are able to provide landscape maintenance services in all 50 U.S. states and Puerto Rico. BES identifies qualified service providers in areas where we do not have branches, thereby extending our service area. Our qualified service partner screening process is designed to ensure that each of our service partners has the appropriate technical expertise, equipment and resources, including insurance coverage, to support the projects we assign to them.
Our Development Services organization is centered around 19 branch locations strategically located in large metropolitan areas with supportive demographics for growth and real estate development. Certain of the facilities used by our Development Services segment are shared or co-located with our Maintenance organization. Our Development Services branch network is supported by three design centers, as well as centralized support functions similar to our Maintenance Services organization.
Our Employees
As of September 30, 2018, we had a total of approximately 20,000 employees, including seasonal workers, consisting of approximately 19,400 full-time and approximately 600 part-time employees in our two business segments. The number of part-time employees varies significantly from time to time during the year due to seasonal and other operating requirements. We generally experience our highest level of employment during the spring and summer seasons, which correspond with our third and fourth fiscal quarters. The approximate number of employees by segment, as of September 30, 2018, is as follows: Maintenance Services: 17,025; Development Services: 2,700. In addition, our corporate staff is approximately 275 employees.
Approximately 6% of our employees are covered by collective bargaining agreements. We have not experienced any material interruptions of operations due to disputes with our employees and consider our relations with our employees to be satisfactory.
Historically, we have used, and expect to continue to use in the future, a U.S. government program that provides H-2B temporary, non-immigrant visas to foreign workers to help satisfy a portion of our need for seasonal labor in certain markets. In 2018, we employed approximately 829 seasonal workers through the H-2B visa program.
6
Although the United States landscaping, snow removal and landscape design and development industries have experienced some consolidation, there is significant competition in all the areas that we serve, and such competition varies across geographies. In our Maintenance Services segment, many competitors are smaller local and regional firms; however, we also face competition from other large national firms such as LandCare, Five Seasons Landscape Management and Yellowstone Landscape. In our Development Services segment, competitors are generally smaller local and regional firms. We believe that the primary competitive factors that affect our operations are quality, service, experience, breadth of service offerings and price. We believe that our ability to compete effectively is enhanced by the breadth of our services as well as our nationwide reach.
Seasonality
Our services, particularly in our Maintenance Services segment, have seasonal variability such as increased mulching, flower planting and intensive mowing in the spring, leaf removal and cleanup work in the fall, snow removal services in the winter and potentially minimal mowing during drier summer months. This can drive fluctuations in revenue, costs and cash flows for interim periods.
We have a significant presence in our evergreen markets, which require landscape maintenance services year round. In our seasonal markets, which do not have a year-round growing season, the demand for our landscape maintenance services decreases during the winter months. Typically, our revenues and net income have been higher in the spring and summer seasons, which correspond with our third and fourth fiscal quarters. The lower level of activity in seasonal markets during our first and second fiscal quarters is partially offset by revenue from our snow removal services. Such seasonality causes our results of operations to vary from quarter to quarter.
Weather Conditions
Weather may impact the timing of performance of landscape maintenance and enhancement services and progress on development projects from quarter to quarter. Less predictable weather patterns, including snow events in the winter, hurricane related cleanup in the summer and fall, and the effects of abnormally high rainfall or drought in a given market, can impact both our revenues and our costs, especially from quarter to quarter, but also from year to year in some cases. Extreme weather events such as hurricanes and tropical storms can result in a positive impact to our business in the form of increased enhancement services revenues related to cleanup and other services. However, such weather events may also negatively impact our ability to deliver our contracted services or impact the timing of performance.
In our seasonal markets, the performance of our snow removal services is correlated with the amount of snowfall and number of snowfall events in a given season. We benchmark our performance against ten- and thirty-year averages.
Intellectual Property
We, primarily through our subsidiaries, hold or have rights to use various service marks, trademarks and trade names we use in the operation of our businesses that we deem particularly important to each of our businesses. As of September 30, 2018, we had marks that were protected by registration (either by direct registration or by treaty) in the United States and Puerto Rico.
Regulatory Overview
We are subject to various federal, state and local laws and regulations, compliance with which increases our operating costs, limits or restricts the services provided by our operating segments or the methods by which our operating segments offer, sell and fulfill those services or conduct their respective businesses, or subjects us to the possibility of regulatory actions or proceedings. Noncompliance with these laws and regulations can subject us to fines or various forms of civil or criminal prosecution, any of which could have a material adverse effect on our reputation, business, financial position, results of operations and cash flows.
These federal, state and local laws and regulations include laws relating to wage and hour, immigration, permitting and licensing, workers’ safety, tax, healthcare reforms, collective bargaining and other labor matters, environmental, federal motor carrier safety, employee benefits and privacy and customer data security. We must also meet certain requirements of federal and state transportation agencies, including requirements of the U.S. Department of Transportation and Federal Motor Carrier Safety Administration, with respect to certain types of vehicles in our fleets. We are also regulated by federal, state and local laws, ordinances and regulations which are enforced by Departments of Agriculture, environmental regulatory agencies and similar government entities.
7
Employee and Immigration Matters
We are subject to various federal, state and local laws and regulations governing our relationship with and other matters pertaining to our employees, including regulations relating to wage and hour, health insurance, working conditions, safety, citizenship or work authorization and related requirements, insurance and workers’ compensation, anti-discrimination, collective bargaining and other labor matters.
We are also subject to the regulations of ICE, and we are audited from time to time by ICE for compliance with work authorization requirements. In addition, some states in which we operate have adopted immigration employment protection laws. Even if we operate in strict compliance with ICE and state requirements, some of our employees may not meet federal work eligibility or residency requirements, despite our efforts and without our knowledge, which could lead to a disruption in our work force.
Environmental Matters
Our businesses are subject to various federal, state and local laws and regulations regarding environmental, health and safety matters, including the Comprehensive Environmental Response, Compensation and Liability Act, the Federal Insecticide, Fungicide and Rodenticide Act, the Resource Conservation and Recovery Act, the Clean Air Act, the Emergency Planning and Community Right-to-Know Act, the Oil Pollution Act and the Clean Water Act, each as amended. Among other things, these laws and regulations regulate the emission or discharge of materials into the environment, govern the use, storage, treatment, disposal, handling and management of hazardous substances and wastes and the registration, use, notification and labeling of pesticides, herbicides and fertilizers, and protect the health and safety of our employees. These laws also impose liability for the costs of investigating and remediating, and damages resulting from, present and past releases of hazardous substances, including releases by us or prior owners or operators, at sites we currently own, lease or operate, customer sites or third-party sites to which we sent wastes. During fiscal 2018, there were no material capital expenditures for environmental control facilities.
Information Technology
We have invested in technology designed to accelerate business performance, enhancing our ability to support standard processes while retaining local and regional flexibility. We believe these investments position BrightView at the forefront of technology within the commercial landscaping industry, enabling us to drive operational efficiencies throughout the business. Our IT systems allow us to provide a high level of convenience and service to our customers, representing a competitive advantage that is difficult to replicate for less technologically sophisticated competitors. As an example, our proprietary platform, BrightView HOA Connect, allows HOA customers to submit service requests and landscape pictures directly to their account manager and field team, ensuring that specific service needs are accurately delivered in a timely and efficient manner. Similarly, our mobile quality site assessment application, which is designed for account managers to capture and annotate customer feedback, provides us with the ability to “walk the site” with our customers, confirm our understanding of their needs and highlight future enhancement opportunities.
We have also made significant investments in our internal IT infrastructure, such as migrating to a consolidated enterprise resource planning system and enabling shared services for accounts payable, accounts receivable and payroll. Additionally, we have implemented an electronic time capture system, or ETC, for our crew leaders in the field. ETC not only provides accurate information for compliance and payroll purposes but also enables our leadership with granular, analytically-driven insights into job costing and crew productivity.
Sales and Marketing
Our sales and marketing efforts are focused on both developing new customers and increasing penetration at existing customers. We primarily sell our services to businesses, commercial property managers, general contractors and landscape architects through our professionally trained core sales force. We have a field-based sales approach driven by our recently created 135-member business development team that is focused on winning new customers at a local level. We also have a separate 20-member sales team that is focused on targeting and capturing high-value, high-margin opportunities, including national accounts. Within our Maintenance Services segment, every customer relationship is maintained by one of our 700+ branch-level account managers, who are responsible for ensuring customer satisfaction, tracking service levels, promoting enhancement services and driving contract renewals. We believe our decentralized approach to customer acquisition and management facilitates a high-level of customer service as local managers are empowered and incentivized to better serve customers and grow their respective businesses.
Our marketing department is also integral to our strategy and helps drive business growth, retention and brand awareness through marketing and communications efforts, including promotional materials, marketing programs, and advertising; digital marketing, including search engine optimization and website development; and trade shows and company-wide public relations activities. Our field marketing teams focus at the branch level to make our corporate marketing strategies more localized. Given the local nature of our operations, we believe that a sizeable amount of our new sales are also driven by customer referrals which stem from our strong reputation, depth of customer relationships and quality of work.
8
We have successfully rebranded our fleet of approximately 9,500 trucks and trailers following the ValleyCrest Acquisition, ensuring that our vehicles foster the strong brand equity associated with BrightView. We manage our fleet with a dedicated centralized team, as well as regional equipment managers, who together focus on compliance, maintenance, asset utilization and procurement. We believe we have the largest fleet of vehicles in the commercial landscape maintenance industry.
Sourcing and Suppliers
Our size and broad national network make us an attractive partner for many industry-leading manufacturers and suppliers, which has allowed us to maintain strong, long-term relationships with our supply base.
We source our equipment, supplies and other related materials and products from a range of suppliers, including landscaping equipment companies, suppliers of fertilizer, seed, chemicals and other agricultural products, irrigation equipment manufacturers, and a variety of suppliers who specialize in nursery goods, outdoor lighting, hardscapes and other landscaping products.
We generally procure our products through purchase orders rather than under long-term contracts with firm commitments. We work to develop strong relationships with a select group of suppliers that we target based on a number of factors, including brand and market recognition, price, quality, product support and service, service levels, delivery terms and their strategic positioning.
Where You Can Find More Information
We file annual, quarterly and current reports, proxy statements and other information with the Securities and Exchange Commission (“SEC”). Our SEC filings are available to the public over the internet at the SEC’s website at https://www.sec.gov. Our SEC filings are also available on our website at https://www.brightview.com as soon as reasonably practicable after they are filed with or furnished to the SEC.
We maintain an internet site at https://www.brightview.com. From time to time, we may use our website as a distribution channel of material company information. Financial and other important information regarding us is routinely accessible through and posted on our website at https://investor.brightview.com. In addition, you may automatically receive email alerts and other information about us when you enroll your email address by visiting the Email Alerts section at https://investor.brightview.com. Our website and the information contained on or connected to that site are not incorporated into this Annual Report on Form 10-K.
You should carefully consider the following risk factors as well as the other information included in this Form 10-K, including “Item 6. Selected Financial Data”, “Management’s Discussion and Analysis of Financial Condition and Results of Operations” and our consolidated financial statements and related notes thereto. Any of the following risks could materially and adversely affect our business, financial condition, or results of operations. The selected risks described below, however, are not the only risks facing us. Additional risks and uncertainties not currently known to us or those we currently view to be immaterial may also materially and adversely affect our business, financial condition, or results of operations.
Risks Related to Our Business
Our business is affected by general business, financial market and economic conditions, which could adversely affect our financial position, results of operations and cash flows.
Our business and results of operations are significantly affected by general business, financial market and economic conditions. General business, financial market and economic conditions that could impact the level of activity in the commercial landscape services industry include the level of commercial construction activity, the condition of the real estate markets where we operate, interest rate fluctuations, inflation, unemployment and wage levels, tax rates, capital spending, bankruptcies, volatility in both the debt and equity capital markets, liquidity of the global financial markets, the availability and cost of credit, investor and consumer confidence, global economic growth, local, state and federal government regulation, and the strength of regional and local economies in which we operate. These factors could also negatively impact the timing or the ultimate collection of accounts receivable, which would adversely impact our business, financial position, results of operations and cash flows.
During an economic downturn, our customers may decrease their spending on landscape services by seeking to reduce expenditures for landscape services, in particular enhancement services, engaging a lower cost service provider or performing landscape maintenance themselves rather than outsourcing to third parties like us or generally reducing the size and complexity of their new landscaping development projects.
9
Our industry and the markets in which we operate are highly competitive and increased competitive pressures could reduce our share of the markets we serve and adversely affect our business, financial position, results of operations and cash flows.
We operate in markets with relatively few large competitors, but barriers to entry in the landscape services industry are generally low, which has led to highly competitive markets consisting of various sized entities, ranging from small or local operators to large regional businesses, as well as potential customers that choose not to outsource their landscape maintenance services. Any of our competitors may foresee the course of market development more accurately than we do, provide superior service, have the ability to deliver similar services at a lower cost, develop stronger relationships with our customers and other consumers in the landscape services industry, adapt more quickly to evolving customer requirements than we do, devote greater resources to the promotion and sale of their services or access financing on more favorable terms than we can obtain. In addition, while regional competitors may be smaller than we are, some of these regional competitors may have a greater presence than we do in a particular market. As a result of any of these factors, we may not be able to compete successfully with our competitors, which could have an adverse effect on our business, financial position, results of operations and cash flows.
Our customers consider the quality and differentiation of the services we provide, our customer service and price when deciding whether to use our services. As we have worked to establish ourselves as leading, high-quality providers of landscape maintenance and development services, we compete predominantly on the basis of high levels of service and strong relationships. We may not be able to, or may choose not to, compete with certain competitors on the basis of price. If we are unable to differentiate our services on the basis of high levels of service, quality and strong relationships, a greater proportion of our customers may switch to lower cost services providers or perform such services themselves. If we are unable to compete effectively with our existing competitors or new competitors enter the markets in which we operate, or our current customers stop outsourcing their landscape maintenance services, our financial position, results of operations and cash flows may be materially and adversely affected.
In addition, former employees may start landscape services businesses similar to ours and compete directly with us. Our industry faces low barriers to entry, making the possibility of former employees starting similar businesses more likely. While we customarily sign non-competition agreements, which typically continue for one year following the termination of employment, with our account managers, branch managers and certain other officers, such agreements do not fully protect us against competition from former employees. Enforceability of these non-competition agreements varies from state to state, and state courts will generally examine all of the facts and circumstances at the time a party seeks to enforce a non-competition agreement. Consequently, we cannot predict with certainty whether, if challenged, a court will enforce any particular non-competition agreement. Any increased competition from businesses started by former employees may reduce our market share and adversely affect our business, financial position, results of operations and cash flows.
Our business success depends on our ability to preserve long-term customer relationships.
Our success depends on our ability to retain our current customers, renew our existing customer contracts and obtain new business. Our ability to do so generally depends on a variety of factors, including the quality, price and responsiveness of our services, as well as our ability to market these services effectively and differentiate ourselves from our competitors. We largely seek to differentiate ourselves from our competitors on the basis of high levels of service, breadth of service offerings and strong relationships and may not be able to, or may choose not to, compete with certain competitors on the basis of price. There can be no assurance that we will be able to obtain new business, renew existing customer contracts at the same or higher levels of pricing or that our current customers will not cease operations, elect to self-operate or terminate contracts with us.
With respect to our Maintenance Services segment, we primarily provide services pursuant to agreements that are cancelable by either party upon 30-days’ notice. Consequently, our customers can unilaterally terminate all services pursuant to the terms of our service agreements, without penalty.
We may be adversely affected if customers reduce their outsourcing.
Our business and growth strategies benefit from the continuation of a current trend toward outsourcing services. Customers will outsource if they perceive that outsourcing may provide quality services at a lower overall cost and permit them to focus on their core business activities. We cannot be certain that this trend will continue or not be reversed or that customers that have outsourced functions will not decide to perform these functions themselves. If a significant number of our existing customers reduced their outsourcing and elected to perform the services themselves, such loss of customers could have a material adverse impact on our business, financial position, results of operations and cash flows.
Because we operate our business through dispersed locations across the United States, our operations may be materially adversely affected by inconsistent practices and the operating results of individual branches may vary.
We operate our business through a network of dispersed locations throughout the United States, supported by corporate executives and certain centralized services in our headquarters, with local branch management retaining responsibility for day-to-day operations and adherence to applicable local laws. Our operating structure could make it difficult for us to coordinate procedures across our operations in a timely manner or at all. We may have difficulty attracting and retaining local personnel. In addition, our
10
branches may require significant oversight and coordination from headquarters to support their growth. In addition, the operating results of an individual branch may differ from that of another branch for a variety of reasons, including market size, management practices, competitive landscape, regulatory requirements and local economic conditions. Inconsistent implementation of corporate strategy and policies at the local level could materially and adversely affect our business, financial position, results of operations and cash flows.
We may not successfully implement our business strategies, including achieving our growth objectives.
We may not be able to fully implement our business strategies or realize, in whole or in part within the expected time frames, the anticipated benefits of our various growth or other initiatives. Our various business strategies and initiatives, including our growth, operational and management initiatives, are subject to business, economic and competitive uncertainties and contingencies, many of which are beyond our control. The execution of our business strategy and our financial performance will continue to depend in significant part on our executive management team and other key management personnel, our ability to identify and complete suitable acquisitions and our executive management team’s ability to execute the new operational initiatives that they are undertaking. In addition, we may incur certain costs as we pursue our growth, operational and management initiatives, and we may not meet anticipated implementation timetables or stay within budgeted costs. As these initiatives are undertaken, we may not fully achieve our expected efficiency improvements or growth rates, or these initiatives may not be successful or could adversely impact our customer retention, supplier relationships or operations. Also, our business strategies may change from time to time in light of our ability to implement our business initiatives, competitive pressures, economic uncertainties or developments, or other factors.
Future acquisitions or other strategic transactions could negatively impact our reputation, business, financial position, results of operations and cash flows.
We have acquired businesses in the past and expect to continue to acquire businesses or assets in the future. However, there can be no assurance that we will be able to identify and complete suitable acquisitions. For example, due to the highly fragmented nature of our industry, it may be difficult for us to identify potential targets with revenues sufficient to justify taking on the risks associated with pursuing their acquisition. The failure to identify suitable acquisitions and successfully integrate these acquired businesses may limit our ability to expand our operations and could have an adverse effect on our business, financial position and results of operations.
In addition, acquired businesses may not perform in accordance with expectations, and our business judgments concerning the value, strengths and weaknesses of acquired businesses may not prove to be correct. We may also be unable to achieve expected improvements or achievements in businesses that we acquire. The process of integrating an acquired business may create unforeseen difficulties and expenses, including:
|
|
• |
the diversion of resources needed to integrate new businesses, technologies, services, personnel or systems; |
|
|
• |
the inability to retain employees, customers and suppliers; |
|
|
• |
difficulties implementing our strategy at the acquired business; |
|
|
• |
the assumption of actual or contingent liabilities (including those relating to the environment); |
|
|
• |
failure to effectively and timely adopt and adhere to our internal control processes, accounting systems and other policies; |
|
|
• |
write-offs or impairment charges relating to goodwill and other intangible assets; |
|
|
• |
unanticipated liabilities relating to acquired businesses; and |
|
|
• |
potential expenses associated with litigation with sellers of such businesses. |
If management is not able to effectively manage the integration process, or if any significant business activities are interrupted as a result of the integration process, we may not be able to realize anticipated benefits and revenue opportunities resulting from acquisitions and our business could suffer. Although we conduct due diligence investigations prior to each acquisition, there can be no assurance that we will discover or adequately protect against all material liabilities of an acquired business for which we may be responsible as a successor owner or operator.
In connection with our acquisitions, we generally require that key management and former principals of the businesses we acquire enter into non-competition agreements in our favor. Enforceability of these non-competition agreements varies from state to state, and state courts will generally examine all of the facts and circumstances at the time a party seeks to enforce a non-competition agreement. Consequently, we cannot predict with certainty whether, if challenged, a court will enforce any particular non-competition agreement. If one or more former principals or members of key management of the businesses we acquire attempt to compete with us and the courts refuse to enforce the non-competition agreement entered into by such person or persons, we might be subject to increased competition, which could materially and adversely affect our business, financial position, results of operations and cash flows.
11
Seasonality affects the demand for our services and our results of operations and cash flows.
The demand for our services and our results of operations are affected by the seasonal nature of our landscape maintenance services in certain regions. In geographies that do not have a year-round growing season, the demand for our landscape maintenance services decreases during the winter months. Typically, our revenues and net income have been higher in the spring and summer seasons, which correspond with our third and fourth fiscal quarters. The lower level of activity in seasonal markets during our first and second fiscal quarters is partially offset by revenue from our snow removal services. In our Development Services segment, we typically experience lower activity levels during the winter months. Such seasonality causes our results of operations to vary from quarter to quarter. Due to the seasonal nature of the services we provide, we also experience seasonality in our employment and working capital needs. Our employment and working capital needs generally correspond with the increased demand for our services in the spring and summer months and employment levels and operating costs are generally at their highest during such months. Consequently, our results of operations and financial position can vary from year-to-year, as well as from quarter-to-quarter. If we are unable to effectively manage the seasonality and year-to-year variability, our results of operations, financial position and cash flow may be adversely affected.
Our operations are impacted by weather conditions.
We perform landscape services, the demand for which is affected by weather conditions, including, without limitation, potential impacts from climate change, droughts, severe storms and significant rain or snowfall, all of which may impact the timing and frequency of the performance of our services, or our ability to perform the services at all. For example, severe weather conditions, such as excessive heat or cold, may result in maintenance services being omitted for part of a season or beginning or ending earlier than anticipated, which could result in lost revenues or require additional services to be performed for which we may not receive corresponding incremental revenues. Variability in the frequency of which we must perform our services can affect the margins we realize on a given contract.
Certain extreme weather events, such as hurricanes and tropical storms, can result in increased enhancement revenues related to cleanup and other services. However, such weather events may also impact our ability to deliver our contracted services or cause damage to our facilities or equipment. These weather events can also result in higher fuel costs, higher labor costs and shortages of raw materials and products. As a result, a perceived earnings benefits related to extreme weather events may be moderated.
Additionally, droughts could cause shortage in the water supply and governments may impose limitations on water usage, which may change customer demand for landscape maintenance and irrigation services. There is a risk that demand for our services will change in ways that we are unable to predict.
Increases in raw material costs, fuel prices, wages and other operating costs could adversely impact our business, financial position, results of operations and cash flows.
Our financial performance may be adversely affected by increases in the level of our operating expenses, such as fuel, fertilizer, chemicals, road salt, mulch, wages and salaries, employee benefits, health care, subcontractor costs, vehicle, facilities and equipment leases, self-insurance costs and other insurance premiums as well as various regulatory compliance costs, all of which may be subject to inflationary pressures. While we seek to manage price and availability risks related to raw materials, such as fuel, fertilizer, chemicals, road salt and mulch, through procurement strategies, these efforts may not be successful and we may experience adverse impacts due to rising prices of such products. In addition, we closely monitor wage, salary and benefit costs in an effort to remain competitive in our markets. Attracting and maintaining a high quality workforce is a priority for our business, and if wage, salary or benefit costs increase, including as a result of minimum wage legislation, our operating costs will increase, and have increased in the past.
We cannot predict the extent to which we may experience future increases in operating expenses as well as various regulatory compliance costs. To the extent such costs increase, we may be prevented, in whole or in part, from passing these cost increases through to our existing and prospective customers, which could have a material adverse impact on our business, financial position, results of operations and cash flows.
Product shortages, loss of key suppliers, failure to develop relationships with qualified suppliers or dependence on third-party suppliers and manufacturers could affect our financial health.
Our ability to offer a wide variety of services to our customers is dependent upon our ability to obtain adequate supplies, materials and products from manufacturers, distributors and other suppliers. Any disruption in our sources of supply, particularly of the most commonly used items, including fertilizer, chemicals, road salt and mulch, could result in a loss of revenues, reduced margins and damage to our relationships with customers. Supply shortages may occur as a result of unanticipated increases in demand or difficulties in production or delivery.
12
Additionally, as part of our procurement strategy, we source certain materials and products we use in our business from a limited number of suppliers. We have historically purchased more than 10% of our direct material costs from a single supplier. If our suppliers experience difficulties or disruptions in their operations or if we lose any significant supplier, we may experience increased supply costs or may experience delays in establishing replacement supply sources that meet our quality and control standards. The loss of, or a substantial decrease in the availability of, supplies and products from our suppliers or the loss of key supplier arrangements could adversely impact our business, financial position, results of operations and cash flows.
If we are unable to accurately estimate the overall risks, requirements or costs when we bid on or negotiate contracts that are ultimately awarded to us, we may achieve lower than anticipated profits or incur contract losses.
A significant portion of our contracts are subject to competitive bidding and/or are negotiated on a fixed- or capped-fee basis for the services covered. Such contracts generally require that the total amount of work, or a specified portion thereof, be performed for a single price irrespective of our actual costs. If our cost estimates for a contract are inaccurate, or if we do not execute the contract within our cost estimates, then cost overruns may cause the contract not to be as profitable as we expected or could cause us to incur losses.
Our results of operations from our landscape development services are subject to periodic fluctuations. Our landscape development services have been, and in the future may be, adversely impacted by declines in the new commercial construction sector, as well as in spending on repair and upgrade activities. Such variability in this part of our business could result in lower revenues and reduced cash flows and profitability.
With respect to our Development Services segment, a significant portion of our revenues are derived from development activities associated with new commercial real estate development, including hospitality and leisure, which has experienced periodic declines, some of which have been severe. The strength of these markets depends on, among other things, housing starts, local occupancy rates, demand for commercial space, non-residential construction spending activity, business investment and general economic conditions, which are a function of many factors beyond our control, including interest rates, employment levels, availability of credit, consumer spending, consumer confidence and capital spending. During a downturn in the commercial real estate development industry, customers may decrease their spending on landscape development services by generally reducing the size and complexity of their new landscaping development projects. Additionally, as interest rates rise, as they have in response to the Federal Reserve increasing the federal funds rate since December 2015, there may be a decrease in the spending activities of our current and potential Development Services customers. Fluctuations in commercial real estate development markets could have an adverse effect on our business, financial position, results of operations or cash flows.
Our results of operations for our snow removal services depend primarily on the level, timing and location of snowfall. As a result, a decline in frequency or total amounts of snowfall in multiple regions for an extended time could cause our results of operations to decline and adversely affect our ability to generate cash flow.
As a provider of snow removal services, our revenues are impacted by the frequency, amount, timing and location of snowfall in the regions in which we offer our services. A high number of snowfalls in a given season generally has a positive effect on the results of our operations. However, snowfall in the months of March, April, October and/or November could have a potentially adverse effect on ordinary course maintenance landscape services typically performed during those periods. A low level or lack of snowfall in any given year in any of the snow-belt regions in North America (primarily the Midwest, Mid-Atlantic and Northeast regions of the United States) or a sustained period of reduced snowfall events in one or more of the geographic regions in which we operate will likely cause revenues from our snow removal services to decline in such year, which in turn may adversely affect our revenues, results of operations and cash flow.
In the past ten- and thirty-year periods, the regions that we service have averaged 2,785 inches and 2,573 inches of annual snowfall, respectively. However, there can be no assurance that these regions will receive seasonal snowfalls near their historical average in the future. Variability in the frequency and timing of snowfalls creates challenges associated with budgeting and forecasting for the Maintenance Services segment.
Additionally, the potential effects of climate change may impact the frequency and total amounts of future snowfall, which could have a material adverse effect on our revenues, results of operations and cash flow.
Our success depends on our executive management and other key personnel.
Our future success depends to a significant degree on the skills, experience and efforts of our executive management and other key personnel and their ability to provide us with uninterrupted leadership and direction. The failure to retain our executive officers and other key personnel or a failure to provide adequate succession plans could have an adverse impact. The availability of highly qualified talent is limited, and the competition for talent is robust. A failure to efficiently or effectively replace executive management members or other key personnel and to attract, retain and develop new qualified personnel could have an adverse effect on our operations and implementation of our strategic plan.
13
Our future success depends on our ability to attract, retain and maintain positive relations with trained workers.
Our future success and financial performance depend substantially on our ability to attract, train and retain workers, including account, branch and regional management personnel. The landscape services industry is labor intensive, and industry participants, including us, experience high turnover rates among hourly workers and competition for qualified supervisory personnel. In addition we, like many landscape service providers who conduct a portion of their operations in seasonal climates, employ a portion of our field personnel for only part of the year.
We have historically relied on the H-2B visa program to bring workers to the United States on a seasonal basis. In 2018, we employed approximately 829 seasonal workers through the H-2B visa program. If we are unable to hire sufficient numbers of seasonal workers, through the H-2B program or otherwise, we may experience a labor shortage. In the event of a labor shortage, whether related to seasonal or permanent staff, we could experience difficulty in delivering our services in a high-quality or timely manner and could experience increased recruiting, training and wage costs in order to attract and retain employees, which would result in higher operating costs and reduced profitability.
As of September 30, 2018, we had approximately 20,000 employees, approximately 6% of which are represented by a union pursuant to collective bargaining agreements. If a significant number of our employees were to unionize, including in the wake of any future legislation that makes it easier for employees to unionize, our business could be negatively affected. Any inability by us to negotiate collective bargaining arrangements could result in strikes or other work stoppages disrupting our operations, and new union contracts could increase operating and labor costs. If these labor organizing activities were successful, it could further increase labor costs, decrease operating efficiency and productivity in the future, or otherwise disrupt or negatively impact our operations. Moreover, certain of the collective bargaining agreements we participate in require periodic contributions to multiemployer defined benefit pension plans. Our required contributions to these plans could increase because of a shrinking contribution base as a result of the insolvency or withdrawal of other companies that currently contribute to these plans, the inability or failure of withdrawing companies to pay their withdrawal liability, low interest rates, lower than expected returns on pension fund assets or other funding deficiencies. Additionally, in the event we were to withdraw from some or all of these plans as a result of our exiting certain markets or otherwise, and the relevant plans are underfunded, we may become subject to a withdrawal liability. The amount of these required contributions may be material.
Our business could be adversely affected by a failure to properly verify the employment eligibility of our employees.
We use the “E-Verify” program, an Internet-based program run by the U.S. government, to verify employment eligibility for all new employees throughout our company. However, use of E-Verify does not guarantee that we will successfully identify all applicants who are ineligible for employment. Although we use E-Verify and require all new employees to provide us with government-specified documentation evidencing their employment eligibility, some of our employees may, without our knowledge, be unauthorized workers. The employment of unauthorized workers may subject us to fines or penalties, and adverse publicity that negatively impacts our reputation and may make it more difficult to hire and keep qualified employees. We are subject to regulations of U.S. Immigration and Customs Enforcement, or ICE, and we are audited from time to time by ICE for compliance with work authentication requirements. While we believe we are in compliance with applicable laws and regulations, if we are found not to be in compliance as a result of any audits, we may be subject to fines or other remedial actions. See “Business—Regulatory Overview—Employee and Immigration Matters.”
Termination of a significant number of employees in specific markets or across our company due to work authorization or other regulatory issues would disrupt our operations, and could also cause additional adverse publicity and temporary increases in our labor costs as we train new employees. We could also become subject to fines, penalties and other costs related to claims that we did not fully comply with all recordkeeping obligations of federal and state immigration compliance laws. Our reputation and financial performance may be materially harmed as a result of any of these factors. Furthermore, immigration laws have been an area of considerable political focus in recent years, and the U.S. Congress and the Executive Branch of the U.S. government from time to time consider or implement changes to federal immigration laws, regulations or enforcement programs.
Further changes in immigration or work authorization laws may increase our obligations for compliance and oversight, which could subject us to additional costs and potential liability and make our hiring process more cumbersome, or reduce the availability of potential employees.
14
Our use of subcontractors to perform work under certain customer contracts exposes us to liability and financial risk.
In our Development Services segment and through our qualified service partner network in our Maintenance Services segment, we use subcontractors to perform work in situations in which we are not able to self-perform the work involved. If we are unable to hire qualified subcontractors, our ability to successfully complete a project or perform services could be impaired. If we are not able to locate qualified third-party subcontractors or the amount we are required to pay for subcontractors exceeds what we have estimated, especially in a fixed- or capped-fee contract, these contracts may not be as profitable as we expected or we could incur losses. In addition, contracts which require work to be performed by subcontractors may yield a lower margin than contracts where we self-perform the work.
Such arrangements may involve subcontracts where we do not have direct control over the performing party. A failure to perform, for whatever reason, by one or more of our subcontractors, or the alleged negligent performance of, the agreed-upon services may damage our reputation or expose us to liability. Although we have in place controls and programs to monitor the work of our subcontractors, there can be no assurance that these controls or programs will have the desired effect, and we may incur significant damage to our reputation or liability as a result of the actions or inactions of one or more of our subcontractors, any of which could have a material adverse effect on our business, financial position and results of operations.
Furthermore, while we screen subcontractors on a variety of criteria, including insurance, the level of insurance carried by our subcontractors varies. If our subcontractors are unable to cover the cost of damages or physical injuries caused by their actions, whether through insurance or otherwise, we may be held liable, regardless of any indemnification agreements in place.
A significant portion of our assets consists of goodwill and other intangible assets, the value of which may be reduced if we determine that those assets are impaired.
On December 18, 2013, an affiliate of KKR, indirectly acquired a controlling interest in our company. On June 30, 2014, we acquired ValleyCrest Holding Co., a landscape horticultural company that provides landscape maintenance, enhancement, snow removal and development services for commercial customers, primarily in California, Florida and Texas. As a result of the KKR Acquisition and the ValleyCrest Acquisition, we applied the acquisition method of accounting. Goodwill is recorded as the difference, if any, between the aggregate consideration paid for an acquisition and the fair value of the tangible and identifiable intangible assets acquired, liabilities assumed and any non-controlling interest. Intangible assets, including goodwill, are assigned to our segments based upon their fair value at the time of acquisition. In accordance with accounting principles generally accepted in the United States of America (“GAAP”), goodwill and indefinite lived intangible assets are evaluated for impairment annually, or more frequently if circumstances indicate impairment may have occurred. As of September 30, 2018, the net carrying value of goodwill and other intangible assets, net, represented $2,057.2 million, or 71% of our total assets. A future impairment, if any, could have a material adverse effect to our financial position or results of operations. See Note 7 “Intangible Assets, Goodwill and Acquisitions” to our audited consolidated financial statements included in Part II. Item 8 of this Form 10-K for additional information related to impairment testing for goodwill and other intangible assets and the associated charges taken.
If we fail to comply with requirements imposed by applicable law or other governmental regulations, we could become subject to lawsuits, investigations and other liabilities and restrictions on our operations that could significantly and adversely affect our business.
We are subject to governmental regulation at the federal, state, and local levels in many areas of our business, such as employment laws, wage and hour laws, discrimination laws, immigration laws, human health and safety laws, transportation laws, environmental laws, false claims or whistleblower statutes, disadvantaged business enterprise statutes, tax codes, antitrust and competition laws, intellectual property laws, governmentally funded entitlement programs and cost and accounting principles, the Foreign Corrupt Practices Act, other anti-corruption laws, lobbying laws, motor carrier safety laws and data privacy and security laws. We may be subject to review, audit or inquiry by applicable regulators from time to time.
While we attempt to comply with all applicable laws and regulations, there can be no assurance that we are in full compliance with all applicable laws and regulations or interpretations of these laws and regulations at all times or that we will be able to comply with any future laws, regulations or interpretations of these laws and regulations.
If we fail to comply with applicable laws and regulations, including those referred to above, we may be subject to investigations, criminal sanctions or civil remedies, including fines, penalties, damages, reimbursement, injunctions, seizures or disgorgements or the ability to operate our motor vehicles. The cost of compliance or the consequences of non-compliance, could have a material adverse effect on our business and results of operations. In addition, government agencies may make changes in the regulatory frameworks within which we operate that may require either the corporation as a whole or individual businesses to incur substantial increases in costs in order to comply with such laws and regulations.
15
Compliance with environmental, health and safety laws and regulations, including laws pertaining to the use of pesticides, herbicides and fertilizers, or liabilities thereunder, as well as the risk of potential litigation, could result in significant costs that adversely impact our reputation, business, financial position, results of operations and cash flows.
We are subject to a variety of federal, state and local laws and regulations relating to environmental, health and safety matters. In particular, in the United States, products containing pesticides generally must be registered with the U.S. Environmental Protection Agency, or EPA, and similar state agencies before they can be sold or applied. The pesticides we use are manufactured by independent third parties and are evaluated by the EPA as part of its ongoing exposure risk assessment and may be subject to similar evaluation by similar state agencies. The EPA, or similar state agencies, may decide that a pesticide we use will be limited or will not be re-registered for use in the United States. We cannot predict the outcome or the severity of the effect of the EPA’s, or a similar state agency’s, continuing evaluations. The failure to obtain or the cancellation of any such registration, or the partial or complete ban of such pesticides, could have an adverse effect on our business, the severity of which would depend on the products involved, whether other products could be substituted and whether our competitors were similarly affected.
The use of certain pesticides, herbicides and fertilizer products is also regulated by various federal, state and local environmental and public health and safety agencies. These regulations may require that only certified or professional users apply the product or that certain products only be used on certain types of locations. These laws may also require users to post notices on properties at which products have been or will be applied, notification to individuals in the vicinity that products will be applied in the future, or labeling of certain products or may restrict or ban the use of certain products. We can give no assurance that we can prevent violations of these or other regulations from occurring. Even if we are able to comply with all such regulations and obtain all necessary registrations and licenses, we cannot assure you that the pesticides, herbicides, fertilizers or other products we apply, or the manner in which we apply them, will not be alleged to cause injury to the environment, to people or to animals, or that such products will not be restricted or banned in certain circumstances. For example, we could be named in or subject to personal injury claims stemming from alleged environmental torts, similar to those that have been brought against certain manufacturers of herbicides. The costs of compliance, consequences of non-compliance, remediation costs and liabilities, unfavorable public perceptions of such products or products liability lawsuits could have a material adverse effect on our reputation, business, financial position, results of operations and cash flows.
In addition, federal, state and local agencies regulate the use, storage, treatment, disposal, handling and management of hazardous substances and wastes, emissions or discharges from our facilities or vehicles and the investigation and clean-up of contaminated sites, including our sites, customer sites and third-party sites to which we send wastes. We could incur significant costs and liabilities, including investigation and clean-up costs, fines, penalties and civil or criminal sanctions for non-compliance and claims by third parties for property and natural resource damage and personal injury under these laws and regulations. If there is a significant change in the facts or circumstances surrounding the assumptions upon which we operate, or if we are found to violate, or be liable under, applicable environmental and public health and safety laws and regulations, it could have a material adverse effect on future environmental capital expenditures and other environmental expenses and on our reputation, business, financial position, results of operations and cash flows. In addition, potentially significant expenditures could be required to comply with environmental laws and regulations, including requirements that may be adopted or imposed in the future.
Adverse litigation judgments or settlements resulting from legal proceedings relating to our business operations could materially adversely affect our business, financial position and results of operations.
From time to time, we are subject to allegations, and may be party to legal claims and regulatory proceedings, relating to our business operations. Such allegations, claims or proceedings may, for example, relate to personal injury, property damage, general liability claims relating to properties where we perform services, vehicle accidents involving our vehicles and our employees, regulatory issues, contract disputes or employment matters and may include class actions. See Part I. Item 3 “Legal Proceedings”. Such allegations, claims and proceedings have been and may be brought by third parties, including our customers, employees, governmental or regulatory bodies or competitors. Defending against these and other such claims and proceedings is costly and time consuming and may divert management’s attention and personnel resources from our normal business operations, and the outcome of many of these claims and proceedings cannot be predicted. If any of these claims or proceedings were to be determined adversely to us, a judgment, a fine or a settlement involving a payment of a material sum of money were to occur, or injunctive relief were issued against us, our business, financial position and results of operations could be materially adversely affected.
Currently, we carry a broad range of insurance for the protection of our assets and operations. However, such insurance may not fully cover all material expenses related to potential allegations, claims and proceedings, or any adverse judgments, fines or settlements resulting therefrom, as such insurance programs are often subject to significant deductibles or self-insured retentions or may not cover certain types of claims. In addition, we self-insure with respect to certain types of claims. To the extent we are subject to a higher frequency of claims, are subject to more serious claims or insurance coverage is not available, our liquidity, financial position and results of operations could be materially adversely affected.
16
We are also responsible for our legal expenses relating to such claims. We reserve currently for anticipated losses and related expenses. We periodically evaluate and adjust our claims reserves to reflect trends in our own experience as well as industry trends. However, ultimate results may differ from our estimates, which could result in losses over our reserved amounts.
Some of the equipment that our employees use is dangerous, and an increase in accidents resulting from the use of such equipment could negatively affect our reputation, results of operations and financial position.
Many of the services that we provide pose the risk of serious personal injury to our employees. Our employees regularly use dangerous equipment, such as lawn mowers, edgers and other power equipment. As a result, there is a significant risk of work-related injury and workers’ compensation claims. To the extent that we experience a material increase in the frequency or severity of accidents or workers’ compensation claims, or unfavorable developments on existing claims or fail to comply with worker health and safety regulations, our operating results and financial position could be materially and adversely affected. In addition, the perception that our workplace is unsafe may damage our reputation among current and potential employees, which may impact our ability to recruit and retain employees, which may adversely affect our business and results of operations.
Any failure, inadequacy, interruption, security failure or breach of our information technology systems, whether owned by us or outsourced or managed by third parties, could harm our ability to effectively operate our business and could have a material adverse effect on our business, financial position and results of operations.
We have centralized certain core functions and are dependent on automated information technology systems and networks to manage and support a variety of business processes and activities. Our ability to effectively manage our business and coordinate the sourcing of supplies, materials and products and our services depend significantly on the reliability and capacity of these systems and networks. Such systems and networks are subject to damage or interruption from power outages or damages, telecommunications problems, data corruption, software errors, network failures, security breaches, acts of war or terrorist attacks, fire, flood and natural disasters. Our servers or cloud-based systems could be affected by physical or electronic break-ins, and computer viruses or similar disruptions may occur. A system outage may also cause the loss of important data or disrupt our operations. Our existing safety systems, data backup, access protection, user management, disaster recovery and information technology emergency planning may not be sufficient to prevent or minimize the effect of data loss or long-term network outages.
In addition, we may have to upgrade our existing information technology systems from time to time in order for such systems to support the needs of our business and growth strategy, and the costs to upgrade such systems may be significant. We rely on certain hardware, telecommunications and software vendors to maintain and periodically upgrade many of these systems so that we can continue to support our business. Costs and potential problems and interruptions associated with the implementation of new or upgraded systems and technology or with maintenance or adequate support of existing systems could disrupt or reduce the efficiency of our operations. We also depend on our information technology staff. If we cannot meet our staffing needs in this area, we may not be able to fulfill our technology initiatives while continuing to provide maintenance on existing systems.
We could be required to make significant capital expenditures to remediate any such failure, malfunction or breach with our information technology systems or networks. Any material disruption or slowdown of our systems, including those caused by our failure to successfully upgrade our systems, and our inability to convert to alternate systems in an efficient and timely manner could have a material adverse effect on our business, financial position and results of operations.
If we fail to protect the security of personal information about our customers, employees or third parties, we could be subject to interruption of our business operations, private litigation, reputational damage and costly penalties.
We rely on, among other things, commercially available systems, software, tools and monitoring to provide security for processing, transmission and storage of confidential information of customers, employees and third parties. Activities by third parties, advances in computer and software capabilities and encryption technology, new tools and discoveries and other events or developments may facilitate or result in a compromise or breach of these systems. Any compromises, breaches or errors in applications related to these systems could cause damage to our reputation and interruptions in our operations and could result in a violation of applicable laws, regulations, orders, industry standards or agreements and subject us to costs, penalties and liabilities. We are subject to risks caused by data breaches and operational disruptions, particularly through cyber-attack or cyber-intrusion, including by computer hackers, foreign governments and cyber terrorists. The frequency of data breaches of companies and governments has increased in recent years as the number, intensity and sophistication of attempted attacks and intrusions from around the world have increased. The occurrence of any of these events could have a material adverse impact on our reputation, business, financial position, results of operations and cash flow. Although we maintain insurance coverage for various cybersecurity risks, there can be no guarantee that all costs incurred will be fully insured.
We may not be able to adequately protect our intellectual property, which could harm the value of our brand and adversely affect our business.
Our ability to implement our business plan successfully depends in part on our ability to further build brand recognition using our trademarks, service marks and other proprietary intellectual property, including our name and logos. While it is our policy to
17
protect and defend vigorously our rights to our intellectual property, we cannot predict whether steps taken by us to protect our intellectual property rights will be adequate to prevent infringement or misappropriation of these rights. Although we believe that we have sufficient rights to all of our trademarks, service marks and other intellectual property rights, we may face claims of infringement that could interfere with our business or our ability to market and promote our brands. Any such litigation may be costly, divert resources from our business and divert the attention of management. Moreover, if we are unable to successfully defend against such claims, we may be prevented from using our trademarks, service marks or other intellectual property rights in the future and may be liable for damages, which in turn could materially adversely affect our business, financial position or results of operations.
Although we make a significant effort to avoid infringing known proprietary rights of third parties, the steps we take to prevent misappropriation, infringement or other violation of the intellectual property of others may not be successful and from time to time we may receive notice that a third party believes that our use of certain trademarks, service marks and other proprietary intellectual property may be infringing certain trademarks or other proprietary rights of such third party. Responding to and defending such claims, regardless of their merit, can be costly and time-consuming, can divert management’s attention and other resources, and we may not prevail. Depending on the resolution of such claims, we may be barred from using a specific mark or other rights, may be required to enter into licensing arrangements from the third party claiming infringement (which may not be available on commercially reasonable terms, or at all), or may become liable for significant damages.
If any of the foregoing occurs, our ability to compete could be affected or our business, financial position and results of operations may be adversely affected.
Natural disasters, terrorist attacks and other external events could adversely affect our business.
Natural disasters, terrorist attacks and other adverse external events could materially damage our facilities or disrupt our operations, or damage the facilities or disrupt the operations of our customers or suppliers. The occurrence of any such event could prevent us from providing services and adversely affect our business, financial position and results of operations.
Changes in generally accepted accounting principles in the United States could have an adverse effect on our previously reported results of operations.
Generally accepted accounting principles in the United States are subject to interpretation by the Financial Accounting Standards Board, or FASB, the SEC, and various bodies formed to promulgate and to interpret appropriate accounting principles. A change in these principles or interpretations could have a significant effect on our previously reported results of operations and could affect the reporting of transactions completed before the announcement of a change.
In May 2014, the FASB issued new revenue recognition guidance under Accounting Standards Update, or ASU, No. 2014-09, “Revenue from Contracts with Customers (Topic 606),” which will be effective for our interim and annual periods beginning after September 30, 2018. Under this new guidance, revenue is recognized when promised goods or services are transferred to customers in an amount that reflects the consideration that is expected to be received for those goods or services. The new guidance also requires additional disclosure about the nature, amount, timing, and uncertainty of revenue that is recognized. In order to be able to comply with the requirements of ASU 2014-09 beginning in the first quarter of fiscal 2019, we needed to update and enhance our internal accounting systems, processes and our internal controls over financial reporting. This has required, and will continue to require, additional investments by us, and may require incremental resources and system configurations that could increase our operating costs in future periods. The impact of adopting ASU 2014-09 will not be material to our financial results.
Additionally, our assumptions, estimates and judgments related to complex accounting matters could significantly affect our financial results. GAAP and related accounting pronouncements, implementation guidelines and interpretations with regard to a wide range of matters that are relevant to our business, including, but not limited to, revenue recognition, impairment of long-lived assets, leases and related economic transactions, intangibles, self-insurance, income taxes, property and equipment, litigation and equity-based compensation are highly complex and involve many subjective assumptions, estimates and judgments by us. Changes in these rules or their interpretation or changes in underlying assumptions, estimates or judgments by us (i) could require us to make changes to our accounting systems to implement these changes that could increase our operating costs and (ii) could significantly change our reported or expected financial performance.
Risks Related to Our Indebtedness
Our substantial indebtedness could have important adverse consequences and adversely affect our financial condition.
We have a significant amount of indebtedness. As of September 30, 2018, we had total indebtedness of $1,154.2 million, and we had availability under the Revolving Credit Facility and the Receivables Financing Agreement of $188.2 million and $35.0 million, respectively. See Note 9 “Long-term Debt” to our audited consolidated financial statements included elsewhere in this Form 10-K.
Our level of debt could have important consequences, including: making it more difficult for us to satisfy our obligations with respect to our debt; limiting our ability to obtain additional financing to fund future working capital, capital expenditures, investments
18
or acquisitions, or other general corporate requirements; requiring a substantial portion of our cash flows to be dedicated to debt service payments instead of other purposes, thereby reducing the amount of cash flows available for working capital, capital expenditures, investments or acquisitions and other general corporate purposes; increasing our vulnerability to adverse changes in general economic, industry and competitive conditions; exposing us to the risk of increased interest rates as certain of our borrowings, including borrowings under the Credit Agreement, are at variable rates of interest; limiting our flexibility in planning for and reacting to changes in the industries in which we compete; placing us at a disadvantage compared to other, less leveraged competitors; increasing our cost of borrowing; and hampering our ability to execute on our growth strategy.
Our debt agreements contain restrictions that limit our flexibility in operating our business.
The Credit Agreement imposes significant operating and financial restrictions. These covenants may limit our ability and the ability of our subsidiaries, under certain circumstances, to, among other things:
|
|
• |
incur additional indebtedness; |
|
|
• |
create or incur liens; |
|
|
• |
engage in certain fundamental changes, including mergers or consolidations; |
|
|
• |
sell or transfer assets; |
|
|
• |
pay dividends and distributions on our subsidiaries’ capital stock; |
|
|
• |
make acquisitions, investments, loans or advances; |
|
|
• |
prepay or repurchase certain indebtedness; |
|
|
• |
engage in certain transactions with affiliates; and |
|
|
• |
enter into negative pledge clauses and clauses restricting subsidiary distributions. |
The Credit Agreement also contains certain customary affirmative covenants and events of default, including a change of control. The Credit Agreement also contains a financial maintenance requirement with respect to the Revolving Credit Facility, prohibiting us from exceeding a certain first lien secured leverage ratio under certain circumstances. As a result of these covenants and restrictions, we are limited in how we conduct our business, and we may be unable to raise additional debt or equity financing to compete effectively or to take advantage of new business opportunities. The terms of any future indebtedness we may incur could include more restrictive covenants. We cannot guarantee that we will be able to maintain compliance with these covenants in the future and, if we fail to do so, that we will be able to obtain waivers from the lenders and/or amend the covenants.
Our failure to comply with the restrictive covenants described above as well as others contained in our future debt instruments from time to time could result in an event of default, which, if not cured or waived, could result in our being required to repay these borrowings before their maturity dates. In addition, any event of default or declaration of acceleration under one debt instrument could also result in an event of default under one or more of our other debt instruments. If we are unable to repay, refinance or restructure our indebtedness under our secured debt, the holders of such debt could proceed against the collateral securing that indebtedness. If we are forced to refinance these borrowings on less favorable terms or if we are unable to repay, refinance or restructure such indebtedness, our financial condition and results of operations could be adversely affected.
We may be unable to generate sufficient cash flow to satisfy our significant debt service obligations, which could have a material adverse effect on our business, financial condition and results of operations.
Our ability to make principal and interest payments on and to refinance our indebtedness will depend on our ability to generate cash in the future and is subject to general economic, financial, competitive, legislative, regulatory and other factors that are beyond our control. If our business does not generate sufficient cash flow from operations, in the amounts projected or at all, or if future borrowings are not available to us in amounts sufficient to fund our other liquidity needs, our business, financial condition and results of operations could be materially adversely affected.
If we cannot generate sufficient cash flow from operations to make scheduled principal and interest payments in the future, we may need to refinance all or a portion of our indebtedness on or before maturity, sell assets, delay capital expenditures or seek additional equity. The terms of our existing or future debt agreements may also restrict us from affecting any of these alternatives. Any refinancing of our debt could be at higher interest rates and may require us to comply with more onerous covenants, which could further restrict our business operations. Further, changes in the credit and capital markets, including market disruptions and interest rate fluctuations, may increase the cost of financing, make it more difficult to obtain favorable terms, or restrict our access to these sources of future liquidity. In addition, any failure to make scheduled payments of interest and principal on our outstanding indebtedness would likely result in a reduction of our credit rating, which could harm our ability to incur additional indebtedness on commercially reasonable terms or at all. Our inability to generate sufficient cash flow to satisfy our debt service obligations, or to refinance or restructure our obligations on commercially reasonable terms or at all, could have a material adverse effect on our
19
business, financial condition and results of operations, as well as on our ability to satisfy our obligations in respect of our indebtedness.
Despite our level of indebtedness, we and our subsidiaries may still be able to incur substantially more debt, including off-balance sheet financing, contractual obligations and general and commercial liabilities. This could further exacerbate the risks to our financial condition described above.
We and our subsidiaries may be able to incur significant additional indebtedness in the future, including off-balance sheet financings, contractual obligations and general and commercial liabilities. Although the Credit Agreement contains restrictions on the incurrence of additional indebtedness, these restrictions are subject to a number of qualifications and exceptions, and the additional indebtedness incurred in compliance with these restrictions could be substantial. In addition, we can increase the borrowing availability under the Credit Agreement by up to $303.0 million in the form of additional commitments under the Revolving Credit Facility and/or incremental term loans plus an additional amount so long as we do not exceed a specified first lien secured leverage ratio. If new debt is added to our current debt levels, the related risks that we now face could intensify.
Our variable rate indebtedness subjects us to interest rate risk, which could cause our debt service obligations to increase significantly.
Borrowings under our Credit Agreement and Receivables Financing Agreement are at variable rates of interest and expose us to interest rate risk. If interest rates increase, our debt service obligations on the variable rate indebtedness will increase even though the amount borrowed will remain the same, and our net income and cash flows, including cash available for servicing our indebtedness, will correspondingly decrease.
If the financial institutions that are part of the syndicate of our Revolving Credit Facility fail to extend credit under our facility or reduce the borrowing base under our Revolving Credit Facility, our liquidity and results of operations may be adversely affected.
We have access to capital through our Revolving Credit Facility, which is governed by the Credit Agreement. Each financial institution which is part of the syndicate for our Revolving Credit Facility is responsible on a several, but not joint, basis for providing a portion of the loans to be made under our facility. If any participant or group of participants with a significant portion of the commitments in our Revolving Credit Facility fails to satisfy its or their respective obligations to extend credit under the facility and we are unable to find a replacement for such participant or participants on a timely basis (if at all), our liquidity may be adversely affected.
We utilize derivative financial instruments to reduce our exposure to market risks from changes in interest rates on our variable rate indebtedness and we will be exposed to risks related to counterparty credit worthiness or non-performance of these instruments.
We have entered into interest rate swap instruments to limit our exposure to changes in variable interest rates. While our hedging strategy is designed to minimize the impact of increases in interest rates applicable to our variable rate debt, there can be no guarantee that our hedging strategy will be effective, and we may experience credit-related losses in some circumstances. See Note 10 “Financial Instruments Measured at Fair Value” to our audited consolidated financial statements included in Part II. Item 8 of this Form 10-K.
Risks Related to Ownership of Our Common Stock
Our stock price may change significantly, and you may not be able to resell shares of our common stock at or above the price you paid or at all, and you could lose all or part of your investment as a result.
You may not be able to resell your shares at or above your purchase price due to a number of factors such as those listed in “—Risks Related to Our Business”, “Risks Related to Our Indebtedness” and the following:
|
|
• |
results of operations that vary from the expectations of securities analysts and investors; |
|
|
• |
results of operations that vary from those of our competitors; |
|
|
• |
changes in expectations as to our future financial performance, including financial estimates and investment recommendations by securities analysts and investors; |
|
|
• |
changes in economic conditions for companies in our industry; |
|
|
• |
changes in market valuations of, or earnings and other announcements by, companies in our industry; |
|
|
• |
declines in the market prices of stocks generally, particularly those of peer companies or other companies in the service sector; |
|
|
• |
additions or departures of key management personnel; |
20
|
|
• |
announcements by us, our competitors, and our suppliers related to significant contracts, acquisitions, joint ventures, other strategic relationships or capital commitments; |
|
|
• |
changes in preferences of our customers; |
|
|
• |
changes in general economic or market conditions or trends in our industry or the economy as a whole; |
|
|
• |
changes in business or regulatory conditions; |
|
|
• |
future sales of our common stock or other securities; |
|
|
• |
investor perceptions of or the investment opportunity associated with our common stock relative to other investment alternatives; |
|
|
• |
the public’s response to press releases or other public announcements by us or third parties, including our filings with the SEC; |
|
|
• |
announcements relating to litigation or governmental investigations; |
|
|
• |
guidance, if any, that we provide to the public, any changes in this guidance or our failure to meet this guidance; |
|
|
• |
the development and sustainability of an active trading market for our stock; |
|
|
• |
changes in accounting principles; and |
|
|
• |
other events or factors, including those resulting from informational technology system failures and disruptions, natural disasters, war, acts of terrorism or responses to these events. |
Furthermore, the stock market may experience extreme volatility that, in some cases, may be unrelated or disproportionate to the operating performance of particular companies. These broad market and industry fluctuations may adversely affect the market price of our common stock, regardless of our actual operating performance. In addition, price volatility may be greater if the public float and trading volume of our common stock is low, such as that experienced in the period from July 1, 2018 to the date of this filing.
In the past, following periods of market volatility, or following periods or events unrelated to market volatility, stockholders have instituted securities class action litigation. If we were to become involved in securities litigation, it could have a substantial cost and divert resources and the attention of executive management from our business regardless of the merits or outcome of such litigation.
Because we have no current plans to pay cash dividends on our common stock, you may not receive any return on investment unless you sell your common stock for a price greater than that which you paid for it.
We have no current plans to pay cash dividends on our common stock. The declaration, amount and payment of any future dividends on our common stock will be at the sole discretion of our Board of Directors. Our Board of Directors may take into account general and economic conditions, our financial condition and results of operations, our available cash and current and anticipated cash needs, capital requirements, contractual, legal, tax and regulatory restrictions and implications on the payment of dividends by us to our stockholders or by our subsidiaries to us, including restrictions under our Credit Agreement and other indebtedness we may incur, and such other factors as our Board of Directors may deem relevant.
As a result, you may not receive any return on an investment in our common stock unless you sell our common stock for a price greater than your purchase price.
We are a holding company with no operations of our own and, as such, we depend on our subsidiaries for cash to fund all of our operations and expenses, including future dividend payments, if any.
Our operations are conducted entirely through our subsidiaries and our ability to generate cash to meet our debt service obligations or to make future dividend payments, if any, is highly dependent on the earnings and the receipt of funds from our subsidiaries via dividends or intercompany loans.
If securities analysts do not publish research or reports about our business or if they downgrade our stock or our sector, our stock price and trading volume could decline.
The trading market for our common stock will rely in part on the research and reports that industry or financial analysts publish about us or our industry. We do not control these analysts. Furthermore, if one or more of the analysts who do cover us downgrade our stock or our industry, or the stock of any of our competitors, or publish inaccurate or unfavorable research about our business, the price of our stock could decline. If one or more of these analysts stop covering us or fail to publish reports on us regularly, we could lose visibility in the market, which in turn could cause our stock price or trading volume to decline.
21
We have incurred significantly increased costs and become subject to additional regulations and requirements as a result of becoming a public company, and our management is required to devote substantial time to new compliance matters, which could lower our profits or make it more difficult to run our business.
As a public company, we have incurred significant legal, regulatory, finance, accounting, investor relations and other expenses that we did not incur as a private company, including costs associated with public company reporting requirements. As a result of having publicly traded common stock, we are also required to comply with, and incur costs associated with such compliance with, the Sarbanes-Oxley Act of 2002, (“the Sarbanes-Oxley Act”), and the Dodd-Frank Wall Street Reform and Consumer Protection Act, (“the Dodd-Frank Act”), as well as rules and regulations implemented by the SEC and the NYSE. The expenses incurred by public companies generally for reporting and corporate governance purposes have been increasing. These rules and regulations have increased our legal and financial compliance costs and made some activities more time-consuming and costly. Our management will need to devote a substantial amount of time to ensure that we comply with all of these requirements, diverting the attention of management away from revenue-producing activities. These laws and regulations also could make it more difficult or costly for us to obtain certain types of insurance, including director and officer liability insurance, and we may be forced to accept reduced policy limits and coverage or incur substantially higher costs to obtain the same or similar coverage. These laws and regulations could also make it more difficult for us to attract and retain qualified persons to serve on our Board of Directors, our board committees or as our executive officers. Furthermore, if we are unable to satisfy our obligations as a public company, we could be subject to delisting of our common stock, fines, sanctions and other regulatory action and potentially civil litigation.
Failure to comply with requirements to design, implement and maintain effective internal controls could have a material adverse effect on our business and stock price.
As a privately-held company, we were not required to evaluate our internal control over financial reporting in a manner that meets the standards of publicly traded companies required by Section 404(a) of the Sarbanes-Oxley Act, or Section 404.
As a public company, we have significant requirements for enhanced financial reporting and internal controls. The process of designing and implementing effective internal controls is a continuous effort that requires us to anticipate and react to changes in our business and the economic and regulatory environments and to expend significant resources to maintain a system of internal controls that is adequate to satisfy our reporting obligations as a public company. If we are unable to establish or maintain appropriate internal financial reporting controls and procedures, it could cause us to fail to meet our reporting obligations on a timely basis, result in material misstatements in our consolidated financial statements and harm our results of operations. In addition, we are required, pursuant to Section 404, to furnish annually, commencing in our fiscal 2019 annual report, a report by management on, among other things, the effectiveness of our internal control over financial reporting. This assessment will need to include disclosure of any material weaknesses identified by our management in our internal control over financial reporting. The rules governing the standards that must be met for our management to assess our internal control over financial reporting are complex and require significant documentation, testing and possible remediation. Testing and maintaining internal controls may divert our management’s attention from other matters that are important to our business. Our independent registered public accounting firm also will be required to issue an attestation report on effectiveness of our internal controls annually commencing with our fiscal 2019 annual report.
In connection with the implementation of the necessary procedures and practices related to internal control over financial reporting, we may identify deficiencies that we may not be able to remediate in time to meet the deadline imposed by the Sarbanes-Oxley Act for compliance with the requirements of Section 404. In addition, we may encounter problems or delays in completing the remediation of any deficiencies identified by our independent registered public accounting firm in connection with the issuance of their attestation report.
Our testing, or the subsequent testing by our independent registered public accounting firm, may reveal deficiencies in our internal controls over financial reporting that are deemed to be material weaknesses. Any material weaknesses could result in a material misstatement of our annual or quarterly consolidated financial statements or disclosures that may not be prevented or detected.
We may not be able to conclude on an ongoing basis that we have effective internal control over financial reporting in accordance with Section 404 or our independent registered public accounting firm may not issue an unqualified opinion. If either we are unable to conclude that we have effective internal control over financial reporting or our independent registered public accounting firm is unable to provide us with an unqualified report, investors could lose confidence in our reported financial information, which could have a material adverse effect on the trading price of our common stock.
Future sales, or the perception of future sales, by us or our existing stockholders, could cause the market price for our common stock to decline.
Sales of a substantial number of shares of our common stock in the public market, or the perception that such sales could occur, could substantially decrease the market price of our common stock. As of September 30, 2018, we had 104,469,663 shares of our common stock outstanding, including 1,783,907 shares of restricted stock subject to vesting. Of the outstanding shares, the 24,495,000
22
shares sold in the IPO are freely tradable without restriction or further registration under the Securities Act, except for any shares held by our affiliates, as that term is defined under Rule 144 of the Securities Act, or Rule 144, including our directors, executive officers and other affiliates (including affiliates of KKR and affiliates of MSD Partners, L.P., or MSD Partners).
The 80,932,219 shares of common stock held by our existing stockholders, including affiliates of KKR, affiliates of MSD Partners and certain of our directors and executive officers, representing 77.5% of the total outstanding shares of our common stock as of September 30, 2018, are “restricted securities” within the meaning of Rule 144 and subject to certain restrictions on resale. Restricted securities may be sold in the public market only if they are registered under the Securities Act or are sold pursuant to an exemption from registration such as Rule 144.
In connection with the IPO, we, our directors and executive officers and KKR and MSD Partners signed lock-up agreements with the underwriters that, subject to certain exceptions, restrict the disposition of, or hedging with respect to, the shares of our common stock or securities convertible into or exchangeable for shares of common stock, each held by them for 180 days following June 27, 2018, the date of our IPO, except with the prior written consent of the representatives of the underwriters. Sales of a substantial number of such shares upon expiration of the lock-up agreements, the perception that such sales may occur, or early release of these agreements, could cause our market price to fall or make it more difficult for you to sell your common stock at a time and price that you deem appropriate. Additionally, the holders of substantially all of our outstanding common stock prior to the IPO (other than affiliates of KKR) are subject to agreements that, subject to certain exceptions, restrict the disposition of, or hedging with respect to, the shares of our common stock or securities convertible into or exchangeable for shares of our common stock.
In addition, each of the Sponsors has the right, subject to certain conditions, to require us to register the sale of their shares of our common stock under the Securities Act. By exercising its registration rights and selling a large number of shares, a Sponsor could cause the prevailing market price of our common stock to decline. Certain of our other stockholders have “piggyback” registration rights with respect to future registered offerings of our common stock. As of September 30, 2018, the shares covered by registration rights represented approximately 75.9% of our total common stock outstanding. Registration of any of these outstanding shares of common stock would result in such shares becoming freely tradable without compliance with Rule 144 upon effectiveness of the registration statement.
On June 28, 2018, we filed a registration statement on Form S-8 under the Securities Act to register an aggregate of 11,349,264 shares of our common stock subject to outstanding stock options and subject to issuance under our 2018 Omnibus Incentive Plan and Employee Stock Purchase Plan. Shares registered under the registration statement on Form S-8 are available for sale in the open market, subject to limitations in the Amended Parent Limited Partnership Agreement.
As restrictions on resale end, or if the existing stockholders exercise their registration rights, the market price of our shares of common stock could drop significantly if the holders of these shares sell them or are perceived by the market as intending to sell them. These factors could also make it more difficult for us to raise additional funds through future offerings of our shares of common stock or other securities.
In the future, we may also issue equity securities in connection with investments or acquisitions. The amount of shares of our common stock issued in connection with an investment or acquisition could constitute a material portion of our then-outstanding shares of our common stock. Any issuance of additional securities in connection with investments or acquisitions may result in additional dilution to you.
We are a “controlled company” within the meaning of the NYSE rules and the rules of the SEC and, as a result, qualify for exemptions from certain corporate governance requirements. You do not have the same protections afforded to stockholders of other companies that are subject to such requirements.
The Sponsors continue to control a majority of the voting power of our outstanding common stock. As a result, we are a “controlled company” within the meaning of the corporate governance standards of the NYSE. Under these rules, a company of which more than 50% of the voting power is held by an individual, group or another company is a “controlled company” and may elect not to comply with certain corporate governance requirements, including the requirements that:
|
|
• |
a majority of our Board of Directors consist of “independent directors” as defined under the rules of the NYSE; |
|
|
• |
our Board of Directors have a compensation committee that is composed entirely of independent directors with a written charter addressing the committee’s purpose and responsibilities; and |
|
|
• |
our director nominations be made, or recommended to the full Board of Directors, by our independent directors or by a nominating committee that is composed entirely of independent directors with a written charter addressing the committee’s purpose and responsibilities. |
Because we utilize these exemptions we do not have a majority of independent directors, our compensation committee does not consist entirely of independent directors and we do not have a nominating/corporate governance committee. Accordingly, you do not
23
have the same protections afforded to stockholders of companies that are subject to all of the corporate governance requirements of the NYSE.
In addition, on June 20, 2012, the SEC adopted Rule 10C-1, under the Securities Exchange Act of 1934, as amended, or the Exchange Act, to implement provisions of the Dodd-Frank Act, pertaining to compensation committee independence and the role and disclosure of compensation consultants and other advisers to the compensation committee. The national securities exchanges (including the NYSE) have since adopted amendments to their existing listing standards to comply with provisions of Rule 10C-1, and on January 11, 2013, the SEC approved such amendments. The amended listing standards require, among others, that:
|
|
• |
compensation committees be composed of fully independent directors, as determined pursuant to new and existing independence requirements; |
|
|
• |
compensation committees be explicitly charged with hiring and overseeing compensation consultants, legal counsel and other committee advisers; and |
|
|
• |
compensation committees be required to consider, when engaging compensation consultants, legal counsel or other advisers, certain independence factors, including factors that examine the relationship between the consultant or adviser’s employer and us. |
As a “controlled company,” we are not subject to these compensation committee independence requirements.
Our Sponsors control us and their interests may conflict with ours or yours in the future.
After the IPO, the Sponsors beneficially own 69.0% of our common stock. As a result, the Sponsors are able to control the election and removal of our directors and thereby control our policies and operations, including the appointment of management, future issuances of our common stock or other securities, payment of dividends, if any, on our common stock, the incurrence or modification of indebtedness by us, amendment of our amended and restated certificate of incorporation and amended and restated bylaws and the entering into of extraordinary transactions, and their interests may not in all cases be aligned with your interests. In addition, the Sponsors and their affiliates may have an interest in pursuing acquisitions, divestitures and other transactions that, in their judgment, could enhance their investment, even though such transactions might involve risks to you. For example, the Sponsors could cause us to make acquisitions that increase our indebtedness or cause us to sell revenue-generating assets.
Our Sponsors and their affiliates are in the business of making investments in companies and may from time to time acquire and hold interests in businesses that compete directly or indirectly with us. Our amended and restated certificate of incorporation provides that none of the Sponsors, any of their affiliates or any director who is not employed by us (including any non-employee director who serves as one of our officers in both his director and officer capacities) or his or her affiliates will have any duty to refrain from engaging, directly or indirectly, in the same business activities or similar business activities or lines of business in which we operate. The Sponsors and their affiliates also may pursue acquisition opportunities that may be complementary to our business and, as a result, those acquisition opportunities may not be available to us.
In addition, the Sponsors and their affiliates are able to determine the outcome of all matters requiring stockholder approval and are able to cause or prevent a change of control of our company or a change in the composition of our Board of Directors and could preclude any acquisition of our company. This concentration of voting control could deprive you of an opportunity to receive a premium for your shares of common stock as part of a sale of our company and ultimately might affect the market price of our common stock.
Anti-takeover provisions in our organizational documents could delay or prevent a change of control.
Certain provisions of our certificate of incorporation and bylaws may have an anti-takeover effect and may delay, defer or prevent a merger, acquisition, tender offer, takeover attempt, or other change of control transaction that a stockholder might consider in its best interest, including those attempts that might result in a premium over the market price for the shares held by our stockholders.
These provisions provide for, among other things:
|
|
• |
the ability of our Board of Directors to issue one or more series of preferred stock; |
|
|
• |
advance notice requirements for nominations of directors by stockholders and for stockholders to include matters to be considered at our annual meetings; |
|
|
• |
certain limitations on convening special stockholder meetings; |
|
|
• |
the removal of directors only upon the affirmative vote of the holders of at least 66 2⁄3% of the shares of common stock entitled to vote generally in the election of directors if the Sponsors and their affiliates cease to beneficially own at least 40% of shares of common stock entitled to vote generally in the election of directors; and |
24
These anti-takeover provisions could make it more difficult for a third party to acquire us, even if the third party’s offer may be considered beneficial by many of our stockholders. As a result, our stockholders may be limited in their ability to obtain a premium for their shares.
Our Board of Directors are authorized to issue and designate shares of our preferred stock in additional series without stockholder approval.
Our certificate of incorporation authorizes our Board of Directors, without the approval of our stockholders, to issue 50,000,000 shares of our preferred stock, subject to limitations prescribed by applicable law, rules and regulations and the provisions of our certificate of incorporation, as shares of preferred stock in series, to establish from time to time the number of shares to be included in each such series and to fix the designation, powers, preferences and rights of the shares of each such series and the qualifications, limitations or restrictions thereof. The powers, preferences and rights of these additional series of preferred stock may be senior to or on parity with our common stock, which may reduce its value.
Our certificate of incorporation provides, subject to limited exceptions, that the Court of Chancery of the State of Delaware and the federal district courts of the United States of America will be the sole and exclusive forums for certain stockholder litigation matters, which could limit our stockholders’ ability to obtain a favorable judicial forum for disputes with us or our directors, officers, employees or stockholders.
Our certificate of incorporation provides, subject to limited exceptions, that unless we consent to the selection of an alternative forum, the Court of Chancery of the State of Delaware shall, to the fullest extent permitted by law, be the sole and exclusive forum for any (i) derivative action or proceeding brought on behalf of our company, (ii) action asserting a claim of breach of a fiduciary duty owed by any director, officer, or other employee or stockholder of our company to the Company or our stockholders, creditors or other constituents, (iii) action asserting a claim against the Company or any director or officer of the Company arising pursuant to any provision of the Delaware General Corporation Law, or the DGCL, or our amended and restated certificate of incorporation or our amended and restated bylaws or as to which the DGCL confers jurisdiction on the Court of Chancery of the State of Delaware, or (iv) action asserting a claim against the Company or any director or officer of the Company governed by the internal affairs doctrine. Our certificate of incorporation further provides that, to the fullest extent permitted by law, the federal district courts of the United States of America will be the exclusive forum for resolving any complaint asserting a cause of action arising under the United States federal securities laws.
Any person or entity purchasing or otherwise acquiring any interest in shares of our capital stock shall be deemed to have notice of and consented to the forum provisions in our certificate of incorporation. These choice of forum provisions may limit a stockholder’s ability to bring a claim in a judicial forum that it finds favorable for disputes with us or any of our directors, officers, other employees or stockholders which may discourage lawsuits with respect to such claims. Alternatively, if a court were to find the choice of forum provisions contained in our certificate of incorporation to be inapplicable or unenforceable with respect to one or more of the specified types of actions or proceedings, we may incur additional costs associated with resolving such action in other jurisdictions, which could harm our business, operating results and financial condition.
25
Item 1B. Unresolved Staff Comments
None.
Our corporate headquarters is a leased facility located at 401 Plymouth Road, Suite 500, Plymouth Meeting, Pennsylvania 19462.
We and our operating companies own and lease a variety of facilities primarily located in the United States, for branch and service center operations and for office, call center and storage space. Our branches are strategically located to optimize route efficiency, market coverage and branch overhead. The following chart identifies the number of owned and leased facilities, other than our headquarters listed above, used by each of our operating segments as of September 30, 2018. We believe that these facilities, when considered with our headquarters, are in good operating condition and suitable and adequate to support the current needs of our business.
|
Segment (1) |
|
Owned Facilities |
|
|
Leased Facilities |
|
||
|
Maintenance Services |
|
|
29 |
|
|
|
201 |
|
|
Development Services |
|
|
5 |
|
|
|
18 |
|
|
Total |
|
|
34 |
|
|
|
219 |
|
|
(1) |
10 facilities are shared between our segments and each is counted once, in the Maintenance Services segment, to avoid double counting. |
The information set forth in Note 15 “Commitments and Contingencies” to our consolidated financial statements under Part II, Item 8, “Financial Statements and Supplementary Data,” is incorporated herein by reference.
Item 4. Mine Safety Disclosures
Not applicable.
26
Item 5. Market for Registrant’s Common Equity, Related Stockholder Matters and Issuer Purchases of Equity Securities
Market Information
Our common stock, $0.01 par value per share, began trading on the New York Stock Exchange (“NYSE”) under the symbol “BV” on June 28, 2018. Prior to that time, there was no public market for our common stock. As of October 31, 2018, there were 366 holders of record of our common stock. This stockholder figure does not include a substantially greater number of holders whose shares are held of record by banks, brokers, and other financial institutions.
Dividend Policy
We do not intend to pay cash dividends on our common stock in the foreseeable future. Any future determination to pay dividends will be at the discretion of our board of directors and will depend on, among other things, our results of operations, cash requirements, financial condition, contractual restrictions contained in current or future financing instruments and other factors that our board of directors deem relevant. We did not declare or pay dividends to the holders of our common stock in the year ended September 30, 2018.
Unregistered Sales of Equity Securities
None.
Company Repurchases of Equity Securities
None.
Stock Performance Graph
This performance graph shall not be deemed “soliciting material” or “filed” with the SEC for purposes of Section 18 of the Exchange Act, or otherwise subject to the liabilities under that Section, and shall not be deemed to be incorporated by reference into any of our filings under the Securities Act or the Exchange Act.
The graph below presents the Company’s cumulative total stockholder returns relative to the performance of the NYSE Composite Index and the S&P 1500 Environmental & Facilities Services Index for our fiscal year ended September 30, 2018, commencing June 28, 2018 (the Company’s initial day of trading). All values assume a $100 initial investment at the opening price of the Company’s common stock on the NYSE and data for the NYSE Composite Index and the S&P 1500 Environmental & Facilities Services Index and assumes any dividends were reinvested on the date paid. The points on the graph represent fiscal month-end values based on the last trading day of each fiscal month. The comparisons are based on historical data and are not indicative of, nor intended to forecast, the future performance of our common stock.
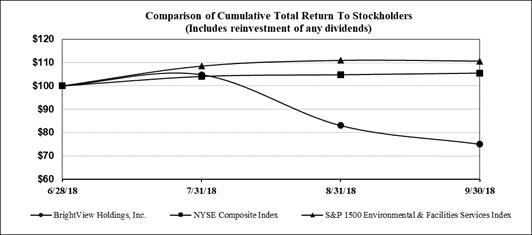
27
Item 6. Selected Financial Data
Set forth below is our selected consolidated financial data as of the dates and for the periods indicated. The selected consolidated financial data as of September 30, 2018 and September 30, 2017 and for the year ended September 30, 2018, the nine months ended September 30, 2017 and for the year ended December 31, 2016 has been derived from our audited consolidated financial statements and related notes thereto included elsewhere in this Form 10-K. The selected consolidated financial data as of December 31, 2016, 2015, and 2014 and for the years ended December 31, 2015 and 2014 have been derived from our audited consolidated financial statements not included in this Form 10-K. We changed our fiscal year end from December 31 to September 30 of each year, effective September 30, 2017. The results of operations for any period are not necessarily indicative of the results to be expected for any future period.
The selected consolidated financial and other data should be read in conjunction with, and are qualified by reference to, “Item 7. Management’s Discussion and Analysis of Financial Condition and Results of Operations” and our audited consolidated financial statements and related notes thereto, each included elsewhere in this Form 10-K.
|
|
|
Fiscal Year Ended September 30, |
|
|
Nine Months Ended September 30, |
|
|
Year Ended December 31, |
|
|||||||||||
|
(in millions, except per share amounts) |
|
2018 |
|
|
2017 |
|
|
2016 |
|
|
2015 |
|
|
2014(1) |
|
|||||
|
Statement of Operations Data |
|
|
|
|
|
|
|
|
|
|
|
|
|
|
|
|
|
|
|
|
|
Net service revenues |
|
$ |
2,353.6 |
|
|
$ |
1,713.6 |
|
|
$ |
2,185.3 |
|
|
$ |
2,214.8 |
|
|
$ |
1,612.5 |
|
|
Cost of services provided |
|
|
1,727.5 |
|
|
|
1,259.8 |
|
|
|
1,578.1 |
|
|
|
1,604.6 |
|
|
|
1,195.7 |
|
|
Gross profit |
|
|
626.1 |
|
|
|
453.8 |
|
|
|
607.2 |
|
|
|
610.3 |
|
|
|
416.8 |
|
|
Selling, general and administrative expense |
|
|
481.2 |
|
|
|
311.8 |
|
|
|
468.0 |
|
|
|
452.8 |
|
|
|
297.0 |
|
|
Amortization expense |
|
|
104.9 |
|
|
|
92.9 |
|
|
|
131.6 |
|
|
|
139.3 |
|
|
|
96.9 |
|
|
Transaction related expenses |
|
|
— |
|
|
|
— |
|
|
|
— |
|
|
|
— |
|
|
|
18.8 |
|
|
Income from operations |
|
|
40.0 |
|
|
|
49.1 |
|
|
|
7.6 |
|
|
|
18.1 |
|
|
|
4.2 |
|
|
Other (expense) income |
|
|
(23.5 |
) |
|
|
1.4 |
|
|
|
2.2 |
|
|
|
3.8 |
|
|
|
0.7 |
|
|
Interest expense |
|
|
97.8 |
|
|
|
73.7 |
|
|
|
94.7 |
|
|
|
89.6 |
|
|
|
71.9 |
|
|
Loss before income taxes |
|
|
(81.3 |
) |
|
|
(23.2 |
) |
|
|
(84.9 |
) |
|
|
(67.7 |
) |
|
|
(67.0 |
) |
|
Income tax benefit |
|
|
66.2 |
|
|
|
9.3 |
|
|
|
32.5 |
|
|
|
27.1 |
|
|
|
16.5 |
|
|
Net loss |
|
$ |
(15.1 |
) |
|
$ |
(14.0 |
) |
|
$ |
(52.4 |
) |
|
$ |
(40.6 |
) |
|
$ |
(50.5 |
) |
|
Loss per share: |
|
|
|
|
|
|
|
|
|
|
|
|
|
|
|
|
|
|
|
|
|
Basic |
|
$ |
(0.18 |
) |
|
$ |
(0.18 |
) |
|
$ |
(0.67 |
) |
|
$ |
(0.52 |
) |
|
$ |
(1.29 |
) |
|
Diluted |
|
$ |
(0.18 |
) |
|
$ |
(0.18 |
) |
|
$ |
(0.67 |
) |
|
$ |
(0.52 |
) |
|
$ |
(1.29 |
) |
|
Weighted average shares outstanding: |
|
|
|
|
|
|
|
|
|
|
|
|
|
|
|
|
|
|
|
|
|
Basic |
|
|
83.4 |
|
|
|
77.1 |
|
|
|
77.7 |
|
|
|
78.4 |
|
|
|
39.3 |
|
|
Diluted |
|
|
83.4 |
|
|
|
77.1 |
|
|
|
77.7 |
|
|
|
78.4 |
|
|
|
39.3 |
|
|
Statement of Cash Flows Data: |
|
|
|
|
|
|
|
|
|
|
|
|
|
|
|
|
|
|
|
|
|
Cash flows from operating activities |
|
$ |
180.4 |
|
|
$ |
78.9 |
|
|
$ |
111.9 |
|
|
$ |
123.4 |
|
|
$ |
50.5 |
|
|
Cash flows used in investing activities |
|
$ |
(179.3 |
) |
|
$ |
(97.5 |
) |
|
$ |
(69.5 |
) |
|
$ |
(65.4 |
) |
|
$ |
(696.0 |
) |
|
Cash flows from (used in) financing activities |
|
$ |
21.3 |
|
|
$ |
(36.6 |
) |
|
$ |
(46.4 |
) |
|
$ |
(24.8 |
) |
|
$ |
668.2 |
|
28
|
|
Fiscal Year Ended September 30, |
|
|
Nine Months Ended September 30, |
|
|
Year Ended December 31, |
|
||||||||||||
|
(in millions, except per share amounts) |
|
2018 |
|
|
2017 |
|
|
2016 |
|
|
2015 |
|
|
2014(1) |
|
|||||
|
Balance Sheet Data (at period end): |
|
|
|
|
|
|
|
|
|
|
|
|
|
|
|
|
|
|
|
|
|
Cash and cash equivalents |
|
$ |
35.2 |
|
|
$ |
12.8 |
|
|
$ |
68.0 |
|
|
$ |
72.0 |
|
|
$ |
38.9 |
|
|
Total assets |
|
$ |
2,891.9 |
|
|
$ |
2,858.6 |
|
|
$ |
2,890.6 |
|
|
$ |
2,974.6 |
|
|
$ |
3,121.7 |
|
|
Total liabilities |
|
$ |
1,664.6 |
|
|
$ |
2,162.4 |
|
|
$ |
2,185.4 |
|
|
$ |
2,191.7 |
|
|
$ |
2,290.3 |
|
|
Total shareholders' equity |
|
$ |
1,227.3 |
|
|
$ |
696.3 |
|
|
$ |
705.2 |
|
|
$ |
782.9 |
|
|
$ |
831.5 |
|
|
Other Financial Data: |
|
|
|
|
|
|
|
|
|
|
|
|
|
|
|
|
|
|
|
|
|
Adjusted EBITDA(2) |
|
$ |
300.1 |
|
|
$ |
217.2 |
|
|
$ |
255.7 |
|
|
$ |
271.6 |
|
|
$ |
212.9 |
|
|
Adjusted Net Income(2) |
|
$ |
90.0 |
|
|
$ |
55.5 |
|
|
$ |
48.6 |
|
|
$ |
61.1 |
|
|
$ |
52.7 |
|
|
Adjusted EPS(2) |
|
$ |
1.08 |
|
|
$ |
0.72 |
|
|
$ |
0.63 |
|
|
$ |
0.78 |
|
|
$ |
1.34 |
|
|
Free Cash Flow(2) |
|
$ |
105.9 |
|
|
$ |
34.6 |
|
|
$ |
42.3 |
|
|
$ |
57.7 |
|
|
$ |
(5.6 |
) |
|
Adjusted Free Cash Flow(2) |
|
$ |
127.6 |
|
|
$ |
34.6 |
|
|
$ |
42.3 |
|
|
$ |
57.7 |
|
|
$ |
(5.6 |
) |
|
(1) |
The results of the business acquired in the ValleyCrest Acquisition are included in our financial results from June 30, 2014, the date of acquisition. Accordingly, our financial results for fiscal 2014 do not reflect the full impact of the ValleyCrest Acquisition. After adjusting for that transaction and related eliminations as if it had occurred at the beginning of the relevant period, management estimates that net service revenues and Adjusted EBITDA would have been $2,155.4 million and $255.2 million in 2014. |
|
(2) |
We report our financial results in accordance with GAAP. To supplement this information, we also use the following measures in this Form 10-K: “Adjusted EBITDA,” “Adjusted Net Income,” “Adjusted Earnings per Share,” “Free Cash Flow” and “Adjusted Free Cash Flow.” Management believes that Adjusted EBITDA, Adjusted Net Income and Adjusted Earnings per Share are helpful supplemental measures to assist us and investors in evaluating our operating results as they exclude certain items whose fluctuations from period to period do not necessarily correspond to changes in the operations of our business. Adjusted EBITDA represents net income (loss) before interest, taxes, depreciation and amortization, as further adjusted to exclude certain non-cash, non-recurring and other adjustment items. We believe that the adjustments applied in presenting Adjusted EBITDA are appropriate to provide additional information to investors about certain material non-cash items and about non-recurring items that we do not expect to continue at the same level in the future. Adjusted Net Income is defined as net income (loss) including interest and depreciation and excluding other items used to calculate Adjusted EBITDA and further adjusted for the tax effect of such exclusions and the removal of the discrete tax items. Adjusted Earnings per Share is defined as Adjusted Net Income divided by the weighted average number of common shares outstanding for the period. We believe Free Cash Flow and Adjusted Free Cash Flow are helpful supplemental measures to assist us and investors in evaluating our liquidity. Free Cash Flow represents cash flows from operating activities less capital expenditures, net of proceeds from the sale of property and equipment. Adjusted Free Cash Flow represents Free Cash Flow as further adjusted for the acquisition of certain legacy properties associated with our acquired ValleyCrest business. We believe Free Cash Flow and Adjusted Free Cash Flow are useful to provide additional information to assess our ability to pursue business opportunities and investments and to service our debt. Free Cash Flow and Adjusted Free Cash Flow have limitations as analytical tools, including that they do not account for our future contractual commitments and exclude investments made to acquire assets under capital leases and required debt service payments. |
29
Set forth below are the reconciliations of net loss to Adjusted EBITDA and Adjusted Net Income, and cash flows from operating activities to Free Cash Flow and Adjusted Free Cash Flow.
|
|
|
Fiscal Year Ended September 30, |
|
|
Nine Months Ended September 30, |
|
|
Year Ended December 31, |
|
|||||||||||
|
(in millions) |
|
2018 |
|
|
2017 |
|
|
2016 |
|
|
2015 |
|
|
2014 |
|
|||||
|
Adjusted EBITDA |
|
|
|
|
|
|
|
|
|
|
|
|
|
|
|
|
|
|
|
|
|
Net loss |
|
$ |
(15.1 |
) |
|
$ |
(14.0 |
) |
|
$ |
(52.4 |
) |
|
$ |
(40.6 |
) |
|
$ |
(50.5 |
) |
|
Plus: |
|
|
|
|
|
|
|
|
|
|
|
|
|
|
|
|
|
|
|
|
|
Interest expense, net |
|
|
97.8 |
|
|
|
73.7 |
|
|
|
94.7 |
|
|
|
89.6 |
|
|
|
71.9 |
|
|
Income tax benefit |
|
|
(66.2 |
) |
|
|
(9.3 |
) |
|
|
(32.5 |
) |
|
|
(27.1 |
) |
|
|
(16.5 |
) |
|
Depreciation expense |
|
|
75.3 |
|
|
|
56.5 |
|
|
|
79.3 |
|
|
|
74.2 |
|
|
|
50.4 |
|
|
Amortization expense |
|
|
104.9 |
|
|
|
92.9 |
|
|
|
131.6 |
|
|
|
139.3 |
|
|
|
96.9 |
|
|
Establish public company financial reporting compliance (a) |
|
|
4.1 |
|
|
|
0.8 |
|
|
|
5.5 |
|
|
|
— |
|
|
|
— |
|
|
Business transformation and integration costs (b) |
|
|
25.4 |
|
|
|
10.8 |
|
|
|
24.1 |
|
|
|
30.2 |
|
|
|
37.9 |
|
|
Transaction costs (c) |
|
|
— |
|
|
|
— |
|
|
|
— |
|
|
|
— |
|
|
|
18.8 |
|
|
Expenses related to initial public offering (d) |
|
|
6.8 |
|
|
|
— |
|
|
|
— |
|
|
|
— |
|
|
|
— |
|
|
Debt extinguishment (e) |
|
|
25.1 |
|
|
|
— |
|
|
|
— |
|
|
|
— |
|
|
|
— |
|
|
Equity-based compensation (f) |
|
|
28.8 |
|
|
|
3.8 |
|
|
|
2.8 |
|
|
|
3.9 |
|
|
|
2.6 |
|
|
Management fees (g) |
|
|
13.1 |
|
|
|
1.9 |
|
|
|
2.7 |
|
|
|
2.1 |
|
|
|
1.5 |
|
|
Adjusted EBITDA |
|
$ |
300.1 |
|
|
$ |
217.2 |
|
|
$ |
255.7 |
|
|
$ |
271.6 |
|
|
$ |
212.9 |
|
|
Adjusted Net Income |
|
|
|
|
|
|
|
|
|
|
|
|
|
|
|
|
|
|
|
|
|
Net loss |
|
$ |
(15.1 |
) |
|
$ |
(14.0 |
) |
|
$ |
(52.4 |
) |
|
$ |
(40.6 |
) |
|
$ |
(50.5 |
) |
|
Plus: |
|
|
|
|
|
|
|
|
|
|
|
|
|
|
|
|
|
|
|
|
|
Amortization expense |
|
|
104.9 |
|
|
|
92.9 |
|
|
|
131.6 |
|
|
|
139.3 |
|
|
|
96.9 |
|
|
Establish public company financial reporting compliance (a) |
|
|
4.1 |
|
|
|
0.8 |
|
|
|
5.5 |
|
|
|
— |
|
|
|
— |
|
|
Business transformation and integration costs (b) |
|
|
25.4 |
|
|
|
10.8 |
|
|
|
24.1 |
|
|
|
30.2 |
|
|
|
37.9 |
|
|
Transaction costs (c) |
|
|
— |
|
|
|
— |
|
|
|
— |
|
|
|
— |
|
|
|
18.8 |
|
|
Expenses related to initial public offering (d) |
|
|
6.8 |
|
|
|
— |
|
|
|
— |
|
|
|
— |
|
|
|
— |
|
|
Debt extinguishment (e) |
|
|
25.1 |
|
|
|
— |
|
|
|
— |
|
|
|
— |
|
|
|
— |
|
|
Equity-based compensation (f) |
|
|
28.8 |
|
|
|
3.8 |
|
|
|
2.8 |
|
|
|
3.9 |
|
|
|
2.6 |
|
|
Management fees (g) |
|
|
13.1 |
|
|
|
1.9 |
|
|
|
2.7 |
|
|
|
2.1 |
|
|
|
1.5 |
|
|
Income tax adjustment (h) |
|
|
(103.1 |
) |
|
|
(40.8 |
) |
|
|
(65.7 |
) |
|
|
(73.8 |
) |
|
|
(54.5 |
) |
|
Adjusted Net Income |
|
$ |
90.0 |
|
|
$ |
55.5 |
|
|
$ |
48.6 |
|
|
$ |
61.1 |
|
|
$ |
52.7 |
|
|
Free Cash Flow and Adjusted Free Cash Flow |
|
|
|
|
|
|
|
|
|
|
|
|
|
|
|
|
|
|
|
|
|
Cash flows from operating activities |
|
$ |
180.4 |
|
|
$ |
78.9 |
|
|
$ |
111.9 |
|
|
$ |
123.4 |
|
|
$ |
50.5 |
|
|
Minus: |
|
|
|
|
|
|
|
|
|
|
|
|
|
|
|
|
|
|
|
|
|
Capital expenditures |
|
|
86.4 |
|
|
|
50.6 |
|
|
|
75.6 |
|
|
|
71.3 |
|
|
|
60.0 |
|
|
Plus: |
|
|
|
|
|
|
|
|
|
|
|
|
|
|
|
|
|
|
|
|
|
Proceeds from sale of property and equipment |
|
|
12.0 |
|
|
|
6.3 |
|
|
|
6.0 |
|
|
|
5.6 |
|
|
|
3.8 |
|
|
Free Cash Flow |
|
$ |
105.9 |
|
|
$ |
34.6 |
|
|
$ |
42.3 |
|
|
$ |
57.7 |
|
|
$ |
(5.6 |
) |
|
Plus: |
|
|
|
|
|
|
|
|
|
|
|
|
|
|
|
|
|
|
|
|
|
ValleyCrest land and building acquisition (i) |
|
|
21.6 |
|
|
|
— |
|
|
|
— |
|
|
|
— |
|
|
|
— |
|
|
Adjusted Free Cash Flow |
|
$ |
127.6 |
|
|
$ |
34.6 |
|
|
$ |
42.3 |
|
|
$ |
57.7 |
|
|
$ |
(5.6 |
) |
30
|
(a) |
Represents costs incurred to establish public company financial reporting compliance, including costs to comply with the requirements of Sarbanes-Oxley and the accelerated adoption of the new revenue recognition standard (ASC 606 – Revenue from Contracts with Customers) and other miscellaneous costs. |
|
(b) |
Business transformation and integration costs consist of (i) severance and related costs; (ii) vehicle fleet rebranding costs; (iii) business integration costs and (iv) information technology infrastructure transformation costs and other. |
|
|
|
Fiscal Year Ended September 30, |
|
|
Nine Months Ended September 30, |
|
|
Year Ended December 31, |
|
|||||||||||
|
(in millions) |
|
2018 |
|
|
2017 |
|
|
2016 |
|
|
2015 |
|
|
2014 |
|
|||||
|
Severance and related costs |
|
$ |
5.7 |
|
|
$ |
0.8 |
|
|
$ |
13.1 |
|
|
$ |
7.0 |
|
|
$ |
10.8 |
|
|
Rebranding of vehicle fleet |
|
|
12.5 |
|
|
|
6.3 |
|
|
|
— |
|
|
|
— |
|
|
|
— |
|
|
Business integration |
|
|
1.7 |
|
|
|
— |
|
|
|
4.0 |
|
|
|
23.2 |
|
|
|
27.1 |
|
|
IT infrastructure transformation and other |
|
|
5.5 |
|
|
|
3.7 |
|
|
|
7.0 |
|
|
|
— |
|
|
|
— |
|
|
Business transformation and integration costs |
|
$ |
25.4 |
|
|
$ |
10.8 |
|
|
$ |
24.1 |
|
|
$ |
30.2 |
|
|
$ |
37.9 |
|
|
(c) |
Represents transaction costs recognized in connection with the KKR Acquisition and the ValleyCrest Acquisition. |
|
(d) |
Represents expenses incurred in connection with the IPO. |
|
(e) |
Represents losses on the extinguishment of debt. |
|
(f) |
Represents equity-based compensation expense recognized for equity incentive plans outstanding, including $19.6 million related to the IPO in the fiscal year ended September 30, 2018. |
|
(g) |
Represents fees paid pursuant to a monitoring agreement terminated on July 2, 2018 in connection with the completion of the IPO. |
|
(h) |
Represents the tax effect of pre-tax items excluded from Adjusted Net Income and the removal of discrete tax items, which collectively result in a reduction of income tax benefit. The tax effect of pre-tax items excluded from Adjusted Net Income is computed using the statutory rate related to the jurisdiction that was impacted by the adjustment after taking into account the impact of permanent differences and valuation allowances. Discrete tax items include changes in laws or rates, changes in uncertain tax positions relating to prior years and changes in valuation allowances. The fiscal year ended September 30, 2018 amount includes a $43.4 million benefit recognized as a result of the reduction in the U.S. corporate income tax rate from 35% to 21% under the 2017 U.S. Tax Cuts and Jobs Act. |
|
|
|
Fiscal Year Ended September 30, |
|
|
Nine Months Ended September 30, |
|
|
Year Ended December 31, |
|
|||||||||||
|
(in millions) |
|
2018 |
|
|
2017 |
|
|
2016 |
|
|
2015 |
|
|
2014 |
|
|||||
|
Tax impact of pre-tax income adjustments |
|
$ |
59.6 |
|
|
$ |
39.0 |
|
|
$ |
66.1 |
|
|
$ |
73.7 |
|
|
$ |
53.8 |
|
|
Discrete tax items |
|
|
43.5 |
|
|
|
1.8 |
|
|
|
(0.4 |
) |
|
|
0.1 |
|
|
|
0.7 |
|
|
Income tax adjustment |
|
$ |
103.1 |
|
|
$ |
40.8 |
|
|
$ |
65.7 |
|
|
$ |
73.8 |
|
|
$ |
54.5 |
|
|
(i) |
Represents the acquisition of legacy ValleyCrest land and buildings in October 2017. |
31
Item 7. Management’s Discussion and Analysis of Financial Condition and Results of Operations
The following discussion contains management’s discussion and analysis of our financial condition and results of operations and should be read together with “Item 6. Selected Financial Data” and our audited consolidated financial statements and the related notes thereto included elsewhere in this Form 10-K. Some of the information contained in this discussion and analysis, including information with respect to our plans and strategy for our business, includes forward-looking statements that involve risks and uncertainties. You should review “Item 1A. Risk Factors” and the “Special Note Regarding Forward-Looking Statements” sections of this Form 10-K for a discussion of important factors that could cause actual results to differ materially from the results described in or implied by the forward-looking statements contained in the following discussion and analysis.
Overview
Our Company
We are the largest provider of commercial landscaping services in the United States, with revenues more than 10 times those of our next largest commercial landscaping competitor. We provide commercial landscaping services ranging from landscape maintenance and enhancements to tree care and landscape development. We operate through a differentiated and integrated national service model which systematically delivers services at the local level by combining our network of over 200 branches with a qualified service partner network. Our branch delivery model underpins our position as a single-source end-to-end landscaping solution provider to our diverse customer base at the national, regional and local levels, which we believe represents a significant competitive advantage. We believe our commercial customer base understands the financial and reputational risk associated with inadequate landscape maintenance and considers our services to be essential and non-discretionary.
Our Segments
We report our results of operations through two reportable segments: Maintenance Services and Development Services. We serve a geographically diverse set of customers through our strategically located network of branches in 31 U.S. states, and, through our qualified service partner network, we are able to efficiently provide nationwide coverage in all 50 U.S. states and Puerto Rico.
Maintenance Services
Our Maintenance Services segment delivers a full suite of recurring commercial landscaping services in both evergreen and seasonal markets, ranging from mowing, gardening, mulching and snow removal, to more horticulturally advanced services, such as water management, irrigation maintenance, tree care, golf course maintenance and specialty turf maintenance. In addition to contracted maintenance services, we also have a strong track record of providing value-added landscape enhancements. We primarily self-perform our maintenance services through our national branch network, which are route-based in nature. Our maintenance services customers include Fortune 500 corporate campuses and commercial properties, HOAs, public parks, leading international hotels and resorts, airport authorities, municipalities, hospitals and other healthcare facilities, educational institutions, restaurants and retail, and golf courses, among others.
Development Services
Through our Development Services segment, we provide landscape architecture and development services for new facilities and significant redesign projects. Specific services include project design and management services, landscape architecture, landscape installation, irrigation installation, tree nursery and installation, pool and water features and sports field services, among others. Our development services are comprised of sophisticated design, coordination and installation of landscapes at some of the most recognizable corporate, athletic and university complexes and showcase highly visible work that is paramount to our customers’ perception of our brand as a market leader.
In our Development Services business, we are typically hired by general contractors, with whom we maintain strong relationships as a result of our superior technical and project management capabilities. We believe the quality of our work is also well-regarded by our end-customers, some of whom directly request that their general contractors utilize our services when outsourcing their landscape development projects.
Components of Our Revenues and Expenses
Net Service Revenues
Maintenance Services
Our Maintenance Services revenues are generated primarily through landscape maintenance, enhancements and snow removal services. Landscape maintenance services that are primarily viewed as non-discretionary, such as lawn care, mowing, gardening, mulching, leaf removal, irrigation and tree care, are provided under recurring annual contracts, which typically range from one to three years in duration and are generally cancellable by the customer with 30 days’ notice. Revenues for such services are recognized in
32
proportion to the performance of related services during a given month compared to the estimate of activities to be performed. Landscape enhancement services represent supplemental maintenance or improvement services generally provided under contracts of short duration related to specific services. Revenues for these enhancement services are generally recognized in the period in which the services are provided. Fees for contracted landscape maintenance services are typically billed on an equal monthly basis, while fees for enhancement services are typically billed as the services are performed. Typically, snow removal services are provided on either a fixed fee basis per snow season or on a time and material-basis. Geographies with heavier snowfall are typically associated with fixed fee based contracts. Revenues for snow removal services are recognized in the period in which the services are performed, or expected to be performed. Fees for fixed fee snow removal services are typically billed on an equal monthly basis during a snow season, while fees for time and material or other activity-based snow removal services are typically billed as the services are performed.
Development Services
Revenues from landscape development contracts are recognized using the percentage-of-completion method, measured by the percentage of cost incurred to date of the estimated total cost for each contract. The full amount of anticipated losses on contracts is recorded when such losses can be estimated. Changes in job performance, job conditions and estimated profitability, including final contract settlements, may result in revisions to costs and revenues and are recognized in the period in which such revisions are determined.
Expenses
Cost of Services Provided
Cost of services provided is comprised of direct costs we incur associated with our operations during a period and includes employee costs, subcontractor costs, purchased materials, operating equipment and vehicle costs. Employee costs consist of wages and other labor-related expenses, including benefits, workers compensation and healthcare costs, for those employees involved in delivering our services. Subcontractor costs consist of costs relating to our qualified service partner network in our Maintenance Services segment and subcontractors we engage from time to time in our Development Services segment. When our use of subcontractors increases, we may experience incrementally higher costs of services provided. Operating equipment and vehicle costs primarily consist of depreciation related to branch operating equipment and vehicles and related fuel expenses. A large component of our costs are variable, such as labor, subcontractor expense and materials.
Selling, General and Administrative Expense
Selling, general and administrative expense consists of costs incurred related to compensation and benefits for management, sales and administrative personnel, equity-based compensation, branch and office rent and facility operating costs, depreciation expense related to branch and office locations, as well as professional fees, software costs and other miscellaneous expenses. Corporate expenses, including corporate executive compensation, finance, legal and information technology, are included in consolidated selling, general and administrative expense and not allocated to the business segments.
Amortization Expense
Amortization expense consists of the periodic amortization of intangible assets, including customer relationships, non-compete agreements and trademarks, recognized when KKR acquired us on December 18, 2013 and in connection with businesses we have acquired since December 18, 2013.
Interest Expense
Interest expense relates primarily to our long term debt. See Note 9 “Long-term Debt” to our audited consolidated financial statements included in Part II. Item 8 of this Form 10-K.
Income Tax Benefit
The benefit for income taxes includes U.S. federal, state and local income taxes. Our effective tax rate differs from the statutory U.S. income tax rate due to the effect of state and local income taxes, tax credits and certain nondeductible expenses. Our effective tax rate may vary from quarter to quarter based on recurring and nonrecurring factors including, but not limited to the geographical distribution of our pre-tax earnings, changes in the tax rates of different jurisdictions, the availability of tax credits and nondeductible items. Changes in judgment due to the evaluation of new information resulting in the recognition, derecognition or remeasurement of a tax position taken in a prior annual period are recognized separately in the period of the change.
In addition, on December 22, 2017, the U.S. Tax Cuts and Jobs Act (the “2017 Tax Act”) was enacted. The 2017 Tax Act reduced the U.S. corporate income tax rate from 35% to 21%. As a result of the enactment, we expect our effective tax rate to be
33
lower in future periods. Based on the applicable tax rates and number of days in fiscal 2018 before and after the 2017 Tax Act, we have a 2018 blended corporate tax rate of 24.5% for fiscal 2018.
Other Income
Other income consists primarily of losses on debt extinguishment as well as investment gains and losses related to deferred compensation.
How We Assess the Performance of our Business
We manage operations through the two operating segments described above. In addition to our GAAP financial measures, we review various non-GAAP financial measures, including Adjusted EBITDA, Adjusted Net Income, Adjusted Earnings per Share (“Adjusted EPS”), Free Cash Flow and Adjusted Free Cash Flow.
We believe Adjusted EBITDA, Adjusted Net Income and Adjusted EPS are helpful supplemental measures to assist us and investors in evaluating our operating results as they exclude certain items whose fluctuations from period to period do not necessarily correspond to changes in the operations of our business. Adjusted EBITDA represents net (loss) income before interest, taxes, depreciation, amortization and certain non-cash, non-recurring and other adjustment items. Adjusted Net Income is defined as net income (loss) including interest, and depreciation and excluding other items used to calculate Adjusted EBITDA and further adjusted for the tax effect of these exclusions and the removal of the discrete tax items. Adjusted EPS is defined as Adjusted Net Income divided by the weighted average number of common shares outstanding for the period used in the calculation of basic EPS. We believe that the adjustments applied in presenting Adjusted EBITDA, Adjusted Net Income and Adjusted EPS are appropriate to provide additional information to investors about certain material non-cash items and about non-recurring items that we do not expect to continue at the same level in the future.
We believe Free Cash Flow and Adjusted Free Cash Flow are helpful supplemental measures to assist us and investors in evaluating our liquidity. Free Cash Flow represents cash flows from operating activities less capital expenditures, net of proceeds from sales of property and equipment. Adjusted Free Cash Flow represents Free Cash Flow as further adjusted for the acquisition of certain legacy properties associated with our acquired ValleyCrest business. We believe Free Cash Flow and Adjusted Free Cash Flow are useful to provide additional information to assess our ability to pursue business opportunities and investments and to service our debt. Free Cash Flow and Adjusted Free Cash Flow have limitations as analytical tools, including that they do not account for our future contractual commitments and exclude investments made to acquire assets under capital leases and required debt service payments.
Management regularly uses these measures as tools in evaluating our operating performance, financial performance and liquidity, while other measures can differ significantly depending on long-term strategic decisions regarding capital structure and capital investments. Management uses Adjusted EBITDA, Adjusted Net Income, Adjusted EPS, Free Cash Flow and Adjusted Free Cash Flow to supplement comparable GAAP measures in the evaluation of the effectiveness of our business strategies, to make budgeting decisions, to establish discretionary annual incentive compensation and to compare our performance against that of other peer companies using similar measures. In addition, we believe that Adjusted EBITDA, Adjusted Net Income, Adjusted EPS, Free Cash Flow and Adjusted Free Cash Flow are frequently used by investors and other interested parties in the evaluation of issuers, many of which also present Adjusted EBITDA, Adjusted Net Income, Adjusted EPS, Free Cash Flow and Adjusted Free Cash Flow when reporting their results in an effort to facilitate an understanding of their operating and financial results and liquidity. Management supplements GAAP results with non-GAAP financial measures to provide a more complete understanding of the factors and trends affecting the business than GAAP results alone.
Adjusted EBITDA, Adjusted Net Income and Adjusted EPS are provided in addition to, and should not be considered as alternatives to, net income (loss) or any other performance measure derived in accordance with GAAP, and Free Cash Flow and Adjusted Free Cash Flow are provided in addition to, and should not be considered as an alternative to, cash flow from operating activities or any other measure derived in accordance with GAAP as a measure of our liquidity. Adjusted EBITDA, Adjusted Net Income, Adjusted EPS, Free Cash Flow and Adjusted Free Cash Flow have limitations as analytical tools, and you should not consider such measures either in isolation or as substitutes for analyzing our results as reported under GAAP. In addition, because not all companies use identical calculations, the presentations of these measures may not be comparable to other similarly titled measures of other companies and can differ significantly from company to company. Additionally, these measures are not intended to be a measure of free cash flow available for management’s discretionary use as they do not consider certain cash requirements such as interest payments, tax payments and debt service requirements.
For a reconciliation of the most directly comparable GAAP measures, see “Non-GAAP Financial Measures” below.
Trends and Other Factors Affecting Our Business
Various trends and other factors affect or have affected our operating results, including:
34
Our services, particularly in our Maintenance Services segment, have seasonal variability such as increased mulching, flower planting and intensive mowing in the spring, leaf removal and cleanup work in the fall, snow removal services in the winter and potentially minimal mowing during drier summer months. This can drive fluctuations in revenue, costs and cash flows for interim periods.
We have a significant presence in geographies that have a year-round growing season, which we refer to as our evergreen markets. Such markets require landscape maintenance services twelve months per year. In markets that do not have a year-round growing season, which we refer to as our seasonal markets, the demand for our landscape maintenance services decreases during the winter months. Typically, our revenues and net income have been higher in the spring and summer seasons, which correspond with our third and fourth fiscal quarters following the change of our fiscal year end date to September 30, effective September 30, 2017. The lower level of activity in seasonal markets during our first and second fiscal quarters is partially offset by revenue from our snow removal services. Such seasonality causes our results of operations to vary from quarter to quarter.
Weather Conditions
Weather may impact the timing of performance of landscape maintenance and enhancement services and progress on development projects from quarter to quarter. For example, snow events in the winter, hurricane-related cleanup in the summer and fall, and the effects of abnormally high rainfall or drought in a given market may impact our services. These less predictable weather patterns can impact both our revenues and our costs, especially from quarter to quarter, but also from year to year in some cases. Extreme weather events such as hurricanes and tropical storms can result in a positive impact to our business in the form of increased enhancement services revenues related to cleanup and other services. However, such weather events may also negatively impact our ability to deliver our contracted services or impact the timing of performance.
In our seasonal markets, the performance of our snow removal services is correlated with the amount of snowfall and number of snowfall events in a given season. We benchmark our performance against ten- and thirty-year cumulative annual snowfall averages.
Acquisitions
In addition to our organic growth, we have grown, and expect to continue to grow, our business through acquisitions in an effort to better service our existing customers and to attract new customers. These acquisitions have allowed us to execute our “strong-on-strong” acquisition strategy in which we focus on increasing our density and leadership positions in existing local markets, entering into attractive new geographic markets and expanding our portfolio of landscape enhancement services and improving technical capabilities in specialized services. As we continue to selectively pursue acquisitions that complement our “strong-on-strong” acquisition strategy, we believe we are the acquirer of choice in the highly fragmented commercial landscaping industry because we offer the ability to leverage our significant size and scale, as well as provide stable and potentially expanding career opportunities for employees of acquired businesses. In accordance with GAAP, the results of the acquisitions we have completed are reflected in our financial statements from the date of acquisition. We incur transaction costs in connection with identifying and completing acquisitions and ongoing integration costs as we integrate acquired companies and seek to achieve synergies. Since October 1, 2017, we have acquired five businesses with approximately $117.6 million of aggregate annualized revenue, for aggregate consideration of $104.4 million, net of cash. We anticipate incurring integration related costs in respect of these acquisitions of $2.6 million, of which $0.4 million had been incurred as of September 30, 2018, with the remainder to be incurred by the third quarter of fiscal 2019. Additionally, we incurred $1.3 million of integration costs during fiscal 2018 related to acquisitions completed during fiscal 2017. While integration costs vary based on factors specific to each acquisition, such costs are primarily comprised of fleet and uniform rebranding, and to a lesser extent, other administrative costs associated with training employees and transitioning from legacy accounting and IT systems. We typically anticipate integration costs to represent approximately 2%-3% of the acquisition price, and to be incurred within 12 months of acquisition completion.
Industry and Economic Conditions
We believe the non-discretionary nature of our landscape maintenance services provides us with a fairly predictable recurring revenue model. The perennial nature of the landscape maintenance service sector, as well as its wide range of end users, minimizes the impact of a broad or sector-specific downturn. However, in connection with our enhancement services and development services, when demand for commercial construction declines, demand for landscape enhancement services and development projects may decline. When commercial construction activity rises, demand for landscape enhancement services to maintain green space may also increase. This is especially true for new developments in which green space tends to play an increasingly important role.
Equity-based Compensation
Prior to the IPO, the Company had a Management Equity Incentive Plan, (the “Plan”), under which Parent L.P. awarded Class A Units and/or Class B Units to our employees and members of our Board of Directors. Many of our outstanding equity-based
35
compensation awards granted to our employees vest upon a service condition and certain performance criteria of the Company, while some outstanding awards also vest upon a liquidity event, including an initial public offering. In connection with the IPO, we recorded $1.5 million of equity-based compensation expense as a result of such vesting. The Class B Units held by current and former employees were cancelled in connection with the IPO and we issued shares of common stock (a portion of which was restricted stock subject to vesting) and stock options in respect of such Class B Units at the time of the IPO (the “Class B Equity Conversion”). In addition, we issued shares of common stock (all of which was restricted stock, vesting ratably on an annual basis over a three-year period, commencing on the first anniversary of the grant date) and stock options that were granted to certain officers and employees in connection with the IPO (the “IPO Equity Grant”).The issuance of stock options (i) in connection with the Class B Equity Conversion, is expected to result in $37.9 million of equity-based compensation expense after estimated forfeitures, of which $11.4 million was recognized immediately upon issuance, $5.2 million of expense was recognized in the fourth quarter of fiscal 2018, and the remainder of which we expect to recognize in future periods, and (ii) in connection with the IPO Equity Grant, is expected to result in $16.3 million of equity based compensation expense after estimated forfeitures, of which we recognized $1.5 million in the fourth quarter of fiscal 2018 and the remainder of which we expect to recognize in future periods. Furthermore, we expect equity-based compensation expense to be higher in the future as our awards will be expensed over the requisite service and performance period. See Note 14 “Equity-Based Compensation” to our audited consolidated financial statements included in Part II. Item 8 of this Form 10-K for additional information about our equity-based compensation plans.
Results of Operations
The following tables summarize key components of our results of operations for the periods indicated. We changed our fiscal year end from December 31 to September 30, effective September 30, 2017. The change aligns the fiscal year end with the seasonal business cycle of our industry. References herein to “fiscal 2017” relate to the nine-month transition period from January 1, 2017 through September 30, 2017. As a result, fiscal 2017 is a nine-month presentation period, whereas fiscal 2018 is presented as a twelve-month period ending September 30, 2018. Comparability of fiscal 2017 to other fiscal years is therefore limited. Accordingly, year-over-year comparisons of annual financial results included in the tables below and the discussion that follows compare results for (i) fiscal 2018 to the twelve months ended September 30, 2017 and (ii) fiscal 2017 to the nine months ended September 30, 2016. These periods were chosen because we believe they enhance the understanding of our performance. The twelve months ended September 30, 2017 and the nine months ended September 30, 2016 are unaudited.
|
|
|
Twelve Months Ended September 30, |
|
|
Nine Months Ended September 30, |
|
|
Year Ended December 31, |
|
|||||||||||
|
|
|
2018 |
|
|
2017 |
|
|
2017 |
|
|
2016 |
|
|
2016 |
|
|||||
|
(In millions) |
|
|
|
|
|
(Unaudited) |
|
|
|
|
|
|
(Unaudited) |
|
|
|
|
|
||
|
Net service revenues |
|
$ |
2,353.6 |
|
|
$ |
2,225.9 |
|
|
$ |
1,713.6 |
|
|
$ |
1,673.0 |
|
|
$ |
2,185.3 |
|
|
Cost of services provided |
|
|
1,727.5 |
|
|
|
1,629.7 |
|
|
|
1,259.8 |
|
|
|
1,208.2 |
|
|
|
1,578.1 |
|
|
Gross profit |
|
|
626.1 |
|
|
|
596.1 |
|
|
|
453.8 |
|
|
|
464.8 |
|
|
|
607.2 |
|
|
Selling, general and administrative expense |
|
|
481.2 |
|
|
|
435.5 |
|
|
|
311.8 |
|
|
|
344.4 |
|
|
|
468.0 |
|
|
Amortization expense |
|
|
104.9 |
|
|
|
125.8 |
|
|
|
92.9 |
|
|
|
98.7 |
|
|
|
131.6 |
|
|
Income from operations |
|
|
40.0 |
|
|
|
34.9 |
|
|
|
49.1 |
|
|
|
21.8 |
|
|
|
7.6 |
|
|
Other (expense) income |
|
|
(23.5 |
) |
|
|
1.8 |
|
|
|
1.4 |
|
|
|
1.9 |
|
|
|
2.2 |
|
|
Interest expense |
|
|
97.8 |
|
|
|
98.1 |
|
|
|
73.7 |
|
|
|
70.3 |
|
|
|
94.7 |
|
|
Loss before income taxes |
|
|
(81.3 |
) |
|
|
(61.5 |
) |
|
|
(23.2 |
) |
|
|
(46.6 |
) |
|
|
(84.9 |
) |
|
Income tax benefit |
|
|
66.2 |
|
|
|
24.0 |
|
|
|
9.3 |
|
|
|
17.8 |
|
|
|
32.5 |
|
|
Net loss |
|
$ |
(15.1 |
) |
|
$ |
(37.4 |
) |
|
$ |
(14.0 |
) |
|
$ |
(28.9 |
) |
|
$ |
(52.4 |
) |
|
Adjusted EBITDA(1) |
|
$ |
300.1 |
|
|
$ |
266.6 |
|
|
$ |
217.2 |
|
|
$ |
206.2 |
|
|
$ |
255.7 |
|
|
Adjusted Net Income (1) |
|
$ |
90.0 |
|
|
$ |
58.1 |
|
|
$ |
55.5 |
|
|
$ |
45.9 |
|
|
$ |
48.6 |
|
|
Free Cash Flow(1) |
|
$ |
105.9 |
|
|
$ |
70.4 |
|
|
$ |
34.6 |
|
|
$ |
6.5 |
|
|
$ |
42.3 |
|
|
Adjusted Free Cash Flow(1) |
|
$ |
127.6 |
|
|
$ |
70.4 |
|
|
$ |
34.6 |
|
|
$ |
6.5 |
|
|
$ |
42.3 |
|
|
(1) |
See “Non-GAAP Financial Measures” below for a reconciliation to the most directly comparable GAAP measure. |
Twelve Months Ended September 30, 2018 compared to Twelve Months Ended September 30, 2017
Net Service Revenues
Net service revenues for the twelve months ended September 30, 2018 increased $127.7 million, or 5.7%, to $2,353.6 million, from $2,225.9 million in the 2017 period. The increase was driven by incremental revenue from acquired businesses of $103.4 million and increased revenue from snow removal services of $59.5 million due to the relative frequency and volume of snowfall in 2018.
36
These increases were partially offset by a decrease in landscape services revenue of $32.6 million predominantly driven by a $23.1 million decrease as a result of the Company’s managed exit strategy surrounding underperforming contracts (“Managed Exits”).
Gross Profit
Gross profit for the twelve months ended September 30, 2018 increased $30.0 million, or 5.0%, to $626.1 million, from $596.1 million in the 2017 period driven by the incremental revenues, described above. Gross margin decreased 20 basis points from 26.8% in the 2017 period to 26.6% for the twelve months ended September 30, 2018 primarily attributable to increased fuel expense.
Selling, General and Administrative Expense
Selling, general and administrative expense for the twelve months ended September 30, 2018 increased $45.7 million, or 10.5%, to $481.2 million, from $435.5 million in the 2017 period driven by a decrease of $5.7 million as a result of our continued focus on efficiency initiatives to reduce overhead, personnel and related costs across our core functions, offset primarily by $36.9 million in costs incurred as a result of the IPO, a $6.3 million increase in equity-based compensation due to timing of certain performance-based vesting criteria, and a $6.2 million increase in costs as a result of substantially completing our fleet rebranding initiative. The increase of $36.9 million in costs incurred as a result of the IPO include a $19.6 million increase in IPO-related equity-based compensation expense, $6.8 million of direct IPO costs, and a $10.5 million increase in management fees driven by termination fees paid to KKR and MSD Partners. See Note 1 “Business”, Note 14 “Equity-based Compensation” and Note 19 “Related Party Transactions” in the Notes to Audited Consolidated Financial Statements. As a percentage of revenue, selling, general and administrative expense increased to 20.2% compared with 19.6% in the 2017 period.
Amortization Expense
Amortization expense for the twelve months ended September 30, 2018 decreased $20.9 million, or 16.6%, to $104.9 million, from $125.8 million in the 2017 period. The decrease was principally due to the expected decrease of $24.1 million in the amortization of intangible assets recognized in connection with the KKR Acquisition and the ValleyCrest Acquisition, based on the accelerated pattern consistent with expected future cash flows calculated at that time, offset by incremental amortization expense for intangible assets recognized in connection with acquisitions completed during the 2017 and 2018 periods of $3.2 million.
Other (Expense) Income
Other expense was $23.5 million for the twelve months ended September 30, 2018, a decrease of $25.3 million from income of $1.8 million in the 2017 period, and is primarily due to losses on debt extinguishment of $25.1 million from accelerated amortization of deferred financing fees and original issue discount in connection with our term loan repayments during the fourth quarter of fiscal 2018.
Interest Expense
Interest expense for the twelve months ended September 30, 2018 decreased $0.3 million, or 0.3%, to $97.8 million, from $98.1 million in the 2017 period. The modest decrease resulted from an overall reduction in debt due to term loan repayments in the fourth quarter of fiscal 2018, substantially offset by a higher weighted average interest rate of 4.6% in fiscal 2018 compared to 4.1% in the 2017 period, which is in direct correlation to rising interest rates in the external LIBOR market.
Income Tax Benefit
Income tax benefit for the twelve months ended September 30, 2018 increased $42.2 million, or 175.8%, to $66.2 million, from $24.0 million in the 2017 period. The increase in tax benefit was primarily attributable to the reduction in the U.S. corporate income tax rate from the enactment of the 2017 Tax Act. As a result of the enactment, we revalued our ending net deferred tax liabilities at December 31, 2017, resulting in a $43.4 million tax benefit in the twelve months ended September 30, 2018.
Net Income (Loss)
For the twelve months ended September 30, 2018, net loss decreased $22.3 million, to $15.1 million, from $37.4 million in the 2017 period. The decrease was primarily due to the changes noted above.
Adjusted EBITDA
Adjusted EBITDA increased $33.5 million for the twelve months ended September 30, 2018, to $300.1 million, from $266.6 million in the 2017 period. Adjusted EBITDA as a percent of revenue was 12.8% and 12.0% for the twelve months ended September 30, 2018 and 2017, respectively. The increase in Adjusted EBITDA was principally driven by an increase in Maintenance Services Segment Adjusted EBITDA of $31.8 million, or 12.3% and an increase in Development Services Segment Adjusted
37
EBITDA of $1.3 million, or 1.7%, both driven by higher segment revenues and management of selling, general and administrative expense.
Adjusted Net Income
Adjusted Net Income for the twelve months ended September 30, 2018 increased $31.9 million, to $90.0 million, from $58.1 million in the 2017 period. The increase was primarily due to the increase in gross profit and operating efficiencies within selling, general and administrative expense, each as discussed above.
Nine Months Ended September 30, 2017 compared to Nine Months Ended September 30, 2016
Net Service Revenues
Net service revenues for the nine months ended September 30, 2017 increased $40.6 million, or 2.4%, to $1,713.6 million, from $1,673.0 million in the 2016 period. The increase was driven by an increase in Development Services revenues of $78.2 million, or 21.8%, offset by decreases in Maintenance Services revenues of $37.9 million, or 2.9%. The increase in Development Services revenues was primarily the result of increased activity on existing and new larger development projects initiated in fiscal 2017. The decrease in Maintenance Services revenues was principally driven by lower revenues from snow removal services, due to relative frequency and amount of snowfall, offset by growth in landscape maintenance services revenues, principally derived from businesses acquired during the period, and by growth in our enhancement services revenue.
Gross Profit
Gross profit for the nine months ended September 30, 2017 decreased $11.0 million, or 2.4%, to $453.8 million, from $464.8 million in the 2016 period. The decrease in gross profit was driven by the decline in Maintenance Services revenues described above along with an overall decline in gross margin due to an increase in cost of services provided as a percentage of net service revenues. Cost of services provided as a percentage of net service revenues increased 130 basis points to 73.5% in the nine months ended September 30, 2017 from 72.2% in the 2016 period. The increase in cost of services as a percentage of net service revenues was principally driven by an increase in total labor costs, inclusive of subcontractor expense, of 180 basis points primarily driven by an increase in the percentage of work performed by subcontractors on certain larger development projects, offset by a reduction in the cost of materials of 30 basis points.
Selling, General and Administrative Expense
Selling, general and administrative expense for the nine months ended September 30, 2017 decreased $32.6 million, or 9.5%, to $311.8 million, from $344.4 million in the 2016 period. The decrease was driven by our continued focus on efficiency initiatives to reduce overhead, personnel and related costs across our core functions. As a percentage of revenue, selling, general and administrative expense decreased to 18.2% from 20.6% in the 2016 period.
Amortization Expense
Amortization expense for the nine months ended September 30, 2017 decreased $5.8 million, or 5.9%, to $92.9 million, from $98.7 million in the 2016 period. The decrease was principally due to the expected decrease in the amortization of intangible assets recognized in connection with the KKR Acquisition and the ValleyCrest Acquisition based on the accelerated pattern consistent with expected future cash flows calculated at that time, offset by incremental amortization expense for acquisitions completed during the 2017 period.
Other Income
Other income was $1.4 million and $1.9 million in the nine months ended September 30, 2017 and 2016, respectively, and consists primarily of gains and losses on investments.
Interest Expense
Interest expense for the nine months ended September 30, 2017 increased $3.4 million, or 4.8%, to $73.7 million, from $70.3 million in the 2016 period. The increase primarily resulted from a higher weighted average interest rate in the 2017 period of 4.50%, compared to 4.45% in the 2016 period, which is in direct correlation to rising interest rates in the external LIBOR market. The increases above were offset by lower average outstanding borrowings in the period and the impact of our interest rate swaps for the period.
38
Income tax benefit for the nine months ended September 30, 2017 decreased $8.5 million, or 47.8%, to $9.3 million, from $17.8 million in the 2016 period. The decrease in tax benefit was primarily driven by the change in pre-tax loss, which decreased $23.4 million, or 50.2%, to $23.2 million, from $46.6 million in the 2016 period.
Net Income (Loss)
For the nine months ended September 30, 2017, net loss decreased $14.9 million, to $14.0 million, from $28.9 million in the 2016 period. The decrease is primarily due to the changes noted above.
Adjusted EBITDA
Adjusted EBITDA increased $11.0 million for the nine months ended September 30, 2017, to $217.2 million, from $206.2 million in the 2016 period. Adjusted EBITDA as a percent of revenue was 12.7% and 12.3% for the nine months ended September 30, 2017 and 2016, respectively. The increase in Adjusted EBITDA was principally due to the reduction in selling, general and administrative expense, offset by a decline in gross profit.
Adjusted Net Income
Adjusted Net Income for the nine months ended September 30, 2017 increased $9.6 million, to $55.5 million, from $45.9 million in the 2016 period. The increase was primarily due to the reduction in selling, general and administrative expense, including business transformation costs, partially offset by a decline in gross profit and an increase in interest expense, each as discussed above.
Segment Results
We classify our business into two segments: Maintenance Services and Development Services. Our corporate operations are not allocated to the segments and are not discussed separately as any results that had a significant impact on operating results are included in the consolidated results discussion above.
We evaluate the performance of our segments on Net Service Revenues, Segment Adjusted EBITDA and Segment Adjusted EBITDA Margin (Segment Adjusted EBITDA as a percentage of Net Service Revenues). Segment Adjusted EBITDA is indicative of operational performance and ongoing profitability. Our management closely monitors Segment Adjusted EBITDA to evaluate past performance and identify actions required to improve profitability.
Segment Results for the Twelve Months Ended September 30, 2018 and 2017
The following tables present Net Service Revenues, Segment Adjusted EBITDA, and Segment Adjusted EBITDA Margin for each of our segments. Changes in Segment Adjusted EBITDA Margin are shown in basis points, or bps.
Maintenance Services Segment Results
|
|
|
Twelve Months Ended September 30, |
|
|
Percent Change |
|
||||||
|
(In millions) |
|
2018 |
|
|
2017 |
|
|
2018 vs. 2017 |
|
|||
|
Net Service Revenues |
|
$ |
1,774.8 |
|
|
$ |
1,651.8 |
|
|
|
7.4 |
% |
|
Segment Adjusted EBITDA |
|
$ |
289.8 |
|
|
$ |
258.0 |
|
|
|
12.3 |
% |
|
Segment Adjusted EBITDA Margin |
|
|
16.3 |
% |
|
|
15.6 |
% |
|
70 bps |
|
|
Maintenance Services Net Service Revenues
Maintenance Services net service revenues for the twelve months ended September 30, 2018 increased by $123.0 million, or 7.4%, compared to the 2017 period. Revenues from landscape maintenance services were $1,522.5 million for the twelve months ended September 30, 2018, an increase of $63.6 million over the 2017 period and revenues from snow removal services were $252.3 million, an increase of $59.5 million over the 2017 period. The increase in landscape maintenance services was driven by a $96.2 million revenue contribution from acquired businesses inclusive of approximately $4.0 million of hurricane clean-up revenue, partially offset by a decrease of $32.6 million principally due to a $23.1 million decrease related to the Company’s Managed Exits. The increase in snow removal services revenue is correlated with the higher relative snowfall in the twelve months ended September 30, 2018 (snowfall for the twelve months ended September 30, 2018 and 2017 was 88% and 64%, respectively, of the historical 10-year average), coupled with an increased frequency of snowfall events and the volume of snowfall per event.
39
Maintenance Services Segment Adjusted EBITDA
Segment Adjusted EBITDA for the twelve months ended September 30, 2018 increased $31.8 million, to $289.8 million, compared to $258.0 million in the 2017 period. The increase in Segment Adjusted EBITDA was primarily due to the increase in revenues described above, partially offset by a related increase in cost of services provided. Segment Adjusted EBITDA Margin increased 70 basis points, to 16.3% in the twelve months ended September 30, 2018, from 15.6% in the 2017 period primarily due to an increase as a result of Managed Exits and efficiency initiatives, partially offset by a decrease of approximately 45 basis points related to increased fuel expense.
Development Services Segment Results
|
|
|
Twelve Months Ended September 30, |
|
|
Percent Change |
|
||||||
|
(In millions) |
|
2018 |
|
|
2017 |
|
|
2018 vs. 2017 |
|
|||
|
Net Service Revenues |
|
$ |
583.3 |
|
|
$ |
577.2 |
|
|
|
1.1 |
% |
|
Segment Adjusted EBITDA |
|
$ |
78.7 |
|
|
$ |
77.4 |
|
|
|
1.7 |
% |
|
Segment Adjusted EBITDA Margin |
|
|
13.5 |
% |
|
|
13.4 |
% |
|
10 bps |
|
|
Development Services Net Service Revenues
Development Services net service revenues for the twelve months ended September 30, 2018 increased $6.1 million, or 1.1%, compared to the 2017 period. The increase in development services revenues was driven by incremental revenue of $7.2 million related to development projects from the Maintenance Services acquisitions, offset by winding down production on certain large projects that reached substantial completion during the year.
Development Services Segment Adjusted EBITDA
Segment Adjusted EBITDA for the twelve months ended September 30, 2018 increased $1.3 million, to $78.7 million, compared to $77.4 million in the 2017 period. The increase in Segment Adjusted EBITDA was primarily due to the increase in revenues described above and our continued focus on efficiency initiatives to reduce overhead, personnel and related costs, offset by an increase in cost of services provided due to work performed on certain large lower margin projects during the year. Segment Adjusted EBITDA Margin increased 10 basis points, to 13.5%, in the twelve months ended September 30, 2018, from 13.4% in the 2017 period.
Segment Results for the Nine Months Ended September 30, 2017 and 2016
The following tables present Net Service Revenues, Segment Adjusted EBITDA, and Segment Adjusted EBITDA Margin for each of our segments. Changes in Segment Adjusted EBITDA Margin are shown in basis points.
Maintenance Services Segment Results
|
|
|
Nine Months Ended September 30, |
|
|
Percent Change |
|
||||||
|
(In millions) |
|
2017 |
|
|
2016 |
|
|
2017 vs. 2016 |
|
|||
|
Net Service Revenues |
|
$ |
1,278.3 |
|
|
$ |
1,316.2 |
|
|
|
(2.9 |
)% |
|
Segment Adjusted EBITDA |
|
$ |
210.3 |
|
|
$ |
215.9 |
|
|
|
(2.6 |
)% |
|
Segment Adjusted EBITDA Margin |
|
|
16.5 |
% |
|
|
16.4 |
% |
|
10 bps |
|
|
Maintenance Services Net Service Revenues
Maintenance Services net service revenues for the nine months ended September 30, 2017 decreased by $37.9 million, or 2.9%, compared to the 2016 period. Revenues from landscape services were $1,132.5 million, an increase of $25.7 million over the 2016 period, and revenues from snow removal services were $145.8 million, a decrease of $63.6 million over the 2016 period. The decline in snow removal services revenue is correlated with the lower relative snowfall in the nine months ended September 30, 2017 (snowfall for the nine months ended September 30, 2017 and 2016 was 58% and 100%, respectively, of the historical 10-year average for that period). This decrease was partially offset by additional revenues from landscape services of $22.6 million from businesses acquired in fiscal 2017, coupled with an increase in enhancement services due to an increase in demand for our services due to the hurricanes that impacted the southern United States and an overall improvement in enhancement services pricing across our footprint.
40
Maintenance Services Segment Adjusted EBITDA
Segment Adjusted EBITDA for the nine months ended September 30, 2017 decreased $5.6 million, to $210.3 million, compared to $215.9 million in the 2016 period. The decrease in Segment Adjusted EBITDA was primarily due to the decrease in revenues described above offset by a related decrease in cost of services provided of $15.4 million and a reduction in selling, general and administrative expense of $19.3 million, driven by our continued focus on efficiency initiatives to reduce overhead, personnel and related costs across our core functions. As a result, Segment Adjusted EBITDA Margin increased 10 basis points, to 16.5%, in the nine months ended September 30, 2017, from 16.4% in the 2016 period.
Development Services Segment Results
|
|
|
Nine Months Ended September 30, |
|
|
Percent Change |
|
||||||
|
(In millions) |
|
2017 |
|
|
2016 |
|
|
2017 vs. 2016 |
|
|||
|
Net Service Revenues |
|
$ |
437.7 |
|
|
$ |
359.5 |
|
|
|
21.8 |
% |
|
Segment Adjusted EBITDA |
|
$ |
52.9 |
|
|
$ |
42.5 |
|
|
|
24.5 |
% |
|
Segment Adjusted EBITDA Margin |
|
|
12.1 |
% |
|
|
11.8 |
% |
|
30 bps |
|
|
Development Services Net Service Revenues
Development Services net service revenues for the nine months ended September 30, 2017 increased $78.2 million, or 21.8%, compared to the 2016 period. The increase was primarily the result of increased activity on new and existing development projects in fiscal 2017. The average contract value related to the work performed in fiscal 2017 was larger than the average contract value related to the work performed in the 2016 period.
Development Services Segment Adjusted EBITDA
Segment Adjusted EBITDA for the nine months ended September 30, 2017 increased $10.4 million, to $52.9 million, compared to $42.5 million in the 2016 period. The increase in Segment Adjusted EBITDA was primarily due to the increase in revenue described above, as well as a decrease in selling, general and administrative expense of $2.1 million that was driven by a focus on increasing efficiencies through personnel cost and other expense reductions, offset by increases in cost of services provided of $70.3 million, with cost of services provided as a percentage of revenue increasing 190 basis points driven by an increase in the percentage of work performed by subcontractors on certain larger development projects. As a result, Segment Adjusted EBITDA Margin increased 30 basis points, to 12.1%, in the 2017 period from 11.8% in the 2016 period.
41
Set forth below are the reconciliations of net (loss) income to Adjusted EBITDA and Adjusted Net Income and cash flows from operating activities to Free Cash Flow and Adjusted Free Cash Flow. Adjusted EPS is defined as Adjusted Net Income (shown below) divided by the weighted average number of common shares outstanding for the period used in the calculation of basic EPS and presented in Note 18 “(Loss) Earnings Per Share of Common Stock”.
|
|
|
Twelve Months Ended September 30, |
|
|
Nine Months Ended September 30, |
|
||||||||||
|
(in millions) |
|
2018 |
|
|
2017 |
|
|
2017 |
|
|
2016 |
|
||||
|
Adjusted EBITDA |
|
|
|
|
|
|
|
|
|
|
|
|
|
|
|
|
|
Net loss |
|
$ |
(15.1 |
) |
|
$ |
(37.4 |
) |
|
$ |
(14.0 |
) |
|
$ |
(28.9 |
) |
|
Plus: |
|
|
|
|
|
|
|
|
|
|
|
|
|
|
|
|
|
Interest expense, net |
|
|
97.8 |
|
|
|
98.1 |
|
|
|
73.7 |
|
|
|
70.3 |
|
|
Income tax benefit |
|
|
(66.2 |
) |
|
|
(24.0 |
) |
|
|
(9.3 |
) |
|
|
(17.8 |
) |
|
Depreciation expense |
|
|
75.3 |
|
|
|
77.7 |
|
|
|
56.5 |
|
|
|
58.0 |
|
|
Amortization expense |
|
|
104.9 |
|
|
|
125.8 |
|
|
|
92.9 |
|
|
|
98.7 |
|
|
Establish public company financial reporting compliance (a) |
|
|
4.1 |
|
|
|
2.3 |
|
|
|
0.8 |
|
|
|
4.0 |
|
|
Business transformation and integration costs (b) |
|
|
25.4 |
|
|
|
18.7 |
|
|
|
10.8 |
|
|
|
16.2 |
|
|
Expenses related to initial public offering (c) |
|
|
6.8 |
|
|
|
— |
|
|
|
— |
|
|
|
— |
|
|
Debt extinguishment (d) |
|
|
25.1 |
|
|
|
— |
|
|
|
— |
|
|
|
— |
|
|
Equity-based compensation (e) |
|
|
28.8 |
|
|
|
2.9 |
|
|
|
3.8 |
|
|
|
3.7 |
|
|
Management fees (f) |
|
|
13.1 |
|
|
|
2.6 |
|
|
|
1.9 |
|
|
|
2.0 |
|
|
Adjusted EBITDA |
|
$ |
300.1 |
|
|
$ |
266.6 |
|
|
$ |
217.2 |
|
|
$ |
206.2 |
|
|
Adjusted Net Income |
|
|
|
|
|
|
|
|
|
|
|
|
|
|
|
|
|
Net loss |
|
|
(15.1 |
) |
|
$ |
(37.4 |
) |
|
$ |
(14.0 |
) |
|
$ |
(28.9 |
) |
|
Plus: |
|
|
|
|
|
|
|
|
|
|
|
|
|
|
|
|
|
Amortization expense |
|
|
104.9 |
|
|
|
125.8 |
|
|
|
92.9 |
|
|
|
98.7 |
|
|
Establish public company financial reporting compliance (a) |
|
|
4.1 |
|
|
|
2.3 |
|
|
|
0.8 |
|
|
|
4.0 |
|
|
Business transformation and integration costs (b) |
|
|
25.4 |
|
|
|
18.7 |
|
|
|
10.8 |
|
|
|
16.2 |
|
|
Expenses related to initial public offering (c) |
|
|
6.8 |
|
|
|
— |
|
|
|
— |
|
|
|
— |
|
|
Debt extinguishment (d) |
|
|
25.1 |
|
|
|
— |
|
|
|
— |
|
|
|
— |
|
|
Equity-based compensation (e) |
|
|
28.8 |
|
|
|
2.9 |
|
|
|
3.8 |
|
|
|
3.7 |
|
|
Management fees (f) |
|
|
13.1 |
|
|
|
2.6 |
|
|
|
1.9 |
|
|
|
2.0 |
|
|
Income tax adjustment (g) |
|
|
(103.1 |
) |
|
|
(56.7 |
) |
|
|
(40.8 |
) |
|
|
(49.8 |
) |
|
Adjusted Net Income |
|
$ |
90.0 |
|
|
$ |
58.1 |
|
|
$ |
55.5 |
|
|
$ |
45.9 |
|
|
Free Cash Flow and Adjusted Free Cash Flow |
|
|
|
|
|
|
|
|
|
|
|
|
|
|
|
|
|
Cash flows from operating activities |
|
$ |
180.4 |
|
|
$ |
124.2 |
|
|
$ |
78.9 |
|
|
$ |
66.6 |
|
|
Minus: |
|
|
|
|
|
|
|
|
|
|
|
|
|
|
|
|
|
Capital expenditures |
|
|
86.4 |
|
|
|
60.9 |
|
|
|
50.6 |
|
|
|
65.4 |
|
|
Plus: |
|
|
|
|
|
|
|
|
|
|
|
|
|
|
|
|
|
Proceeds from sale of property and equipment |
|
|
12.0 |
|
|
|
7.0 |
|
|
|
6.3 |
|
|
|
5.3 |
|
|
Free Cash Flow |
|
$ |
105.9 |
|
|
$ |
70.4 |
|
|
$ |
34.6 |
|
|
$ |
6.5 |
|
|
Plus: |
|
|
|
|
|
|
|
|
|
|
|
|
|
|
|
|
|
ValleyCrest land and building acquisition (h) |
|
|
21.6 |
|
|
|
— |
|
|
|
— |
|
|
|
— |
|
|
Adjusted Free Cash Flow |
|
$ |
127.6 |
|
|
$ |
70.4 |
|
|
$ |
34.6 |
|
|
$ |
6.5 |
|
42
|
(b) |
Business transformation and integration costs consist of (i) severance and related costs; (ii) vehicle fleet rebranding costs; (iii) business integration costs and (iv) information technology infrastructure transformation costs and other. |
|
|
|
Twelve Months Ended September 30, |
|
|
Nine Months Ended September 30, |
|
||||||||||
|
(in millions) |
|
2018 |
|
|
2017 |
|
|
2017 |
|
|
2016 |
|
||||
|
Severance and related costs |
|
$ |
5.7 |
|
|
$ |
6.9 |
|
|
$ |
0.8 |
|
|
$ |
7.1 |
|
|
Rebranding of vehicle fleet |
|
|
12.5 |
|
|
|
6.3 |
|
|
|
6.3 |
|
|
|
— |
|
|
Business integration |
|
|
1.7 |
|
|
|
0.6 |
|
|
|
— |
|
|
|
3.8 |
|
|
IT infrastructure transformation and other |
|
|
5.5 |
|
|
|
4.9 |
|
|
|
3.7 |
|
|
|
5.3 |
|
|
Business transformation and integration costs |
|
$ |
25.4 |
|
|
$ |
18.7 |
|
|
$ |
10.8 |
|
|
$ |
16.2 |
|
|
(c) |
Represents expenses incurred in connection with the IPO. |
|
(d) |
Represents losses on the extinguishment of debt. |
|
(e) |
Represents equity-based compensation expense recognized for equity incentive plans outstanding, including $19.6 million related to the IPO in the twelve months ended September 30, 2018. |
|
(f) |
Represents fees paid pursuant to a monitoring agreement terminated on July 2, 2018 in connection with the completion of the IPO. |
|
(g) |
Represents the tax effect of pre-tax items excluded from Adjusted Net Income and the removal of the applicable discrete tax items, which collectively result in a reduction of income tax. The tax effect of pre-tax items excluded from Adjusted Net Income is computed using the statutory rate related to the jurisdiction that was impacted by the adjustment after taking into account the impact of permanent differences and valuation allowances. Discrete tax items include changes in laws or rates, changes in uncertain tax positions relating to prior years and changes in valuation allowances. The twelve months ended September 30, 2018 amount includes a $43.4 million benefit recognized as a result of the reduction in the U.S. corporate income tax rate from 35% to 21% under the 2017 Tax Act. |
|
|
|
Twelve Months Ended September 30, |
|
|
Nine Months Ended September 30, |
|
||||||||||
|
(in millions) |
|
2018 |
|
|
2017 |
|
|
2017 |
|
|
2016 |
|
||||
|
Tax impact of pre-tax income adjustments |
|
$ |
59.6 |
|
|
$ |
55.3 |
|
|
$ |
39.0 |
|
|
$ |
49.8 |
|
|
Discrete tax items |
|
|
43.5 |
|
|
|
1.4 |
|
|
|
1.8 |
|
|
|
— |
|
|
Income tax adjustment |
|
$ |
103.1 |
|
|
$ |
56.7 |
|
|
$ |
40.8 |
|
|
$ |
49.8 |
|
|
(h) |
Represents the acquisition of legacy ValleyCrest land and buildings in October 2017. |
43
Unaudited Quarterly Results of Operations
The following table sets forth our historical quarterly results of operations as well as certain operating data for each of our most recent eight fiscal quarters. This unaudited quarterly information (other than Adjusted EBITDA, Adjusted Net Income, Adjusted Earnings per Share, Free Cash Flow and Adjusted Free Cash Flow) has been prepared on the same basis as our audited financial statements appearing elsewhere in this Form 10-K, and includes all adjustments, consisting only of normal recurring adjustments, that we consider necessary to present fairly the financial information for the fiscal quarters presented. This information should be read in conjunction with the audited consolidated financial statements and related notes thereto included elsewhere in this Form 10-K.
|
|
|
Three Months Ended |
|
|||||||||||||||||||||||||||||
|
(In millions, except per share amounts) |
|
September 30, 2018 |
|
|
June 30, 2018 |
|
|
March 31, 2018 |
|
|
December 31, 2017 |
|
|
September 30, 2017 |
|
|
June 30, 2017 |
|
|
March 31, 2017 |
|
|
December 31, 2016 |
|
||||||||
|
Net service revenues |
|
$ |
581.8 |
|
|
$ |
630.3 |
|
|
$ |
590.4 |
|
|
$ |
551.1 |
|
|
$ |
567.0 |
|
|
$ |
627.5 |
|
|
$ |
519.1 |
|
|
$ |
512.3 |
|
|
Cost of services provided |
|
|
416.1 |
|
|
|
454.8 |
|
|
|
448.1 |
|
|
|
408.5 |
|
|
|
408.8 |
|
|
|
451.1 |
|
|
|
400.0 |
|
|
|
369.9 |
|
|
Gross profit |
|
|
165.7 |
|
|
|
175.6 |
|
|
|
142.2 |
|
|
|
142.6 |
|
|
|
158.2 |
|
|
|
176.4 |
|
|
|
119.1 |
|
|
|
142.4 |
|
|
Selling, general and administrative expense |
|
|
124.3 |
|
|
|
119.2 |
|
|
|
117.8 |
|
|
|
119.8 |
|
|
|
104.5 |
|
|
|
104.1 |
|
|
|
103.2 |
|
|
|
123.7 |
|
|
Amortization expense |
|
|
15.3 |
|
|
|
29.2 |
|
|
|
29.3 |
|
|
|
31.0 |
|
|
|
31.0 |
|
|
|
31.3 |
|
|
|
30.7 |
|
|
|
32.9 |
|
|
Income (loss) from operations |
|
|
26.0 |
|
|
|
27.1 |
|
|
|
(4.9 |
) |
|
|
(8.3 |
) |
|
|
22.7 |
|
|
|
41.1 |
|
|
|
(14.7 |
) |
|
|
(14.2 |
) |
|
Other (expense) income |
|
|
(24.8 |
) |
|
|
0.3 |
|
|
|
— |
|
|
|
1.0 |
|
|
|
0.5 |
|
|
|
0.3 |
|
|
|
0.6 |
|
|
|
0.4 |
|
|
Interest expense |
|
|
20.3 |
|
|
|
27.5 |
|
|
|
25.1 |
|
|
|
24.9 |
|
|
|
24.7 |
|
|
|
24.9 |
|
|
|
24.1 |
|
|
|
24.4 |
|
|
(Loss) income before income taxes |
|
|
(19.0 |
) |
|
|
(0.2 |
) |
|
|
(29.9 |
) |
|
|
(32.2 |
) |
|
|
(1.6 |
) |
|
|
16.5 |
|
|
|
(38.2 |
) |
|
|
(38.2 |
) |
|
Income tax benefit (expense) |
|
|
8.1 |
|
|
|
(1.2 |
) |
|
|
7.9 |
|
|
|
51.5 |
|
|
|
2.0 |
|
|
|
(1.1 |
) |
|
|
8.4 |
|
|
|
14.7 |
|
|
Net (loss) income |
|
$ |
(10.9 |
) |
|
$ |
(1.4 |
) |
|
$ |
(22.1 |
) |
|
$ |
19.3 |
|
|
$ |
0.4 |
|
|
$ |
15.4 |
|
|
$ |
(29.8 |
) |
|
$ |
(23.5 |
) |
|
(Loss) earnings per share: |
|
|
|
|
|
|
|
|
|
|
|
|
|
|
|
|
|
|
|
|
|
|
|
|
|
|
|
|
|
|
|
|
|
Basic |
|
$ |
(0.11 |
) |
|
$ |
(0.02 |
) |
|
$ |
(0.29 |
) |
|
$ |
0.25 |
|
|
$ |
0.01 |
|
|
$ |
0.20 |
|
|
$ |
(0.39 |
) |
|
$ |
(0.30 |
) |
|
Diluted |
|
$ |
(0.11 |
) |
|
$ |
(0.02 |
) |
|
$ |
(0.29 |
) |
|
$ |
0.25 |
|
|
$ |
0.01 |
|
|
$ |
0.20 |
|
|
$ |
(0.39 |
) |
|
$ |
(0.30 |
) |
|
Adjusted EBITDA(1) |
|
$ |
84.2 |
|
|
$ |
97.8 |
|
|
$ |
51.6 |
|
|
$ |
66.4 |
|
|
$ |
79.7 |
|
|
$ |
98.5 |
|
|
$ |
38.9 |
|
|
$ |
49.5 |
|
|
Adjusted Net Income (Loss)(1) |
|
$ |
35.8 |
|
|
$ |
33.2 |
|
|
$ |
7.6 |
|
|
$ |
13.4 |
|
|
$ |
24.2 |
|
|
$ |
35.1 |
|
|
$ |
(3.8 |
) |
|
$ |
2.6 |
|
|
Adjusted Earnings (Loss) per Share(1) |
|
$ |
0.35 |
|
|
$ |
0.43 |
|
|
$ |
0.10 |
|
|
$ |
0.17 |
|
|
$ |
0.31 |
|
|
$ |
0.46 |
|
|
$ |
(0.05 |
) |
|
$ |
0.03 |
|
|
Free Cash Flow(1) |
|
$ |
50.1 |
|
|
$ |
19.3 |
|
|
$ |
(16.8 |
) |
|
$ |
53.4 |
|
|
$ |
47.1 |
|
|
$ |
(15.5 |
) |
|
$ |
3.0 |
|
|
$ |
35.8 |
|
|
Adjusted Free Cash Flow(1) |
|
$ |
50.1 |
|
|
$ |
19.3 |
|
|
$ |
(16.8 |
) |
|
$ |
75.0 |
|
|
$ |
47.1 |
|
|
$ |
(15.5 |
) |
|
$ |
3.0 |
|
|
$ |
35.8 |
|
|
(1) |
Set forth below are the reconciliations of net (loss) income to Adjusted EBITDA and Adjusted Net Income, and cash flows from operating activities to Free Cash Flow and Adjusted Free Cash Flow. Adjusted EPS is defined as Adjusted Net Income (shown below) divided by the weighted average number of common shares outstanding for the period used in the calculation of basic EPS and presented in Note 18 “(Loss) Earnings Per Share of Common Stock”. |
44
|
|
Three Months Ended |
|
||||||||||||||||||||||||||||||
|
(In millions) |
|
September 30, 2018 |
|
|
June 30, 2018 |
|
|
March 31, 2018 |
|
|
December 31, 2017 |
|
|
September 30, 2017 |
|
|
June 30, 2017 |
|
|
March 31, 2017 |
|
|
December 31, 2016 |
|
||||||||
|
Adjusted EBITDA |
|
|
|
|
|
|
|
|
|
|
|
|
|
|
|
|
|
|
|
|
|
|
|
|
|
|
|
|
|
|
|
|
|
Net (loss) income |
|
$ |
(10.9 |
) |
|
$ |
(1.4 |
) |
|
$ |
(22.1 |
) |
|
$ |
19.3 |
|
|
$ |
0.4 |
|
|
$ |
15.4 |
|
|
$ |
(29.8 |
) |
|
$ |
(23.5 |
) |
|
Plus: |
|
|
|
|
|
|
|
|
|
|
|
|
|
|
|
|
|
|
|
|
|
|
|
|
|
|
|
|
|
|
|
|
|
Interest expense, net |
|
|
20.3 |
|
|
|
27.5 |
|
|
|
25.1 |
|
|
|
24.9 |
|
|
|
24.7 |
|
|
|
24.9 |
|
|
|
24.1 |
|
|
|
24.4 |
|
|
Income tax (benefit) provision |
|
|
(8.1 |
) |
|
|
1.2 |
|
|
|
(7.9 |
) |
|
|
(51.5 |
) |
|
|
(2.0 |
) |
|
|
1.1 |
|
|
|
(8.4 |
) |
|
|
(14.7 |
) |
|
Depreciation expense |
|
|
18.7 |
|
|
|
17.8 |
|
|
|
17.7 |
|
|
|
21.1 |
|
|
|
17.0 |
|
|
|
19.9 |
|
|
|
19.6 |
|
|
|
21.2 |
|
|
Amortization expense |
|
|
15.3 |
|
|
|
29.2 |
|
|
|
29.3 |
|
|
|
31.0 |
|
|
|
31.0 |
|
|
|
31.3 |
|
|
|
30.7 |
|
|
|
32.9 |
|
|
Establish public company financial reporting compliance (a) |
|
|
0.8 |
|
|
|
0.6 |
|
|
|
0.2 |
|
|
|
2.6 |
|
|
|
— |
|
|
|
0.4 |
|
|
|
0.4 |
|
|
|
1.5 |
|
|
Business transformation and integration costs (b) |
|
|
4.0 |
|
|
|
2.5 |
|
|
|
2.1 |
|
|
|
16.8 |
|
|
|
7.9 |
|
|
|
2.6 |
|
|
|
0.2 |
|
|
|
7.9 |
|
|
Expenses related to initial public offering (c) |
|
|
— |
|
|
|
4.7 |
|
|
|
2.1 |
|
|
|
— |
|
|
|
— |
|
|
|
— |
|
|
|
— |
|
|
|
— |
|
|
Debt extinguishment (d) |
|
|
25.1 |
|
|
|
— |
|
|
|
— |
|
|
|
— |
|
|
|
— |
|
|
|
— |
|
|
|
— |
|
|
|
— |
|
|
Equity-based compensation (e) |
|
|
8.0 |
|
|
|
15.0 |
|
|
|
4.3 |
|
|
|
1.5 |
|
|
|
0.3 |
|
|
|
2.2 |
|
|
|
1.4 |
|
|
|
(0.9 |
) |
|
Management fees (f) |
|
|
11.0 |
|
|
|
0.7 |
|
|
|
0.7 |
|
|
|
0.6 |
|
|
|
0.6 |
|
|
|
0.7 |
|
|
|
0.6 |
|
|
|
0.7 |
|
|
Adjusted EBITDA |
|
$ |
84.2 |
|
|
$ |
97.8 |
|
|
$ |
51.6 |
|
|
$ |
66.4 |
|
|
$ |
79.7 |
|
|
$ |
98.5 |
|
|
$ |
38.9 |
|
|
$ |
49.5 |
|
|
Adjusted Net Income |
|
|
|
|
|
|
|
|
|
|
|
|
|
|
|
|
|
|
|
|
|
|
|
|
|
|
|
|
|
|
|
|
|
Net (loss) income |
|
$ |
(10.9 |
) |
|
$ |
(1.4 |
) |
|
$ |
(22.1 |
) |
|
$ |
19.3 |
|
|
$ |
0.4 |
|
|
$ |
15.4 |
|
|
$ |
(29.8 |
) |
|
$ |
(23.5 |
) |
|
Plus: |
|
|
|
|
|
|
|
|
|
|
|
|
|
|
|
|
|
|
|
|
|
|
|
|
|
|
|
|
|
|
|
|
|
Amortization expense |
|
|
15.3 |
|
|
|
29.2 |
|
|
|
29.3 |
|
|
|
31.0 |
|
|
|
31.0 |
|
|
|
31.3 |
|
|
|
30.7 |
|
|
|
32.9 |
|
|
Establish public company financial reporting compliance (a) |
|
|
0.8 |
|
|
|
0.6 |
|
|
|
0.2 |
|
|
|
2.6 |
|
|
|
— |
|
|
|
0.4 |
|
|
|
0.4 |
|
|
|
1.5 |
|
|
Business transformation and integration costs (b) |
|
|
4.0 |
|
|
|
2.5 |
|
|
|
2.1 |
|
|
|
16.8 |
|
|
|
7.9 |
|
|
|
2.6 |
|
|
|
0.2 |
|
|
|
7.9 |
|
|
Expenses related to initial public offering (c) |
|
|
— |
|
|
|
4.7 |
|
|
|
2.1 |
|
|
|
— |
|
|
|
— |
|
|
|
— |
|
|
|
— |
|
|
|
— |
|
|
Debt extinguishment (d) |
|
|
25.1 |
|
|
|
— |
|
|
|
— |
|
|
|
— |
|
|
|
— |
|
|
|
— |
|
|
|
— |
|
|
|
— |
|
|
Equity-based compensation (e) |
|
|
8.0 |
|
|
|
15.0 |
|
|
|
4.3 |
|
|
|
1.5 |
|
|
|
0.3 |
|
|
|
2.2 |
|
|
|
1.4 |
|
|
|
(0.9 |
) |
|
Management fees (f) |
|
|
11.0 |
|
|
|
0.7 |
|
|
|
0.7 |
|
|
|
0.6 |
|
|
|
0.6 |
|
|
|
0.7 |
|
|
|
0.6 |
|
|
|
0.7 |
|
|
Income tax adjustment (g) |
|
|
(17.5 |
) |
|
|
(18.1 |
) |
|
|
(9.1 |
) |
|
|
(58.6 |
) |
|
|
(16.0 |
) |
|
|
(17.4 |
) |
|
|
(7.4 |
) |
|
|
(15.9 |
) |
|
Adjusted Net Income (Loss) |
|
$ |
35.8 |
|
|
$ |
33.2 |
|
|
$ |
7.6 |
|
|
$ |
13.4 |
|
|
$ |
24.2 |
|
|
$ |
35.1 |
|
|
$ |
(3.8 |
) |
|
$ |
2.6 |
|
|
Free Cash Flow and Adjusted Free Cash Flow |
|
|
|
|
|
|
|
|
|
|
|
|
|
|
|
|
|
|
|
|
|
|
|
|
|
|
|
|
|
|
|
|
|
Cash flows from (used in) operating activities |
|
$ |
56.7 |
|
|
$ |
44.5 |
|
|
$ |
(3.3 |
) |
|
$ |
82.5 |
|
|
$ |
55.3 |
|
|
$ |
0.2 |
|
|
$ |
23.4 |
|
|
$ |
45.3 |
|
|
Minus: |
|
|
|
|
|
|
|
|
|
|
|
|
|
|
|
|
|
|
|
|
|
|
|
|
|
|
|
|
|
|
|
|
|
Capital expenditures |
|
|
14.7 |
|
|
|
27.6 |
|
|
|
14.3 |
|
|
|
29.8 |
|
|
|
9.9 |
|
|
|
18.6 |
|
|
|
22.1 |
|
|
|
10.3 |
|
|
Plus: |
|
|
|
|
|
|
|
|
|
|
|
|
|
|
|
|
|
|
|
|
|
|
|
|
|
|
|
|
|
|
|
|
|
Proceeds from sale of property and equipment |
|
|
8.0 |
|
|
|
2.4 |
|
|
|
0.8 |
|
|
|
0.7 |
|
|
|
1.7 |
|
|
|
2.9 |
|
|
|
1.7 |
|
|
|
0.7 |
|
|
Free Cash Flow |
|
$ |
50.1 |
|
|
$ |
19.3 |
|
|
$ |
(16.8 |
) |
|
$ |
53.4 |
|
|
$ |
47.1 |
|
|
$ |
(15.5 |
) |
|
$ |
3.0 |
|
|
$ |
35.8 |
|
|
Plus: |
|
|
|
|
|
|
|
|
|
|
|
|
|
|
|
|
|
|
|
|
|
|
|
|
|
|
|
|
|
|
|
|
|
ValleyCrest land and building acquisition (h) |
|
|
— |
|
|
|
— |
|
|
|
— |
|
|
|
21.6 |
|
|
|
— |
|
|
|
— |
|
|
|
— |
|
|
|
— |
|
|
Adjusted Free Cash Flow |
|
$ |
50.1 |
|
|
$ |
19.3 |
|
|
$ |
(16.8 |
) |
|
$ |
75.0 |
|
|
$ |
47.1 |
|
|
$ |
(15.5 |
) |
|
$ |
3.0 |
|
|
$ |
35.8 |
|
45
|
(b) |
Business transformation and integration costs consist of (i) severance and related costs; (ii) vehicle fleet rebranding costs; (iii) business integration costs and (iv) information technology infrastructure transformation costs and other. |
|
|
|
Three Months Ended |
|
|||||||||||||||||||||||||||||
|
(In millions) |
|
September 30, 2018 |
|
|
June 30, 2018 |
|
|
March 31, 2018 |
|
|
December 31, 2017 |
|
|
September 30, 2017 |
|
|
June 30, 2017 |
|
|
March 31, 2017 |
|
|
December 31, 2016 |
|
||||||||
|
Severance and related costs |
|
$ |
2.5 |
|
|
$ |
1.1 |
|
|
$ |
(0.4 |
) |
|
$ |
2.6 |
|
|
$ |
0.8 |
|
|
$ |
0.4 |
|
|
$ |
(0.4 |
) |
|
$ |
6.1 |
|
|
Rebranding of vehicle fleet |
|
|
0.1 |
|
|
|
0.4 |
|
|
|
1.9 |
|
|
|
10.2 |
|
|
|
5.6 |
|
|
|
0.7 |
|
|
|
— |
|
|
|
— |
|
|
Business integration |
|
|
1.3 |
|
|
|
0.2 |
|
|
|
0.2 |
|
|
|
— |
|
|
|
— |
|
|
|
— |
|
|
|
— |
|
|
|
0.2 |
|
|
IT infrastructure transformation and other |
|
|
0.1 |
|
|
|
0.8 |
|
|
|
0.4 |
|
|
|
4.0 |
|
|
|
1.5 |
|
|
|
1.5 |
|
|
|
0.6 |
|
|
|
1.6 |
|
|
Business transformation and integration costs |
|
$ |
4.0 |
|
|
$ |
2.5 |
|
|
$ |
2.1 |
|
|
$ |
16.8 |
|
|
$ |
7.9 |
|
|
$ |
2.6 |
|
|
$ |
0.2 |
|
|
$ |
7.9 |
|
|
(c) |
Represents expenses incurred in connection with the IPO. |
|
(d) |
Represents losses on the extinguishment of debt. |
|
(e) |
Represents equity-based compensation expense recognized for equity incentive plans outstanding, including $6.7 million and $12.9 million related to the IPO in the three months ended September 30, 2018 and June 30, 2018, respectively. |
|
(f) |
Represents fees paid pursuant to a monitoring agreement terminated on July 2, 2018 in connection with the completion of the IPO. |
|
(g) |
Represents the tax effect of pre-tax items excluded from Adjusted Net Income and the removal of the applicable discrete tax items, which collectively result in a reduction of income tax. The tax effect of pre-tax items excluded from Adjusted Net Income is computed using the statutory rate related to the jurisdiction that was impacted by the adjustment after taking into account the impact of permanent differences and valuation allowances. Discrete tax items include changes in laws or rates, changes in uncertain tax positions relating to prior years and changes in valuation allowances. The three months ended December 31, 2017 amount includes a $40.5 million benefit recognized as a result of the reduction in the U.S. corporate income tax rate from 35% to 21% under the 2017 Tax Act. |
|
|
|
Three Months Ended |
|
|||||||||||||||||||||||||||||
|
(in millions) |
|
September 30, 2018 |
|
|
June 30, 2018 |
|
|
March 31, 2018 |
|
|
December 31, 2017 |
|
|
September 30, 2017 |
|
|
June 30, 2017 |
|
|
March 31, 2017 |
|
|
December 31, 2016 |
|
||||||||
|
Tax impact of pre-tax income adjustments |
|
$ |
16.1 |
|
|
$ |
17.7 |
|
|
$ |
7.9 |
|
|
$ |
18.1 |
|
|
$ |
14.3 |
|
|
$ |
17.5 |
|
|
$ |
7.2 |
|
|
$ |
16.3 |
|
|
Discrete tax items |
|
|
1.4 |
|
|
|
0.4 |
|
|
|
1.2 |
|
|
|
40.5 |
|
|
|
1.7 |
|
|
|
(0.1 |
) |
|
|
0.1 |
|
|
|
(0.4 |
) |
|
Income tax adjustment |
|
$ |
17.5 |
|
|
$ |
18.1 |
|
|
$ |
9.1 |
|
|
$ |
58.6 |
|
|
$ |
16.0 |
|
|
$ |
17.4 |
|
|
$ |
7.4 |
|
|
$ |
15.9 |
|
|
(h) |
Represents the acquisition of legacy ValleyCrest land and buildings in October 2017. |
Our operations and strategic objectives require continuing investment. Our resources include cash generated from operations and borrowings under long-term debt agreements.
Liquidity and Capital Resources
Liquidity
Since the consummation of the KKR Acquisition and related financing transactions, our principal sources of liquidity have been existing cash and cash equivalents, cash generated from operations and borrowings under the Credit Agreement (as defined below) and the Receivables Financing Agreement (as defined below). Our principal uses of cash following the consummation of the KKR Acquisition and related financing transactions have been to provide working capital, meet debt service requirements, fund capital expenditures and finance strategic plans, including acquisitions. We may also seek to finance capital expenditures under capital leases or other debt arrangements that provide liquidity or favorable borrowing terms. We continue to consider acquisition opportunities, but the size and timing of any future acquisitions and the related potential capital requirements cannot be predicted. While we have in the past financed certain acquisitions with internally generated cash, in the event that suitable businesses are available for acquisition upon acceptable terms, we may obtain all or a portion of the necessary financing through the incurrence of additional long-term borrowings.
As discussed in Note 1 “Business” in the Notes to the audited consolidated financial statements include in Part II. Item 8 of this Form 10-K, we completed an IPO in July 2018 and in conjunction with and following such IPO we repaid approximately $501.1 million of outstanding indebtedness.
46
Based on our current level of operations and available cash, we believe our cash flow from operations, together with availability under the Revolving Credit Facility under the Credit Agreement and the Receivables Financing Agreement, will provide sufficient liquidity to fund our current obligations, projected working capital requirements, debt service requirements and capital spending requirements for the next twelve months.
A substantial portion of our liquidity needs arise from debt service requirements, and from the ongoing cost of operations, working capital and capital expenditures.
|
|
|
September 30, |
|
|
September 30, |
|
|
December 31, |
|
|||
|
(In millions) |
|
2018 |
|
|
2017 |
|
|
2016 |
|
|||
|
Cash and cash equivalents |
|
$ |
35.2 |
|
|
$ |
12.8 |
|
|
$ |
68.0 |
|
|
Short-term borrowings and current maturities of long-term debt |
|
$ |
13.0 |
|
|
$ |
14.6 |
|
|
$ |
17.5 |
|
|
Long-term debt |
|
$ |
1,141.3 |
|
|
$ |
1,574.9 |
|
|
$ |
1,595.9 |
|
|
Total debt |
|
$ |
1,154.2 |
|
|
$ |
1,589.5 |
|
|
$ |
1,613.4 |
|
We can increase the borrowing availability under the Credit Agreement or increase the term loans outstanding under the Credit Agreement by up to $303.0 million, in the aggregate, in the form of additional commitments under the Revolving Credit Facility and/or incremental term loans under the Credit Agreement, or in the form of other indebtedness in lieu thereof, plus an additional amount so long as we do not exceed a specified senior secured leverage ratio. We can incur such additional secured or other unsecured indebtedness under the Credit Agreement if certain specified conditions are met. Our liquidity requirements are significant primarily due to debt service requirements. See Note 9 “Long-term Debt” to our audited consolidated financial statements included elsewhere in Part II. Item 8 of this Form 10-K.
Our business may not generate sufficient cash flows from operations or future borrowings may not be available to us under our Revolving Credit Facility or the Receivables Financing Agreement in an amount sufficient to enable us to pay our indebtedness, or to fund our other liquidity needs. Our ability to do so depends on, among other factors, prevailing economic conditions, many of which are beyond our control. In addition, upon the occurrence of certain events, such as a change in control, we could be required to repay or refinance our indebtedness. We may not be able to refinance any of our indebtedness, including the Series B Term Loan (as defined below) under the Credit Agreement, on commercially reasonable terms or at all. Any future acquisitions, joint ventures, or other similar transactions may require additional capital and there can be no assurance that any such capital will be available to us on acceptable terms or at all.
Cash Flows
Information about our cash flows, by category, is presented in our statements of cash flows and is summarized below:
|
|
|
Twelve Months Ended September 30, |
|
|
Nine Months Ended September 30, |
|
|
Year Ended December 31, |
|
|||||||||||
|
(In millions) |
|
2018 |
|
|
2017 |
|
|
2017 |
|
|
2016 |
|
|
2016 |
|
|||||
|
Operating activities |
|
$ |
180.4 |
|
|
$ |
124.2 |
|
|
$ |
78.9 |
|
|
$ |
66.6 |
|
|
$ |
111.9 |
|
|
Investing activities |
|
$ |
(179.3 |
) |
|
$ |
(105.1 |
) |
|
$ |
(97.5 |
) |
|
$ |
(61.9 |
) |
|
$ |
(69.5 |
) |
|
Financing activities |
|
$ |
21.3 |
|
|
$ |
(42.1 |
) |
|
$ |
(36.6 |
) |
|
$ |
(41.0 |
) |
|
$ |
(46.4 |
) |
|
Free Cash Flow (1) |
|
$ |
105.9 |
|
|
$ |
70.4 |
|
|
$ |
34.6 |
|
|
$ |
6.5 |
|
|
$ |
42.3 |
|
|
Adjusted Free Cash Flow (1) |
|
$ |
127.6 |
|
|
$ |
70.4 |
|
|
$ |
34.6 |
|
|
$ |
6.5 |
|
|
$ |
42.3 |
|
|
(1) |
See “Non-GAAP Financial Measures” above for a reconciliation to the most directly comparable GAAP measure. |
Cash Flows provided by Operating Activities
Net cash provided by operating activities for the twelve months ended September 30, 2018 increased $56.2 million, to $180.4 million, from $124.2 million in the 2017 period. This increase was primarily due to higher net income, and cash generated from changes in operating assets and liabilities of $23.8 million principally driven by a decrease in accounts receivable as a result of increased focus on cash collection.
Net cash provided by operating activities for the nine months ended September 30, 2017 increased $12.3 million, to $78.9 million, from $66.6 million in the 2016 period. This increase was primarily due to higher net income, and cash generated from changes in inventories and other operating assets, offset by changes in accounts payable and other operating liabilities.
47
Cash Flows used in Investing Activities
Net cash used in investing activities was $179.3 million in the twelve months ended September 30, 2018, an increase in the use of cash of $74.2 million compared to $105.1 million for the 2017 period. Cash used in investing activities included cash paid for acquisitions for the twelve months ended September 30, 2018 of $104.4 million compared to $53.8 million in the 2017 period. Capital expenditures increased 41.9%, or $25.5 million, year over year primarily due to the acquisition of legacy ValleyCrest land and buildings for $21.6 million.
Net cash used in investing activities was $97.5 million in the nine months ended September 30, 2017, an increase in the use of cash of $35.6 million compared to $61.9 million for the 2016 period. Cash used in investing activities included capital expenditures of $50.6 million and $65.4 million for the nine months ended September 30, 2017 and 2016, respectively. Capital expenditures decreased 22.5%, or $14.8 million, year over year as a result of our focus on improvement in asset utilization. Cash paid for acquisitions for the nine months ended September 30, 2017 was $53.8 million and we had no acquisitions in the 2016 period.
Cash Flows provided by (used in) Financing Activities
Net cash flows provided by financing activities of $21.3 million for the twelve months ended September 30, 2018 consisted primarily of proceeds from our Term Loan of $1,016.9 million, net of financing fees, offset by payoff of long-term borrowings of $1,662.6 million. Further contributing to the change was cash provided by the issuance of Common Stock of $501.3 million, net of share issuance costs, offset by repayments of capital lease obligations of $6.3 million and repurchases of common stock of $2.9 million. Cash used in financing activities was $42.1 million for the twelve months ended September 30, 2017 and reflects net repayments of long-term borrowings of $184.5 million, repayments of capital lease obligations of $4.7 million and repurchases of common stock of $3.0 million.
Net cash used in financing activities of $36.6 million for the nine months ended September 30, 2017 consisted of proceeds from our Receivables Financing Agreement of $150.0 million, voluntary repayments of long-term borrowings of $166.3 million, scheduled principal payments on long-term borrowings of $11.0 million, other debt-related payments of $4.3 million, repayments of capital lease obligations of $3.9 million and repurchases of common stock of $1.2 million. Cash used in financing activities was $41.0 million for the nine months ended September 30, 2016 and reflects net repayments of long-term borrowings of $11.7 million, repayments of capital lease obligations of $2.8 million and repurchases of common stock of $28.5 million. The decrease in repurchases of common stock was due to higher repurchase activity in the prior year due to the departure of several executives.
Free Cash Flow and Adjusted Free Cash Flow
Free Cash Flow increased $35.5 million to $105.9 million for the twelve months ended September 30, 2018 from $70.4 million in the 2017 period. The increase in Free Cash Flow was due to an increase in cash flows from operating activities of $56.2 million, partially offset by an increase in capital expenditures of $25.5 million. Adjusted Free Cash Flow increased $57.2 million to $127.6 million for the twelve months ended September 30, 2018 from $70.4 million in the 2017 period. The increase in Adjusted Free Cash Flow was due to an increase in cash flows from operating activities of $56.2 million, partially offset by an increase of $3.9 million in capital expenditures adjusted for the acquisition of legacy ValleyCrest land and buildings in fiscal 2018 of $21.6 million.
Free Cash Flow increased $28.1 million to $34.6 million for the nine months ended September 30, 2017 from $6.5 million in the 2016 period. The increase in Free Cash Flow was due to an increase in cash flows from operating activities of $12.3 million and a decrease in capital expenditures of $14.7 million due to our focus on improvement in asset utilization. Adjusted Free Cash Flow was the same as Free Cash Flow for the nine months ended September 30, 2017 and the same 2016 period.
Working Capital
|
(In millions) |
|
September 30, 2018 |
|
|
September 30, 2017 |
|
|
December 31, 2016 |
|
|||
|
Net Working Capital: |
|
|
|
|
|
|
|
|
|
|
|
|
|
Current assets |
|
$ |
531.2 |
|
|
$ |
502.5 |
|
|
$ |
489.3 |
|
|
Less: Current liabilities |
|
|
331.5 |
|
|
|
342.1 |
|
|
|
308.7 |
|
|
Net working capital |
|
$ |
199.7 |
|
|
$ |
160.4 |
|
|
$ |
180.6 |
|
Net working capital is defined as current assets less current liabilities. Net working capital increased $39.3 million, to $199.7 million, at September 30, 2018, from $160.4 million at September 30, 2017, primarily driven by an increase in cash and cash equivalents of $22.4 million, an increase in unbilled revenue related to the timing of work performed, and a decrease in the current portion of self-insurance reserves, offset by a decrease in accounts receivable due to an increased focus on cash collection and an increase in deferred revenue.
48
Net working capital decreased $20.2 million, to $160.4 million, at September 30, 2017, from $180.6 million at December 31, 2016, primarily driven by a decrease in cash and cash equivalents of $55.2 million and an increase in accrued expenses and other current liabilities, offset by higher accounts receivable and unbilled revenue related to the timing of work performed.
Description of Indebtedness
Series B Term Loan due 2025
On August 15, 2018, the Company entered into Amendment No. 5 to the Credit Agreement (the “Amendment” and as so amended, the “Credit Agreement”). The Credit Agreement was amended to provide for: (i) a $1,037,000 seven-year term loan (the “Series B Term Loan”) and (ii) a $260,000 five-year revolving credit facility. The Series B Term Loan matures on August 15, 2025 and bears interest at a rate per annum of LIBOR, plus 2.5%. The Company used the net proceeds from the Series B Term Loan to repay all amounts outstanding under the Company’s First Lien Term Loans. An original discount of $2,775 was incurred when the Series B Term Loan was issued and is being amortized using the effective interest method over the life of the debt resulting in an effective yield of 2.5%.
In addition to scheduled payments, the Company is obligated to pay a percentage of excess cash flow, as defined in the Credit Agreement, as accelerated principal payments. The percentage varies with the ratio of the Company’s debt to its cash flow. The excess cash flow calculation did not result in any accelerated payment due for the periods ended September 30, 2018, September 30, 2017, and December 31, 2016.
Revolving credit facility
The Company has a five-year $260,000 revolving credit facility (the “Revolving Credit Facility”) that matures on August 15, 2023 and bears interest at a rate per annum of LIBOR plus a margin ranging from 2.50% to 2.00%, with the margin determined based on the Company’s first lien net leverage ratio. The Revolving Credit Facility replaces the previous $210,000 revolving credit facility under the Credit Agreement. The Company had no outstanding balance under either facility as of September 30, 2018 and September 30, 2017. There is a quarterly commitment fee equal to either 1⁄2 of 1% or 3/8 of 1% of the unused balance of the Revolving Credit Facility depending on the Company’s leverage ratio. The Company had $77,301 and $76,006 of letters of credits issued and outstanding as of September 30, 2018 and September 30, 2017, respectively. The interest rates on the Revolving Credit Facility and previous revolving credit facility were 2.5%, 3.0%, and 3.0% for the year ended September 30, 2018, the nine months ended September 30, 2017 and the year ended December 31, 2016, respectively.
In May 2018, the Company borrowed $55,000 against the previous revolving credit facility and in July 2018 this was fully repaid with the IPO proceeds. In July 2018, the Company borrowed an additional $5,000 against the previous revolving credit facility and this was repaid in August 2018.
Receivables financing agreement
On April 28, 2017, the Company, through a wholly-owned subsidiary, entered into a receivables financing agreement (the “Receivables Financing Agreement”). The Receivables Financing Agreement provides a borrowing capacity of $175,000 through April 27, 2020. All amounts outstanding under the Receivables Financing Agreement are collateralized by substantially all of the Accounts receivables and Unbilled revenue of the Company. During the year ended September 30, 2018, the Company made voluntary repayments of $108,750 and borrowed $115,000 for amounts outstanding under the Receivables Financing Agreement.
For additional information on our material indebtedness, including our First Lien Term Loans, Second Lien Term Loans, Series B Term Loans and Revolving Credit Facility and our outstanding borrowings under the Receivables Financing Agreement, see “Note 9 “Long-term Debt” in our audited consolidated financial statements included elsewhere in this Form 10-K.
As of September 30, 2018, September 30, 2017, and December 31, 2016, we were in compliance with all of our debt covenants and no event of default had occurred or was ongoing.
49
Contractual Obligations and Commercial Commitments
The following table summarizes our future minimum payments for all contractual obligations and commercial commitments for years subsequent to September 30, 2018:
|
(In millions) |
|
Total |
|
|
Less than 1 Year |
|
|
1 – 3 Years |
|
|
3 – 5 Years |
|
|
More than 5 Years |
|
|||||
|
Long term debt(1) |
|
$ |
1,177.0 |
|
|
$ |
13.0 |
|
|
$ |
20.8 |
|
|
$ |
1,143.2 |
|
|
$ |
— |
|
|
Estimated interest payments(2) |
|
|
341.6 |
|
|
|
70.6 |
|
|
|
141.7 |
|
|
|
129.3 |
|
|
|
— |
|
|
Capital leases(3) |
|
|
11.9 |
|
|
|
5.2 |
|
|
|
6.1 |
|
|
|
0.6 |
|
|
|
— |
|
|
Operating leases(4) |
|
|
79.4 |
|
|
|
18.5 |
|
|
|
26.6 |
|
|
|
15.2 |
|
|
|
19.1 |
|
|
Purchase obligations(5) |
|
|
13.1 |
|
|
|
6.5 |
|
|
|
6.6 |
|
|
|
— |
|
|
|
— |
|
|
Total obligations and commitments |
|
$ |
1,623.0 |
|
|
$ |
113.8 |
|
|
$ |
201.8 |
|
|
$ |
1,288.3 |
|
|
$ |
19.1 |
|
|
(1) |
Includes the scheduled maturities of long term debt, which do not include any estimated excess cash flow payments. See Note 9 “Long-term Debt” to our audited consolidated financial statements included elsewhere in this Form 10-K. |
|
(2) |
Represents expected cumulative cash requirements for interest payments through maturity. We have estimated our interest payments based on management’s determination of the most likely scenarios for each relevant debt instrument. |
|
(3) |
Represents future payments on existing capital leases for certain management vehicles and equipment, including interest expense and executory costs, through scheduled expiration dates. |
|
(4) |
These amounts represent future payments relating to non-cancelable operating leases for buildings and equipment with terms ranging from month-to-month to ten years. |
|
(5) |
Purchase obligations include commitments for various products and services made in the normal course of business to meet operational requirements. The purchase obligation amounts do not represent the entire anticipated purchases in the future, but represent only those items for which we are contractually obligated as of September 30, 2018. For this reason, these amounts will not provide a complete and reliable indicator of our expected future cash outflows. |
Off-balance Sheet Arrangements
We have no off-balance sheet arrangements that have or are materially likely to have a current or future material effect on our financial condition, changes in financial condition, revenues or expenses, results of operations, liquidity, capital expenditures or capital resources.
Critical Accounting Policies and Estimates
Accounting estimates and assumptions discussed in this section are those that we consider to be the most critical to an understanding of our financial statements because they involve significant judgments and uncertainties. Management believes that the application of these policies on a consistent basis enables us to provide the users of the financial statements with useful and reliable information about our operating results and financial condition. Certain of these estimates include determining fair value. All of these estimates reflect our best judgment about current, and for some estimates, future economic and market conditions and their effect based on information available as of the date of these financial statements. If these conditions change from those expected, it is reasonably possible that the judgments and estimates described below could change, which may result in future impairments of goodwill, intangibles and long-lived assets, increases in reserves for contingencies, establishment of valuation allowances on deferred tax assets and increase in tax liabilities, among other effects. Also see Note 2 “Summary of Significant Accounting Policies” to our audited consolidated financial statements included elsewhere in this Form 10-K, which discusses the significant accounting policies that we have selected from acceptable alternatives.
Acquisitions
From time to time we enter into strategic acquisitions in an effort to better service existing customers and to attain new customers. When we acquire a controlling financial interest in an entity or group of assets that are determined to meet the definition of a business, we apply the acquisition method described in ASC Topic 805, Business Combinations. In accordance with GAAP, the results of the acquisitions we have completed are reflected in our financial statements from the date of acquisition forward.
We allocate the purchase consideration paid to acquire the business to the assets and liabilities acquired based on estimated fair values at the acquisition date, with the excess of purchase price over the estimated fair value of the net assets acquired recorded as goodwill. If during the measurement period (a period not to exceed twelve months from the acquisition date) we receive additional information that existed as of the acquisition date but at the time of the original allocation described above was unknown to us, we make the appropriate adjustments to the purchase price allocation in the reporting period the amounts are determined.
50
Significant judgment is required to estimate the fair value of intangible assets and in assigning their respective useful lives. Accordingly, we typically engage third-party valuation specialists, who work under the direction of management, to assist in valuing significant tangible and intangible assets acquired.
The fair value estimates are based on available historical information and on future expectations and assumptions deemed reasonable by management, but are inherently uncertain.
We typically use an income method to estimate the fair value of intangible assets, which is based on forecasts of the expected future cash flows attributable to the respective assets. Significant estimates and assumptions inherent in the valuations reflect a consideration of other marketplace participants, and include the amount and timing of future cash flows (including expected growth rates and profitability), a brand’s relative market position and the discount rate applied to the cash flows. Unanticipated market or macroeconomic events and circumstances may occur, which could affect the accuracy or validity of the estimates and assumptions.
Determining the useful life of an intangible asset also requires judgment. All of our acquired intangible assets (e.g., trademarks, non-compete agreements and customer relationships) are expected to have finite useful lives. Our estimates of the useful lives of finite-lived intangible assets are based on a number of factors including competitive environment, market share, brand history, operating plans and the macroeconomic environment of the regions in which the brands are sold.
The costs of finite-lived intangible assets are amortized to expense over their estimated lives. The value of residual goodwill is not amortized, but is tested at least annually for impairment as described in the following note.
Goodwill
Goodwill represents the excess of purchase price over the fair values underlying net assets acquired in an acquisition. Goodwill is not amortized, but rather is tested annually for impairment, or more frequently if events or changes in circumstances indicate that the carrying amount of the asset may not be recoverable. We test goodwill for impairment annually in the fourth quarter of each year using data as of July 1 of that year.
Goodwill is allocated to, and evaluated for impairment at, our four identified reporting units. Goodwill is tested for impairment by either performing a qualitative evaluation or a quantitative test. The qualitative evaluation is an assessment of factors to determine whether it is more likely than not that a reporting unit’s fair value is less than its carrying amount. We may elect not to perform the qualitative assessment for some or all reporting units and perform the quantitative impairment test. The quantitative goodwill impairment test requires us to compare the carrying value of the reporting unit’s net assets to the fair value of the reporting unit. The Company determined fair values of each of the reporting units using a combination of the income and market multiple approaches, which are weighted 75% and 25%, respectively. The estimates used in each approach include significant management assumptions, including long-term future growth rates, operating margins and future economic and market conditions. If the fair value exceeds the carrying value, no further evaluation is required, and no impairment loss is recognized. If the carrying amount of a reporting unit, including goodwill, exceeds the estimated fair value, the excess of the carrying value over the fair value is recorded as an impairment loss, the amount of which not to exceed the total amount of goodwill allocated to the reporting unit.
Our methodology for estimating the fair value of our reporting units is using the income approach based on the present value of future cash flows. The principal assumptions utilized in our valuation methodology include revenue growth rates, operating margin rates and discount rates. There can be no assurance that our estimates and assumptions regarding forecasted cash flow and revenue and operating income growth rates made for purposes of the annual goodwill impairment test will prove to be accurate predictions of the future. We believe the current assumptions and estimates utilized are both reasonable and appropriate. Based on our most recent analysis as of July 1, 2018, the fair values significantly exceed the carrying value of the reporting units, and therefore there were no indications of impairment.
51
Long-lived Assets (Excluding Goodwill)
Long-lived assets with finite lives are depreciated and amortized generally on a straight-line basis over their estimated useful lives. These lives are based on our previous experience for similar assets, potential market obsolescence and other industry and business data. Property and equipment and definite-lived intangible assets are reviewed for impairment whenever events or changes in circumstances indicate that the carrying amount of an asset may not be recoverable. Recoverability of assets to be held and used is measured by a comparison of the carrying amount of an asset to estimated undiscounted future cash flows expected to be generated by the asset. If the carrying amount of an asset exceeds its estimated future cash flows, an impairment charge is recognized for the amount by which the carrying amount of the asset exceeds the fair value. Changes in estimated useful lives or in the asset values could cause us to adjust our book value or future expense accordingly.
Net Service Revenues
We perform landscape maintenance and enhancement services, development services, other landscape services and snow removal services. Revenue is recognized based upon the service provided and the contract terms and is reported net of discounts and applicable sales taxes.
Maintenance Services
Landscape maintenance services are provided under annual contracts. Revenue is recognized in proportion to the performance of related services during a given month compared to the estimate of activities to be performed.
Landscape enhancement services are provided under contracts of short duration. Revenue for these services is generally recognized in the period in which the services are provided.
Snow removal services are provided on either a fixed fee basis for a snow season or under a time and material or other activity-based contracts. Geographies with heavier snowfall are typically associated with fixed fee based contracts. Revenue for snow removal services is recognized in the period in which the services are performed.
Development Services
We recognize revenue under our development services contracts using the percentage-of-completion method, measured by the percentage of cost incurred to date to the estimated total cost for each contract. The full amount of anticipated losses on contracts is recorded as soon as such losses can be estimated. Changes in job performance, job conditions, and estimated profitability, including final contract settlements, may result in revisions to costs and revenue and are recognized in the period in which the revisions are determined.
Risk Management
We carry general liability, auto liability, workers’ compensation, professional liability, directors’ and officers’ liability, and employee health care insurance policies. In addition, we carry umbrella liability insurance policies to cover claims over the liability limits contained in the primary policies. Our insurance programs for workers’ compensation, general liability, auto liability and employee health care for certain employees contain self-insured retention amounts, deductibles and other coverage limits (“self-insured liability”). Claims that are not self-insured as well as claims in excess of the self-insured liability amounts are insured. We use estimates in the determination of the required accrued self-insured claims. These estimates are based upon calculations performed by third-party actuaries, as well as examination of historical trends, and industry claims experience. We adjust our estimate of accrued self-insured claims when required to reflect changes based on factors such as changes in health care costs, accident frequency and claim severity. We believe the use of actuarial methods to account for these liabilities provides a consistent and effective way to measure these highly judgmental accruals. However, the use of any estimation technique in this area is inherently sensitive given the magnitude of claims involved and the length of time until the ultimate cost is known. We believe our recorded obligations for these expenses are consistently measured. Nevertheless, changes in healthcare costs, accident frequency and claim severity can materially affect the estimates for these liabilities.
52
We account for equity-based compensation plans under the fair value recognition and measurement provisions in accordance with applicable accounting standards, which require all equity-based payments to employees and non-employees, including grants of stock options, to be measured based on the grant date fair value of the awards. We use the Black-Scholes-Merton valuation model to estimate the fair value of stock options granted to employees and non-employees. The model requires certain assumptions including the estimated expected term of the stock options, the risk-free interest rate and the exercise price, of which certain assumptions are highly complex and subjective. The expected option life represents the period of time that the options granted are expected to be outstanding based on management’s best estimate of the timing of a liquidity event and the contractual term of the stock option. As there is not sufficient trading history of our common stock, we use a group of our competitors which we believe are similar to us, adjusted for our capital structure, in order to estimate volatility. Our exercise price is the stock price on the date in which shares were granted.
Prior to our IPO, our stock price was calculated based on the income approach. Under the income approach, specifically the discounted cash flow method, forecasted cash flows are discounted to the present value at a risk-adjusted discount rate. The valuation analyses determine discrete free cash flows over several years based on forecast financial information provided by management and a terminal value for the residual period beyond the discrete forecast, which are discounted at an appropriate rate to estimate our enterprise value. Under the market approach, specifically the guideline public company methods, we selected publicly traded companies with similar financial and operating characteristics as us and calculated valuation multiples based on the guideline public company’s financial information and market data. Subsequent to the IPO, the estimation of our stock price is no longer necessary as we rely on the market price to determine the market value of our common stock. For additional information related to the assumptions used, see Note 14 “Equity-Based Compensation” to our audited consolidated financial statements included elsewhere in Part II. Item 8 of this Form 10-K.
Income Taxes
The determination of our provision for income taxes requires management’s judgment in the use of estimates and the interpretation and application of complex tax laws. Judgment is also required in assessing the timing and amounts of deductible and taxable items. We establish contingency reserves for material, known tax exposures relating to deductions, transactions, and other matters involving some uncertainty as to the proper tax treatment of the item. Our reserves reflect our judgment as to the resolution of the issues involved if subject to judicial review. Several years may elapse before a particular matter, for which we have established a reserve, is audited and finally resolved or clarified. While we believe that our reserves are adequate to cover reasonably expected tax risks, issues raised by a tax authority may be finally resolved at an amount different than the related reserve. Such differences could materially increase or decrease our income tax provision in the current and/or future periods. When facts and circumstances change (including a resolution of an issue or statute of limitations expiration), these reserves are adjusted through the provision for income taxes in the period of change.
Recently Issued Accounting Pronouncements
Income Taxes
In February 2018, the Financial Accounting Standards Board (“FASB”) issued Accounting Standards Update (“ASU”) No. 2018-02, Income Statement — Reporting Comprehensive Income (Topic 220): Reclassification of Certain Tax Effects from Accumulated Other Comprehensive Income. This guidance provides the option to reclassify the stranded tax effects caused by the 2017 Tax Act from accumulated other comprehensive income to retained earnings. We early adopted this guidance in the first quarter of fiscal 2018, which impacted our consolidated statements of changes in stockholders’ equity by decreasing Accumulated Deficit and increasing Accumulated Other Comprehensive Loss by $3.5 million.
Revenue Recognition
In May 2014, the FASB issued ASU No. 2014-09, Revenue from Contracts with Customers, which was further updated in March and April 2016. The updated accounting guidance clarifies the principles for recognizing revenue and provides a single, contract-based revenue recognition model in order to create greater comparability for financial statement users across industries and jurisdictions. The core principle of the revenue model is that an entity recognizes revenue to depict the transfer of promised goods or services to clients in an amount that reflects the consideration to which the entity expects to be entitled in exchange for those goods or services. We will adopt the guidance in the first quarter of fiscal 2019 and will use the modified retrospective transition method to all contracts as of the date of initial application. The cumulative adoption impact is not material. We continue to assess the disclosure requirements and controls.
53
Intra-Entity Transfers of Assets Other Than Inventory
In October 2016, the FASB issued ASU No. 2016-16, Income Taxes (Topic 740): Intra-Entity Transfers of Assets Other Than Inventory. This guidance requires that an entity recognizes the income tax consequences of an intra- entity transfer of an asset other than inventory when the transfer occurs. We will adopt the guidance in the first quarter of fiscal 2019. We currently do not expect the adoption of ASU 2016-16 to have a material impact on our consolidated financial statements.
Hedging Activities
In August 2017, the FASB issued ASU No. 2017-12, Targeted Improvements to Accounting for Hedging Activities which amends and simplifies existing guidance to allow companies to more accurately present the economic effects of risk management activities in the financial statements. The amendments in this ASU are effective for fiscal years beginning after December 15, 2018, and interim periods within those fiscal years. Early adoption is permitted. For cash flow and net investment hedges as of the adoption date, the guidance requires a modified retrospective approach. The amended presentation and disclosure guidance is required only prospectively. We will adopt the guidance in the first quarter of fiscal 2019. We currently do not expect the adoption of ASU 2017-12 to have a material impact on our consolidated financial statements.
Leases
In February 2016, the FASB issued ASU No. 2016-02, Leases. The updated accounting guidance requires lessees to recognize all leases on their balance sheet as a right-of-use asset and a lease liability with the exception of short-term leases. For income statement purposes, the criteria for recognition, measurement and presentation of expense is largely similar to previous guidance, but without the requirement to use bright-line tests in the determination of lease classification. The updated accounting guidance for a lessor is largely unchanged from previous guidance but has been updated to align with certain changes to the lessee model and the new revenue recognition standard. The updated accounting guidance is effective for us as of October 1, 2019 and early adoption is permitted. In July 2018, the FASB issued ASU No. 2018-11, Leases: Targeted Improvements, which allows entities the option to adopt this standard prospectively with a cumulative-effect adjustment to opening equity and include required disclosures for prior period. We are currently evaluating the impact the updated accounting guidance will have on our consolidated financial statements and anticipate adopting the standard prospectively, in accordance with ASU No. 2018-11.
Fair Value Measurement
In August 2018, the FASB issued ASU No. 2018-13, Fair Value Measurement (Topic 820): Disclosure Framework – Changes to the Disclosure Requirements for Fair Value Measurement which modifies the disclosures on fair value measurements by removing the requirement to disclose the amount and reason for transfers between Level 1 and Level 2 of the fair value hierarchy and the policy for timing of such transfers. The ASU expands the disclosure requirements for Level 3 fair value measurements, primarily focused on changes in unrealized gains and losses included in other comprehensive income. For public entities, the standard is effective for fiscal years, and interim periods within those fiscal years, beginning after December 15, 2019. Early adoption is permitted for any removed or modified disclosures and adoption of the additional disclosures can be delayed until the effective date. We do not currently expect the adoption of ASU 2018-13 to have a material impact on our consolidated financial statements.
Item 7A. Quantitative and Qualitative Disclosures About Market Risk
Interest Rate Risk
We are exposed to interest rate risk as a result of our variable rate borrowings. We manage our exposure to interest rate risk by using pay-fixed interest rate swaps as cash flow hedges of a portion of our variable rate debt. We have historically targeted hedging between 30% and 40% of the principal amount outstanding under our Term Loans.
As of September 30, 2018, we had variable rate debt outstanding of $1.17 billion at a current weighted average interest rate of 4.6%, substantially all of which was incurred under our Senior Secured Credit Facilities and the Receivables Financing Agreement. Each of these loans bears interest based on LIBOR plus a spread.
We use interest rate swaps to offset our exposure to interest rate movements. These outstanding interest rate swaps qualify and are designated as cash flow hedges of forecasted LIBOR-based interest payments. At September 30, 2018, we were a fixed rate payer on three fixed-floating interest rate swap contracts that effectively fixed the LIBOR-based index used to determine the interest rates charged on our LIBOR-based variable rate borrowings. See Note 10 “Financial Instruments Measured at Fair Value” to our audited consolidated financial statements included elsewhere in this Form 10-K.
A 100 basis point increase in interest rates on our variable rate debt would increase our fiscal 2018 interest expense by approximately $14.0 million. A 100 basis point decrease in interest rates would not have significantly impacted our interest expense in
54
fiscal 2018 because LIBOR was slightly higher than 1.0% base rate floors under the Term Loans before refinancing and 0.0% base rate floors on the amended loan. Actual interest rates could change significantly more than 100 bps.
Commodity Price Risk
We are exposed to market risk for changes in fuel prices through the consumption of fuel by our vehicle fleet and mowers in the delivery of services to our customers. We purchase our fuel at prevailing market prices. We expect to use approximately 12 million gallons of fuel in 2019. As of September 30, 2018, a ten percent change in fuel prices would result in a change of approximately $3.5 million in our annual fuel cost.
We manage our exposure through the execution of a documented hedging strategy. We have historically entered into fuel swap contracts to mitigate the financial impact of fluctuations in fuel prices when appropriate. While we currently have no open fuel-based derivative instruments, we continue to monitor our exposure, the current pricing environment and may execute new fuel-based derivative instruments in the future.
Item 8. Financial Statements and Supplementary Data
The consolidated financial statements, supplementary information and financial statement schedules of the Company are set forth beginning on page F-1 of this report.
Item 9. Changes in and Disagreements With Accountants on Accounting and Financial Disclosure
None.
Item 9A. Controls and Procedures
Evaluation of Disclosure Controls and Procedures
Regulations under the Exchange Act require public companies, including us, to maintain “disclosure controls and procedures,” which are defined in Rule 13a-15(e) and Rule 15d-15(e) of the Exchange Act to mean a company’s controls and other procedures that are designed to ensure that information required to be disclosed in the reports that it files or submits under the Exchange Act is recorded, processed, summarized and reported within the time periods specified in the SEC’s rules and forms and that such information is accumulated and communicated to management, including our principal executive officer and principal financial officer, or persons performing similar functions, as appropriate to allow timely decisions regarding required or necessary disclosures. In designing and evaluating our disclosure controls and procedures, management recognizes that disclosure controls and procedures, no matter how well conceived and operated, can provide only reasonable, not absolute, assurance that the objectives of the disclosure controls and procedures are met. The design of any controls and procedures also is based on certain assumptions about the likelihood of future events, and there can be no assurance that any design will succeed in achieving its stated goals under all potential future conditions. Additionally, in designing disclosure controls and procedures, our management necessarily was required to apply its judgment in evaluating the cost-benefit relationship of possible disclosure controls and procedures. Our management, with the participation of our principal executive officer and principal financial officer, has evaluated the effectiveness of the design and operation of our disclosure controls and procedures as of the end of the period covered by this report. Based upon that evaluation and subject to the foregoing, our principal executive officer and principal financial officer concluded that, as of the end of the period covered by this report, the design and operation of our disclosure controls and procedures were effective to accomplish their objectives at a reasonable assurance level.
Management’s Report on Internal Control Over Financial Reporting
This Annual Report on Form 10-K does not include a report of management’s assessment regarding internal control over financial reporting or an attestation report of the Company’s registered public accounting firm due to a transition period established by rules of the SEC for newly public companies.
Changes in Internal Control Over Financial Reporting
Regulations under the Exchange Act require public companies, including our Company, to evaluate any change in our “internal control over financial reporting” as such term is defined in Rule 13a-15(f) and Rule 15d-15(f) of the Exchange Act. There have been no changes in the Company’s internal control over financial reporting during the Company’s most recent fiscal quarter that have materially affected, or are reasonably likely to materially affect, the Company’s internal control over financial reporting.
None.
55
Item 10. Directors, Executive Officers and Corporate Governance
The information required by this Item is incorporated by reference to the applicable information in the Company’s Proxy Statement for the 2019 Annual Meeting of Stockholders, which is expected to be filed with the SEC on or before January 28, 2019.
Item 11. Executive Compensation
The information required by this Item is incorporated by reference to the applicable information in the Company’s Proxy Statement for the 2019 Annual Meeting of Stockholders, which is expected to be filed with the SEC on or before January 28, 2019.
Item 12. Security Ownership of Certain Beneficial Owners and Management and Related Stockholder Matters
The information required by this Item is incorporated by reference to the applicable information in the Company’s Proxy Statement for the 2019 Annual Meeting of Stockholders, which is expected to be filed with the SEC on or before January 28, 2019.
Item 13. Certain Relationships and Related Transactions, and Director Independence
The information required by this Item is incorporated by reference to the applicable information in the Company’s Proxy Statement for the 2019 Annual Meeting of Stockholders, which is expected to be filed with the SEC on or before January 28, 2019.
Item 14. Principal Accounting Fees and Services
The information required by this Item is incorporated by reference to the applicable information in the Company’s Proxy Statement for the 2019 Annual Meeting of Stockholders, which is expected to be filed with the SEC on or before January 28, 2019.
56
Item 15. Exhibits, Financial Statement Schedules
(a) The following documents are filed as part of this report:
|
|
(1) |
Consolidated Financial Statements; |
See the “Index” to the Consolidated Financial Statements commencing on page F-1 of this Form 10-K.
|
|
(2) |
Financial Statement Schedules |
All financial statement schedules are omitted since the required information is not present or is not present in amounts sufficient to require submission of the schedules, or because the information required is included in the consolidated financial statements and notes thereto.
|
|
(3) |
Exhibits |
|
|
See the “Exhibit Index” beginning on page 58 of this Form 10-K. |
Not applicable.
57
|
Exhibit Number |
|
Description |
|
|
|
|
|
3.1 |
|
|
|
|
|
|
|
3.2 |
|
|
|
|
|
|
|
4.1 |
|
|
|
|
|
|
|
4.2 |
|
|
|
|
|
|
|
4.3 |
|
|
|
|
|
|
|
4.4 |
|
|
|
|
|
|
|
10.1 |
|
|
|
|
|
|
|
10.2 |
|
|
|
|
|
|
|
10.3 |
|
|
|
|
|
|
|
10.4 |
|
|
|
|
|
|
|
10.5 |
|
|
|
|
|
|
|
10.6 |
|
|
|
|
|
|
58
|
|
||
|
|
|
|
|
10.8 |
|
|
|
|
|
|
|
10.9 |
|
|
|
|
|
|
|
10.10 |
|
|
|
|
|
|
|
10.11 |
|
|
|
|
|
|
|
10.12 |
|
|
|
|
|
|
|
10.13 |
|
|
|
|
|
|
|
10.14 |
|
|
|
|
|
|
|
10.15 |
|
|
|
|
|
|
|
10.16 |
|
|
|
|
|
|
|
10.17 |
|
|
|
|
|
|
|
10.18 |
|
|
|
|
|
|
|
10.19 |
|
|
|
|
|
|
59
|
|
||
|
|
|
|
|
10.21† |
|
|
|
|
|
|
|
10.22† |
|
|
|
|
|
|
|
10.23† |
|
|
|
|
|
|
|
10.24† |
|
|
|
|
|
|
|
10.25† |
|
|
|
|
|
|
|
10.26† |
|
|
|
|
|
|
|
10.27† |
|
|
|
|
|
|
|
10.28† |
|
|
|
|
|
|
|
10.29† |
|
|
|
|
|
|
|
10.30† |
|
|
|
|
|
|
|
10.31† |
|
|
|
|
|
|
|
10.32† |
|
|
|
|
|
|
|
21.1 |
|
|
|
|
|
|
|
23.1* |
|
|
|
|
|
|
|
31.1* |
|
|
|
|
|
|
|
31.2* |
|
|
|
|
|
|
|
32.1* |
|
|
|
|
|
|
|
32.2* |
|
|
|
|
|
|
|
101.INS |
|
XBRL Instance Document |
|
101.SCH |
|
XBRL Taxonomy Extension Schema Document |
|
101.CAL |
|
XBRL Taxonomy Extension Calculation Linkbase Document |
60
|
|
XBRL Taxonomy Extension Definition Linkbase Document |
|
|
101.LAB |
|
XBRL Taxonomy Extension Label Linkbase Document |
|
101.PRE |
|
XBRL Taxonomy Extension Presentation Linkbase Document |
† Indicates a management contract or any compensatory plan, contract or arrangement.
* Filed herewith.
61
Pursuant to the requirements of Section 13 or 15(d) of the Securities Exchange Act of 1934, as amended, the Registrant has duly caused this Report to be signed on its behalf by the undersigned, thereunto duly authorized.
|
|
|
BrightView Holdings, Inc. |
|
|
|
|
|
|
|
Date: November 28, 2018 |
|
By: |
/s/ Andrew V. Masterman |
|
|
|
|
Andrew V. Masterman |
|
|
|
|
Chief Executive Officer, President and Director (Principal Executive Officer) |
Pursuant to the requirements of the Securities Exchange Act of 1934, as amended, this Report has been signed below by the following persons on behalf of the Registrant in the capacities and on the dates indicated.
|
Name |
|
Title |
|
Date |
|
|
|
|
|
|
|
|
|
|
|
|
|
/s/ Andrew V. Masterman |
|
Chief Executive Officer, President and Director |
|
November 28, 2018 |
|
Andrew V. Masterman |
|
(Principal Executive Officer) |
|
|
|
|
|
|
|
|
|
/s/ John A. Feenan |
|
Executive Vice President and Chief Financial Officer |
|
November 28, 2018 |
|
John A. Feenan |
|
(Principal Financial Officer) |
|
|
|
|
|
|
|
|
|
/s/ Louay H. Khatib |
|
Chief Accounting Officer |
|
November 28, 2018 |
|
Louay H. Khatib |
|
(Principal Accounting Officer) |
|
|
|
|
|
|
|
|
|
/s/ Paul E. Raether |
|
Chairman of Board of Directors |
|
November 28, 2018 |
|
Paul E. Raether |
|
|
|
|
|
|
|
|
|
|
|
/s/ James R. Abrahamson |
|
Director |
|
November 28, 2018 |
|
James R. Abrahamson |
|
|
|
|
|
|
|
|
|
|
|
/s/ Shamit Grover |
|
Director |
|
November 28, 2018 |
|
Shamit Grover |
|
|
|
|
|
|
|
|
|
|
|
/s/ Richard W. Roedel |
|
Director |
|
November 28, 2018 |
|
Richard W. Roedel |
|
|
|
|
|
|
|
|
|
|
|
/s/ Joshua T. Weisenbeck |
|
Director |
|
November 28, 2018 |
|
Joshua T. Weisenbeck |
|
|
|
|
|
|
|
|
|
|
62
INDEX TO CONSOLIDATED FINANCIAL STATEMENTS
|
F-2 |
|
|
|
|
|
Consolidated Balance Sheets as of September 30, 2018 and 2017 |
F-3 |
|
|
|
|
F-4 |
|
|
|
|
|
F-5 |
|
|
|
|
|
F-6 |
|
|
|
|
|
F-7 |
|
|
|
|
|
F-8 |
F-1
Report of Independent Registered Public Accounting Firm
To the stockholders and the Board of Directors of BrightView Holdings, Inc.
Opinion on the Financial Statements
We have audited the accompanying consolidated balance sheets of BrightView Holdings, Inc. and subsidiaries (the “Company”) as of September 30, 2018 and 2017, the related consolidated statements of operations, comprehensive income (loss), stockholders’ equity, and cash flows, for the fiscal year ended September 30, 2018, nine months ended September 30, 2017, and the year ended December 31, 2016, the related notes (collectively referred to as the "financial statements"). In our opinion, the financial statements present fairly, in all material respects, the financial position of the Company as of September 30, 2018 and 2017, and the results of its operations and its cash flows for the fiscal year ended September 30, 2018, nine months ended September 30, 2017, and the year ended December 31, 2016, in conformity with accounting principles generally accepted in the United States of America.
Basis for Opinion
These financial statements are the responsibility of the Company's management. Our responsibility is to express an opinion on the Company's financial statements based on our audits. We are a public accounting firm registered with the Public Company Accounting Oversight Board (United States) (PCAOB) and are required to be independent with respect to the Company in accordance with the U.S. federal securities laws and the applicable rules and regulations of the Securities and Exchange Commission and the PCAOB.
We conducted our audits in accordance with the standards of the PCAOB. Those standards require that we plan and perform the audit to obtain reasonable assurance about whether the financial statements are free of material misstatement, whether due to error or fraud. The Company is not required to have, nor were we engaged to perform, an audit of its internal control over financial reporting. As part of our audits, we are required to obtain an understanding of internal control over financial reporting but not for the purpose of expressing an opinion on the effectiveness of the Company’s internal control over financial reporting. Accordingly, we express no such opinion.
Our audits included performing procedures to assess the risks of material misstatement of the financial statements, whether due to error or fraud, and performing procedures that respond to those risks. Such procedures included examining, on a test basis, evidence regarding the amounts and disclosures in the financial statements. Our audits also included evaluating the accounting principles used and significant estimates made by management, as well as evaluating the overall presentation of the financial statements. We believe that our audits provide a reasonable basis for our opinion.
/s/ Deloitte & Touche LLP
Philadelphia, Pennsylvania
November 28, 2018
We have served as the Company's auditor since 2014.
F-2
(In thousands, except par value)
|
|
|
September 30, 2018 |
|
|
September 30, 2017 |
|
||
|
|
|
|
|
|
|
|
|
|
|
Assets |
|
|
|
|
|
|
|
|
|
Current assets: |
|
|
|
|
|
|
|
|
|
Cash and cash equivalents |
|
$ |
35,224 |
|
|
$ |
12,779 |
|
|
Accounts receivable, net |
|
|
317,056 |
|
|
|
330,173 |
|
|
Unbilled revenue |
|
|
99,876 |
|
|
|
88,907 |
|
|
Inventories |
|
|
23,830 |
|
|
|
24,954 |
|
|
Other current assets |
|
|
55,179 |
|
|
|
45,708 |
|
|
Total current assets |
|
|
531,165 |
|
|
|
502,521 |
|
|
Property and equipment, net |
|
|
256,806 |
|
|
|
245,534 |
|
|
Intangible assets, net |
|
|
290,455 |
|
|
|
371,271 |
|
|
Goodwill |
|
|
1,766,761 |
|
|
|
1,703,773 |
|
|
Other assets |
|
|
46,711 |
|
|
|
35,521 |
|
|
Total assets |
|
$ |
2,891,898 |
|
|
$ |
2,858,620 |
|
|
Liabilities and Stockholders’ Equity |
|
|
|
|
|
|
|
|
|
Current liabilities: |
|
|
|
|
|
|
|
|
|
Accounts payable |
|
$ |
93,603 |
|
|
$ |
76,133 |
|
|
Current portion of long-term debt |
|
|
12,963 |
|
|
|
14,600 |
|
|
Deferred revenue |
|
|
72,476 |
|
|
|
58,221 |
|
|
Current portion of self-insurance reserves |
|
|
34,537 |
|
|
|
56,079 |
|
|
Accrued expenses and other current liabilities |
|
|
117,891 |
|
|
|
137,116 |
|
|
Total current liabilities |
|
|
331,470 |
|
|
|
342,149 |
|
|
Long-term debt, net |
|
|
1,141,279 |
|
|
|
1,574,882 |
|
|
Deferred tax liabilities |
|
|
67,219 |
|
|
|
125,139 |
|
|
Self-insurance reserves |
|
|
93,400 |
|
|
|
66,519 |
|
|
Other liabilities |
|
|
31,203 |
|
|
|
53,670 |
|
|
Total liabilities |
|
|
1,664,571 |
|
|
|
2,162,359 |
|
|
Stockholders’ equity: |
|
|
|
|
|
|
|
|
|
Preferred stock, $0.01 par value; 50,000 shares authorized; no shares issued or outstanding as of September 30, 2018 and September 30, 2017 |
|
|
— |
|
|
|
— |
|
|
Common stock, $0.01 par value; 500,000 shares authorized; 104,470 and 77,083 shares issued and outstanding as of September 30, 2018 and September 30, 2017, respectively |
|
|
1,045 |
|
|
|
771 |
|
|
Additional paid-in-capital |
|
|
1,426,344 |
|
|
|
894,089 |
|
|
Accumulated deficit |
|
|
(189,636 |
) |
|
|
(178,015 |
) |
|
Accumulated other comprehensive loss |
|
|
(10,426 |
) |
|
|
(20,584 |
) |
|
Total stockholders’ equity |
|
|
1,227,327 |
|
|
|
696,261 |
|
|
Total liabilities and stockholders’ equity |
|
$ |
2,891,898 |
|
|
$ |
2,858,620 |
|
The accompanying notes are an integral part of these consolidated financial statements.
F-3
Consolidated Statements of Operations
(In thousands, except per share data)
|
|
|
Fiscal Year Ended |
|
|
Nine Months Ended |
|
|
Year Ended |
|
|||||||
|
|
|
September 30, 2018 |
|
|
September 30, 2017 |
|
|
September 30, 2016 |
|
|
December 31, 2016 |
|
||||
|
|
|
|
|
|
|
|
|
|
|
(Unaudited) |
|
|
|
|
|
|
|
Net service revenues |
|
$ |
2,353,603 |
|
|
$ |
1,713,579 |
|
|
$ |
1,673,029 |
|
|
$ |
2,185,302 |
|
|
Cost of services provided |
|
|
1,727,524 |
|
|
|
1,259,822 |
|
|
|
1,208,233 |
|
|
|
1,578,141 |
|
|
Gross profit |
|
|
626,079 |
|
|
|
453,757 |
|
|
|
464,796 |
|
|
|
607,161 |
|
|
Selling, general and administrative expense |
|
|
481,183 |
|
|
|
311,817 |
|
|
|
344,361 |
|
|
|
468,042 |
|
|
Amortization expense |
|
|
104,943 |
|
|
|
92,863 |
|
|
|
98,671 |
|
|
|
131,562 |
|
|
Income from operations |
|
|
39,953 |
|
|
|
49,077 |
|
|
|
21,764 |
|
|
|
7,557 |
|
|
Other (expense) income |
|
|
(23,506 |
) |
|
|
1,425 |
|
|
|
1,882 |
|
|
|
2,236 |
|
|
Interest expense |
|
|
97,782 |
|
|
|
73,742 |
|
|
|
70,285 |
|
|
|
94,660 |
|
|
Loss before income taxes |
|
|
(81,335 |
) |
|
|
(23,240 |
) |
|
|
(46,639 |
) |
|
|
(84,867 |
) |
|
Income tax benefit |
|
|
66,248 |
|
|
|
9,285 |
|
|
|
17,769 |
|
|
|
32,503 |
|
|
Net loss |
|
$ |
(15,087 |
) |
|
$ |
(13,955 |
) |
|
$ |
(28,870 |
) |
|
$ |
(52,364 |
) |
|
Loss per share: |
|
|
|
|
|
|
|
|
|
|
|
|
|
|
|
|
|
Basic and Diluted |
|
$ |
(0.18 |
) |
|
$ |
(0.18 |
) |
|
$ |
(0.37 |
) |
|
$ |
(0.67 |
) |
The accompanying notes are an integral part of these consolidated financial statements.
F-4
Consolidated Statements of Comprehensive Income (Loss)
(In thousands)
|
|
|
Fiscal Year Ended |
|
|
Nine Months Ended |
|
|
Year Ended |
|
|||||||
|
|
|
September 30, 2018 |
|
|
September 30, 2017 |
|
|
September 30, 2016 |
|
|
December 31, 2016 |
|
||||
|
|
|
|
|
|
|
|
|
|
|
(Unaudited) |
|
|
|
|
|
|
|
Net loss |
|
$ |
(15,087 |
) |
|
$ |
(13,955 |
) |
|
$ |
(28,870 |
) |
|
$ |
(52,364 |
) |
|
Net derivative gains (losses) arising during the period, net of tax of $(3,075), $1,604, $6,356(1) and $2,972, respectively |
|
|
6,820 |
|
|
|
(2,425 |
) |
|
|
(9,480 |
) |
|
|
(4,692 |
) |
|
Reclassification of losses into net loss, net of tax of $3,005, $3,108, $1,913(1) and $3,379, respectively |
|
|
6,804 |
|
|
|
4,700 |
|
|
|
2,844 |
|
|
|
5,025 |
|
|
Other comprehensive income (loss) |
|
|
13,624 |
|
|
|
2,275 |
|
|
|
(6,636 |
) |
|
|
333 |
|
|
Comprehensive loss |
|
$ |
(1,463 |
) |
|
$ |
(11,680 |
) |
|
$ |
(35,506 |
) |
|
$ |
(52,031 |
) |
|
(1) |
The financial information presented above for the nine months ended September 30, 2016 is unaudited. |
F-5
BrightView Holdings, Inc.
Consolidated Statements of Stockholders’ Equity
(In thousands)
|
|
|
Common Stock |
|
|
Additional Paid-In Capital |
|
|
Accumulated Deficit |
|
|
Accumulated Other Comprehensive Loss |
|
|
Total Stockholders’ Equity |
|
|||||||||
|
|
|
Shares |
|
|
Amount |
|
|
|
|
|
|
|
|
|
|
|
|
|
|
|
|
|
||
|
Balance, December 31, 2015 |
|
|
78,311 |
|
|
$ |
783 |
|
|
$ |
916,959 |
|
|
$ |
(111,696 |
) |
|
$ |
(23,192 |
) |
|
$ |
782,854 |
|
|
Net loss |
|
|
— |
|
|
|
— |
|
|
|
— |
|
|
|
(52,364 |
) |
|
|
— |
|
|
|
(52,364 |
) |
|
Other comprehensive income, net of tax |
|
|
— |
|
|
|
— |
|
|
|
— |
|
|
|
— |
|
|
|
333 |
|
|
|
333 |
|
|
Capital contributions and issuance of common stock |
|
|
114 |
|
|
|
1 |
|
|
|
1,915 |
|
|
|
— |
|
|
|
— |
|
|
|
1,916 |
|
|
Equity-based compensation |
|
|
— |
|
|
|
— |
|
|
|
2,772 |
|
|
|
— |
|
|
|
— |
|
|
|
2,772 |
|
|
Repurchase of common stock and distributions |
|
|
(1,367 |
) |
|
|
(13 |
) |
|
|
(30,292 |
) |
|
|
— |
|
|
|
— |
|
|
|
(30,305 |
) |
|
Balance, December 31, 2016 |
|
|
77,058 |
|
|
$ |
771 |
|
|
$ |
891,354 |
|
|
$ |
(164,060 |
) |
|
$ |
(22,859 |
) |
|
$ |
705,206 |
|
|
Net loss |
|
|
— |
|
|
|
— |
|
|
|
— |
|
|
|
(13,955 |
) |
|
|
— |
|
|
|
(13,955 |
) |
|
Other comprehensive income, net of tax |
|
|
— |
|
|
|
— |
|
|
|
— |
|
|
|
— |
|
|
|
2,275 |
|
|
|
2,275 |
|
|
Capital contributions and issuance of common stock |
|
|
69 |
|
|
|
1 |
|
|
|
124 |
|
|
|
— |
|
|
|
— |
|
|
|
125 |
|
|
Equity-based compensation |
|
|
— |
|
|
|
— |
|
|
|
3,839 |
|
|
|
— |
|
|
|
— |
|
|
|
3,839 |
|
|
Repurchase of common stock and distributions |
|
|
(44 |
) |
|
|
(1 |
) |
|
|
(1,228 |
) |
|
|
— |
|
|
|
— |
|
|
|
(1,229 |
) |
|
Balance, September 30, 2017 |
|
|
77,083 |
|
|
$ |
771 |
|
|
$ |
894,089 |
|
|
$ |
(178,015 |
) |
|
$ |
(20,584 |
) |
|
$ |
696,261 |
|
|
Net loss |
|
|
— |
|
|
|
— |
|
|
|
— |
|
|
|
(15,087 |
) |
|
|
— |
|
|
|
(15,087 |
) |
|
Other comprehensive income, net of tax |
|
|
— |
|
|
|
— |
|
|
|
— |
|
|
|
— |
|
|
|
13,624 |
|
|
|
13,624 |
|
|
Capital contributions and issuance of common stock |
|
|
27,497 |
|
|
|
276 |
|
|
|
506,380 |
|
|
|
— |
|
|
|
— |
|
|
|
506,656 |
|
|
Equity-based compensation |
|
|
— |
|
|
|
— |
|
|
|
28,795 |
|
|
|
— |
|
|
|
— |
|
|
|
28,795 |
|
|
Repurchase of common stock and distributions |
|
|
(110 |
) |
|
|
(2 |
) |
|
|
(2,920 |
) |
|
|
— |
|
|
|
— |
|
|
|
(2,922 |
) |
|
Reclassification of effects of tax reform enactment |
|
|
— |
|
|
|
— |
|
|
|
— |
|
|
|
3,466 |
|
|
|
(3,466 |
) |
|
|
— |
|
|
Balance, September 30, 2018 |
|
|
104,470 |
|
|
$ |
1,045 |
|
|
$ |
1,426,344 |
|
|
$ |
(189,636 |
) |
|
$ |
(10,426 |
) |
|
$ |
1,227,327 |
|
The accompanying notes are an integral part of these consolidated financial statements.
F-6
Consolidated Statements of Cash Flows
(In thousands)
|
|
|
Fiscal Year Ended |
|
|
Nine Months Ended |
|
|
Year Ended |
|
|||||||
|
|
|
September 30, 2018 |
|
|
September 30, 2017 |
|
|
September 30, 2016 |
|
|
December 31, 2016 |
|
||||
|
|
|
|
|
|
|
|
|
|
|
(Unaudited) |
|
|
|
|
|
|
|
Cash flows from operating activities: |
|
|
|
|
|
|
|
|
|
|
|
|
|
|
|
|
|
Net loss |
|
$ |
(15,087 |
) |
|
$ |
(13,955 |
) |
|
$ |
(28,870 |
) |
|
$ |
(52,364 |
) |
|
Adjustments to reconcile net loss to net cash provided by operating activities: |
|
|
|
|
|
|
|
|
|
|
|
|
|
|
|
|
|
Depreciation |
|
|
75,296 |
|
|
|
56,473 |
|
|
|
58,025 |
|
|
|
79,255 |
|
|
Amortization of intangible assets |
|
|
104,943 |
|
|
|
92,863 |
|
|
|
98,671 |
|
|
|
131,562 |
|
|
Amortization of financing costs and original issue discount |
|
|
10,351 |
|
|
|
7,701 |
|
|
|
7,198 |
|
|
|
9,640 |
|
|
Loss on debt extinguishment |
|
|
25,109 |
|
|
|
— |
|
|
|
— |
|
|
|
— |
|
|
Deferred taxes |
|
|
(63,360 |
) |
|
|
(34,831 |
) |
|
|
(26,611 |
) |
|
|
(42,762 |
) |
|
Equity-based compensation |
|
|
28,795 |
|
|
|
3,839 |
|
|
|
3,718 |
|
|
|
2,772 |
|
|
Hedge ineffectiveness and realized loss |
|
|
9,809 |
|
|
|
7,809 |
|
|
|
(7,153 |
) |
|
|
333 |
|
|
Provision for doubtful accounts |
|
|
896 |
|
|
|
117 |
|
|
|
3,420 |
|
|
|
6,005 |
|
|
Other non-cash activities, net |
|
|
573 |
|
|
|
(1,304 |
) |
|
|
(389 |
) |
|
|
87 |
|
|
Change in operating assets and liabilities: |
|
|
|
|
|
|
|
|
|
|
|
|
|
|
|
|
|
Accounts receivable |
|
|
25,153 |
|
|
|
(24,238 |
) |
|
|
(22,231 |
) |
|
|
(23,723 |
) |
|
Unbilled and deferred revenue |
|
|
2,636 |
|
|
|
(42,309 |
) |
|
|
(46,209 |
) |
|
|
(17,997 |
) |
|
Inventories |
|
|
1,746 |
|
|
|
6,162 |
|
|
|
218 |
|
|
|
720 |
|
|
Other operating assets |
|
|
(16,576 |
) |
|
|
3,791 |
|
|
|
(20,104 |
) |
|
|
(28,037 |
) |
|
Accounts payable and other operating liabilities |
|
|
(9,901 |
) |
|
|
16,781 |
|
|
|
46,948 |
|
|
|
46,456 |
|
|
Net cash provided by operating activities |
|
|
180,383 |
|
|
|
78,899 |
|
|
|
66,631 |
|
|
|
111,947 |
|
|
Cash flows from investing activities: |
|
|
|
|
|
|
|
|
|
|
|
|
|
|
|
|
|
Purchase of property and equipment |
|
|
(86,425 |
) |
|
|
(50,633 |
) |
|
|
(65,357 |
) |
|
|
(75,609 |
) |
|
Proceeds from sale of property and equipment |
|
|
11,984 |
|
|
|
6,336 |
|
|
|
5,252 |
|
|
|
5,964 |
|
|
Business acquisitions, net of cash acquired |
|
|
(104,377 |
) |
|
|
(53,822 |
) |
|
|
— |
|
|
|
— |
|
|
Other investing activities, net |
|
|
(452 |
) |
|
|
657 |
|
|
|
(1,834 |
) |
|
|
110 |
|
|
Net cash used in investing activities |
|
|
(179,270 |
) |
|
|
(97,462 |
) |
|
|
(61,939 |
) |
|
|
(69,535 |
) |
|
Cash flows from financing activities: |
|
|
|
|
|
|
|
|
|
|
|
|
|
|
|
|
|
Repayments of capital lease obligations |
|
|
(6,262 |
) |
|
|
(3,900 |
) |
|
|
(2,752 |
) |
|
|
(3,533 |
) |
|
Repayments of debt |
|
|
(1,662,625 |
) |
|
|
(181,617 |
) |
|
|
(11,700 |
) |
|
|
(14,600 |
) |
|
Proceeds from term loan, net of financing costs |
|
|
1,016,870 |
|
|
|
— |
|
|
|
— |
|
|
|
— |
|
|
Proceeds from receivables financing agreement |
|
|
115,000 |
|
|
|
150,000 |
|
|
|
— |
|
|
|
— |
|
|
Proceeds from revolving credit facility |
|
|
60,000 |
|
|
|
— |
|
|
|
— |
|
|
|
— |
|
|
Proceeds from issuance of common stock, net of share issuance costs |
|
|
501,271 |
|
|
|
125 |
|
|
|
1,916 |
|
|
|
1,916 |
|
|
Repurchase of common stock and distributions |
|
|
(2,922 |
) |
|
|
(1,229 |
) |
|
|
(28,456 |
) |
|
|
(30,229 |
) |
|
Net cash provided by (used in) financing activities |
|
|
21,332 |
|
|
|
(36,621 |
) |
|
|
(40,992 |
) |
|
|
(46,446 |
) |
|
Net change in cash and cash equivalents |
|
|
22,445 |
|
|
|
(55,184 |
) |
|
|
(36,300 |
) |
|
|
(4,034 |
) |
|
Cash and cash equivalents, beginning of period |
|
|
12,779 |
|
|
|
67,963 |
|
|
|
71,997 |
|
|
|
71,997 |
|
|
Cash and cash equivalents, end of period |
|
$ |
35,224 |
|
|
$ |
12,779 |
|
|
$ |
35,697 |
|
|
$ |
67,963 |
|
|
|
|
|
|
|
|
|
|
|
|
|
|
|
|
|
|
|
|
Supplemental Cash Flow Information: |
|
|
|
|
|
|
|
|
|
|
|
|
|
|
|
|
|
Cash paid for income taxes, net |
|
$ |
16,227 |
|
|
$ |
4,231 |
|
|
$ |
14,100 |
|
|
$ |
18,667 |
|
|
Cash paid for interest |
|
$ |
84,258 |
|
|
$ |
65,669 |
|
|
$ |
59,644 |
|
|
$ |
86,370 |
|
The accompanying notes are an integral part of these consolidated financial statements.
F-7
Notes to Consolidated Financial Statements
(In thousands, except per share amounts)
|
1. |
Business |
BrightView Holdings, Inc. (the “Company” and, collectively with its consolidated subsidiaries, “BrightView”) provides landscape maintenance and enhancements, landscape development, snow removal and other landscape related services for commercial customers throughout the United States. BrightView is aligned into two reportable segments: Maintenance Services and Development Services. Prior to its initial public offering completed in July 2018 (the “IPO”), the Company was a wholly-owned subsidiary of BrightView Parent L.P. (“Parent”), an affiliate of Kohlberg Kravis Roberts & Co., Inc. (“KKR”). The Parent and the Company were formed through a series of transactions entered into by KKR to acquire the Company on December 18, 2013 (the “KKR Acquisition”). The Parent was dissolved in August 2018 following the IPO.
On March 15, 2018, the Company changed its name from BrightView Acquisition Holdings, Inc. to BrightView Holdings, Inc.
Basis of Presentation
These consolidated financial statements have been prepared by the Company in accordance with accounting principles generally accepted in the United States of America (“GAAP”) and include the accounts of the Company and its wholly-owned subsidiaries which are directly or indirectly owned by the Company. Results of acquired companies are included in the consolidated financial statements from the effective date of the acquisition. All intercompany transactions and account balances have been eliminated.
Change of Fiscal Year End
On January 31, 2018, the Board of Directors approved the change of the Company’s fiscal year end from December 31 to September 30, beginning with September 30, 2017. The change more closely aligns the fiscal year end with the seasonal business cycle of the Company’s industry. As a result of this change, the accompanying Consolidated Financial Statements include the Company’s financial results for the nine month transition period beginning on January 1, 2017 through September 30, 2017. The Company has included unaudited financial results for the nine months ended September 30, 2016 herein for comparative purposes.
Use of Estimates
The preparation of financial statements in conformity with GAAP requires management to make estimates and assumptions that affect the reported amounts of assets and liabilities and disclosure of contingent assets and liabilities at the date of the financial statements and the reported amounts of revenues and expenses during the period. On an ongoing basis, management reviews its estimates, including those related to allowances for doubtful accounts, revenue recognition, self-insurance reserves, estimates related to the Company’s assessment of goodwill for impairment, useful lives for depreciation and amortization, realizability of deferred tax assets and litigation based on currently available information. Changes in facts and circumstances may result in revised estimates and actual results may differ from estimates.
Initial Public Offering
On July 2, 2018, the Company completed the IPO in which the Company issued and sold 24,495 shares of common stock. The shares sold in the offering were registered under the Securities Act of 1933, as amended, pursuant to the Company’s Registration Statement on Form S-1 (File No. 333-225277) (the “Registration Statement”), which was declared effective by the SEC on June 27, 2018. The shares of the Company’s common stock were sold at an initial offering price of $22.00 per share, which generated net proceeds of approximately $501,172 to the Company, after deducting underwriting discounts and estimated offering expenses of approximately $37,717. The Company used the net proceeds from the IPO to repay all $110,000 of the Company’s second lien term loans, all $55,000 then outstanding under the Company’s Revolving Credit Facility (as defined below) and approximately $336,100 of the Company’s first lien term loans and accrued and unpaid interest thereon. These repayments resulted in an extinguishment of debt in the amount of approximately $501,100, which was recognized in the fourth quarter of 2018. The Company incurred $6,805 of transaction related expenses during the year ended September 30, 2018, which are included in Selling, general and administrative expense in the accompanying Consolidated Statements of Operations, of which $5,384 was paid from the net proceeds generated by the IPO.
BrightView was party to a Monitoring Agreement, dated as of December 18, 2013 (the “Monitoring Agreement”), with KKR and MSD Partners (“MSD Partners” and together with KKR, the “Sponsors”), which was terminated on July 2, 2018 in accordance with its terms upon the completion of the IPO. Affiliates of KKR and MSD Partners retained 55.9% and 13.0% ownership interest, respectively, in the Company after the IPO.
F-8
The Company’s Third Amended and Restated Certificate of Incorporation (the “Charter”) became effective in connection with the completion of the IPO on July 2, 2018. The Charter, among other things, provides that the Company’s authorized capital stock consists of 500,000 shares of common stock, and 50,000 shares of preferred stock, par value $0.01 per share. The Company’s bylaws were also amended and restated as of July 2, 2018.
After the completion of the IPO and as of September 30, 2018, affiliates of the Sponsors continue to control a majority of the voting power of the Company’s common stock. As a result, the Company is considered a “controlled company” within the meaning of the corporate governance standards of the New York Stock Exchange (“NYSE”).
Reverse Stock Split
In connection with preparing for the IPO, the Company’s Board of Directors approved a 2.33839-for-one reverse stock split of the Company’s common stock. The reverse stock split became effective June 8, 2018. All common share and per share amounts in the consolidated financial statements and notes have been retrospectively adjusted to give effect to the reverse stock split, including reclassifying an amount equal to the reduction in aggregate par value of “Common stock” to “Additional paid-in-capital” on the consolidated balance sheets.
|
2. |
Summary of Significant Accounting Policies |
Cash and Cash Equivalents
Cash and cash equivalents include deposits in banks and money market funds with maturities of less than three months at the time of deposit or investment.
Accounts Receivable
Trade accounts receivables are recorded at the invoiced amount and do not bear interest. The Company reserves for all accounts that are deemed to be uncollectible and reviews its allowance for doubtful accounts regularly. The allowance is based on the age of receivables and a specific identification of receivables considered at risk (see Note 4 “Accounts Receivable”).
Accounts receivable also includes customer balances that have been billed or are billable to the Company’s customers but will not be collected until completion of the project or as otherwise specified in the contract. These amounts generally represent 5-10% of the total contract value.
Inventories
Inventories consist primarily of trees, landscape and irrigation materials and snow removal products. The cost elements of tree inventories include physical plants, related planting materials, and labor costs. Inventories are valued at the lower of cost (first in, first out) or net realizable value. When market values are below the Company’s costs, the Company records an expense to increase Cost of services provided.
Property and Equipment
Property and equipment is carried at cost, including the cost of internal labor for software for internal use, less accumulated depreciation, except for those assets acquired through a business combination, in which case they have been stated at estimated fair value as of the date of the business combination, less accumulated depreciation. Costs of replacements or maintenance and repairs that do not improve or extend the life of the related assets are expensed as incurred. Depreciation is computed using the straight-line method over the estimated useful lives of the assets and included in Cost of services provided or Selling, general and administrative expense as appropriate.
Goodwill and Other Intangible Assets
Goodwill represents the excess of purchase price over the fair values underlying net assets acquired in an acquisition. Goodwill is not amortized, but rather is tested annually for impairment or more frequently if events or changes in circumstances indicate that the carrying amount of the asset may not be recoverable. The Company tests goodwill for impairment annually in the fourth quarter of each year using data as of July 1 of that year.
Goodwill is allocated to, and evaluated for impairment at, the Company’s four identified reporting units. Goodwill is tested for impairment by either performing a qualitative evaluation or a quantitative test. The qualitative evaluation is an assessment of factors to determine whether it is more likely than not that a reporting unit’s fair value is less than its carrying amount. The Company may elect not to perform the qualitative assessment for some or all reporting units and perform the quantitative impairment test. The quantitative goodwill impairment test requires the Company to compare the carrying value of the reporting unit’s net assets to the
F-9
estimated fair value of the reporting unit. The Company determined the estimated fair values of each of the reporting units using a combination of the income and market multiple approaches which are weighted 75% and 25%, respectively. The estimates used in each approach include significant management assumptions, including long-term future growth rates, operating margins and future economic and market conditions.
If the estimated fair value exceeds the carrying value, no further evaluation is required, and no impairment loss is recognized. If the carrying amount of a reporting unit, including goodwill, exceeds the estimated fair value, the excess of the carrying value over the estimated fair value is recorded as an impairment loss, the amount of which is not to exceed the total amount of goodwill allocated to the reporting unit.
Definite-lived intangible assets consist principally of acquired customer contracts and relationships, non-compete agreements and trademarks. Acquired customer relationships are amortized in an accelerated pattern consistent with expected future cash flows. Non-compete agreements and trademarks are amortized straight-line over their estimated useful lives.
Impairment of Long-lived Assets
Property and equipment and definite-lived intangible assets are reviewed for impairment whenever events or changes in circumstances indicate that the carrying amount of an asset may not be recoverable. Recoverability of assets to be held and used is measured by a comparison of the carrying amount of an asset to estimated undiscounted future cash flows expected to be generated by the asset. If the carrying amount of an asset exceeds its estimated future cash flows, an impairment charge is recognized for the amount by which the carrying amount of the asset exceeds the fair value.
Financing Costs
Financing costs, consisting of fees and other expenses associated with borrowings, are amortized over the terms of the related borrowings using the effective interest rate method (see Note 9 “Long-term Debt”). Financing costs are presented in the Consolidated Balance Sheets as a direct reduction from the carrying amount of the related borrowings.
Self-Insurance Reserves
The Company carries general liability, vehicle liability, workers’ compensation, professional liability, directors’ and officers’ liability, cyber security and employee health care insurance policies. In addition, the Company carries umbrella liability insurance policies to cover claims over the liability limits contained in the primary policies. The Company’s insurance programs for general liability, vehicle liability, workers’ compensation and employee health care for certain employees contain self-insured retention amounts. Claims that are not self-insured as well as claims in excess of the self-insured retention amounts are insured. The Company uses estimates in the determination of the required reserves. These estimates are based upon calculations performed by third-party actuaries, as well as examination of historical trends, demographic factors and industry claims experience. A receivable for an insurance recovery is generally recognized when the loss has occurred and collection is considered probable (see Note 15 “Commitments and Contingencies”).
Fair value of Financial Instruments
In evaluating the fair value of financial assets and liabilities, GAAP outlines a valuation framework and creates a fair value hierarchy that distinguishes between market assumptions based on market data (“observable inputs”) and a reporting entity’s own assumptions about market data (“unobservable inputs”). Fair value is defined as the price at which an orderly transaction to sell an asset or transfer a liability would take place between market participants at the measurement date under current market conditions (that is, an exit price at the measurement date from the perspective of a market participant that holds the asset or owes the liability).
Fair Value Hierarchy
The following hierarchy for inputs used in measuring fair value should maximize the use of observable inputs and minimize the use of unobservable inputs by requiring that the most observable inputs be used when available:
|
Level 1 |
Quoted prices in active markets for identical assets or liabilities that are accessible at the measurement dates. |
|
Level 2 |
Significant observable inputs that are used by market participants in pricing the asset or liability based on market data obtained from independent sources. |
|
Level 3 |
Significant unobservable inputs the Company believes market participants would use in pricing the asset or liability based on the best information available. |
The carrying amounts shown for the Company’s cash and cash equivalents, accounts receivable and accounts payable approximate fair value due to the short-term maturity of those instruments. The valuation is based on settlements of similar financial
F-10
instruments, all of which are short-term in nature and are generally settled at or near cost. See Note 9 “Long-term Debt” and Note 10 “Financial Instruments Measured at Fair Value” for other financial instruments subject to fair value estimates.
Derivative Instruments and Hedging Activities
The Company’s objective in entering into derivative transactions is to manage its exposure to interest rate movements associated with its variable rate debt and changes in fuel prices. The Company recognizes derivatives as either assets or liabilities on the balance sheet and measures those instruments at fair value. Since all of the Company’s derivatives are designated as cash flow hedges, the effective portion of the changes in the fair value of the derivative is initially reported in Other comprehensive income (loss) and subsequently reclassified to Interest expense (interest rate contracts) and Cost of services provided (fuel hedge contracts) in the accompanying Consolidated Statements of Operations when the hedge transaction affects earnings. The ineffective portion of changes in the fair value of the derivative is recognized directly to Interest expense and Cost of services provided immediately. See Note 10 “Financial Instruments Measured at Fair Value” for more information.
Revenue Recognition
The Company recognizes revenues when persuasive evidence of an arrangement exists, services have been rendered, the fee is fixed or determinable and the collectability of the related revenue is reasonably assured. The Company’s revenue is generated from maintenance services and development services. The Company generally recognizes revenue from the sale of services as the services are performed, which is usually ratably over the term of the contract(s). Invoiced amounts are recorded as deferred revenue until earned.
For Maintenance Services, revenue is recognized based upon the service provided and the contract terms and is reported net of discounts and applicable sales taxes. The Company generally records revenue in proportion to the performance of related services during a given month compared to the estimate of activities to be performed as these services are provided under a fixed fee. For some maintenance services contracts, the Company recognizes revenue based on when services are performed under a time and materials or other activity-based contracts.
For Development Services, revenue is recognized using the percentage-of-completion method, measured by the percentage of cost incurred to date to the estimated total cost for each contract. The full amount of anticipated losses on contracts is recorded as soon as such losses can be estimated. Changes in job performance, job conditions, and estimated profitability, including final contract settlements, may result in revisions to costs and revenue and are recognized in the period in which the revisions are determined. Unbilled revenue and Deferred revenue result from differences between the timing of billings and the recognition of service revenues.
Cost of Services Provided
Cost of services provided represents the cost of labor, subcontractors, materials, vehicle and equipment costs (including depreciation, fuel and maintenance) and other costs directly associated with revenue generating activities. These costs are expensed as incurred.
Leases
The Company leases office space, branch locations, vehicles, and operating equipment. Lease agreements are evaluated to determine whether they are capital or operating leases. When substantially all of the risks and benefits of property ownership have been transferred to the Company, the lease then qualifies as a capital lease.
Capital leases are capitalized at the lower of net present value of the total amount of rent payable under the leasing agreement (utilizing the implicit borrowing rate of the Company, as applicable) or the fair market value of the leased asset. Capital lease assets are depreciated on a straight-line basis, over a period consistent with the Company’s normal depreciation policy for property and equipment, but not exceeding the lease term. Interest charges are expensed over the period of the lease in relation to the carrying value of the capital lease obligation.
Equity-based Compensation
The Company’s equity-based compensation prior to the IPO consisted of awards of Profits Interest Units (“B Units”) by the Parent to employees of the Company (see Note 14 “Equity-Based Compensation”). Subsequent to the IPO, the Company’s equity-based compensation consists of stock options and restricted stock awards. The Company expenses equity-based compensation using the estimated fair value as of the grant date over the requisite service or performance period applicable to the grant. Estimates of future forfeitures are made at the date of grant and revised, if necessary, in subsequent periods if actual forfeitures differ from those estimates.
F-11
Deferred tax assets and liabilities are determined based on differences between financial reporting and tax basis of assets and liabilities, and are measured by applying enacted tax rates and laws for the taxable years in which those differences are expected to reverse. Deferred tax assets are evaluated for the estimated future tax effects of deductible temporary differences and tax operating loss carryovers. A valuation allowance is recorded when it is more likely than not that a deferred tax asset will not be realized.
The Company records a liability for unrecognized tax benefits resulting from uncertain tax positions taken or expected to be taken in a tax return. Such tax positions are, based solely on their technical merits, more likely than not to be sustained upon examination by taxing authorities and reflect the largest amount of benefit, determined on a cumulative probability basis that is more likely than not to be realized upon settlement with the applicable taxing authority with full knowledge of all relevant information. The Company recognizes interest and penalties, if any, related to unrecognized tax benefits in Income tax benefit.
|
3. |
Recent Accounting Pronouncements |
Income Taxes
In February 2018, the Financial Accounting Standards Board (“FASB”) issued Accounting Standards Update (“ASU”) No. 2018-02, Income Statement — Reporting Comprehensive Income (Topic 220): Reclassification of Certain Tax Effects from Accumulated Other Comprehensive Income. This guidance provides the option to reclassify the stranded tax effects caused by the newly enacted US Tax Cuts and Jobs Act (“2017 Tax Act”) from accumulated other comprehensive income to retained earnings. The Company early adopted this guidance in the first quarter of fiscal 2018, which impacted the Company’s consolidated statements of changes in stockholders’ equity by decreasing Accumulated Deficit and increasing Accumulated Other Comprehensive Loss by $3,466.
Revenue Recognition
In May 2014, the FASB issued ASU No. 2014-09, Revenue from Contracts with Customers, which was further updated in March and April 2016. The updated accounting guidance clarifies the principles for recognizing revenue and provides a single, contract-based revenue recognition model in order to create greater comparability for financial statement users across industries and jurisdictions. The core principle of the revenue model is that an entity recognizes revenue to depict the transfer of promised goods or services to clients in an amount that reflects the consideration to which the entity expects to be entitled in exchange for those goods or services. The Company will adopt the guidance in the first quarter of fiscal 2019 and will use the modified retrospective approach transition method to all contracts as of the date of initial application. The cumulative adoption impact is not material. The Company continues to assess the disclosure requirements and controls.
Intra-Entity Transfers of Assets Other Than Inventory
In October 2016, the FASB issued ASU No. 2016-16, Income Taxes (Topic 740): Intra-Entity Transfers of Assets Other Than Inventory. This guidance requires that an entity recognizes the income tax consequences of an intra- entity transfer of an asset other than inventory when the transfer occurs. The Company will adopt the guidance in the first quarter of fiscal 2019. The Company currently does not expect the adoption of ASU 2016-16 to have a material impact on its consolidated financial statements.
Hedging Activities
In August 2017, the FASB issued ASU No. 2017-12, Targeted Improvements to Accounting for Hedging Activities which amends and simplifies existing guidance to allow companies to more accurately present the economic effects of risk management activities in the financial statements. The amendments in this ASU are effective for fiscal years beginning after December 15, 2018, and interim periods within those fiscal years. Early adoption is permitted. For cash flow and net investment hedges as of the adoption date, the guidance requires a modified retrospective approach. The amended presentation and disclosure guidance is required only prospectively. The Company will adopt the guidance in the first quarter of fiscal 2019. The Company currently does not expect the adoption of ASU 2017-12 to have a material impact on its consolidated financial statements.
Leases
In February 2016, the FASB issued ASU No. 2016-02, Leases. The updated accounting guidance requires lessees to recognize all leases on their balance sheet as a right-of-use asset and a lease liability with the exception of short-term leases. For income statement purposes, the criteria for recognition, measurement and presentation of expense is largely similar to previous guidance, but without the requirement to use bright-line tests in the determination of lease classification. The updated accounting guidance for a lessor is largely unchanged from previous guidance but has been updated to align with certain changes to the lessee model and the new revenue recognition standard. The updated accounting guidance is effective for the Company as of October 1, 2019 and early adoption is permitted. In July 2018, the FASB issued ASU No. 2018-11, Leases: Targeted Improvements, which
F-12
allows entities the option to adopt this standard prospectively with a cumulative-effect adjustment to opening equity and include required disclosures for prior period. The Company is currently evaluating the impact the updated accounting guidance will have on its consolidated financial statements and anticipates adopting the standard prospectively, in accordance with ASU No. 2018-11.
Fair Value Measurement
In August 2018, the FASB issued ASU No. 2018-13, Fair Value Measurement (Topic 820): Disclosure Framework – Changes to the Disclosure Requirements for Fair Value Measurement which modifies the disclosures on fair value measurements by removing the requirement to disclose the amount and reason for transfers between Level 1 and Level 2 of the fair value hierarchy and the policy for timing of such transfers. The ASU expands the disclosure requirements for Level 3 fair value measurements, primarily focused on changes in unrealized gains and losses included in other comprehensive income. For public entities, the standard is effective for fiscal years, and interim periods within those fiscal years, beginning after December 15, 2019. Early adoption is permitted for any removed or modified disclosures and adoption of the additional disclosures can be delayed until the effective date. The Company does not currently expect the adoption of ASU 2018-13 to have a material impact on its consolidated financial statements.
|
4. |
Accounts Receivable |
Accounts receivable of $317,056 and $330,173, is net of an allowance for doubtful accounts of $5,629 and $8,350 and includes amounts of retention on incomplete projects to be completed within one year of $40,215 and $39,678 at September 30, 2018 and September 30, 2017, respectively.
|
5. |
Inventories |
Inventories consist of the following:
|
|
|
September 30, 2018 |
|
|
September 30, 2017 |
|
||
|
Finished products |
|
$ |
6,913 |
|
|
$ |
8,121 |
|
|
Semi-finished products |
|
|
8,580 |
|
|
|
7,171 |
|
|
Raw materials and supplies |
|
|
8,337 |
|
|
|
9,662 |
|
|
Inventories |
|
$ |
23,830 |
|
|
$ |
24,954 |
|
|
6. |
Property and Equipment |
Property and equipment, net consists of the following:
|
|
|
Useful Life |
|
|
September 30, 2018 |
|
|
September 30, 2017 |
|
|||
|
Land |
|
|
— |
|
|
$ |
51,490 |
|
|
$ |
37,225 |
|
|
Buildings and leasehold improvements |
|
2-40 yrs. |
|
|
|
36,275 |
|
|
|
27,652 |
|
|
|
Operating equipment |
|
2-7 yrs. |
|
|
|
186,499 |
|
|
|
182,720 |
|
|
|
Transportation vehicles |
|
3-7 yrs. |
|
|
|
208,371 |
|
|
|
174,434 |
|
|
|
Office equipment and software |
|
3-10 yrs. |
|
|
|
57,976 |
|
|
|
47,042 |
|
|
|
Construction in progress |
|
|
— |
|
|
|
4,202 |
|
|
|
4,639 |
|
|
Property and equipment |
|
|
|
|
|
|
544,813 |
|
|
|
473,712 |
|
|
Less: Accumulated depreciation |
|
|
|
|
|
|
288,007 |
|
|
|
228,178 |
|
|
Property and equipment, net |
|
|
|
|
|
$ |
256,806 |
|
|
$ |
245,534 |
|
Construction in progress includes costs incurred for software and other assets that have not yet been placed in service. Depreciation expense related to property and equipment was $75,296, $56,473 and $79,255 for the year ended September 30, 2018, the nine months ended September 30, 2017 and the year ended December 31, 2016, respectively.
Included in accumulated depreciation shown above are amounts related to property and equipment under capital leases of $22,244 and $18,200 at September 30, 2018 and September 30, 2017, respectively.
F-13
Intangible assets as of September 30, 2018 and September 30, 2017 consist of the following:
|
|
|
|
|
September 30, 2018 |
|
|
September 30, 2017 |
|
||||||||||
|
|
|
Useful Life |
|
Gross Carrying Amount |
|
|
Accumulated Amortization |
|
|
Gross Carrying Amount |
|
|
Accumulated Amortization |
|
||||
|
Customer relationships |
|
6-21 yrs. |
|
$ |
622,710 |
|
|
$ |
(337,800 |
) |
|
$ |
600,515 |
|
|
$ |
(275,993 |
) |
|
Trademarks |
|
4-12 yrs. |
|
|
230,900 |
|
|
|
(227,520 |
) |
|
|
230,900 |
|
|
|
(184,151 |
) |
|
Non-compete agreements |
|
5 yrs. |
|
|
2,320 |
|
|
|
(155 |
) |
|
|
— |
|
|
|
— |
|
|
Total intangible assets |
|
|
|
$ |
855,930 |
|
|
$ |
(565,475 |
) |
|
$ |
831,415 |
|
|
$ |
(460,144 |
) |
Amortization expense related to intangible assets was $104,943, $92,863 and $131,562 for the year ended September 30, 2018, the nine months ended September 30, 2017 and the year ended December 31, 2016, respectively.
The following table shows changes in the carrying amount of goodwill from January 1, 2017 to September 30, 2018 by reportable segment:
|
|
|
Maintenance Services |
|
|
Development Services |
|
|
Total |
|
|||
|
Balance, January 1, 2017 |
|
$ |
1,486,640 |
|
|
$ |
180,474 |
|
|
$ |
1,667,114 |
|
|
Acquisitions |
|
|
36,659 |
|
|
|
— |
|
|
|
36,659 |
|
|
Balance, September 30, 2017 |
|
|
1,523,299 |
|
|
|
180,474 |
|
|
|
1,703,773 |
|
|
Acquisitions |
|
|
49,064 |
|
|
|
13,924 |
|
|
|
62,988 |
|
|
Balance, September 30, 2018 |
|
$ |
1,572,363 |
|
|
$ |
194,398 |
|
|
$ |
1,766,761 |
|
The weighted average amortization period for intangible assets is 14.7 years. Amortization expense is anticipated to be as follows in future years:
|
Year Ended September 30, |
|
|||
|
2019 |
|
$ |
55,580 |
|
|
2020 |
|
|
47,551 |
|
|
2021 |
|
|
39,723 |
|
|
2022 |
|
|
32,691 |
|
|
2023 |
|
|
26,505 |
|
|
2024 and thereafter |
|
|
87,405 |
|
|
|
|
$ |
289,455 |
|
During the year ended September 30, 2018, the Company acquired, through a series of separate transactions, 100% of the operations of five unrelated Maintenance Services companies. The Company paid approximately $104,377 in consideration for the acquisitions, net of cash acquired. The Company accounted for the business combinations under the acquisition method and, accordingly, recorded the assets acquired and liabilities assumed at their estimated fair market values based on management’s preliminary estimates, with the excess allocated to goodwill. The fair values were primarily estimated using Level 3 assumptions within the fair value hierarchy, including estimated future cash flows, discount rates and other factors. The valuation process to determine fair values is not yet complete. The Company will finalize the amounts recognized as it obtains the information necessary to complete the analysis, but no later than one year from the acquisition date. The identifiable assets acquired were primarily intangible assets, including customer relationships and non-compete agreements of $24,515. The amount allocated to goodwill is reflective of the benefits the Company expects to realize from anticipated synergies and the acquired assembled workforce. The Company expects a portion of the goodwill resulting from these acquisitions will be deductible for tax purposes.
F-14
Accrued expenses and other current liabilities consist of the following as of:
|
|
|
September 30, 2018 |
|
|
September 30, 2017 |
|
||
|
Payroll related accruals |
|
$ |
47,442 |
|
|
$ |
49,573 |
|
|
Accrued operating expenses |
|
|
46,521 |
|
|
|
63,590 |
|
|
Other accruals |
|
|
23,928 |
|
|
|
23,953 |
|
|
Accrued expenses and other current liabilities |
|
$ |
117,891 |
|
|
$ |
137,116 |
|
|
9. |
Long-term Debt |
Long-term debt consists of the following:
|
|
|
September 30, 2018 |
|
|
September 30, 2017 |
|
||
|
Series B term loan, net of original issue discount of $2,712 at September 30, 2018 (excluding the effect of the hedges) |
|
$ |
1,034,288 |
|
|
$ |
— |
|
|
First Lien term loans, net of original issue discount of $1,777 at September 30, 2017 (excluding the effect of the hedges) |
|
|
— |
|
|
|
1,382,098 |
|
|
Second Lien term loan, net of original issue discount of $706 at September 30, 2017 (excluding the effect of the hedges) |
|
|
— |
|
|
|
109,294 |
|
|
Receivables financing agreement |
|
|
140,000 |
|
|
|
133,750 |
|
|
Financing costs, net |
|
|
(20,046 |
) |
|
|
(35,660 |
) |
|
Total debt, net |
|
|
1,154,242 |
|
|
|
1,589,482 |
|
|
Less: Current portion of long-term debt |
|
|
12,963 |
|
|
|
14,600 |
|
|
Long-term debt, net |
|
$ |
1,141,279 |
|
|
$ |
1,574,882 |
|
First Lien credit facility term loans due 2020 and Series B Term Loan due 2025
In connection with the KKR Acquisition, the Company and a group of financial institutions entered into a credit agreement (the “Credit Agreement”) dated December 18, 2013. The Credit Agreement consisted of seven-year $1,460,000 term loans (“First Lien Term Loans”) and a five-year $210,000 revolving credit facility. An original discount of $3,675 was incurred when the First Lien Term Loans were issued and was amortized using the effective interest method over the life of the debt, resulting in an effective yield of 4.0%. All amounts outstanding under the First Lien Term Loans were collateralized by substantially all of the assets of the Company. Debt repayments for First Lien Term Loans totaled $347,050 for the year ended September 30, 2018 and consisted of $10,950 in contractual repayments per the Credit Agreement and $336,100 in voluntary repayments in connection with the IPO. As a result of the repayment of the First Lien Term Loans, the Company recorded a loss on debt extinguishment of $19,321 due to accelerated amortization of deferred financing fees and original issue discount included in the “Other (expense) income” line of the Consolidated Statements of Operations.
On August 15, 2018, the Company entered into Amendment No. 5 to the Credit Agreement (the “Amended Credit Agreement”), which amends the Credit Agreement. Under the terms of the Amended Credit Agreement, the Credit Agreement was amended to provide for: (i) a $1,037,000 seven-year term loan (the “Series B Term Loan”) and (ii) a $260,000 five-year revolving credit facility. The Series B Term Loan matures on August 15, 2025 and bears interest at a rate per annum of LIBOR, plus 2.5%. The Company used the net proceeds from the Series B Term Loan to repay all amounts outstanding under the Company’s First Lien Term Loans. An original discount of $2,775 was incurred when the Series B Term Loan was issued and is being amortized using the effective interest method over the life of the debt, resulting in an effective yield of 2.5%.
In addition to scheduled payments, the Company is obligated to pay a percentage of excess cash flow, as defined in the Amended Credit Agreement, as accelerated principal payments. The percentage varies with the ratio of the Company’s debt to its cash flow. The excess cash flow calculation did not result in any accelerated payment due for the periods ended September 30, 2018, September 30, 2017, and December 31, 2016.
The Amended Credit Agreement restricts the Company’s ability to, among other things, incur additional indebtedness, create liens, enter into acquisitions, dispose of assets, enter into consolidations and mergers and make distributions to its Parent without the approval of the lenders. In certain circumstances, under the Amended Credit Agreement, the Company is prohibited from making certain restricted payments, including dividends or distributions to its shareholders, subject to certain exceptions set forth in that
F-15
agreement (including an exception for the making of such restricted payments up to an agreed limit, which limit is determined by a formula that takes into account consolidated net income, net cash proceeds and other amounts, in each case as described in greater detail in that agreement). The Amended Credit Agreement imposes financial covenants upon the Company with respect to leverage and interest coverage under certain circumstances. The Amended Credit Agreement contains provisions permitting the bank to accelerate the repayment of the outstanding debt under this agreement upon the occurrence of an Event of Default, as defined in the Amended Credit Agreement, including a material adverse change in the financial condition of the Company since the date of issuance of the Amended Credit Agreement.
The interest rate on the First Lien Term Loans was initially set at 3.0% over the prime rate of interest or is established for periods of up to six months at 3.0% over LIBOR at the Company’s option with a LIBOR floor of 1.0% (the “LIBOR floor”). The weighted average interest rate on the First Lien Term Loans was 4.7%, 4.1% and 4.0% for the year ended September 30, 2018, the nine months ended September 30, 2017 and the year ended December 31, 2016, respectively. The weighted average interest rate on the Series B Term Loan was 4.6% for the year ended September 30, 2018. The Amended Credit Agreement debt repayments are due in quarterly installments of 0.25% of the principal balance less payments made under the aforementioned excess cash flow provision.
Revolving credit facility
The Company has a five-year $260,000 revolving credit facility (the “Revolving Credit Facility”) that matures on August 15, 2023 and bears interest at a rate per annum of LIBOR plus a margin ranging from 2.50% to 2.00%, with the margin determined based on the Company’s first lien net leverage ratio. The Revolving Credit Facility replaces the previous $210,000 revolving credit facility under the Credit Agreement. The Company had no outstanding balance under either facility as of September 30, 2018 and September 30, 2017. There is a quarterly commitment fee equal to either 1⁄2 of 1% or 3/8 of 1% of the unused balance of the Revolving Credit Facility depending on the Company’s leverage ratio. The Company had $77,301 and $76,006 of letters of credits issued and outstanding as of September 30, 2018 and September 30, 2017, respectively. The interest rates on the Revolving Credit Facility and previous revolving credit facility were 2.5%, 3.0% and 3.0% for the year ended September 30, 2018, the nine months ended September 30, 2017 and the year ended December 31, 2016, respectively.
In May 2018, the Company borrowed $55,000 against the previous revolving credit facility and in July 2018 this was fully repaid with the IPO proceeds. In July 2018, the Company borrowed an additional $5,000 against the previous revolving credit facility and this was repaid in August 2018.
Second Lien credit facility term loan due 2021
In connection with the KKR Acquisition, the Company and a group of financial institutions entered into a credit agreement (the “Second Lien Credit Agreement”) dated December 18, 2013. The Second Lien Credit Agreement consisted of an eight-year $235,000 term loan (“Second Lien Term Loan”). An original discount of $1,175 was incurred when the notes were issued and was amortized using the effective interest method over the life of the debt resulting in an effective yield of 7.5%. All amounts outstanding under the Second Lien Credit Agreement were collateralized by substantially all of the assets of the Company. During May 2017, the Company made a voluntary repayment of $125,000 for amounts outstanding for the Second Lien Term Loan. The Second Lien Credit Agreement contained a cross-default provision related to the First Lien Credit Agreement. In certain circumstances, under the Second Lien Credit Agreement, the Company is prohibited from making certain restricted payments, including dividends or distributions to its shareholders, subject to certain exceptions set forth in that agreement (including an exception for the making of such restricted payments up to an agreed limit, which limit is determined by a formula that takes into account consolidated net income, net cash proceeds and other amounts, in each case as described in greater detail in that agreement).
The interest rate on the Second Lien Term Loan was initially set at 5.5% over the prime rate of interest, with a 2.0% floor, or is established for periods of up to six months at 6.5% over LIBOR at the Company’s option with a LIBOR floor of 1.0%. The weighted average interest rate on the Second Lien Term Loan was 8.1%, 7.6% and 7.5% for the year ended September 30, 2018, the nine months ended September 30, 2017 and the year ended December 31, 2016.
During July 2018, in connection with the Company’s IPO, the Second Lien Term Loan was fully repaid and extinguished resulting in the Company recording a loss on debt extinguishment of $5,788 due to accelerated amortization of deferred financing fees and original issue discount included in the “Other (expense) income” line of the Consolidated Statements of Operations.
Receivables financing agreement
On April 28, 2017, the Company, through a wholly-owned subsidiary, entered into a receivables financing agreement (the “Receivables Financing Agreement”). The Receivables Financing Agreement provides a borrowing capacity of $175,000 through April 27, 2020. All amounts outstanding under the Receivables Financing Agreement are collateralized by substantially all of the
F-16
Accounts receivables and Unbilled revenue of the Company. During the year ended September 30, 2018, the Company made voluntary repayments of $108,750 and borrowed $115,000 for amounts outstanding under the Receivables Financing Agreement.
The interest rate on the amounts borrowed under the Receivables Financing Agreement is established for periods of up to six months at 2.0% over LIBOR at the Company’s option, and a commitment fee equal to 0.5% of the unused balance of the facility. The weighted average interest rate on the amounts borrowed under the Receivables Financing Agreement was 2.3% and 3.7% for the year ended September 30, 2018 and the nine months ended September 30, 2017.
The following are the scheduled maturities of long term debt, which do not include any estimated excess cash flow payments:
|
|
|
September 30, |
|
|
|
2019 |
|
$ |
12,963 |
|
|
2020 |
|
|
10,370 |
|
|
2021 |
|
|
10,370 |
|
|
2022 |
|
|
10,370 |
|
|
2023 and thereafter |
|
|
1,132,927 |
|
|
Total long term debt |
|
$ |
1,177,000 |
|
|
Less: Current maturities |
|
|
12,963 |
|
|
Less: Original issue discount |
|
|
2,712 |
|
|
Less: Financing costs |
|
|
20,046 |
|
|
Total long term debt, net |
|
$ |
1,141,279 |
|
The Company has estimated the fair value of its long-term debt to be approximately $1,182,152 and $1,633,802 as of September 30, 2018 and September 30, 2017, respectively. Fair value is based on market bid prices around period-end (Level 2 inputs).
|
10. |
Financial Instruments Measured at Fair Value |
The following table summarizes the financial assets and liabilities measured at fair value on a recurring basis as of September 30, 2018 and September 30, 2017:
|
|
|
September 30, 2018 |
|
|||||||||||||
|
|
|
Carrying Value |
|
|
Level 1 |
|
|
Level 2 |
|
|
Level 3 |
|
||||
|
Other assets: |
|
|
|
|
|
|
|
|
|
|
|
|
|
|
|
|
|
Investments held by Rabbi Trust |
|
$ |
12,517 |
|
|
$ |
12,517 |
|
|
$ |
— |
|
|
$ |
— |
|
|
Total Assets |
|
$ |
12,517 |
|
|
$ |
12,517 |
|
|
$ |
— |
|
|
$ |
— |
|
|
Accrued expenses and other current liabilities: |
|
|
|
|
|
|
|
|
|
|
|
|
|
|
|
|
|
Interest rate swap contracts |
|
$ |
3,441 |
|
|
$ |
— |
|
|
$ |
3,441 |
|
|
$ |
— |
|
|
Other liabilities: |
|
|
|
|
|
|
|
|
|
|
|
|
|
|
|
|
|
Interest rate swap contracts |
|
|
12,098 |
|
|
|
— |
|
|
|
12,098 |
|
|
|
— |
|
|
Obligation to Rabbi Trust |
|
|
12,517 |
|
|
|
12,517 |
|
|
|
— |
|
|
|
— |
|
|
Total Liabilities |
|
$ |
28,056 |
|
|
$ |
12,517 |
|
|
$ |
15,539 |
|
|
$ |
— |
|
|
|
|
September 30, 2017 |
|
|||||||||||||
|
|
|
Carrying Value |
|
|
Level 1 |
|
|
Level 2 |
|
|
Level 3 |
|
||||
|
Other assets: |
|
|
|
|
|
|
|
|
|
|
|
|
|
|
|
|
|
Investments held by Rabbi Trust |
|
$ |
11,004 |
|
|
$ |
11,004 |
|
|
$ |
— |
|
|
$ |
— |
|
|
Total Assets |
|
$ |
11,004 |
|
|
$ |
11,004 |
|
|
$ |
— |
|
|
$ |
— |
|
|
Accrued expenses and other current liabilities: |
|
|
|
|
|
|
|
|
|
|
|
|
|
|
|
|
|
Interest rate swap contracts |
|
$ |
4,621 |
|
|
$ |
— |
|
|
$ |
4,621 |
|
|
$ |
— |
|
|
Fuel hedge contracts |
|
|
50 |
|
|
|
— |
|
|
|
50 |
|
|
|
— |
|
|
Other liabilities: |
|
|
|
|
|
|
|
|
|
|
|
|
|
|
|
|
|
Interest rate swap contracts |
|
|
30,518 |
|
|
|
— |
|
|
|
30,518 |
|
|
|
— |
|
|
Obligation to Rabbi Trust |
|
|
11,004 |
|
|
|
11,004 |
|
|
|
— |
|
|
|
— |
|
|
Total Liabilities |
|
$ |
46,193 |
|
|
$ |
11,004 |
|
|
$ |
35,189 |
|
|
$ |
— |
|
F-17
Investments held by Rabbi Trust
A non-qualified deferred compensation plan is available to certain executives. Under this plan, participants may elect to defer up to 70% of their compensation. The Company invests the deferrals in participant-selected diversified investments that are held in a Rabbi Trust and which are classified within Other assets on the Consolidated Balance Sheets. The fair value of the investments held in the Rabbi Trust is based on the quoted market prices of the underlying mutual fund investments. These investments are based on the participants’ selected investments, which represent the underlying liabilities to the participants in the non-qualified deferred compensation plan.
Derivatives
The Company’s objective in entering into derivative transactions is to manage its exposure to interest rate movements associated with its variable rate debt and changes in fuel prices. The Company recognizes derivatives as either assets or liabilities on the balance sheet and measures those instruments at fair value. The fair values of the derivative financial instruments are determined using widely accepted valuation techniques including discounted cash flow analysis based on the expected cash flows of each derivative. Although the Company has determined that the significant inputs, such as interest yield curve and discount rate, used to value its derivatives fall within Level 2 of the fair value hierarchy, the credit valuation adjustments associated with the Company’s counterparties and its own credit risk utilize Level 3 inputs, such as estimates of current credit spreads to evaluate the likelihood of default by itself and its counterparties. However, as of September 30, 2018 and September 30, 2017, the Company has assessed the significance of the impact of the credit valuation adjustments on the overall valuation of its derivative positions and has determined that the credit valuation adjustments were not significant to the overall valuation of its derivatives. As a result, the Company has determined that its derivative valuations in their entirety are classified in Level 2 of the fair value hierarchy.
Hedging Activities
As of September 30, 2018 and September 30, 2017, the Company’s outstanding derivatives qualify as cash flow hedges. The Company assesses whether derivatives used in hedging transactions are “highly effective” in offsetting changes in the cash flow of the hedged forecasted transactions. Regression analysis is used for the hedge relationships and high effectiveness is achieved when a statistically valid relationship reflects a high degree of offset and correlation between the fair values of the derivative and the hedged forecasted transaction. The effective portion of the changes in the fair value of the derivative is initially reported in Other comprehensive income (loss) and subsequently reclassified to Interest expense (interest rate contracts) and Cost of services provided (fuel hedge contracts) in the Consolidated Statements of Operations when the hedged item affects earnings. The ineffective portion of changes in the fair value of the derivative is recognized directly to Interest expense and Cost of services provided in the period incurred. If it is determined that a derivative is not highly effective as a hedge, or if the hedged forecasted transaction is no longer probable of occurring, then the amount recognized in Accumulated other comprehensive loss is released to earnings. Cash flows from the derivatives are classified in the same category as the cash flows from the underlying hedged transaction.
Interest Rate Swap Contracts
The Company has exposures to variability in interest rates associated with its variable interest rate debt, which historically has included the Credit Agreement and Second Lien Credit Agreement. As such, the Company has entered into interest rate swaps to help manage interest rate exposure by economically converting a portion of its variable rate debt to fixed rate debt effective for the periods March 18, 2016 through December 31, 2020. The notional amount of interest rate contracts was $1,560,000 and $2,180,000 at September 30, 2018 and September 30, 2017, respectively. The net deferred losses on the interest rate swaps as of September 30, 2018 of $5,104, net of taxes, are expected to be recognized in Interest expense over the next 12 months.
The effects on the consolidated financial statements of the interest rate swaps which were designated as cash flow hedges were as follows:
|
|
|
Fiscal Year Ended |
|
|
Nine Months Ended |
|
|
Year Ended |
|
|||
|
|
|
September 30, 2018 |
|
|
September 30, 2017 |
|
|
December 31, 2016 |
|
|||
|
Income (loss) recognized in Other comprehensive income (loss) (effective portion) |
|
$ |
9,838 |
|
|
$ |
(3,388 |
) |
|
$ |
(8,331 |
) |
|
Loss recognized in Interest expense (ineffective portion) |
|
|
— |
|
|
|
(6 |
) |
|
|
— |
|
|
Net loss reclassified from Accumulated other comprehensive loss into Interest expense |
|
|
(9,816 |
) |
|
|
(7,424 |
) |
|
|
(4,947 |
) |
F-18
The Company operates a large fleet of vehicles and mowers and had entered into gasoline and diesel hedge contracts in an effort to reduce its exposure to volatility in the fuel markets. During the first quarter of fiscal 2018, all fuel hedge contracts expired. As of September 30, 2017, the Company had 2 outstanding fuel contracts covering the period January 1, 2017 through December 31, 2017 with notional amounts of 1.0 million gallons. As of December 31, 2016, the Company had 2 outstanding fuel contracts covering the period January 1, 2017 through December 31, 2017 with notional amounts of 4.3 million gallons.
The effects on the consolidated financial statements of the fuel swaps which were designated as cash flow hedges were as follows:
|
|
|
Fiscal Year Ended |
|
|
Nine Months Ended |
|
|
Year Ended |
|
|||
|
|
|
September 30, 2018 |
|
|
September 30, 2017 |
|
|
December 31, 2016 |
|
|||
|
Income (loss) recognized in Other comprehensive income (loss) (effective portion) |
|
$ |
57 |
|
|
$ |
(641 |
) |
|
$ |
666 |
|
|
Income (loss) recognized in Cost of services provided (ineffective portion) |
|
|
— |
|
|
|
19 |
|
|
|
301 |
|
|
Net gain (loss) reclassified from Accumulated other comprehensive loss into Cost of services provided |
|
|
7 |
|
|
|
(398 |
) |
|
|
(3,767 |
) |
|
11. |
Income Taxes |
Deferred tax assets and liabilities are determined based on differences between financial reporting and tax basis of assets and liabilities and are measured by applying enacted tax rates and laws for the taxable years in which those differences are expected to reverse. Deferred tax assets are evaluated for the estimated future tax effects of deductible temporary differences and tax operating loss carryovers. A valuation allowance is recorded when it is more likely than not that a deferred tax asset will not be realized.
The components of income tax benefit are as follows:
|
|
|
Fiscal Year Ended |
|
|
Nine Months Ended |
|
|
Year Ended |
|
|||
|
|
|
September 30, 2018 |
|
|
September 30, 2017 |
|
|
December 31, 2016 |
|
|||
|
Current: |
|
|
|
|
|
|
|
|
|
|
|
|
|
Federal |
|
$ |
(5,264 |
) |
|
$ |
23,217 |
|
|
$ |
8,476 |
|
|
State |
|
|
2,376 |
|
|
|
2,444 |
|
|
|
2,083 |
|
|
Deferred: |
|
|
|
|
|
|
|
|
|
|
|
|
|
Federal |
|
|
(54,528 |
) |
|
|
(30,695 |
) |
|
|
(38,286 |
) |
|
State |
|
|
(8,832 |
) |
|
|
(4,251 |
) |
|
|
(4,776 |
) |
|
Total income tax benefit |
|
$ |
(66,248 |
) |
|
$ |
(9,285 |
) |
|
$ |
(32,503 |
) |
F-19
Income tax benefit differs from the amount computed at the federal statutory corporate tax rate as follows:
|
|
|
Fiscal Year Ended |
|
|
Nine Months Ended |
|
|
Year Ended |
|
|||
|
|
|
September 30, 2018 |
|
|
September 30, 2017 |
|
|
December 31, 2016 |
|
|||
|
Federal tax at statutory rate |
|
$ |
(19,952 |
) |
|
$ |
(8,140 |
) |
|
$ |
(29,456 |
) |
|
State tax, net of federal tax benefit |
|
|
(5,199 |
) |
|
|
(392 |
) |
|
|
(4,966 |
) |
|
Tax effect of: |
|
|
|
|
|
|
|
|
|
|
|
|
|
Equity-based compensation |
|
|
2,360 |
|
|
|
1,059 |
|
|
|
971 |
|
|
Provision to return and deferred tax adjustments |
|
|
(646 |
) |
|
|
(48 |
) |
|
|
938 |
|
|
Non-deductible promotional and entertainment expense |
|
|
974 |
|
|
|
510 |
|
|
|
1,199 |
|
|
Fuel tax credit and other credits |
|
|
(740 |
) |
|
|
(563 |
) |
|
|
(1,527 |
) |
|
Change in uncertain tax positions |
|
|
579 |
|
|
|
(1,251 |
) |
|
|
— |
|
|
Non-deductible IPO costs |
|
|
1,622 |
|
|
|
— |
|
|
|
— |
|
|
Domestic production activities deduction(a) |
|
|
(1,741 |
) |
|
|
— |
|
|
|
— |
|
|
Rate change(b) |
|
|
(43,429 |
) |
|
|
— |
|
|
|
— |
|
|
Other, net |
|
|
(76 |
) |
|
|
(460 |
) |
|
|
338 |
|
|
Income tax benefit |
|
$ |
(66,248 |
) |
|
$ |
(9,285 |
) |
|
$ |
(32,503 |
) |
|
|
(a) |
In 2018, the Company calculated refund claims related to the domestic production activities deduction. The refund claims reduced the tax provision by $1,741. |
|
|
(b) |
In 2018, the inclusion of the revaluation of the net deferred tax liability attributable to the 2017 Tax Act reduced the tax provision by $43,429. |
The components of the Company’s net deferred tax asset and liability accounts resulting from temporary differences between the tax and financial reporting basis of assets and liabilities are as follows:
|
|
|
September 30, 2018 |
|
|
September 30, 2017 |
|
||
|
Deferred tax assets: |
|
|
|
|
|
|
|
|
|
Interest rate swaps |
|
$ |
4,509 |
|
|
$ |
14,088 |
|
|
Self-insurance reserves |
|
|
22,371 |
|
|
|
34,314 |
|
|
Deferred compensation |
|
|
2,899 |
|
|
|
3,860 |
|
|
Deferred rent |
|
|
190 |
|
|
|
323 |
|
|
Leases |
|
|
— |
|
|
|
615 |
|
|
Payroll related accruals |
|
|
9,934 |
|
|
|
10,267 |
|
|
Other accrued expenses |
|
|
2,485 |
|
|
|
3,864 |
|
|
Allowance for doubtful accounts |
|
|
1,525 |
|
|
|
3,340 |
|
|
Net operating loss carryforward |
|
|
4,460 |
|
|
|
2,274 |
|
|
Other non-current deferred tax assets |
|
|
191 |
|
|
|
378 |
|
|
Total non-current deferred tax assets |
|
|
48,564 |
|
|
|
73,323 |
|
|
Valuation allowance |
|
|
— |
|
|
|
— |
|
|
Total deferred tax assets |
|
$ |
48,564 |
|
|
$ |
73,323 |
|
|
|
|
|
|
|
|
|
|
|
|
Deferred tax liabilities: |
|
|
|
|
|
|
|
|
|
Intangible assets |
|
$ |
68,457 |
|
|
$ |
134,490 |
|
|
Property and equipment |
|
|
35,671 |
|
|
|
47,037 |
|
|
Inventories |
|
|
4,123 |
|
|
|
6,264 |
|
|
Deferred revenue |
|
|
6,782 |
|
|
|
10,112 |
|
|
Prepaid assets |
|
|
137 |
|
|
|
428 |
|
|
Other non-current deferred tax liabilities |
|
|
613 |
|
|
|
131 |
|
|
Total non-current deferred tax liabilities |
|
|
115,783 |
|
|
|
198,462 |
|
|
Total deferred tax liabilities (1) |
|
$ |
67,219 |
|
|
$ |
125,139 |
|
|
|
(1) |
The 2017 Tax Act impacted the comparison of the 2018 to the 2017 deferred tax changes by $43,429 as a result of the U.S. tax rate reduction and the change in the ASC 740-30 deferred liability balance. |
|
F-20
On December 22, 2017, the U.S. government enacted comprehensive tax legislation commonly referred to as the 2017 Tax Act. The 2017 Tax Act made broad and complex changes to the U.S. tax code that affects the Company’s fiscal year ending September 30, 2018, including but not limited to, (1) reducing the U.S. federal corporate tax rate and (2) bonus depreciation that will allow for full expensing of qualified property. The 2017 Tax Act reduced the Company’s federal corporate tax rate to 21 percent in the fiscal year ending September 30, 2018. Section 15 of the Internal Revenue Code stipulates that the Company’s fiscal year ending September 30, 2018 has a blended corporate tax rate of 24.5 percent, which is based on the applicable tax rates before and after the 2017 Tax Act and the number of days in the year.
As a result of the reduction in the U.S. corporate income tax rate from 35% to 21% under the 2017 Tax Act, the Company revalued its ending net deferred tax liabilities at December 31, 2017 and recognized a $43,429 tax benefit in the Company’s Consolidated Statement of Operations for the year ended September 30, 2018.
Net Operating Losses
The Company has state income tax net operating losses of $83,996 which expire in tax years from 2019 through 2038. The Company believes it is more likely than not it will be able to utilize all losses to offset future income.
Uncertain Income Tax Positions
As of September 30, 2018 and 2017, the Company had $1,016 and $284, respectively, of unrecognized tax benefits that, if recognized, would impact the Company's effective tax rate. The total amount of unrecognized tax benefits could change within the next twelve months for a number of reasons including audit settlements, tax examination activities and the recognition and measurement considerations under this guidance.
The following table represents a reconciliation of the Company’s total unrecognized tax benefits balances for the year ended September 30, 2018 and the nine months ended September 30, 2017:
|
|
|
September 30, 2018 |
|
|
September 30, 2017 |
|
||
|
Beginning of period |
|
$ |
284 |
|
|
$ |
1,749 |
|
|
Increases (decreases) as a result of tax positions taken in a prior period |
|
|
732 |
|
|
|
(1,708 |
) |
|
Increases as a result of tax positions taken during the current period |
|
|
— |
|
|
|
243 |
|
|
End of period |
|
$ |
1,016 |
|
|
$ |
284 |
|
The Company files income tax returns in the U.S. federal jurisdiction and various state and local jurisdictions. The Company’s returns are no longer subject to U.S. federal and state tax examination for years before 2015 and 2014, respectively.
|
12. |
Leases |
The Company has capital lease obligations for certain vehicles and equipment. The terms of the leases generally range from 1 to 5 years.
Future minimum lease payments under capital lease obligations as of September 30, 2018 are as follows:
|
Future minimum lease payments: |
|
|
|
|
|
Year ended September 30: |
|
|
|
|
|
2019 |
|
$ |
5,201 |
|
|
2020 |
|
|
4,138 |
|
|
2021 |
|
|
2,001 |
|
|
2022 |
|
|
484 |
|
|
2023 and thereafter |
|
|
59 |
|
|
Total |
|
|
11,883 |
|
|
Less: Executory costs |
|
|
(145 |
) |
|
Net minimum lease payments |
|
|
11,738 |
|
|
Less: Amount representing interest |
|
|
(1,620 |
) |
|
Present value of net minimum lease payments |
|
|
10,118 |
|
|
Less: Current portion |
|
|
(4,621 |
) |
|
Long-term portion of capital lease obligations |
|
$ |
5,497 |
|
F-21
The Company is committed under various operating leases for buildings and equipment with terms ranging from month-to-month to ten years. Most of the leases contain customary renewal options and escalation clauses. Lease expense was $45,949, $36,041 and $35,770 for the year ended September 30, 2018, the nine months ended September 30, 2017 and the year ended December 31, 2016, respectively, and is included in Cost of services provided and Selling, general and administrative expense in the accompanying Consolidated Statements of Operations.
Minimum annual lease payments under non-cancelable operating leases at September 30, 2018 are as follows:
|
Year Ended September 30, |
|
|||
|
2019 |
|
$ |
18,492 |
|
|
2020 |
|
|
14,825 |
|
|
2021 |
|
|
11,818 |
|
|
2022 |
|
|
8,780 |
|
|
2023 and thereafter |
|
|
25,490 |
|
|
Total |
|
$ |
79,405 |
|
|
13. |
Capital Structure |
Prior to the IPO discussed in Note 1 “Business”, all of the Company’s common stock was held by the Parent in direct proportion to ownership units (“Class A Units”) held by investors in the Parent. The Parent issued Class A Units to investors, including certain management employees. During the year ended September 30, 2018, the Parent issued 29 new Class A Units. Since the Parent was a holding company, it relied on the Company to satisfy the Parent’s obligations for any equity units called for redemption. The Parent redeemed vested units at the then fair market value primarily upon the termination of management employees. When the Parent’s units were redeemed, the Company repurchased the associated common stock and made a distribution to the Parent in order to fund the redemption. There were $1,612, $717 and $22,874 to fund redemptions of Parent units during the year ended September 30, 2018, the nine months ended September 30, 2017 and the year ended December 31, 2016, respectively.
|
14. |
Equity-Based Compensation |
The Company historically had a Management Equity Incentive Plan (the “Plan”) under which the Parent awarded certain Class B Units (the “Units”) to employees of the Company. The Units generally vested over a five-year vesting period with 50% of vesting contingent on certain performance criteria of the Company.
A summary of the Company’s historical activity for the Units is presented in the following table:
|
Class B Units |
|
Shares |
|
|
|
Outstanding at December 31, 2015 |
|
|
7,321 |
|
|
Granted |
|
|
4,647 |
|
|
Less: Redeemed |
|
|
1,524 |
|
|
Less: Forfeited |
|
|
3,393 |
|
|
Outstanding at December 31, 2016 |
|
|
7,051 |
|
|
Granted |
|
|
1,304 |
|
|
Less: Redeemed |
|
|
155 |
|
|
Less: Forfeited |
|
|
650 |
|
|
Outstanding at September 30, 2017 |
|
|
7,550 |
|
During the fiscal year ended September 30, 2018, prior to the IPO, the Company granted 244 Units and had redemption and forfeiture activity of 165 Units and 44 Units, respectively, totaling 7,585 Units outstanding immediately prior to the IPO.
F-22
On June 27, 2018, in connection with the IPO and in accordance with the provisions of the respective Limited Partnership Agreement and Plan documents, all of the 7,585 outstanding Units were converted into 2,241 shares of outstanding common stock of the Company at a weighted average grant date fair value of $14.66, including 1,346 shares subject to vesting under the same vesting conditions of the original Units. Subsequent to the IPO, through September 30, 2018, 252 shares vested and 1,094 shares outstanding remain restricted stock subject to vesting as at September 30, 2018.
On June 27, 2018, in connection with the IPO, the Company issued 684 shares at a weighted average grant date fair value of $22.00, all of which are restricted stock subject to vesting. These shares will vest ratably over a three-year period commencing on the first anniversary of the issuance date and all 684 shares outstanding remain restricted stock subject to vesting as at September 30, 2018.
Stock Option Awards
On June 27, 2018, in connection with the IPO, the Company issued 5,344 stock options to holders of the Units, at a weighted average exercise price of $22.00 and a weighted average grant date fair value of $7.38, 1,567 of which vested and became exercisable upon issuance and 608 of which vested and became exercisable subsequent to the IPO through September 30, 2018. The remaining 3,169 unvested options as of September 30, 2018 will vest and become exercisable under the same vesting and exercise conditions as the holders’ original Units.
On July 2, 2018, in connection with the IPO, the Company granted 403 stock options at a weighted average exercise price of $22.00 and a weighted average grant date fair value of $7.59, all of which will vest and become exercisable ratably over a four-year period commencing on the first anniversary of the grant date.
A summary of the Company’s stock option activity for the year ended September 30, 2018 is presented in the following table:
|
Stock Options |
|
Shares |
|
Weighted Average Exercise Price |
|
||
|
Outstanding at October 1, 2017 |
|
|
— |
|
|
|
|
|
Grants in connection with the IPO |
|
|
5,747 |
|
$ |
22.00 |
|
|
Less: Exercised |
|
|
— |
|
|
|
|
|
Less: Forfeited and expired units |
|
|
— |
|
|
|
|
|
Outstanding at September 30, 2018 |
|
|
5,747 |
|
$ |
22.00 |
|
|
Vested and exercisable at September 30, 2018 |
|
|
2,175 |
|
|
|
|
|
Expected to vest after September 30, 2018 |
|
|
3,572 |
|
$ |
22.00 |
|
The Company expenses equity-based compensation using the estimated fair value as of the grant date over the requisite service or performance period applicable to the grant. Estimates of future forfeitures are made at the date of grant and revised, if necessary, in subsequent periods if actual forfeitures differ from those estimates.
The Company recognized $28,795, $3,839 and $2,772 in equity-based compensation expense for the year ended September 30, 2018, the nine months ended September 30, 2017 and the year ended December 31, 2016, respectively, included in Selling, general and administrative expense in the accompanying Consolidated Statements of Operations. The resulting charge increased Additional paid in capital by the same amount. Total unrecognized compensation cost was $48,564, $17,876 and $20,460 as of September 30, 2018, September 30, 2017 and December 31, 2016, respectively, which is expected to be recognized over a weighted average period of 2.4 years.
Valuation Assumptions
The fair value of each Unit granted under the Plan was estimated on the date of grant using the Black-Scholes-Merton option-pricing model. The same process was maintained for purposes of valuing the stock option awards issued in connection with the IPO. The Company chose the Black-Scholes-Merton model based on its experience with the model and the determination that the model could be used to provide a reasonable estimate of the fair value of awards with terms such as those discussed above. The Company’s stock price is calculated based on the income approach. Under the income approach, specifically the discounted cash flow method, forecast cash flows are discounted to the present value at a risk-adjusted discount rate. The valuation analyses determine discrete free cash flows over several years based on the forecast financial information provided by management and a terminal value for the residual period beyond the discrete forecast, which are discounted at the appropriate rate to estimate the Company’s enterprise value.
F-23
The weighted-average assumptions used in the valuation of Unit awards and stock option awards granted or modified for the year ended September 30, 2018, the nine months ended September 30, 2017 and the year ended December 31, 2016 are presented in the table below:
|
|
|
Fiscal Year Ended |
|
|
Nine Months Ended |
|
|
Year Ended |
|
|||
|
|
|
September 30, 2018 |
|
|
September 30, 2017 |
|
|
December 31, 2016 |
|
|||
|
Assumptions: |
|
|
|
|
|
|
|
|
|
|
|
|
|
Risk-free interest rate |
|
|
2.77 |
% |
|
|
1.37 |
% |
|
|
1.42 |
% |
|
Dividend yield |
|
|
— |
|
|
|
— |
|
|
|
— |
|
|
Volatility factor |
|
|
26.93 |
% |
|
|
46.00 |
% |
|
|
43.00 |
% |
|
Expected term (in years) |
|
|
6.0 |
|
|
|
2.6 |
|
|
|
3.1 |
|
|
|
• |
Risk-free interest rate – The risk-free rate for Units and stock option awards granted during the periods presented above was determined by using the U.S. Treasury constant maturity rate as of the valuation date commensurate with the expected term. |
|
|
• |
Expected dividend yield – No routine dividends are currently being paid by the Plan, or are expected to be paid in future periods. |
|
|
• |
Expected volatility – The expected volatility is based upon an analysis of the historical and implied volatility of the guideline companies and adjusting the volatility to take into account the differences in leverage between the Company and the guideline companies. |
|
|
• |
Expected term – The expected term represents the expected time to a liquidity event or re-capitalization. The Company estimated the expected life by considering historical exercise and termination behavior of employees and the vesting conditions of the Units and stock option awards granted under the Plan. |
2018 Omnibus Incentive Plan
On June 28, 2018, in connection with the IPO, the Company’s Board of Directors adopted, and its stockholders approved, the BrightView Holdings, Inc. 2018 Omnibus Incentive Plan (the “2018 Omnibus Incentive Plan”). The 2018 Omnibus Incentive Plan provides that the total number of shares of common stock that may be issued under the plan is 11,650. Under the plan, the Company may grant stock options, stock appreciation rights, restricted stock, other equity-based awards and other cash-based awards to employees, directors, officers, consultants and advisors.
2018 Employee Stock Purchase Plan
The Company’s Stockholders have approved the Company’s 2018 Employee Stock Purchase Plan, (the “ESPP”). A total of 1,100 shares of the Company’s common stock were made available for sale on October 22, 2018 and will be issued on November 14, 2019.
|
15. |
Commitments and Contingencies |
Risk Management
The Company carries general liability, auto liability, workers’ compensation, professional liability, directors’ and officers’ liability and employee health care insurance policies. In addition, the Company carries umbrella liability insurance policies to cover claims over the liability limits contained in the primary policies. The Company’s insurance programs for workers’ compensation, general liability, auto liability and employee health care for certain employees contain self-insured retention amounts, deductibles and other coverage limits (“self-insured liability”). Claims that are not self-insured as well as claims in excess of the self-insured liability amounts are insured. The Company uses estimates in the determination of the required reserves. These estimates are based upon calculations performed by third-party actuaries, as well as examination of historical trends and industry claims experience. The Company’s reserve for unpaid and incurred but not reported claims under these programs at September 30, 2018 was $127,937, of which $34,537 was classified in current liabilities and $93,400 was classified in non-current liabilities in the accompanying Consolidated Balance Sheets. The Company’s reserve for unpaid and incurred but not reported claims under these programs at September 30, 2017 was $122,598, of which $56,079 was classified in current liabilities and $66,519 was classified in non-current liabilities in the accompanying Consolidated Balance Sheets. While the ultimate amount of these claims is dependent on future developments, in management’s opinion, recorded reserves are adequate to cover these claims. The Company’s reserve for unpaid and incurred but not reported claims at September 30, 2018 includes $37,839 related to claims recoverable from third-party insurance carriers. Corresponding assets of $9,365 and $28,474 are recorded as Other current assets and Other assets, respectively within the
F-24
Consolidated Balance Sheets. The Company’s reserve for unpaid and incurred but not reported claims at September 30, 2017 includes $37,020 related to claims recoverable from third party insurance carriers. Corresponding assets of $17,462 and $19,558 are recorded as Other current assets and Other assets, respectively, within the Consolidated Balance Sheets.
Litigation Contingency
From time to time, the Company is subject to legal proceedings and claims in the ordinary course of its business, principally claims made alleging injuries (including vehicle and general liability matters as well as workers’ compensation and property casualty claims). Such claims, even if lacking merit, can result in expenditures of significant financial and managerial resources. In the ordinary course of its business, the Company is also subject to claims involving current and/or former employees and disputes involving commercial and regulatory matters. Regulatory matters include, among other things, audits and reviews of local and federal tax compliance, safety and employment practices. Although the process of resolving regulatory matters and claims through litigation and other means is inherently uncertain, the Company is not aware of any such matter, legal proceeding or claim that it believes will have, individually or in the aggregate, a material effect on the Company, its financial condition, results of operations or cash flows. For all legal matters, an estimated liability is established in accordance with the loss contingencies accounting guidance. This estimated liability is included in Accrued expenses and other current liabilities in the accompanying Consolidated Balance Sheets.
|
16. |
Noncash Investing and Financing Activities |
During the year ended September 30, 2018:
|
|
• |
The Company acquired $1,550 of equipment by entering into capital lease obligations |
|
|
• |
The Company had unrealized gains on interest rate swaps of $9,838 |
During the nine months ended September 30, 2017:
|
|
• |
The Company acquired $5,791 of equipment by entering into capital lease obligations |
|
|
• |
The Company had unrealized losses on interest rate swaps of $3,388 |
During the year ended December 31, 2016:
|
|
• |
The Company acquired $6,555 of equipment by entering into capital lease obligations |
|
|
• |
The Company had unrealized losses on interest rate swaps of $8,331 |
|
17. |
Segments |
The operations of the Company are conducted through two operating segments, Maintenance Services and Development Services, which are also its reportable segments.
Maintenance Services primarily consists of recurring landscape maintenance services and snow removal services, as well as supplemental landscape enhancement services.
Development Services primarily consists of landscape architecture and development services for new construction and large scale redesign projects. Development Services also includes the Company’s tree and nursery division, which grows and sells trees and manages removal and installation of specimen trees as part of many development projects.
The operating segments identified above are determined based on the services provided, and they reflect the manner in which operating results are regularly reviewed by the Chief Operating Decision Maker (“CODM”) to allocate resources and assess performance. The CODM is the Company’s Chief Executive Officer. The CODM evaluates the performance of the Company’s operating segments based upon Net Service Revenues, Adjusted EBITDA and Capital Expenditures. Management uses Adjusted EBITDA to evaluate performance and profitability of each operating segment.
The accounting policies of the segments are the same as those described in Note 2 “Summary of Significant Accounting Policies.” Corporate includes corporate executive compensation, finance, legal and information technology which are not allocated to the segments. Eliminations represent eliminations of intersegment revenues. The Company does not currently provide asset information by segment, as this information is not used by management when allocating resources or evaluating performance. The following is a summary of certain financial data for each of the segments:
F-25
|
|
Fiscal Year Ended |
|
|
Nine Months Ended |
|
|
Year Ended |
|
||||
|
|
|
September 30, 2018 |
|
|
September 30, 2017 |
|
|
December 31, 2016 |
|
|||
|
|
|
|
|
|
|
|
|
|
|
|
|
|
|
Maintenance Services |
|
$ |
1,774,797 |
|
|
$ |
1,278,279 |
|
|
$ |
1,689,748 |
|
|
Development Services |
|
|
583,318 |
|
|
|
437,748 |
|
|
|
498,907 |
|
|
Eliminations |
|
|
(4,512 |
) |
|
|
(2,448 |
) |
|
|
(3,353 |
) |
|
Net Service Revenues |
|
$ |
2,353,603 |
|
|
$ |
1,713,579 |
|
|
$ |
2,185,302 |
|
|
Maintenance Services |
|
$ |
289,792 |
|
|
$ |
210,298 |
|
|
$ |
263,801 |
|
|
Development Services |
|
|
78,732 |
|
|
|
52,869 |
|
|
|
67,087 |
|
|
Corporate |
|
|
(68,430 |
) |
|
|
(45,989 |
) |
|
|
(75,204 |
) |
|
Adjusted EBITDA(1) |
|
$ |
300,094 |
|
|
$ |
217,178 |
|
|
$ |
255,684 |
|
|
Maintenance Services |
|
$ |
45,548 |
|
|
$ |
40,255 |
|
|
$ |
55,554 |
|
|
Development Services |
|
|
4,884 |
|
|
|
5,134 |
|
|
|
10,586 |
|
|
Corporate |
|
|
35,993 |
|
|
|
5,244 |
|
|
|
9,469 |
|
|
Capital Expenditures |
|
$ |
86,425 |
|
|
$ |
50,633 |
|
|
$ |
75,609 |
|
|
|
(1) |
Presented below is a reconciliation of Net Loss to Adjusted EBITDA: |
|
|
|
Fiscal Year Ended |
|
|
Nine Months Ended |
|
|
Year Ended |
|
|||
|
|
|
September 30, 2018 |
|
|
September 30, 2017 |
|
|
December 31, 2016 |
|
|||
|
|
|
|
|
|
|
|
|
|
|
|
|
|
|
Net loss |
|
$ |
(15,087 |
) |
|
$ |
(13,955 |
) |
|
$ |
(52,364 |
) |
|
Interest expense |
|
|
97,782 |
|
|
|
73,742 |
|
|
|
94,660 |
|
|
Income tax benefit |
|
|
(66,248 |
) |
|
|
(9,285 |
) |
|
|
(32,503 |
) |
|
Depreciation expense |
|
|
75,296 |
|
|
|
56,473 |
|
|
|
79,255 |
|
|
Amortization expense |
|
|
104,943 |
|
|
|
92,863 |
|
|
|
131,562 |
|
|
Establish public company financial reporting compliance (a) |
|
|
4,145 |
|
|
|
800 |
|
|
|
5,492 |
|
|
Business transformation and integration costs (b) |
|
|
25,422 |
|
|
|
10,783 |
|
|
|
24,094 |
|
|
Expenses related to initial public offering (c) |
|
|
6,805 |
|
|
|
— |
|
|
|
— |
|
|
Debt extinguishment (d) |
|
|
25,109 |
|
|
|
— |
|
|
|
— |
|
|
Equity-based compensation (e) |
|
|
28,795 |
|
|
|
3,839 |
|
|
|
2,772 |
|
|
Management fees (f) |
|
|
13,132 |
|
|
|
1,918 |
|
|
|
2,716 |
|
|
Adjusted EBITDA |
|
$ |
300,094 |
|
|
$ |
217,178 |
|
|
$ |
255,684 |
|
|
|
(a) |
Represents costs incurred to establish public company financial reporting compliance, including costs to comply with the requirements of Sarbanes-Oxley, the accelerated adoption of the new revenue recognition standard (ASC 606 – Revenue from Contracts with Customers) and other miscellaneous costs. |
|
|
(b) |
Business transformation and integration costs consist of (i) severance and related costs; (ii) rebranding of vehicle fleet; (iii) business integration costs and (iv) information technology infrastructure transformation costs and other. |
|
|
(c) |
Represents expenses incurred in connection with the IPO. |
|
|
(d) |
Represents losses on the extinguishment of debt. |
|
|
(e) |
Represents equity-based compensation expense recognized for equity incentive plans outstanding, including $19,590 related to the IPO in the fiscal year ended September 30, 2018. |
|
|
(f) |
Represents fees paid pursuant to a monitoring agreement terminated on July 2, 2018 in connection with the completion of the IPO. |
|
|
F-26
Basic loss per share is computed by dividing net loss attributable to common shares by the weighted average number of common shares outstanding for the period. Diluted loss per share is computed by dividing net loss by the weighted average number of shares of common stock outstanding during the period, increased to include the number of shares of common stock that would have been outstanding had potential dilutive shares of common stock been issued. Set forth below is a reconciliation of the numerator and denominator for basic and diluted loss per share calculation for the periods indicated:
|
|
|
Year Ended |
|
|
Nine Months Ended |
|
|
Year Ended |
|
|||
|
|
|
September 30, 2018 |
|
|
September 30, 2017 |
|
|
December 31, 2016 |
|
|||
|
Numerator: |
|
|
|
|
|
|
|
|
|
|
|
|
|
Net loss available to common stockholders |
|
$ |
(15,087 |
) |
|
$ |
(13,955 |
) |
|
$ |
(52,364 |
) |
|
Denominator: |
|
|
|
|
|
|
|
|
|
|
|
|
|
Weighted average number of common shares outstanding – Basic and Diluted |
|
|
83,369 |
|
|
|
77,071 |
|
|
|
77,685 |
|
|
Basic and Diluted loss per share |
|
$ |
(0.18 |
) |
|
$ |
(0.18 |
) |
|
$ |
(0.67 |
) |
|
Other Information: |
|
|
|
|
|
|
|
|
|
|
|
|
|
Weighted average number of anti-dilutive options and restricted stock (a) |
|
|
1,283 |
|
|
|
— |
|
|
|
— |
|
|
|
(a) |
Weighted average number of anti-dilutive options is based upon the average closing price of the Company’s common stock on the NYSE for the period. |
|
19. |
Related Party Transactions |
Affiliates of KKR participated as (i) a lender in the Company’s Revolving Credit Facility discussed in Note 9, “Long-term Debt,” (ii) an underwriter in the Company’s IPO and (iii) a provider of services for the debt refinancing transaction. Specifically, KKR Capital Markets LLC, an affiliate of KKR, acted as an underwriter in connection with the IPO and received underwriter discounts and commissions of approximately $5,497. In addition, in August 2018, KKR Capital Markets LLC received $1,670 for services rendered in connection with the debt refinancing transaction.
The Company entered into a monitoring agreement, dated December 13, 2013, with the Sponsors, pursuant to which the Sponsors provided management and advisory services to the Company and its subsidiaries in exchange for an annual advisory fee in an amount equal to 1% of prior year Adjusted EBITDA, as defined in the Company’s Credit Agreement. The Company paid management and/or advisory fees of $1,633 to KKR and $463 to MSD Partners for the year ended September 30, 2018, $1,486 to KKR and $431 to MSD Partners for the nine months ended September 30, 2017 and $2,105 to KKR and $611 to MSD Partners for the year ended December 31, 2016. In connection with the Company’s IPO, the monitoring agreement was terminated in accordance with its terms and the Company paid termination fees of approximately $7,598 and $3,438 to KKR and MSD Partners, respectively, during the year ended September 30, 2018, which is included in Selling, general and administrative expenses on the Consolidated Statements of Operations.
F-27