Attached files
| file | filename |
|---|---|
| 8-K - 8-K - ENERGIZER HOLDINGS, INC. | d641408d8k.htm |

Exhibit 99.1 Energizer Acquisition Update November 26, 2018 Exhibit 99.1 Energizer Acquisition Update November 26, 2018

19 Safe Harbor Statements 157 235 Forward-Looking Statements This presentation contains “forward-looking statements” within the meaning of the Private Securities Litigation Reform Act of 1995, including without limitation, statements about the expected benefits of the proposed transaction, the manner in which the proposed transaction is 245 expected to be financed and anticipated timing of the completion of the proposed transactions. These forward-looking statements generally are 145 identified by the words “opportunity,” “offers,” “expected,” “intends,” “anticipated” and similar words and expressions. Any statements that are not 30 statements of historical fact should be considered to be forward-looking statements. Any such forward looking statements are made based on information currently known and are subject to various risks and uncertainties. Risks and uncertainties to which these forward-looking statements are subject include, without limitation: (1) the proposed transactions may not be completed on the anticipated terms and timing or at all, (2) required regulatory approvals, including antitrust approvals, are not obtained, or that in order to obtain such regulatory approvals, conditions are imposed that adversely affect the anticipated benefits from the proposed transactions or cause the parties to abandon the 186 proposed transaction, (3) a condition to closing of the proposed transaction may not be satisfied, (4) potential adverse reactions or changes to 152 business relationships resulting from the announcement or completion of the transactions, (5) the ability to obtain or consummate financing or 34 refinancing related to the transactions upon acceptable terms or at all, (6) risks associated with third party contracts containing consent and/or other provisions that may be triggered by the proposed transactions, (7) negative effects of the announcement or the consummation of the transaction on the market price of Energizer’s common stock, (8) the potential impact of unforeseen liabilities, future capital expenditures, revenues, expenses, earnings, synergies, economic performance, indebtedness, financial condition and losses on the future prospects, business and management strategies for the management, expansion and growth of Energizer’s operations after the consummation of the 18 transactions and on the other conditions to the completion of the proposed transactions, (9) the risks and costs associated with, and the ability 95 of Energizer to, integrate the businesses successfully and to achieve anticipated synergies, (10) the risk that disruptions from the proposed transactions will harm Energizer’s business, including current plans and operations, (11) risks related to changes and developments in external 174 competitive market factors, such as introduction of new product features or technological developments, development of new competitors or competitive brands or competitive promotional activity or spending, (12) the ability of Energizer to retain and hire key personnel, (13) adverse legal and regulatory developments or determinations or adverse changes in, or interpretations of, U.S. or other foreign laws, rules or regulations, including tax laws, rules and regulations, that could delay or prevent completion of the proposed transactions or cause the terms of the proposed transactions to be modified, and (14) management’s response to any of the aforementioned factors. For additional information 144 concerning factors that could cause actual results and events to differ materially from those projected herein, please refer to Energizer’s most 33 recent 10-K, 10-Q, 8-K reports and other publicly available filings. Energizer does not assume any obligation to publicly provide revisions or 34 updates to any forward looking statements, whether as a result of new information, future developments or otherwise, should circumstances change, except as otherwise required by securities and other applicable laws. 124 175 40 2 19 Safe Harbor Statements 157 235 Forward-Looking Statements This presentation contains “forward-looking statements” within the meaning of the Private Securities Litigation Reform Act of 1995, including without limitation, statements about the expected benefits of the proposed transaction, the manner in which the proposed transaction is 245 expected to be financed and anticipated timing of the completion of the proposed transactions. These forward-looking statements generally are 145 identified by the words “opportunity,” “offers,” “expected,” “intends,” “anticipated” and similar words and expressions. Any statements that are not 30 statements of historical fact should be considered to be forward-looking statements. Any such forward looking statements are made based on information currently known and are subject to various risks and uncertainties. Risks and uncertainties to which these forward-looking statements are subject include, without limitation: (1) the proposed transactions may not be completed on the anticipated terms and timing or at all, (2) required regulatory approvals, including antitrust approvals, are not obtained, or that in order to obtain such regulatory approvals, conditions are imposed that adversely affect the anticipated benefits from the proposed transactions or cause the parties to abandon the 186 proposed transaction, (3) a condition to closing of the proposed transaction may not be satisfied, (4) potential adverse reactions or changes to 152 business relationships resulting from the announcement or completion of the transactions, (5) the ability to obtain or consummate financing or 34 refinancing related to the transactions upon acceptable terms or at all, (6) risks associated with third party contracts containing consent and/or other provisions that may be triggered by the proposed transactions, (7) negative effects of the announcement or the consummation of the transaction on the market price of Energizer’s common stock, (8) the potential impact of unforeseen liabilities, future capital expenditures, revenues, expenses, earnings, synergies, economic performance, indebtedness, financial condition and losses on the future prospects, business and management strategies for the management, expansion and growth of Energizer’s operations after the consummation of the 18 transactions and on the other conditions to the completion of the proposed transactions, (9) the risks and costs associated with, and the ability 95 of Energizer to, integrate the businesses successfully and to achieve anticipated synergies, (10) the risk that disruptions from the proposed transactions will harm Energizer’s business, including current plans and operations, (11) risks related to changes and developments in external 174 competitive market factors, such as introduction of new product features or technological developments, development of new competitors or competitive brands or competitive promotional activity or spending, (12) the ability of Energizer to retain and hire key personnel, (13) adverse legal and regulatory developments or determinations or adverse changes in, or interpretations of, U.S. or other foreign laws, rules or regulations, including tax laws, rules and regulations, that could delay or prevent completion of the proposed transactions or cause the terms of the proposed transactions to be modified, and (14) management’s response to any of the aforementioned factors. For additional information 144 concerning factors that could cause actual results and events to differ materially from those projected herein, please refer to Energizer’s most 33 recent 10-K, 10-Q, 8-K reports and other publicly available filings. Energizer does not assume any obligation to publicly provide revisions or 34 updates to any forward looking statements, whether as a result of new information, future developments or otherwise, should circumstances change, except as otherwise required by securities and other applicable laws. 124 175 40 2

19 Safe Harbor Statements (Con’t) 157 235 Non-GAAP Financial Measures While the Company reports financial results in accordance with accounting principles generally accepted in the U.S. (“GAAP”), this presentation 245 includes non-GAAP measures, including, without limitation, free cash flow, adjusted free cash flow, EBITDA and Adjusted EBITDA. We believe these non-GAAP measures provide a meaningful comparison to the corresponding historical or future period, assist investors in performing 145 their analysis, and provide investors with visibility into the underlying financial performance of the Company’s business. The Company believes 30 that these non-GAAP measures are presented in such a way as to allow investors to more clearly understand the nature and amount of the adjustments to arrive at the non-GAAP measure. Investors should consider non-GAAP measures in addition to, not as a substitute for, or superior to, the comparable GAAP measures. Additionally, these non-GAAP measures may differ from similarly titled measures presented by other companies. A reconciliation of these non-GAAP measures to the nearest comparable GAAP measure is available at the end of this 186 presentation. We are unable to provide a reconciliation of non-GAAP measures of the acquired business due to the carve-out nature of the 152 proposed transaction. We are unable to provide a reconciliation for forward-looking non-GAAP measures due to uncertainty regarding future 34 acquisitions and integration costs. Market and Industry Data This presentation includes industry and trade association data, forecasts and information that were prepared based, in part, upon data, forecasts and information obtained from independent trade associations, industry publications and surveys and other independent sources 18 available to Energizer. These third-party publications and surveys generally state that the information included therein has been obtained from 95 sources believed to be reliable, but that the publications and surveys can give no assurance as to the accuracy or completeness of such 174 information. Energizer has not independently verified any of the data from third-party sources nor has it ascertained the underlying economic assumptions on which such data are based. 144 33 34 124 175 40 2 3 19 Safe Harbor Statements (Con’t) 157 235 Non-GAAP Financial Measures While the Company reports financial results in accordance with accounting principles generally accepted in the U.S. (“GAAP”), this presentation 245 includes non-GAAP measures, including, without limitation, free cash flow, adjusted free cash flow, EBITDA and Adjusted EBITDA. We believe these non-GAAP measures provide a meaningful comparison to the corresponding historical or future period, assist investors in performing 145 their analysis, and provide investors with visibility into the underlying financial performance of the Company’s business. The Company believes 30 that these non-GAAP measures are presented in such a way as to allow investors to more clearly understand the nature and amount of the adjustments to arrive at the non-GAAP measure. Investors should consider non-GAAP measures in addition to, not as a substitute for, or superior to, the comparable GAAP measures. Additionally, these non-GAAP measures may differ from similarly titled measures presented by other companies. A reconciliation of these non-GAAP measures to the nearest comparable GAAP measure is available at the end of this 186 presentation. We are unable to provide a reconciliation of non-GAAP measures of the acquired business due to the carve-out nature of the 152 proposed transaction. We are unable to provide a reconciliation for forward-looking non-GAAP measures due to uncertainty regarding future 34 acquisitions and integration costs. Market and Industry Data This presentation includes industry and trade association data, forecasts and information that were prepared based, in part, upon data, forecasts and information obtained from independent trade associations, industry publications and surveys and other independent sources 18 available to Energizer. These third-party publications and surveys generally state that the information included therein has been obtained from 95 sources believed to be reliable, but that the publications and surveys can give no assurance as to the accuracy or completeness of such 174 information. Energizer has not independently verified any of the data from third-party sources nor has it ascertained the underlying economic assumptions on which such data are based. 144 33 34 124 175 40 2 3

19 Safe Harbor Statements (Con’t) 157 235 Presentation of Financial Information The pro forma financial information set forth herein has not been prepared in accordance with Article 11 of Regulation S-X, but rather represents a simple combination of Energizer’s and Spectrum Brands’ Battery and Portable Lighting Business (“Spectrum Battery”) after giving effect to the 245 expected divestiture of the Europe-based Varta® consumer battery business (the “Divestiture”) and the Spectrum Brands’ Global Auto Care 145 Business (“Spectrum Auto Care”) results. Pro forma financial information pursuant to Article 11 could differ materially from the combined 30 information set forth herein. The pro forma financial information also gives effect to estimated synergies from the acquisitions. Such adjustment is presented because the bridge credit agreement and the indenture governing the notes are expected to permit such an adjustment, and to permit investors to understand the calculation of EBITDA under the covenants in such agreements. It should not be viewed as a projection of actual results in any period. In particular, investors should understand that the Company expects to incur substantial cash expenditures (in excess of the anticipated annual synergies) to realize such synergies, and such expenditures are not taken into account in presenting EBITDA. 186 In addition, the Company does not expect to fully realize the synergies for several years. The actual amount of synergies that the Company 152 ultimately realizes, and the costs of implementation, could differ materially from the estimates set forth herein. 34 For purposes of this presentation, Energizer has assumed $550 million in divestiture proceeds; however, actual proceeds may differ materially based on a variety of factors, including buyer interest, due diligence and the performance of the business. In the event that actual proceeds, including specified adjustments, exceed $600 million, Energizer has agreed to pay Spectrum 25% of such excess. In the event that actual proceeds, including specified adjustments, are less than $600 million, Spectrum has agreed to pay Energizer the lesser of 75% of the shortfall 18 and $200 million. 95 174 144 33 34 124 175 40 2 4 19 Safe Harbor Statements (Con’t) 157 235 Presentation of Financial Information The pro forma financial information set forth herein has not been prepared in accordance with Article 11 of Regulation S-X, but rather represents a simple combination of Energizer’s and Spectrum Brands’ Battery and Portable Lighting Business (“Spectrum Battery”) after giving effect to the 245 expected divestiture of the Europe-based Varta® consumer battery business (the “Divestiture”) and the Spectrum Brands’ Global Auto Care 145 Business (“Spectrum Auto Care”) results. Pro forma financial information pursuant to Article 11 could differ materially from the combined 30 information set forth herein. The pro forma financial information also gives effect to estimated synergies from the acquisitions. Such adjustment is presented because the bridge credit agreement and the indenture governing the notes are expected to permit such an adjustment, and to permit investors to understand the calculation of EBITDA under the covenants in such agreements. It should not be viewed as a projection of actual results in any period. In particular, investors should understand that the Company expects to incur substantial cash expenditures (in excess of the anticipated annual synergies) to realize such synergies, and such expenditures are not taken into account in presenting EBITDA. 186 In addition, the Company does not expect to fully realize the synergies for several years. The actual amount of synergies that the Company 152 ultimately realizes, and the costs of implementation, could differ materially from the estimates set forth herein. 34 For purposes of this presentation, Energizer has assumed $550 million in divestiture proceeds; however, actual proceeds may differ materially based on a variety of factors, including buyer interest, due diligence and the performance of the business. In the event that actual proceeds, including specified adjustments, exceed $600 million, Energizer has agreed to pay Spectrum 25% of such excess. In the event that actual proceeds, including specified adjustments, are less than $600 million, Spectrum has agreed to pay Energizer the lesser of 75% of the shortfall 18 and $200 million. 95 174 144 33 34 124 175 40 2 4

19 157 Transaction Headlines 235 — Our core remains rock solid and we are making these acquisitions at a time 245 of strength 145 30 — Spectrum Battery acquisition strengthens our core business 186 152 — Spectrum Auto Care acquisition transforms our existing Auto Care business 34 unit 18 — Significant financial benefits from both acquisitions expected 95 174 — Our team is confident in our ability to integrate both businesses, and achieve our synergy projections – integration planning is well underway and we have 144 a clear roadmap 33 34 — Our management team is proven and highly experienced with strong track record of execution excellence 124 175 40 5 19 157 Transaction Headlines 235 — Our core remains rock solid and we are making these acquisitions at a time 245 of strength 145 30 — Spectrum Battery acquisition strengthens our core business 186 152 — Spectrum Auto Care acquisition transforms our existing Auto Care business 34 unit 18 — Significant financial benefits from both acquisitions expected 95 174 — Our team is confident in our ability to integrate both businesses, and achieve our synergy projections – integration planning is well underway and we have 144 a clear roadmap 33 34 — Our management team is proven and highly experienced with strong track record of execution excellence 124 175 40 5

19 Since Separation Energizer Has Created 157 235 Value by Effectively Executing Its Strategies A foundation for delivering long-term value to shareholders, customers and consumers 245 145 Leading with Innovation is Key to Success 30 — Energizer Bunny is now Bigger, Better & Bunnier — Innovation across all battery segments, auto fragrance 186 and appearance 152 34 Focus on Effectively Executing Category Fundamentals Maximizing 18 Cash Flows — Delivered 3 consecutive years of organic revenue 95 growth and market share gains 174 Continuous Improvements Drive Productivity Gains 144 33 — Embedded a cost conscious mindset through zero 34 based budgeting — Continuous improvement mindset since separation 124 175 40 6 19 Since Separation Energizer Has Created 157 235 Value by Effectively Executing Its Strategies A foundation for delivering long-term value to shareholders, customers and consumers 245 145 Leading with Innovation is Key to Success 30 — Energizer Bunny is now Bigger, Better & Bunnier — Innovation across all battery segments, auto fragrance 186 and appearance 152 34 Focus on Effectively Executing Category Fundamentals Maximizing 18 Cash Flows — Delivered 3 consecutive years of organic revenue 95 growth and market share gains 174 Continuous Improvements Drive Productivity Gains 144 33 — Embedded a cost conscious mindset through zero 34 based budgeting — Continuous improvement mindset since separation 124 175 40 6

19 Building Off of a Strong Foundation in the 157 235 Core Business — Delivered strong organic revenue and FY2015A-2018A CAGR 245 Adjusted EBITDA growth the past 145 three years 30 4.9% — Energizer is well positioned to continue benefiting from the favorable trends in 2.8% the battery category – miniaturization, 186 Internet of Things, premiumization 152 34 — Achieved $218mm of run-rate savings Organic Net Sales Adjusted EBITDA to date from 2013 restructuring project 18 — Global battery market share gain of 95 Adj. EBITDA Margin Expansion through Productivity 1 4.9% in the last 4 years 174 1 ¡ Current global share of 37.2% 22.1% 22.2% ¡ #1 in battery category (based on our 19.2% 144 1 global monthly markets) 33 34 — Leading branded manufacturer in US online battery market FY2016A FY2017A FY2018A 2 ¡ ~23% share 124 175 40 1. Market share data based on value; Nielsen Global Track through August 2018, World Monthly Markets 2. 1010data eCommerce Insights, data ending August 2018 7 19 Building Off of a Strong Foundation in the 157 235 Core Business — Delivered strong organic revenue and FY2015A-2018A CAGR 245 Adjusted EBITDA growth the past 145 three years 30 4.9% — Energizer is well positioned to continue benefiting from the favorable trends in 2.8% the battery category – miniaturization, 186 Internet of Things, premiumization 152 34 — Achieved $218mm of run-rate savings Organic Net Sales Adjusted EBITDA to date from 2013 restructuring project 18 — Global battery market share gain of 95 Adj. EBITDA Margin Expansion through Productivity 1 4.9% in the last 4 years 174 1 ¡ Current global share of 37.2% 22.1% 22.2% ¡ #1 in battery category (based on our 19.2% 144 1 global monthly markets) 33 34 — Leading branded manufacturer in US online battery market FY2016A FY2017A FY2018A 2 ¡ ~23% share 124 175 40 1. Market share data based on value; Nielsen Global Track through August 2018, World Monthly Markets 2. 1010data eCommerce Insights, data ending August 2018 7

Acquisition of Spectrum’s Battery Business 1 Bolsters Our Core Strategic Rationale Strategic Rationale T Tr ransactio ansaction Summary n Summary ($mm) ($mm) — Broadens portfolio into value segment, Key Brands with opportunity to invest in and grow the (NA, LATAM & APAC) VARTA brand 2 Net Sales $510 - $520 2 Adjusted EBITDA $80 - $90 — Diversifies business into attractive regions – scales Latin American and Asia Net Purchase Price $1,400 - $1,500 Pacific operations Estimated Cost Synergies $55 - $65 Tax Benefit $110 — Acquire attractive hearing aid battery 2,3 Implied EV / Adj. EBITDA 9.0x - 9.5x business with strong growth and margin — Cash on Hand profile — Escrowed Proceeds — Significant synergies of $55-65mm Transaction Funding from Notes expected (~12% of net sales) Offering — Committed — $110mm tax benefit – an increase of Debt ~$10mm from original deal Beginning of Expected Closing CY 2019 ¡ Annual cash flow benefit of ~$11mm Integration Planning Integration Planning in in Advanced Advanced Stages Stages 1. Information on this slide represent net of potential remedies and anticipated net proceeds of divestiture. See “Presentation of Financial Information” on page 4 2. Represents FY2018 3. Represents transaction multiple net of tax asset and including run-rate synergies 8Acquisition of Spectrum’s Battery Business 1 Bolsters Our Core Strategic Rationale Strategic Rationale T Tr ransactio ansaction Summary n Summary ($mm) ($mm) — Broadens portfolio into value segment, Key Brands with opportunity to invest in and grow the (NA, LATAM & APAC) VARTA brand 2 Net Sales $510 - $520 2 Adjusted EBITDA $80 - $90 — Diversifies business into attractive regions – scales Latin American and Asia Net Purchase Price $1,400 - $1,500 Pacific operations Estimated Cost Synergies $55 - $65 Tax Benefit $110 — Acquire attractive hearing aid battery 2,3 Implied EV / Adj. EBITDA 9.0x - 9.5x business with strong growth and margin — Cash on Hand profile — Escrowed Proceeds — Significant synergies of $55-65mm Transaction Funding from Notes expected (~12% of net sales) Offering — Committed — $110mm tax benefit – an increase of Debt ~$10mm from original deal Beginning of Expected Closing CY 2019 ¡ Annual cash flow benefit of ~$11mm Integration Planning Integration Planning in in Advanced Advanced Stages Stages 1. Information on this slide represent net of potential remedies and anticipated net proceeds of divestiture. See “Presentation of Financial Information” on page 4 2. Represents FY2018 3. Represents transaction multiple net of tax asset and including run-rate synergies 8

19 Acquisition of Spectrum’s Global Auto Care 157 Business Transforms Our Auto Care Business Unit 235 Opportunistically acquired without an auction, leveraging existing relationship with Spectrum 245 Strategic Rationale Transaction Summary ($mm) 145 — Attractive growth category with scale – $2.8bn US 30 Key Brands 1 market with 1.8% CAGR through 2023 expected 2 Net Sales $466 — One of the leading suppliers in auto category with 2 strong commercial relationships Adjusted EBITDA $99 186 4 — Adds the leading iconic auto care brand, Armor All, Purchase Price $1,250 152 to the Energizer portfolio Estimated Cost Synergies $15 34 2,3 — Strategic fit Implied EV / Adj. EBITDA 10.5x - 11.0x 75% Cash / ¡ Strong strategic fit with existing auto care Consideration Paid to SPB 25% Equity business in air fresheners and appearance 18 — Cash on Hand 95 ¡ Significant channel overlap with current battery and Debt 174 business — $312 Equity to 5 — Solidifies another platform for further growth SPB — ~$500 Equity ¡ Ability to increase international growth through Transaction Funding and/or Equity- 144 Energizer distribution network Linked 33 ¡ Ability to leverage Energizer’s marketing and Expected 34 R&D core competencies to accelerate Through Capital innovation Markets Expected Closing Q2 of FY2019 — Synergies of $15mm expected (~3% of net sales) 124 Run as a Standalone Segment within Spectrum will Make for an Easier Integration 175 40 1. US Only – NPD RTS+RTSX – CY2017 2. Represents FY2018 3. Represents transaction multiple based on current run-rate Adjusted EBITDA including synergies 9 4. Subject to adjustments 5. Number of shares to be determined based on 10-trading day VWAP prior to signing subject to adjustment 19 Acquisition of Spectrum’s Global Auto Care 157 Business Transforms Our Auto Care Business Unit 235 Opportunistically acquired without an auction, leveraging existing relationship with Spectrum 245 Strategic Rationale Transaction Summary ($mm) 145 — Attractive growth category with scale – $2.8bn US 30 Key Brands 1 market with 1.8% CAGR through 2023 expected 2 Net Sales $466 — One of the leading suppliers in auto category with 2 strong commercial relationships Adjusted EBITDA $99 186 4 — Adds the leading iconic auto care brand, Armor All, Purchase Price $1,250 152 to the Energizer portfolio Estimated Cost Synergies $15 34 2,3 — Strategic fit Implied EV / Adj. EBITDA 10.5x - 11.0x 75% Cash / ¡ Strong strategic fit with existing auto care Consideration Paid to SPB 25% Equity business in air fresheners and appearance 18 — Cash on Hand 95 ¡ Significant channel overlap with current battery and Debt 174 business — $312 Equity to 5 — Solidifies another platform for further growth SPB — ~$500 Equity ¡ Ability to increase international growth through Transaction Funding and/or Equity- 144 Energizer distribution network Linked 33 ¡ Ability to leverage Energizer’s marketing and Expected 34 R&D core competencies to accelerate Through Capital innovation Markets Expected Closing Q2 of FY2019 — Synergies of $15mm expected (~3% of net sales) 124 Run as a Standalone Segment within Spectrum will Make for an Easier Integration 175 40 1. US Only – NPD RTS+RTSX – CY2017 2. Represents FY2018 3. Represents transaction multiple based on current run-rate Adjusted EBITDA including synergies 9 4. Subject to adjustments 5. Number of shares to be determined based on 10-trading day VWAP prior to signing subject to adjustment

1 19 Pro Forma Business Mix Demonstrates Our Progress Towards 157 Becoming a Diversified Global Household Products Leader 235 FY2018 Energizer Net Sales by Product 245 Status Quo Pro Forma 145 30 Auto Hearing Aid Hearing Aid 5% 1% 6% Lights and Auto Other 20% Specialty 15% Batteries 186 61% 152 Batteries 34 79% Lights and Other Specialty 13% 18 FY2018 Energizer Net Sales by Geography 95 174 Status Quo Pro Forma Asia Pacific Asia Pacific 13% 16% 144 North EMEA 33 North America 16% EMEA America 57% 34 20% 62% Latin America Latin 9% America 7% 124 Latin America Battery Business roughly doubles from ~$118mm to ~$240mm in Net Sales 175 40 1. See “Presentation of Financial Information” on page 4 10 1 19 Pro Forma Business Mix Demonstrates Our Progress Towards 157 Becoming a Diversified Global Household Products Leader 235 FY2018 Energizer Net Sales by Product 245 Status Quo Pro Forma 145 30 Auto Hearing Aid Hearing Aid 5% 1% 6% Lights and Auto Other 20% Specialty 15% Batteries 186 61% 152 Batteries 34 79% Lights and Other Specialty 13% 18 FY2018 Energizer Net Sales by Geography 95 174 Status Quo Pro Forma Asia Pacific Asia Pacific 13% 16% 144 North EMEA 33 North America 16% EMEA America 57% 34 20% 62% Latin America Latin 9% America 7% 124 Latin America Battery Business roughly doubles from ~$118mm to ~$240mm in Net Sales 175 40 1. See “Presentation of Financial Information” on page 4 10

19 1 157 Pro Forma Financials – Key Highlights 235 — Acquisitions create opportunities to realize incremental revenue growth in addition to stated cost 245 synergies of $70mm-80mm expected 145 30 — Margin accretive with expected realization of synergies – Adjusted EBITDA margin improvement of ~300bps over next 3 full years 186 152 — Accelerating EPS accretion expected as synergies are achieved and debt is paid down 34 — Pro forma adjusted free cash flow of ~$340mm (including full run-rate synergies) expected – will 18 grow over time with debt pay down 95 174 — Ample free cash flow expected to maintain and continue to grow dividend 144 — Double digit pro forma free cash flow yield expected 33 34 — Pro forma leverage of ~5x – expected strong free cash flow generation allows for rapid deleveraging to ~3x within first 3 full years 124 175 40 1. See “Presentation of Financial Information” on page 4 11 19 1 157 Pro Forma Financials – Key Highlights 235 — Acquisitions create opportunities to realize incremental revenue growth in addition to stated cost 245 synergies of $70mm-80mm expected 145 30 — Margin accretive with expected realization of synergies – Adjusted EBITDA margin improvement of ~300bps over next 3 full years 186 152 — Accelerating EPS accretion expected as synergies are achieved and debt is paid down 34 — Pro forma adjusted free cash flow of ~$340mm (including full run-rate synergies) expected – will 18 grow over time with debt pay down 95 174 — Ample free cash flow expected to maintain and continue to grow dividend 144 — Double digit pro forma free cash flow yield expected 33 34 — Pro forma leverage of ~5x – expected strong free cash flow generation allows for rapid deleveraging to ~3x within first 3 full years 124 175 40 1. See “Presentation of Financial Information” on page 4 11

19 1 157 Pro Forma Financials – Key Metrics 235 Net Sales 245 ($ in Millions) 145 $2,778 30 $1,797 186 152 34 FY2018A FY2018PF 18 2,3 2,3 Adjusted EBITDA Adjusted Free Cash Flow 95 174 ($ in Millions) ($ in Millions) $658 $340 $238 $399 144 33 34 FY2018A FY2018PF FY2018A FY2018PF 124 Margin 22% ~24% 175 40 Source: Energizer internal financial statements and Spectrum Brands Management 1. See “Presentation of Financial Information” on page 4 2. Pro forma includes expected run-rate synergies 12 3. See Non-GAAP reconciliation in the appendix 19 1 157 Pro Forma Financials – Key Metrics 235 Net Sales 245 ($ in Millions) 145 $2,778 30 $1,797 186 152 34 FY2018A FY2018PF 18 2,3 2,3 Adjusted EBITDA Adjusted Free Cash Flow 95 174 ($ in Millions) ($ in Millions) $658 $340 $238 $399 144 33 34 FY2018A FY2018PF FY2018A FY2018PF 124 Margin 22% ~24% 175 40 Source: Energizer internal financial statements and Spectrum Brands Management 1. See “Presentation of Financial Information” on page 4 2. Pro forma includes expected run-rate synergies 12 3. See Non-GAAP reconciliation in the appendix

19 1 157 Pro Forma Energizer Comparison 235 PF Spectrum PF Spectrum Battery PF Spectrum Battery Ex. Divestiture + 245 2 3 4 (Original Transaction) Battery Ex. Divestiture Spectrum Auto Care 145 ($ in Millions) (3/31/2018) (9/30/2018) (9/30/2018) 30 Net Sales $2,663 $2,312 $2,778 Adjusted EBITDA $622 $544 $658 186 152 34 Estimated Run-Rate Synergies $90 $60 $75 Tax Asset $100 $110 $110 18 95 PF Total Leverage (Gross / Net) 4.9x / 4.4x 4.6x / 4.3x 4.7x / 4.4x 174 Incremental FCF in Excess of Status Quo $100 >$40 >$100 144 33 34 1. See “Presentation of Financial Information” on page 4 2. Utilizes original amounts presented in the Senior Note Offering Memorandum to finance Spectrum Battery acquisition. Adjusted EBITDA reflects 100% of expected run-rate synergies and is also used for PF Total Leverage calculation 3. Pro Forma Net Sales and Adjusted EBITDA reflects management’s current estimates of combined Net Sales and Adjusted EBITDA for the period ended 9/30/2018, excluding the divested business in Europe (assumed $550mm proceeds). Adjusted EBITDA reflects 100% of expected run-rate synergies and is also used for PF Total Leverage calculation 4. Pro Forma Net Sales and Adjusted EBITDA reflects management's current estimates of combined Net Sales and Adjusted EBITDA for the period ended 9/30/2018, including Spectrum’s 124 Auto Care business and excluding the divested business in Europe (assumed $550mm proceeds). Adjusted EBITDA reflects 100% of expected run-rate synergies and is also used for PF Total Leverage calculation. Pro Forma Leverage levels contemplate equity issued to Spectrum in addition to equity or equity linked securities to the public 175 40 13 19 1 157 Pro Forma Energizer Comparison 235 PF Spectrum PF Spectrum Battery PF Spectrum Battery Ex. Divestiture + 245 2 3 4 (Original Transaction) Battery Ex. Divestiture Spectrum Auto Care 145 ($ in Millions) (3/31/2018) (9/30/2018) (9/30/2018) 30 Net Sales $2,663 $2,312 $2,778 Adjusted EBITDA $622 $544 $658 186 152 34 Estimated Run-Rate Synergies $90 $60 $75 Tax Asset $100 $110 $110 18 95 PF Total Leverage (Gross / Net) 4.9x / 4.4x 4.6x / 4.3x 4.7x / 4.4x 174 Incremental FCF in Excess of Status Quo $100 >$40 >$100 144 33 34 1. See “Presentation of Financial Information” on page 4 2. Utilizes original amounts presented in the Senior Note Offering Memorandum to finance Spectrum Battery acquisition. Adjusted EBITDA reflects 100% of expected run-rate synergies and is also used for PF Total Leverage calculation 3. Pro Forma Net Sales and Adjusted EBITDA reflects management’s current estimates of combined Net Sales and Adjusted EBITDA for the period ended 9/30/2018, excluding the divested business in Europe (assumed $550mm proceeds). Adjusted EBITDA reflects 100% of expected run-rate synergies and is also used for PF Total Leverage calculation 4. Pro Forma Net Sales and Adjusted EBITDA reflects management's current estimates of combined Net Sales and Adjusted EBITDA for the period ended 9/30/2018, including Spectrum’s 124 Auto Care business and excluding the divested business in Europe (assumed $550mm proceeds). Adjusted EBITDA reflects 100% of expected run-rate synergies and is also used for PF Total Leverage calculation. Pro Forma Leverage levels contemplate equity issued to Spectrum in addition to equity or equity linked securities to the public 175 40 13

Order of Transactions and Sources & Uses Transaction Expected Closing Sources & Uses Sources $ % Cash on Hand $332 12% New Term Loan B 1,000 36% New Term Loan A 200 7% 6.375% Senior Notes Due 2026 500 18% 4.375% EUR Senior Notes Due 2026 770 27% Full Spectrum Battery Beginning of Total Sources $2,802 100% Step 1 Step 1 Business Q1 CY 2019 Uses $ % Purchase Price $2,000 71% Refinance Existing Credit Agreement 627 22% Estimated Fees & Expenses 175 6% Total Uses $2,802 100% Sources $ % New Senior Notes $600 42% Equity to Spectrum 312 22% Equity Through Capital Markets 500 35% Total Sources $1,412 100% Spectrum Auto Care Early Q1 CY 2019 Step 2 Step 2 Uses $ % (1) Business Purchase Price $1,250 89% Cash to the Balance Sheet 27 2% Estimated Fees & Expenses 85 6% Other 50 4% Total Uses $1,412 100% Sources $ % (2) Divestiture Proceeds $550 100% Total Sources $550 100% Divestment of VARTA By Q2 CY 2019 Step 3 Step 3 (3) Uses $% Europe Term Loan B $458 83% Term Loan A 92 17% Total Uses $550 100% 1. Subject to adjustments 2. Assumes no tax leakage on divestiture. See “Presentation of Financial Information” on page 4 14 3. Excludes fees & expensesOrder of Transactions and Sources & Uses Transaction Expected Closing Sources & Uses Sources $ % Cash on Hand $332 12% New Term Loan B 1,000 36% New Term Loan A 200 7% 6.375% Senior Notes Due 2026 500 18% 4.375% EUR Senior Notes Due 2026 770 27% Full Spectrum Battery Beginning of Total Sources $2,802 100% Step 1 Step 1 Business Q1 CY 2019 Uses $ % Purchase Price $2,000 71% Refinance Existing Credit Agreement 627 22% Estimated Fees & Expenses 175 6% Total Uses $2,802 100% Sources $ % New Senior Notes $600 42% Equity to Spectrum 312 22% Equity Through Capital Markets 500 35% Total Sources $1,412 100% Spectrum Auto Care Early Q1 CY 2019 Step 2 Step 2 Uses $ % (1) Business Purchase Price $1,250 89% Cash to the Balance Sheet 27 2% Estimated Fees & Expenses 85 6% Other 50 4% Total Uses $1,412 100% Sources $ % (2) Divestiture Proceeds $550 100% Total Sources $550 100% Divestment of VARTA By Q2 CY 2019 Step 3 Step 3 (3) Uses $% Europe Term Loan B $458 83% Term Loan A 92 17% Total Uses $550 100% 1. Subject to adjustments 2. Assumes no tax leakage on divestiture. See “Presentation of Financial Information” on page 4 14 3. Excludes fees & expenses

19 157 Anticipated Key Milestones 235 — Merger notification on Form CO filed with 245 — Spectrum Battery European Commission acquisition expected to 145 (“EC”) – Oct. 19, 2018 close – Beginning of Q1 30 — Sale of Europe based CY 2019 — Remedy Proposal on Battery Varta Consumer Battery Form RM filed with EC – — Buyer expected to be business expected to Acquisition Nov. 20, 2018 identified for the Europe close – Q2 CY 2019 based Varta Consumer — Decision expected from 186 Battery business – Q1 EC on Form CO and 152 CY 2019 Form RM – Dec. 11, 34 2018 Q4 Q1 Q2 CY18 CY19 CY19 18 95 174 — Financing expected to be finalized for Spectrum Auto Care acquisition – Early Q1 Auto Care CY 2019 144 Acquisition — Spectrum Auto Care 33 acquisition expected to 34 close – Early Q1 CY 1 2019 124 175 40 1. Expect Battery deal to close before Auto Care deal 15 19 157 Anticipated Key Milestones 235 — Merger notification on Form CO filed with 245 — Spectrum Battery European Commission acquisition expected to 145 (“EC”) – Oct. 19, 2018 close – Beginning of Q1 30 — Sale of Europe based CY 2019 — Remedy Proposal on Battery Varta Consumer Battery Form RM filed with EC – — Buyer expected to be business expected to Acquisition Nov. 20, 2018 identified for the Europe close – Q2 CY 2019 based Varta Consumer — Decision expected from 186 Battery business – Q1 EC on Form CO and 152 CY 2019 Form RM – Dec. 11, 34 2018 Q4 Q1 Q2 CY18 CY19 CY19 18 95 174 — Financing expected to be finalized for Spectrum Auto Care acquisition – Early Q1 Auto Care CY 2019 144 Acquisition — Spectrum Auto Care 33 acquisition expected to 34 close – Early Q1 CY 1 2019 124 175 40 1. Expect Battery deal to close before Auto Care deal 15

19 1 157 Pro Forma Total Leverage Over Time 235 245 Gross Debt to Adjusted EBITDA — Expected pro forma 145 adjusted free cash flow of 30 ~$340mm (including full run-rate synergies) supports significant annual 4.7x 186 debt pay down 152 34 — Expect leverage level of ~3x by FY2022E given debt 3.1x ~3x repayment and growth in 18 Adjusted EBITDA as 95 synergies are realized 174 144 33 34 2 Standalone At Close / Divest End FY2022E 124 175 40 1. See “Non-GAAP Financial Measures” on page 3 and “Presentation of Financial Information” on page 4 2. Pro Forma Adjusted EBITDA used for leverage calculation At Close / Divest reflects management's current estimates of combined Adjusted EBITDA for the period ended 9/30/2018, including Spectrum’s Battery and Auto Care businesses and excluding the divested business in Europe ($550mm proceeds). Pro Forma Adjusted EBITDA reflects 100% run-rate synergies. 16 Leverage levels contemplate equity issued to Spectrum in addition to equity or equity linked securities to the public 19 1 157 Pro Forma Total Leverage Over Time 235 245 Gross Debt to Adjusted EBITDA — Expected pro forma 145 adjusted free cash flow of 30 ~$340mm (including full run-rate synergies) supports significant annual 4.7x 186 debt pay down 152 34 — Expect leverage level of ~3x by FY2022E given debt 3.1x ~3x repayment and growth in 18 Adjusted EBITDA as 95 synergies are realized 174 144 33 34 2 Standalone At Close / Divest End FY2022E 124 175 40 1. See “Non-GAAP Financial Measures” on page 3 and “Presentation of Financial Information” on page 4 2. Pro Forma Adjusted EBITDA used for leverage calculation At Close / Divest reflects management's current estimates of combined Adjusted EBITDA for the period ended 9/30/2018, including Spectrum’s Battery and Auto Care businesses and excluding the divested business in Europe ($550mm proceeds). Pro Forma Adjusted EBITDA reflects 100% run-rate synergies. 16 Leverage levels contemplate equity issued to Spectrum in addition to equity or equity linked securities to the public

19 157 Integration Planning Well Underway 235 — Spectrum Battery integration in 245 advanced stages – planning 145 30 started when deal announced in Jan 2018 — Disciplined planning is expected 186 — Single seller creates shared to lead to strong execution by: 152 34 integration activities (e.g. governance, processes, ¡ Minimizing disruption and risk functional areas – finance, legal, 18 IT, HR, etc.) 95 ¡ Creating a smooth transition 174 and continuity — Spectrum Auto Care is a standalone business unit ¡ Maximizing value creation 144 33 — Learnings from Spectrum Battery 34 integration work have been incorporated into early Spectrum Auto Care plans 124 175 40 17 19 157 Integration Planning Well Underway 235 — Spectrum Battery integration in 245 advanced stages – planning 145 30 started when deal announced in Jan 2018 — Disciplined planning is expected 186 — Single seller creates shared to lead to strong execution by: 152 34 integration activities (e.g. governance, processes, ¡ Minimizing disruption and risk functional areas – finance, legal, 18 IT, HR, etc.) 95 ¡ Creating a smooth transition 174 and continuity — Spectrum Auto Care is a standalone business unit ¡ Maximizing value creation 144 33 — Learnings from Spectrum Battery 34 integration work have been incorporated into early Spectrum Auto Care plans 124 175 40 17

19 157 235 245 145 30 186 152 34 Appendix 18 95 174 144 33 34 124 175 40 19 157 235 245 145 30 186 152 34 Appendix 18 95 174 144 33 34 124 175 40

19 1 Pro Forma Reconciliations 157 235 FY 2018 Net Sales 245 145 Energizer $ 1,797 30 Spectrum's Battery Business 515 Spectrum's Auto Care Business 466 Pro Forma FY2018 Net Sales $ 2,778 186 152 FY 2018 Adjusted 34 EBITDA 2 Energizer $ 399 Spectrum's Battery Business 85 Spectrum's Auto Care Business 99 18 Spectrum's Battery Business Synergies 60 95 Spectrum's Auto Care Business Synergies 15 174 Pro Forma FY2018 Adjusted EBITDA $ 658 144 FY 2018 Adjusted 33 Free Cash Flow 34 3 Energizer $ 238 Spectrum Battery and Auto Care Businesses 102 Pro Forma FY2018 Adjusted Free Cash Flow $ 340 124 175 40 Note: All amounts in millions 1. See “Presentation of Financial Information” on page 4 2. See page 20 19 3. See page 21 19 1 Pro Forma Reconciliations 157 235 FY 2018 Net Sales 245 145 Energizer $ 1,797 30 Spectrum's Battery Business 515 Spectrum's Auto Care Business 466 Pro Forma FY2018 Net Sales $ 2,778 186 152 FY 2018 Adjusted 34 EBITDA 2 Energizer $ 399 Spectrum's Battery Business 85 Spectrum's Auto Care Business 99 18 Spectrum's Battery Business Synergies 60 95 Spectrum's Auto Care Business Synergies 15 174 Pro Forma FY2018 Adjusted EBITDA $ 658 144 FY 2018 Adjusted 33 Free Cash Flow 34 3 Energizer $ 238 Spectrum Battery and Auto Care Businesses 102 Pro Forma FY2018 Adjusted Free Cash Flow $ 340 124 175 40 Note: All amounts in millions 1. See “Presentation of Financial Information” on page 4 2. See page 20 19 3. See page 21
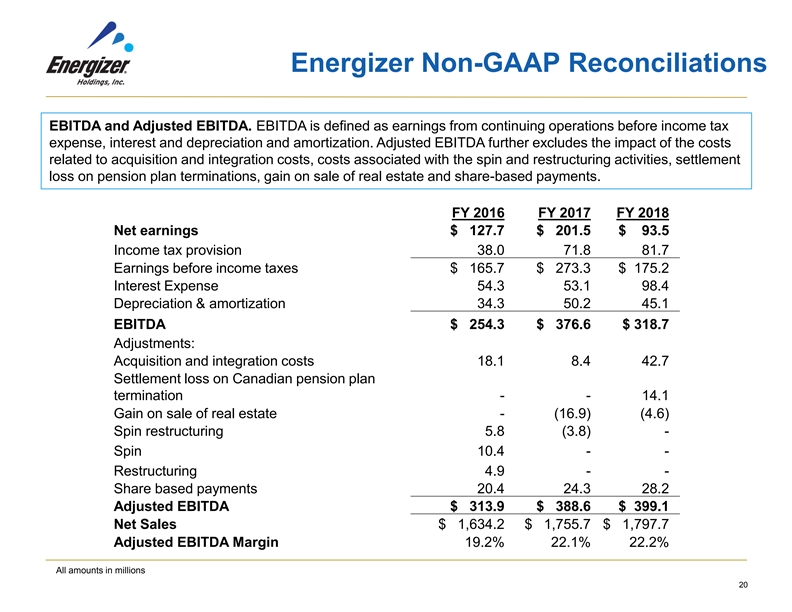
19 157 Energizer Non-GAAP Reconciliations 235 EBITDA and Adjusted EBITDA. EBITDA is defined as earnings from continuing operations before income tax expense, interest and depreciation and amortization. Adjusted EBITDA further excludes the impact of the costs 245 related to acquisition and integration costs, costs associated with the spin and restructuring activities, settlement 145 loss on pension plan terminations, gain on sale of real estate and share-based payments. 30 FY 2016 FY 2017 FY 2018 Net earnings $ 127.7 $ 201.5 $ 93.5 186 Income tax provision 38.0 71.8 81.7 152 Earnings before income taxes $ 165.7 $ 273.3 $ 175.2 34 Interest Expense 54.3 53.1 98.4 Depreciation & amortization 34.3 50.2 45.1 EBITDA $ 254.3 $ 376.6 $ 318.7 18 Adjustments: 95 Acquisition and integration costs 18.1 8.4 42.7 174 Settlement loss on Canadian pension plan termination - - 14.1 Gain on sale of real estate - (16.9) (4.6) Spin restructuring 5.8 (3.8) - 144 Spin 10.4 - - 33 34 Restructuring 4.9 - - Share based payments 20.4 24.3 28.2 Adjusted EBITDA $ 313.9 $ 388.6 $ 399.1 Net Sales $ 1,634.2 $ 1,755.7 $ 1,797.7 124 Adjusted EBITDA Margin 19.2% 22.1% 22.2% 175 40 All amounts in millions 6 20 19 157 Energizer Non-GAAP Reconciliations 235 EBITDA and Adjusted EBITDA. EBITDA is defined as earnings from continuing operations before income tax expense, interest and depreciation and amortization. Adjusted EBITDA further excludes the impact of the costs 245 related to acquisition and integration costs, costs associated with the spin and restructuring activities, settlement 145 loss on pension plan terminations, gain on sale of real estate and share-based payments. 30 FY 2016 FY 2017 FY 2018 Net earnings $ 127.7 $ 201.5 $ 93.5 186 Income tax provision 38.0 71.8 81.7 152 Earnings before income taxes $ 165.7 $ 273.3 $ 175.2 34 Interest Expense 54.3 53.1 98.4 Depreciation & amortization 34.3 50.2 45.1 EBITDA $ 254.3 $ 376.6 $ 318.7 18 Adjustments: 95 Acquisition and integration costs 18.1 8.4 42.7 174 Settlement loss on Canadian pension plan termination - - 14.1 Gain on sale of real estate - (16.9) (4.6) Spin restructuring 5.8 (3.8) - 144 Spin 10.4 - - 33 34 Restructuring 4.9 - - Share based payments 20.4 24.3 28.2 Adjusted EBITDA $ 313.9 $ 388.6 $ 399.1 Net Sales $ 1,634.2 $ 1,755.7 $ 1,797.7 124 Adjusted EBITDA Margin 19.2% 22.1% 22.2% 175 40 All amounts in millions 6 20

19 157 Energizer FY 2018 Non-GAAP Reconciliations 235 245 Free Cash Flow. Free Cash Flow is defined as net cash provided by operating activities reduced 145 by capital expenditures, net of the proceeds from asset sales. 30 Adjusted Free Cash Flow is defined as Free Cash Flow excluding the cash payments for acquisition and integration costs. These cash payments are net of the statutory tax benefit associated with the payment. 186 152 34 Net cash from operating activities $ 228.7 Capital expenditures (24.2) Proceeds from sale of assets 6.1 18 Free Cash Flow $ 210.6 95 174 Acquisition and integration related payments 27.2 Adjusted Free Cash Flow $ 237.8 144 33 34 124 175 40 All amounts in millions 6 21 19 157 Energizer FY 2018 Non-GAAP Reconciliations 235 245 Free Cash Flow. Free Cash Flow is defined as net cash provided by operating activities reduced 145 by capital expenditures, net of the proceeds from asset sales. 30 Adjusted Free Cash Flow is defined as Free Cash Flow excluding the cash payments for acquisition and integration costs. These cash payments are net of the statutory tax benefit associated with the payment. 186 152 34 Net cash from operating activities $ 228.7 Capital expenditures (24.2) Proceeds from sale of assets 6.1 18 Free Cash Flow $ 210.6 95 174 Acquisition and integration related payments 27.2 Adjusted Free Cash Flow $ 237.8 144 33 34 124 175 40 All amounts in millions 6 21