Attached files
| file | filename |
|---|---|
| 8-K - WIRELESS TELECOM GROUP INC | c92378_8k.htm |
Exhibit 99.1
ENABLING THE WIRELESS FUTURE November 20, 2018

2 Executive Summary 2 ▪ Wireless Telecom Group enables the development, testing and deployment of specialized wireless communications. ▪ S pecialty RF platform with multiple segments, brands and solutions ▪ T rusted , approved solutions provider to demanding top tier customers including carriers, tower companies, military / government, prime defense contractors, aerospace and satellite communications companies ▪ Addressing macro growth trends in wireless connectivity impacting multiple industries ▪ Well - known , tenured and trusted brands, long - term customer relationships, and an embedded base of sticky solutions
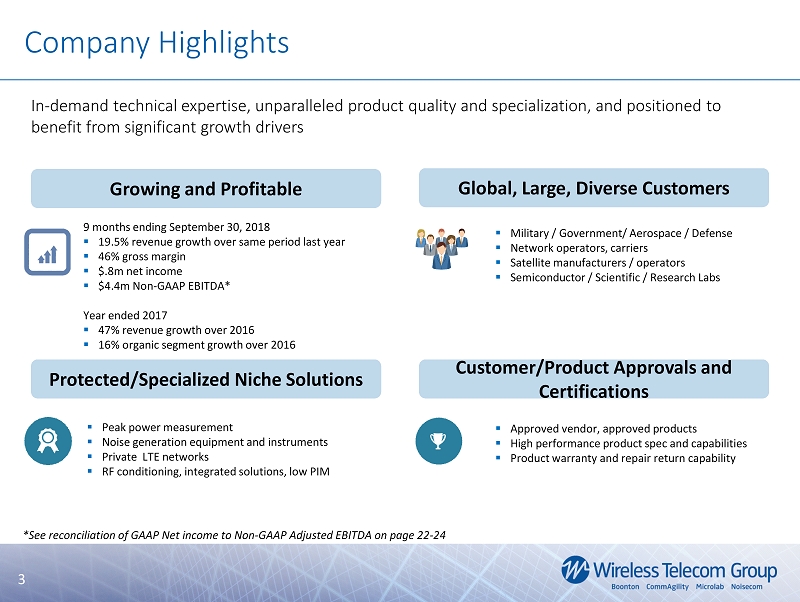
3 I n - demand technical expertise, unparalleled product quality and specialization, and positioned to benefit from significant growth drivers ▪ Approved vendor, approved products ▪ High performance product spec and capabilities ▪ Product warranty and repair return capability ▪ Peak power measurement ▪ Noise generation equipment and instruments ▪ Private LTE networks ▪ RF conditioning, integrated solutions, low PIM ▪ Military / Government/ Aerospace / Defense ▪ Network operators, carriers ▪ Satellite manufacturers / operators ▪ Semiconductor / Scientific / Research Labs 9 months ending September 30, 2018 ▪ 19.5% revenue growth over same period last year ▪ 46% gross margin ▪ $.8m net income ▪ $4.4m Non - GAAP EBITDA* Year ended 2017 ▪ 47 % revenue growth over 2016 ▪ 16 % organic segment growth over 2016 Growing and Profitable Global, Large, Diverse Customers Protected/Specialized N iche S olutions Customer/Product Approvals and Certifications Company Highlights 3 *See reconciliation of GAAP Net income to Non - GAAP Adjusted EBITDA on page 22 - 24
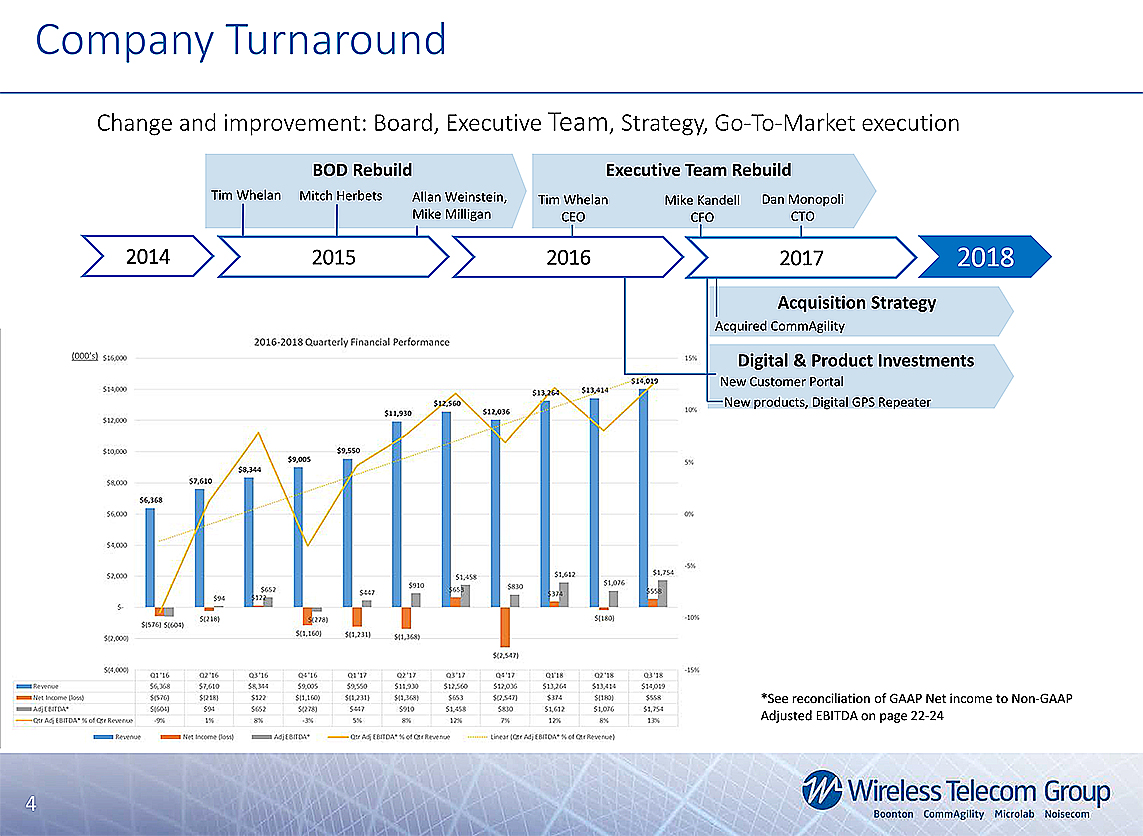
4 4 C hange and improvement: Board, E xecutive T eam , Strategy , Go - To - Market execution Company Turnaround 4 BOD Rebuild Tim Whelan Mitch Herbets Allan Weinstein, Mike Milligan 2014 Executive Team Rebuild Tim Whelan CEO Mike Kandell CFO Dan Monopoli CTO Acquisition Strategy Acquired CommAgility Digital & Product Investments 2018 New Customer Portal New products, Digital GPS Repeater 2015 2017 2016 *See reconciliation of GAAP Net income to Non - GAAP Adjusted EBITDA on page 22 - 24 (000’s)
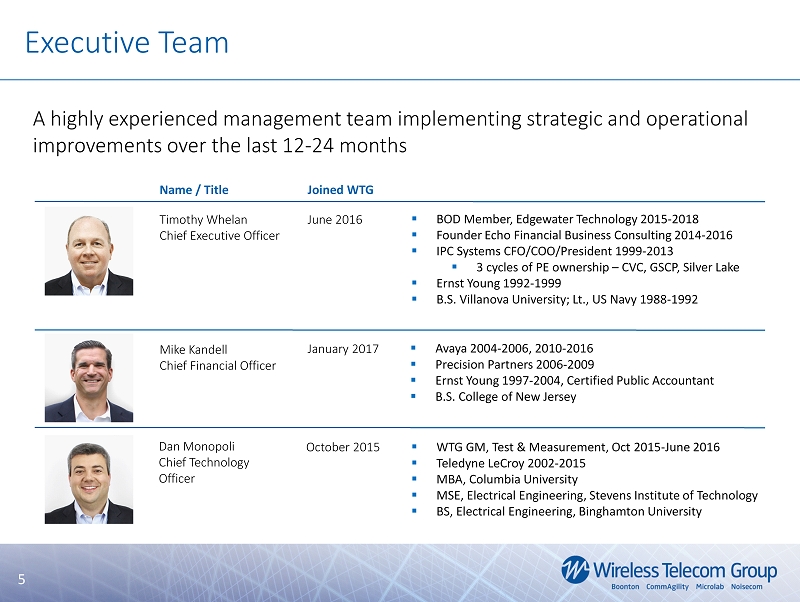
5 ▪ BOD Member, Edgewater Technology 2015 - 2018 ▪ Founder Echo Financial Business Consulting 2014 - 2016 ▪ IPC Systems CFO/COO/President 1999 - 2013 ▪ 3 cycles of PE ownership – CVC, GSCP, Silver Lake ▪ Ernst Young 1992 - 1999 ▪ B.S . Villanova University; Lt., US Navy 1988 - 1992 Name / Title Joined WTG Timothy Whelan Chief Executive Officer Mike Kandell Chief Financial Officer Dan Monopoli Chief Technology Officer June 2016 October 2015 January 2017 A highly experienced management team implementing strategic and operational improvements over the last 12 - 24 months ▪ Avaya 2004 - 2006, 2010 - 2016 ▪ Precision Partners 2006 - 2009 ▪ Ernst Young 1997 - 2004, Certified Public Accountant ▪ B.S. College of New Jersey ▪ WTG GM, Test & Measurement, Oct 2015 - June 2016 ▪ Teledyne LeCroy 2002 - 2015 ▪ MBA, Columbia University ▪ MSE, Electrical Engineering, Stevens Institute of Technology ▪ BS, Electrical Engineering, Binghamton University Executive Team 5
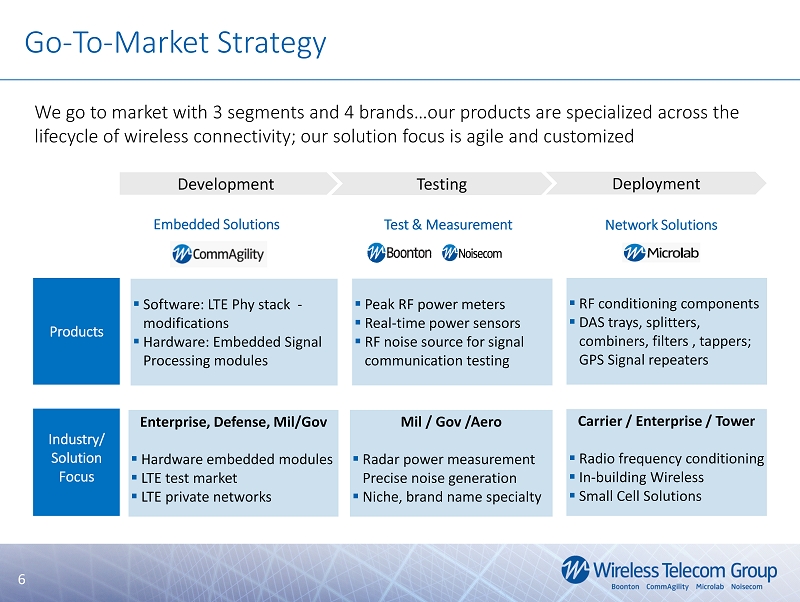
6 Network Solutions Test & Measurement Embedded Solutions ▪ RF conditioning components ▪ DAS trays, splitters, combiners, filters , tappers; GPS Signal repeaters Industry / Solution Focus Products ▪ Peak RF power meters ▪ Real - time power sensors ▪ RF noise source for signal communication testing ▪ Software: LTE Phy stack - modifications ▪ Hardware: Embedded Signal Processing modules Carrier / Enterprise / Tower ▪ Radio frequency conditioning ▪ In - building Wireless ▪ Small Cell Solutions Mil / Gov /Aero ▪ Radar power measurement Precise noise generation ▪ Niche , brand name specialty Enterprise, Defense, Mil/ Gov ▪ Hardware embedded modules ▪ LTE test market ▪ LTE private networks We go to market with 3 segments and 4 brands…our products are specialized across the lifecycle of wireless connectivity; our solution focus is agile and customized Development Testing Deployment Go - To - Market Strategy 6
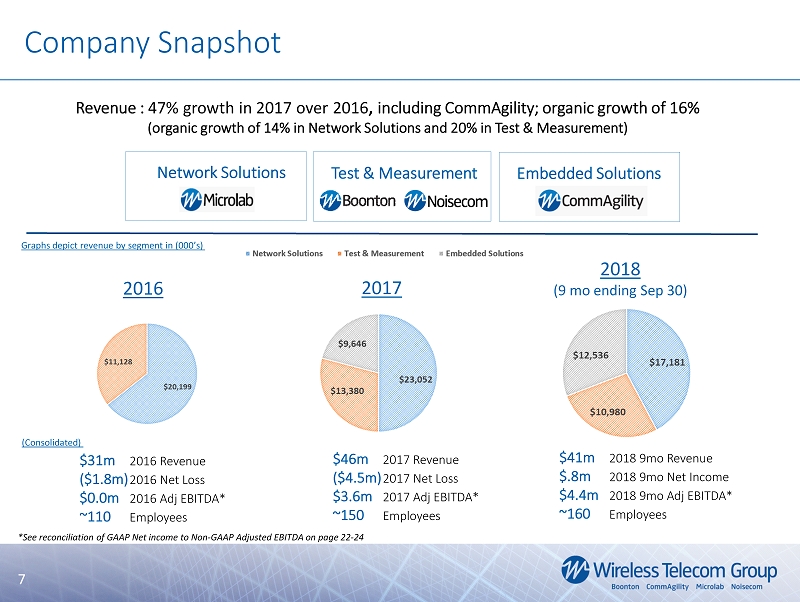
7 Revenue : 47% growth in 2017 over 2016 , including CommAgility; organic growth of 16% (organic growth of 14% in Network Solutions and 20% in Test & Measurement) $46m 2017 Revenue ($4.5m) 2017 Net Loss $ 3.6m 2017 Adj EBITDA* ~150 Employees Network Solutions $31m 2016 Revenue ($1.8m) 2016 Net Loss $0.0m 2016 Adj EBITDA* ~110 Employees Company Snapshot Test & Measurement Embedded Solutions 7 *See reconciliation of GAAP Net income to Non - GAAP Adjusted EBITDA on page 22 - 24 2016 2017 2018 (9 mo ending Sep 30) $41m 2018 9mo Revenue $. 8 m 2018 9mo Net Income $4.4m 2018 9mo Adj EBITDA* ~ 160 Employees Graphs depict revenue by segment in (000’s) (Consolidated)
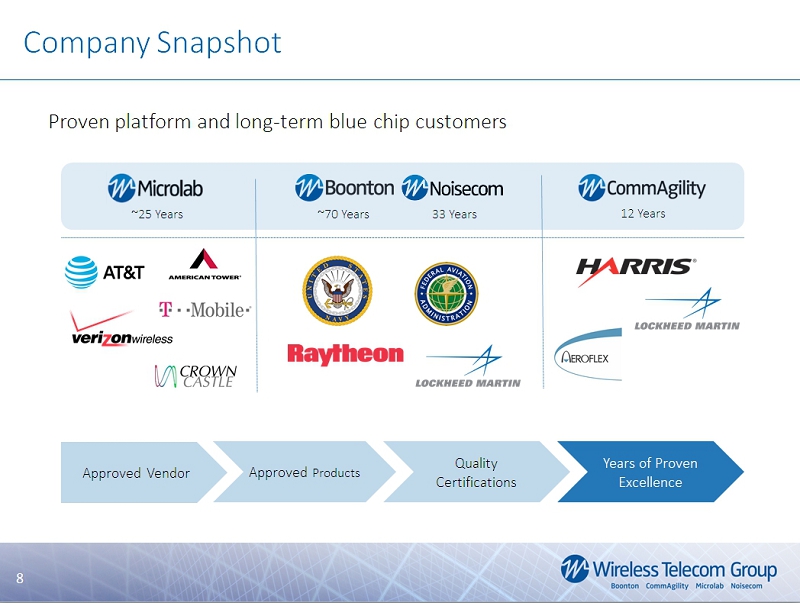
8 8 Proven platform and long - term blue chip customers Approved Vendor Approved Products Quality Certifications Years of Proven E xcellence Company Snapshot 8 ~25 Years ~70 Years 33 Years 12 Years
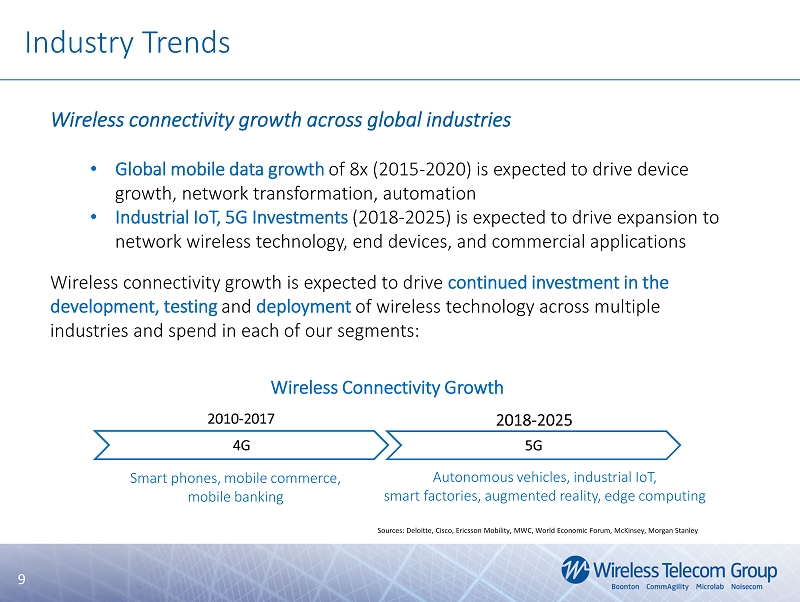
9 Industry Trends Sources: Deloitte, Cisco, Ericsson Mobility, MWC, World Economic Forum, McKinsey, Morgan Stanley Wireless connectivity growth across global industries • Global mobile data growth of 8x (2015 - 2020) is expected to drive device growth, network transformation, automation • Industrial IoT , 5G Investments ( 2018 - 2025) is expected to drive expansion to network wireless technology, end devices, and commercial applications Wireless connectivity growth is expected to drive continued investment in the development, testing and deployment of wireless technology across multiple industries and spend in each of our segments: Smart phones, mobile commerce , mobile banking Autonomous vehicles, industrial IoT, smart factories, augmented reality, edge computing 9 2010 - 2017 2018 - 2025 4G 5G Wireless Connectivity G rowth 4G 5G
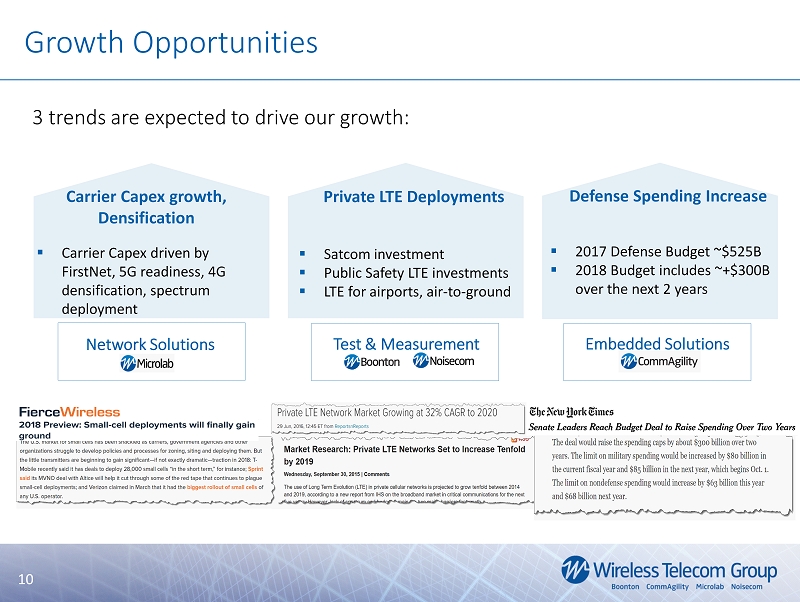
10 ▪ Satcom investment ▪ Public Safety LTE investments ▪ LTE for airports, air - to - ground ▪ 2017 Defense Budget ~$525B ▪ 2018 Budget includes ~+$300B over the next 2 years 3 trends are expected to drive our growth: ▪ Carrier Capex driven by FirstNet, 5G readiness, 4G densification, spectrum deployment Growth Opportunities Carrier Capex growth, Densification Private LTE Deployments Defense Spending Increase 10 Network Solutions Test & Measurement Embedded Solutions
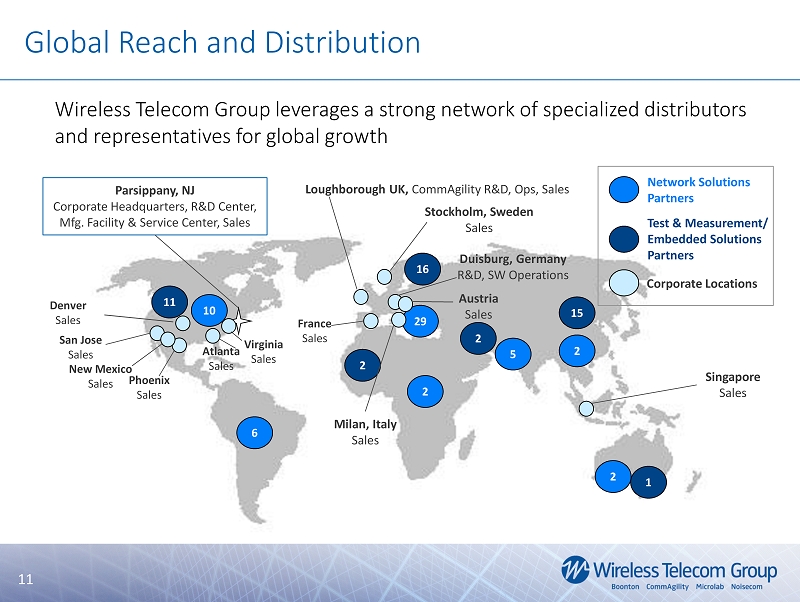
11 Stockholm, Sweden Sales Singapore Sales Parsippany, NJ Corporate Headquarters, R&D Center, Mfg. Facility & Service Center, Sales Denver Sales Wireless Telecom Group leverages a strong network of specialized distributors and representatives for global growth 2 15 1 2 2 16 11 5 29 2 2 6 10 Network Solutions Partners Corporate Locations Test & Measurement/ Embedded Solutions Partners France Sales Loughborough UK, CommAgility R&D, Ops, Sales Milan, Italy Sales Duisburg, Germany R&D, SW Operations San Jose Sales Phoenix Sales Atlanta Sales Virginia Sales New Mexico Sales Austria Sales Global Reach and Distribution 11
12 Product Offerings Overview 12
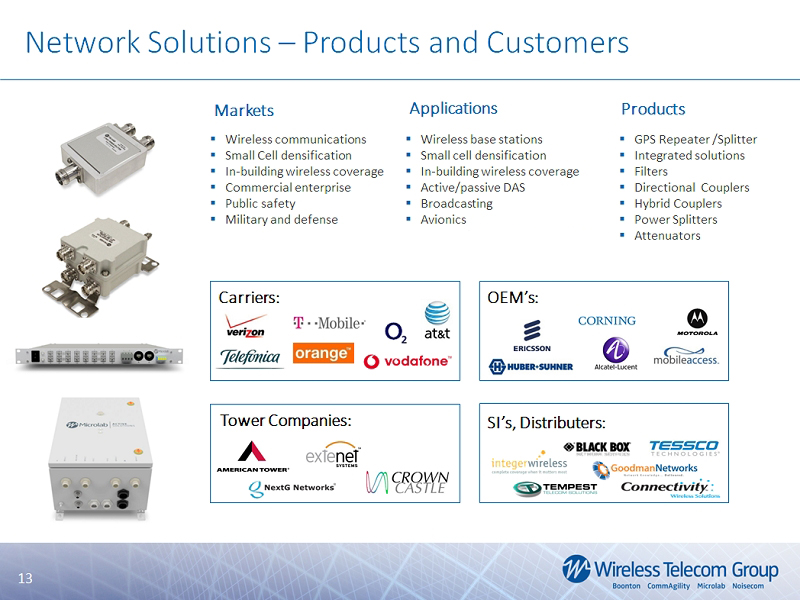
13 ▪ Wireless communications ▪ Small Cell densification ▪ In - building wireless coverage ▪ Commercial enterprise ▪ Public safety ▪ Military and defense ▪ Wireless base stations ▪ Small cell densification ▪ In - building wireless coverage ▪ Active/passive DAS ▪ Broadcasting ▪ Avionics ▪ GPS Repeater /Splitter ▪ Integrated solutions ▪ Filters ▪ Directional Couplers ▪ Hybrid Couplers ▪ Power Splitters ▪ Attenuators Markets Applications Products Network Solutions – Products and Customers Carriers: Tower Companies: OEM’s: SI’s, Distributers: 13
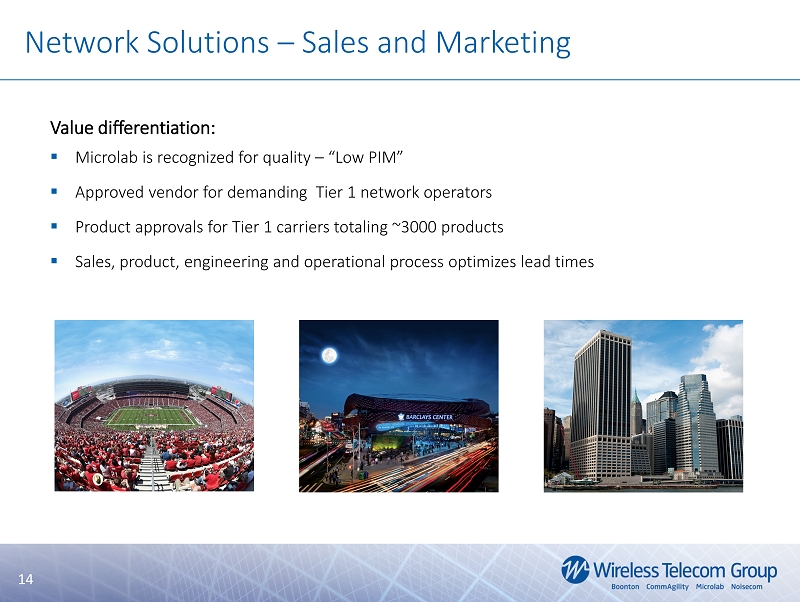
14 Value differentiation: ▪ Microlab is recognized for quality – “Low PIM ” ▪ Approved vendor for demanding Tier 1 network operators ▪ Product approvals for Tier 1 carriers totaling ~3000 products ▪ Sales, product, engineering and operational process optimizes lead times Network Solutions – Sales and Marketing 14

15 Military/Government: Commercial Communications: Aerospace/Prime Defense: RF Semiconductor/Components: Test & Measurement – Products and Customers ▪ Commercial Communications ▪ Military/Aerospace ▪ Avionics ▪ Scientific Research Labs ▪ Satellite Communications ▪ Manufacturing/Production Test ▪ Automated Test ▪ Radar modules and systems ▪ Medical devices ▪ RF semiconductors ▪ Jamming and electronic warfare ▪ Receiver calibration ▪ Noise figure measurement ▪ Millimeter wave technology ▪ Flight readiness ▪ Automotive radar ▪ WiFi and LTE ▪ Peak power meters ▪ Real - time power sensors ▪ Connected power sensors ▪ Modulation meters ▪ Audio analyzers ▪ Noise generators ▪ Calibrated noise sources ▪ Noise diodes & modules ▪ Jitter generators ▪ Noise standards Markets Applications Products 15

16 Value differentiation: Boonton ▪ 70 years of brand recognition with loyal installed base ▪ Industry leadership in RF Peak and pulse measurement ▪ Spec and performance leadership in next generation power measurement Noisecom ▪ Custom products/systems developed with significant customer input, high customer satisfaction ▪ Ground up offering from diodes to integrated systems Test & Measurement – Sales & Marketing 16

17 Commercial/Private Networks: Research/Small Cell Development: ▪ Commercial Communications ▪ Satellite Communications ▪ Military/Aerospace ▪ Avionics ▪ 5G Research ▪ Production test environments ▪ Transportation, air - to - ground ▪ Maritime Satcom ▪ Industrial IoT – Mining ▪ Tunnel transportation ▪ Small Cell development ▪ Mobile PHY/Stack ▪ Small Cell PHY ▪ Small Cell Stack ▪ LTE Reference eNodeB ▪ FPGA/DSP ▪ Baseband processing/RF cards Markets Applications Products Embedded Solutions – Products and Customers 17
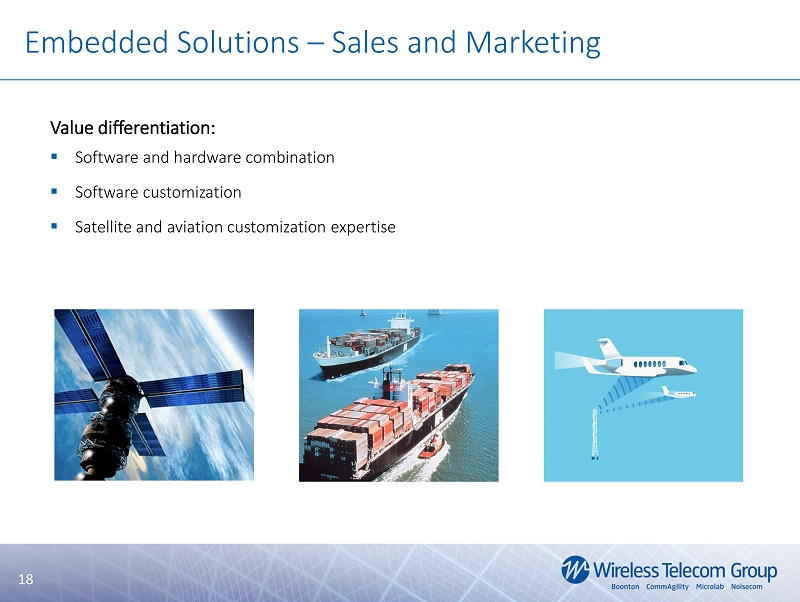
18 Embedded Solutions – Sales and Marketing Value differentiation: ▪ Software and hardware combination ▪ Software customization ▪ Satellite and aviation customization expertise 18
19 Financials 19
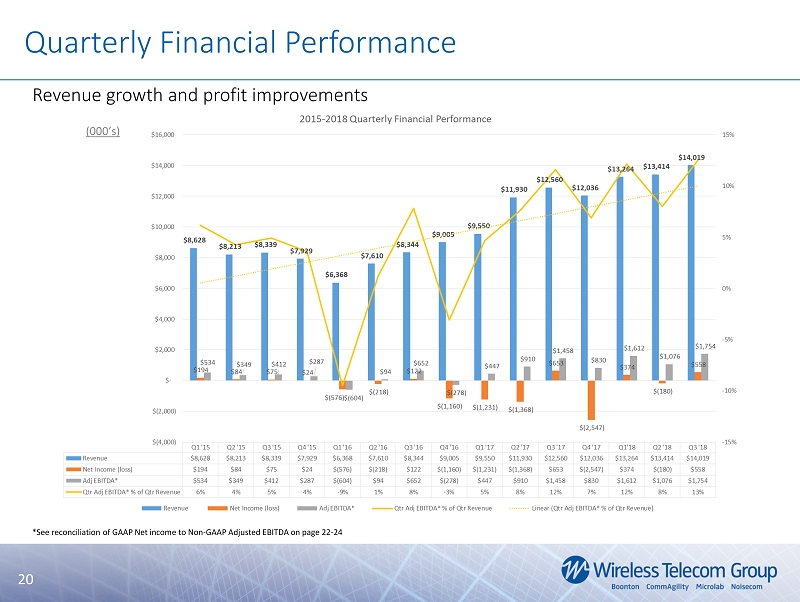
20 R evenue growth and profit improvements Quarterly Financial Performance 20 *See reconciliation of GAAP Net income to Non - GAAP Adjusted EBITDA on page 22 - 24 (000’s)
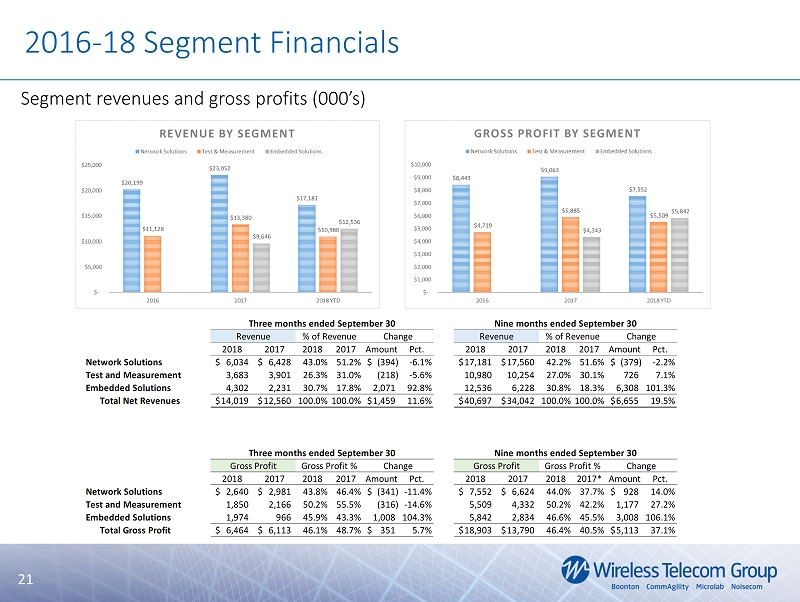
21 Segment revenues and gross profits (000’s) 2016 - 18 Segment Financials 21 2018 2017 2018 2017 Amount Pct. 2018 2017 2018 2017 Amount Pct. Network Solutions 6,034$ 6,428$ 43.0% 51.2% (394)$ -6.1% 17,181$ 17,560$ 42.2% 51.6% (379)$ -2.2% Test and Measurement 3,683 3,901 26.3% 31.0% (218) -5.6% 10,980 10,254 27.0% 30.1% 726 7.1% Embedded Solutions 4,302 2,231 30.7% 17.8% 2,071 92.8% 12,536 6,228 30.8% 18.3% 6,308 101.3% Total Net Revenues 14,019$ 12,560$ 100.0%100.0% 1,459$ 11.6% 40,697$ 34,042$ 100.0%100.0% 6,655$ 19.5% 2018 2017 2018 2017 Amount Pct. 2018 2017 2018 2017* Amount Pct. Network Solutions 2,640$ 2,981$ 43.8% 46.4% (341)$ -11.4% 7,552$ 6,624$ 44.0% 37.7% 928$ 14.0% Test and Measurement 1,850 2,166 50.2% 55.5% (316) -14.6% 5,509 4,332 50.2% 42.2% 1,177 27.2% Embedded Solutions 1,974 966 45.9% 43.3% 1,008 104.3% 5,842 2,834 46.6% 45.5% 3,008 106.1% Total Gross Profit 6,464$ 6,113$ 46.1% 48.7% 351$ 5.7% 18,903$ 13,790$ 46.4% 40.5% 5,113$ 37.1% Gross Profit Gross Profit % Change Nine months ended September 30 Revenue % of Revenue Change Nine months ended September 30 Gross Profit Gross Profit % Change Three months ended September 30 Revenue % of Revenue Change Three months ended September 30
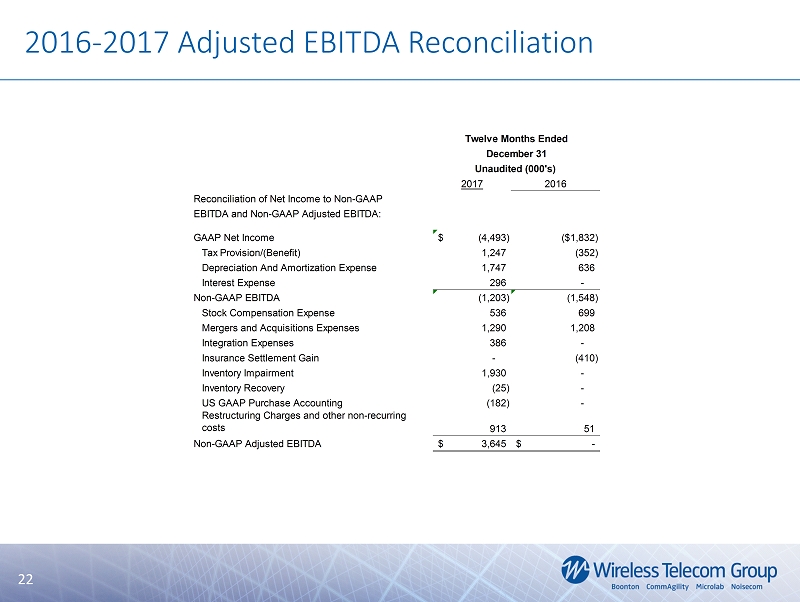
22 2017 2016 Reconciliation of Net Income to Non-GAAP EBITDA and Non-GAAP Adjusted EBITDA: GAAP Net Income (4,493)$ ($1,832) Tax Provision/(Benefit) 1,247 (352) Depreciation And Amortization Expense 1,747 636 Interest Expense 296 - Non-GAAP EBITDA (1,203) (1,548) Stock Compensation Expense 536 699 Mergers and Acquisitions Expenses 1,290 1,208 Integration Expenses 386 - Insurance Settlement Gain - (410) Inventory Impairment 1,930 - Inventory Recovery (25) - US GAAP Purchase Accounting (182) - Restructuring Charges and other non-recurring costs 913 51 Non-GAAP Adjusted EBITDA 3,645$ -$ Unaudited (000’s) Twelve Months Ended December 31 2016 - 2017 Adjusted EBITDA Reconciliation 22
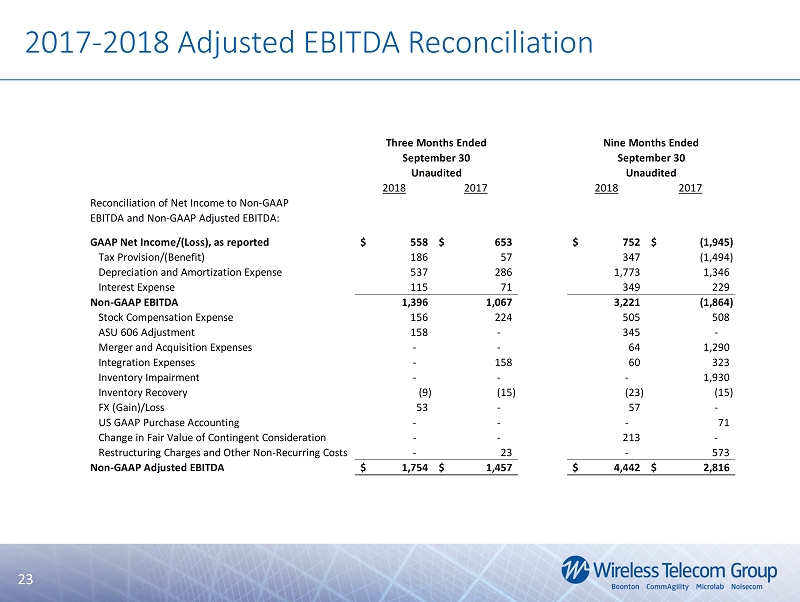
23 2017 - 2018 Adjusted EBITDA Reconciliation 23 2018 2017 2018 2017 Reconciliation of Net Income to Non-GAAP EBITDA and Non-GAAP Adjusted EBITDA: GAAP Net Income/(Loss), as reported 558$ 653$ 752$ (1,945)$ Tax Provision/(Benefit) 186 57 347 (1,494) Depreciation and Amortization Expense 537 286 1,773 1,346 Interest Expense 115 71 349 229 Non-GAAP EBITDA 1,396 1,067 3,221 (1,864) Stock Compensation Expense 156 224 505 508 ASU 606 Adjustment 158 - 345 - Merger and Acquisition Expenses - - 64 1,290 Integration Expenses - 158 60 323 Inventory Impairment - - - 1,930 Inventory Recovery (9) (15) (23) (15) FX (Gain)/Loss 53 - 57 - US GAAP Purchase Accounting - - - 71 Change in Fair Value of Contingent Consideration - - 213 - Restructuring Charges and Other Non-Recurring Costs - 23 - 573 Non-GAAP Adjusted EBITDA 1,754$ 1,457$ 4,442$ 2,816$ Three Months Ended September 30 Unaudited Nine Months Ended September 30 Unaudited
24 Explanation of Use of Non - GAAP Measures 24 Wireless Telecom Group, (the “Company”), reports its financial results in accordance with generally accepted accounting principles (“GAAP”) . Management believes, however, that certain non-GAAP financial measures used in managing the Company’s business may provide users of this financial information with additional meaningful comparisons between current results and prior reported results . Certain of the information set forth herein constitutes non-GAAP financial measures within the meaning of Regulation G adopted by the Securities and Exchange Commission . We have presented herein a reconciliation of these measures to the most directly comparable GAAP financial measure . The non-GAAP measures presented herein may not be comparable to similarly titled measures presented by other companies . The foregoing measures do not serve as a substitute and should not be construed as a substitute for GAAP performance, but provide supplemental information concerning our performance that our investors and we find useful . The Company defines EBITDA as its net earnings before interest, taxes, depreciation and amortization . “Adjusted EBITDA” is EBITDA excluding our stock compensation expense, restructuring charges, acquisition expenses, integration expenses, the one - time non - cash inventory impairment charges, unrealized and realized foreign exchange gains and losses, and other non - recurring costs and includes cash received in 2018 related to revenue that would have been recognized in 2018 but for the adoption of ASU 606 . A reconciliation of net income to non - GAAP Adjusted EBITDA set forth on pages 22 - 23 above . The Company views Adjusted EBITDA as an important indicator of performance, consistent with the manner in which management measures and forecasts the Company’s performance . We believe Adjusted EBITDA is an important performance metric because it facilitates the analysis of our results, exclusive of certain non-cash items and non - recurring items, including items which do not directly correlate to our business operations . The Company believes that Adjusted EBITDA metrics provide qualitative insight into our current performance ; we use these measures to evaluate our results, the performance of our management team and our management’s entitlement to incentive compensation ; and we believe that making this information available to investors enables them to view our performance the way that we view our performance and thereby gain a meaningful understanding of our core operating results, in general, and from period to period .
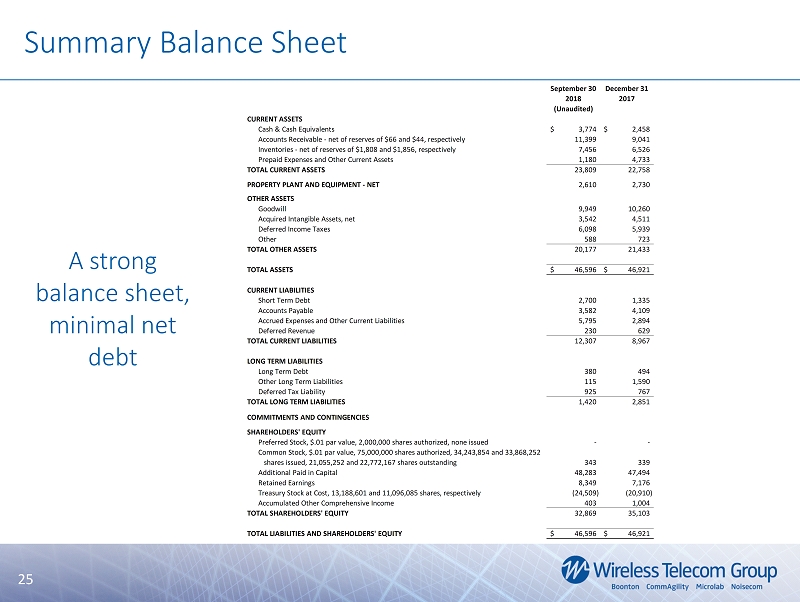
25 A strong balance sheet, minimal net debt Summary Balance Sheet 25 September 30 December 31 2018 2017 (Unaudited) CURRENT ASSETS Cash & Cash Equivalents 3,774$ 2,458$ Accounts Receivable - net of reserves of $66 and $44, respectively 11,399 9,041 Inventories - net of reserves of $1,808 and $1,856, respectively 7,456 6,526 Prepaid Expenses and Other Current Assets 1,180 4,733 TOTAL CURRENT ASSETS 23,809 22,758 PROPERTY PLANT AND EQUIPMENT - NET 2,610 2,730 OTHER ASSETS Goodwill 9,949 10,260 Acquired Intangible Assets, net 3,542 4,511 Deferred Income Taxes 6,098 5,939 Other 588 723 TOTAL OTHER ASSETS 20,177 21,433 TOTAL ASSETS 46,596$ 46,921$ CURRENT LIABILITIES Short Term Debt 2,700 1,335 Accounts Payable 3,582 4,109 Accrued Expenses and Other Current Liabilities 5,795 2,894 Deferred Revenue 230 629 TOTAL CURRENT LIABILITIES 12,307 8,967 LONG TERM LIABILITIES Long Term Debt 380 494 Other Long Term Liabilities 115 1,590 Deferred Tax Liability 925 767 TOTAL LONG TERM LIABILITIES 1,420 2,851 COMMITMENTS AND CONTINGENCIES SHAREHOLDERS’ EQUITY Preferred Stock, $.01 par value, 2,000,000 shares authorized, none issued - - Common Stock, $.01 par value, 75,000,000 shares authorized, 34,243,854 and 33,868,252 shares issued, 21,055,252 and 22,772,167 shares outstanding 343 339 Additional Paid in Capital 48,283 47,494 Retained Earnings 8,349 7,176 Treasury Stock at Cost, 13,188,601 and 11,096,085 shares, respectively (24,509) (20,910) Accumulated Other Comprehensive Income 403 1,004 TOTAL SHAREHOLDERS’ EQUITY 32,869 35,103 TOTAL LIABILITIES AND SHAREHOLDERS’ EQUITY 46,596$ 46,921$