Attached files
| file | filename |
|---|---|
| 8-K - FORM 8-K - Tower International, Inc. | tv507647_8k.htm |
Exhibit 99.1

EUROPEAN DIVESTITURE NOVEMBER 20, 2018

Forward - Looking Statements and Risk Factors This presentation contains statements which constitute forward - looking statements, within the meaning of the Private Securities Litigation Reform Act of 1995, including but not limited to statements regarding the completion of the pending transactions in this presentation, the consequences of that transaction, projected en ter prise value, anticipated stock valuation, positioning, projected truck revenues and the outlook for revenue , Adjusted EBITDA , Adjusted EBITDA Margin, Free Cash Flow , net new business, net debt and leverage. The forward - looking statements can be identified by words such as “anticipate,” “believe,” “plan,” “esti mate,” “expect,” “intend,” “project,” “target,” and other similar expressions. Forward - looking statements are made as of the date of this presentation and are based upon management’s current expectations and beliefs concerning future developments and their potential effects on us. Such forward - looking statements are not guarantees of future performance. The following important factors, as well as risk factors described in our reports filed with the SEC, could cause our actual res ults to differ materially from estimates or expectations reflected in such forward - looking statements: • global automobile production volumes; • the financial condition of our customers and suppliers; • our ability to make scheduled payments of principal or interest on our indebtedness and comply with the covenants and restric tio ns contained in the instruments governing our indebtedness; • our ability to refinance our indebtedness; • risks associated with our non - U.S. operations, including foreign exchange risks and economic uncertainty in some regions; • any increase in the expense and funding requirements of our pension and other postretirement benefits; • our customers’ ability to obtain equity and debt financing for their businesses; • our dependence on our largest customers; • pricing pressure from our customers; • changes to U.S. trade and tariff policies and the reaction of other countries thereto; • work stoppages or other labor issues affecting us or our customers or suppliers; • our ability to integrate acquired businesses ; • our ability to take advantage of emerging secular trends, • risks associated with business divestitures; • costs or liabilities relating to environmental and safety regulations; • our ability to close the pending transaction in accordance with anticipated terms; and • r egulatory and other conditions that must be satisfied or, in certain circumstances, waived in order to consummate the pending tr ansaction. We do not assume any obligation to update or revise the forward - looking statements contained in this presentation.
Transaction Description • On November 20th Tower signed a Memorandum of Understanding to sell all of its European operations to Financière SNOP Dunois S.A. (“FSD”), a privately owned French auto supplier. • The sale price contemplated by the stock purchase agreement annexed to the MOU represents an Enterprise Value of € 255 million ($298 million at $1.17 / €) which represents an EV / Adjusted EBITDA multiple of 5.4x 2018 full year expected earnings. • The transaction is expected to close during the First Quarter of 2019. Tower’s European results will be treated as discontinued operations beginning with the Fourth Quarter 2018. 3

Why This Transaction is Good for Tower • This highly accretive transaction unlocks significant value for Tower Shareholders. • Allows Tower to focus on a North American business with strong growth, profit margins and cash flow. • Results in a very strong Tower balance sheet reducing expected net leverage to equal to or less than 1.0x Adjusted EBITDA. • Enhances and accelerates Tower’s financial flexibility to: invest in additional accretive growth; reduce leverage; and/or return capital to shareholders. 4

Transaction Multiple of > 5X EV / Adjusted EBITDA Enterprise Value 255€ 298$ 2018 FY Projected Adjusted EBITDA 47€ 55$ EV / Adjusted EBITDA Multiple 5.4 x Transaction multiple is well above Tower’s multiple and more in line with our automotive peers which average 5x. 5 (in $ millions fx $1.17 / €) See Appendix for comments regarding non - GAAP financial measures. Adjusted EBITDA based on Full - Year 2018 Outlook, Tower Europe includes $5 million of Corporate allocations.

Competitive Position of Tower’s Regions 6 Tower Europe Tower North America Sales Growth Sales have been flat Above market growth EBITDA Margins 8% 11% to 12% Established Customer Relationships Primarily German and Italian Most major OEMs Market Fragmentation Many competitors Fewer, large competitors Large Volume Platforms Limited production volumes Numerous high volume platforms Pan-Regional Scale Mostly Central-Europe Efficient manufacturing footprint Capacity Utilization Inefficient utilization Efficient utilization Transaction allows Tower to focus on its leading position in the more lucrative North American market.
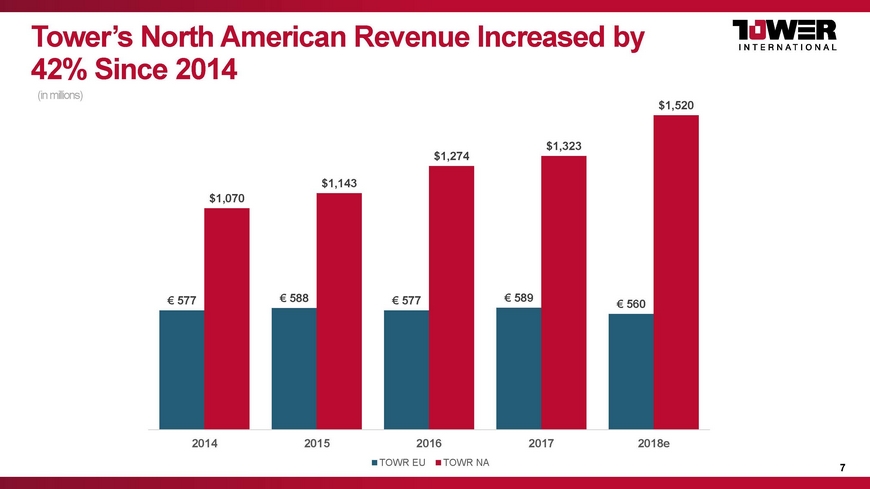
Tower’s North American Revenue Increased by 42% Since 2014 7 (in millions ) € 577 € 588 € 577 € 589 € 560 $1,070 $1,143 $1,274 $1,323 $1,520 2014 2015 2016 2017 2018e TOWR EU TOWR NA

The North American Industry Continues to Shift to Trucks Tower continues to grow truck revenue more rapidly than the market. 57% 56% 54% 56% 58% 60% 62% 66% 66% 75% 75% 69% 68% 72% 70% 77% 82% 86% 2010 2011 2012 2013 2014 2015 2016 2017 2018e NA Truck & SUV TOWR Truck Rev. Source: IHS North American Production Volumes. 8

9 Compelling North American Growth Story Continues Previous Outlook Outlook 2018 2018 Revenue 2,170$ 1,520$ 1,625$ - 1,675$ Adjusted EBITDA 230$ 175$ 190$ - 200$ Adj. EBITDA Margin 10.6% 11.5% Net Leverage 1.6x 0.9x 2020 Directional ~ 12% ≤ 1.0x Tower Excluding Europe (in $ millions) Net New Business Expected to Drive Additional Organic Growth of ~10% with improved margins and substantial Free Cash Flow. See Appendix for comments regarding non - GAAP financial measures. Adjusted EBITDA based on Full - Year 2018 Outlook, Tower Europe includes $5 million of Corporate allocations.
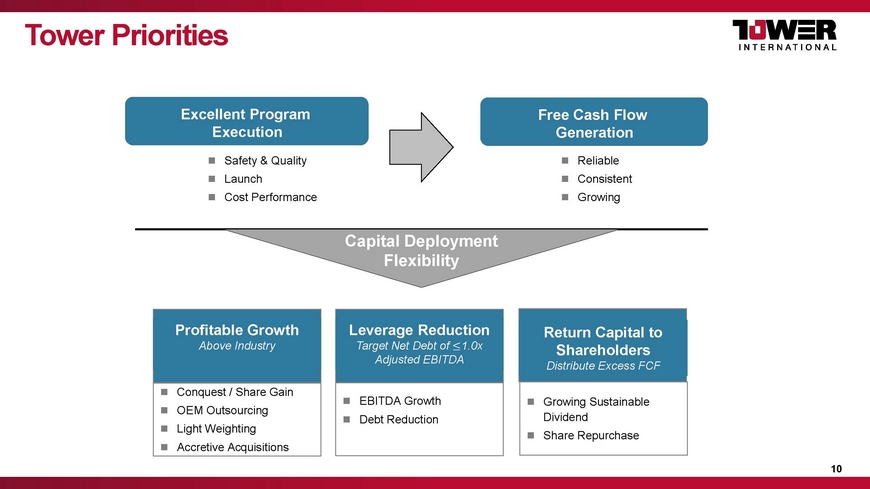
Tower Priorities Reliable Consistent Growing Conquest / Share Gain OEM Outsourcing Light Weighting Accretive Acquisitions Excellent Program Execution Capital Deployment Flexibility Safety & Quality Launch Cost Performance Free Cash Flow Generation Profitable Growth Above Industry EBITDA Growth Debt Reduction Leverage Reduction Target Net Debt of 1.0x Adjusted EBITDA Return Capital to Shareholders Distribute Excess FCF Growing Sustainable Dividend Share Repurchase 10

11 Tower Investment Thesis Going Forward • High degree of exposure to growing light truck and SUV market in North America. • Very limited geopolitical risk: N o direct exposure to China nor Europe; and Insulated from trade and commodity related concerns. • Consistent above market growth of revenue and earnings. • Remain well positioned to capitalize on the emerging industry trends of outsourcing and lightweighting . • Ample liquidity to fund accretive profitable growth. • Conservative balance sheet provides protection and the opportunity for acquisitive growth in the event of an industry downturn. This transaction unlocks value for Tower Shareholders and provides enhanced flexibility to deploy capital for profitable growth, leverage reduction and/or return of capital to Shareholders.

// APPENDIX 12

This presentation includes the following non - GAAP financial measures: “Adjusted EBITDA”, “Adjusted EBITDA Margin ”, “Free Cash Flow”, and “Net Debt.” We define Adjusted EBITDA as net income / (loss) before interest, taxes, depreciation, amortization, restructuring items and other adjustments described in the reconciliations provided in this presentation. Adjusted EBITDA margin represents Adjusted EBITDA divided by revenues. Free Cash F low is defined as cash provided by operating activities less cash disbursed for purchases of property, plant and equipment. Net Debt represents total debt less cash and cash equivalents. We use Adjusted EBITDA, Adjusted EBITDA margin, Free Cash Flow, and Net Debt as supplements to information provided in accordance with generally accepted accounting principles (“GAAP”) in evaluating our business and they are included in this presentation because they are principal factors upon which our management assesses performance. The non - GAAP measures presented above are not measures of performance under GAAP. These measures should not be considered as alternatives for the most directly comparable financial measures calculated in accordance with GAAP. Other companies in our industry may define these non - GAAP measures differently than we do and, as a result, these non - GAAP measures may not be comparable to similarly titled measures used by other companies in our industry; and certain of our non - GAAP financial measures exclude financial information that some may consider important in evaluating our performance. Given the inherent uncertainty regarding mark to market adjustments of financial instruments, fair value adjustments to our pension plan, potential gain or loss on our discontinued operations, potential restructuring expenses, and expenses related to our long - term incentive compensation programs in any future period, a quantitative reconciliation of forward - looking financial measures to the most directly comparable financial measures calculated and presented in accordance with GAAP is not feasible. Consequently, any attempt to disclose such reconciliations would imply a degree of precision that could be confusing or misleading to investors. The magnitude of these items, however, may be significant. 13 Non - GAAP Financial Measures