Attached files
| file | filename |
|---|---|
| EX-99.2 - EXHIBIT 99.2 - GAP INC | a2018globalbrandshistori.htm |
| EX-99.1 - EXHIBIT 99.1 - GAP INC | q32018eprexhibit991.htm |
| 8-K - GAP INC | q32018earnings8-k.htm |

Exhibit 99.3 GAP INC. FISCAL 2018 THIRD QUARTER EARNINGS RESULTS ART PECK PRESIDENT & CHIEF EXECUTIVE OFFICER TERI LIST-STOLL EXECUTIVE VICE PRESIDENT & CHIEF FINANCIAL OFFICER
DISCLOSURE STATEMENT FORWARD LOOKING STATEMENTS This conference call and webcast contain forward-looking statements within the "safe harbor" provisions of the Private Securities Litigation Reform Act of 1995. All statements other than those that are purely historical are forward-looking statements. Forward-looking statements include statements identified as such in our November 20, 2018 press release. Because these forward-looking statements involve risks and uncertainties, there are important factors that could cause our actual results to differ materially from those in the forward-looking statements. Information regarding factors that could cause results to differ can be found in our November 20, 2018 earnings press release, our Annual Report on Form 10-K for the fiscal year ended February 3, 2018, and our subsequent filings with the U.S. Securities and Exchange Commission, all of which are available on gapinc.com. These forward-looking statements are based on information as of November 20, 2018. We assume no obligation to publicly update or revise our forward-looking statements evenSEC REGULATION if experience G or future changes make it clear that any projected results expressed or implied therein will not be realized. This presentation includes the non-GAAP measure free cash flow. The description and reconciliation of this measure from GAAP is included in our November 20, 2018 earnings press release, which is available on gapinc.com. 2
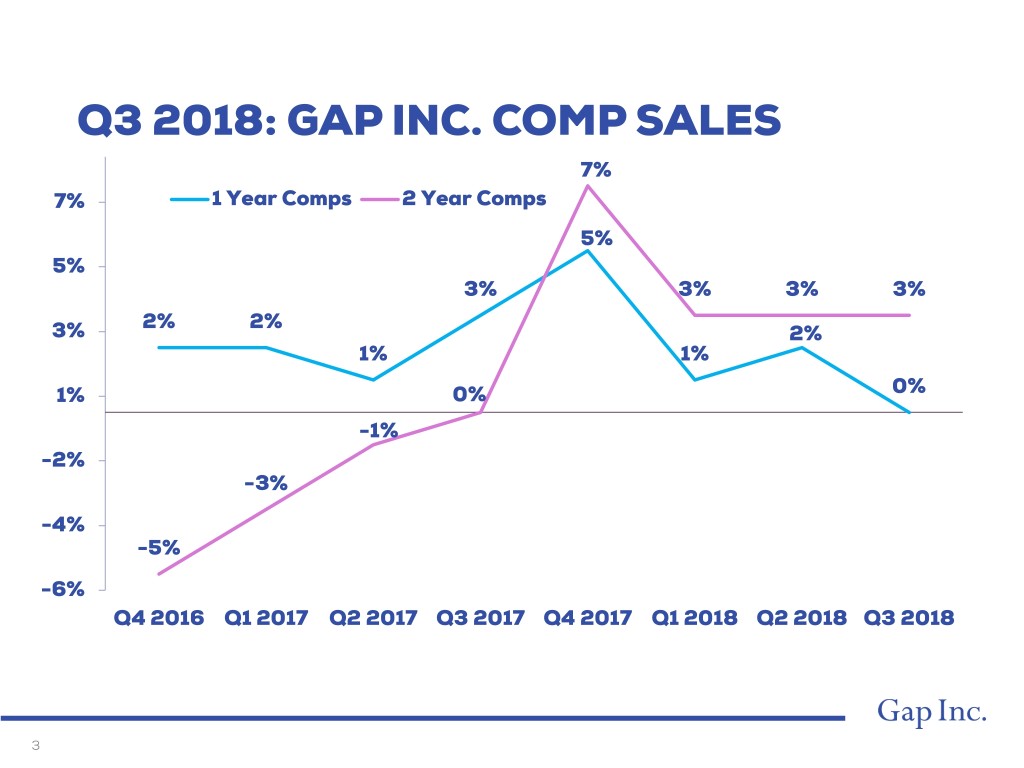
Q3 2018: GAP INC. COMP SALES 7% 7% 1 Year Comps 2 Year Comps 5% 5% 3% 3% 3% 3% 2% 2% 3% 2% 1% 1% 1% 0% 0% -1% -2% -3% -4% -5% -6% Q4 2016 Q1 2017 Q2 2017 Q3 2017 Q4 2017 Q1 2018 Q2 2018 Q3 2018 3
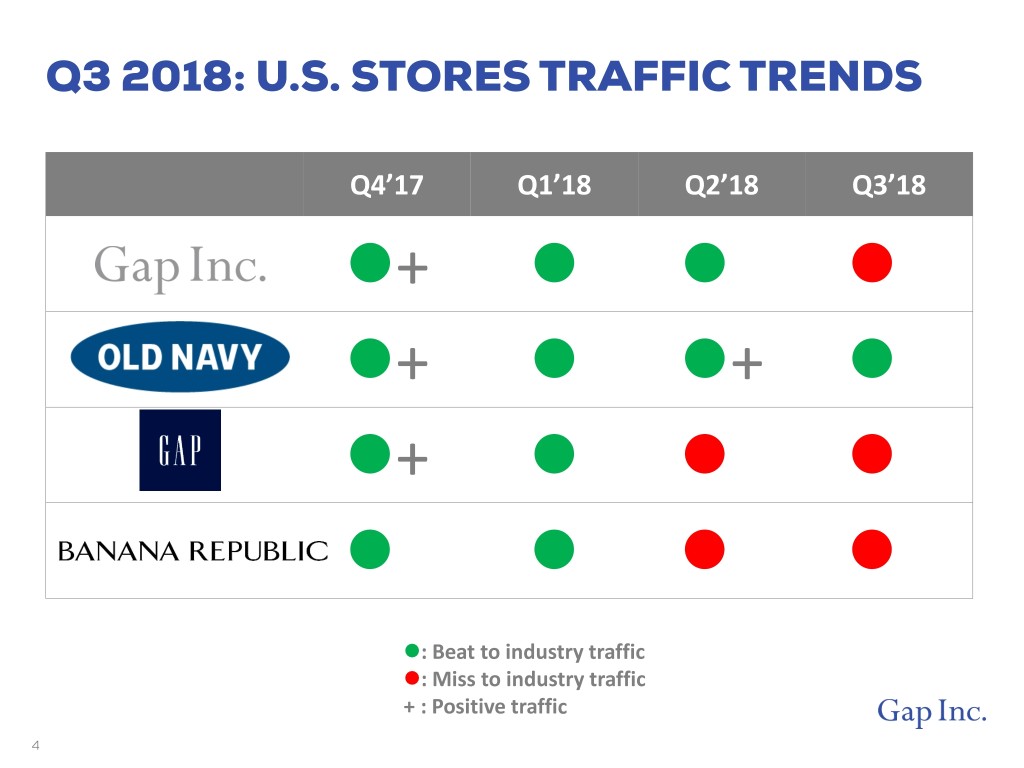
Q3 2018: U.S. STORES TRAFFIC TRENDS Q4’17 Q1’18 Q2’18 Q3’18 + _ _ + + _ + _ _ _ _ _ : Beat to industry traffic : Miss to industry traffic + : Positive traffic 4
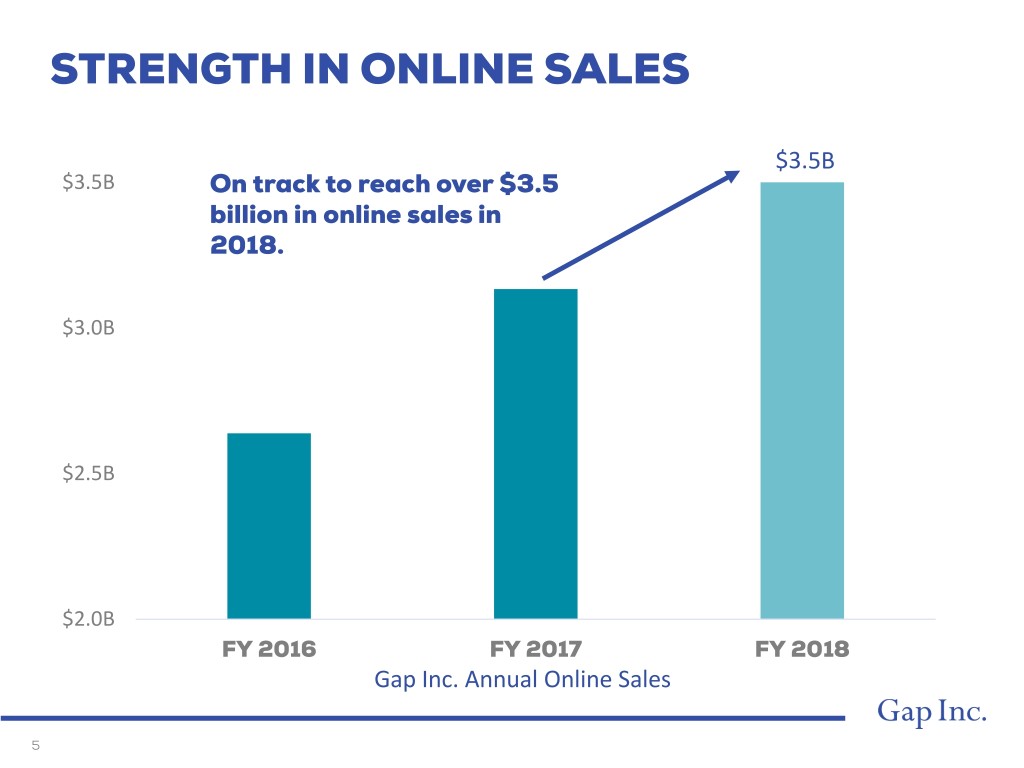
STRENGTH IN ONLINE SALES $3.5B $3.5B On track to reach over $3.5 billion in online sales in 2018. $3.0B $2.5B $2.0B FY 2016 FY 2017 FY 2018 Gap Inc. Annual Online Sales 5
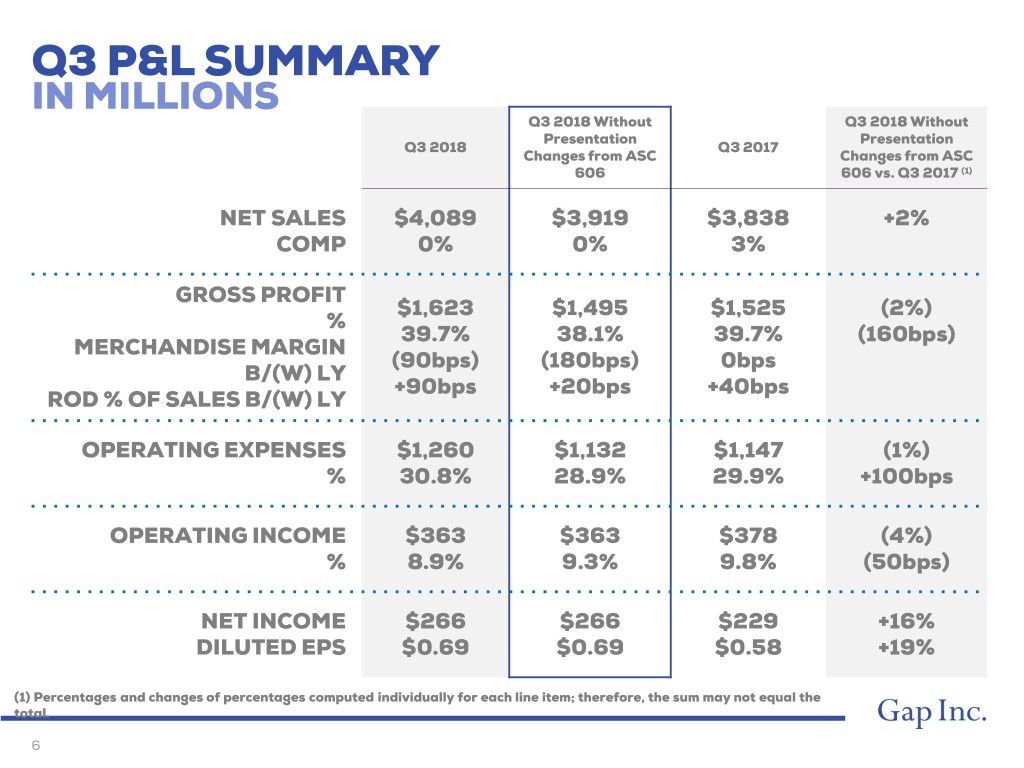
Q3 P&L SUMMARY IN MILLIONS Q3 2018 Without Q3 2018 Without Presentation Presentation Q3 2018 Q3 2017 Changes from ASC Changes from ASC 606 606 vs. Q3 2017 (1) NET SALES $4,089 $3,919 $3,838 +2% COMP 0% 0% 3% GROSS PROFIT $1,623 $1,495 $1,525 (2%) % 39.7% 38.1% 39.7% (160bps) MERCHANDISE MARGIN (90bps) (180bps) 0bps B/(W) LY +90bps +20bps +40bps ROD % OF SALES B/(W) LY OPERATING EXPENSES $1,260 $1,132 $1,147 (1%) % 30.8% 28.9% 29.9% +100bps OPERATING INCOME $363 $363 $378 (4%) % 8.9% 9.3% 9.8% (50bps) NET INCOME $266 $266 $229 +16% DILUTED EPS $0.69 $0.69 $0.58 +19% (1) Percentages and changes of percentages computed individually for each line item; therefore, the sum may not equal the total. 6
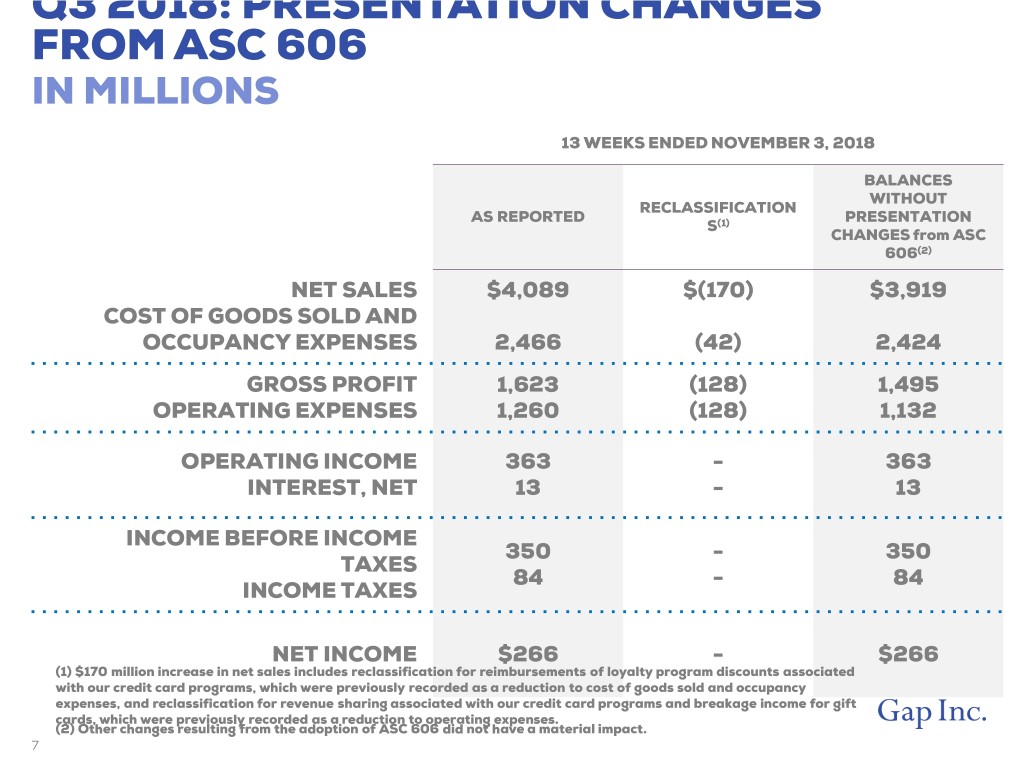
Q3 2018: PRESENTATION CHANGES FROM ASC 606 IN MILLIONS 13 WEEKS ENDED NOVEMBER 3, 2018 BALANCES WITHOUT RECLASSIFICATION AS REPORTED PRESENTATION S(1) CHANGES from ASC 606(2) NET SALES $4,089 $(170) $3,919 COST OF GOODS SOLD AND OCCUPANCY EXPENSES 2,466 (42) 2,424 GROSS PROFIT 1,623 (128) 1,495 OPERATING EXPENSES 1,260 (128) 1,132 OPERATING INCOME 363 - 363 INTEREST, NET 13 - 13 INCOME BEFORE INCOME 350 - 350 TAXES 84 - 84 INCOME TAXES NET INCOME $266 - $266 (1) $170 million increase in net sales includes reclassification for reimbursements of loyalty program discounts associated with our credit card programs, which were previously recorded as a reduction to cost of goods sold and occupancy expenses, and reclassification for revenue sharing associated with our credit card programs and breakage income for gift cards, which were previously recorded as a reduction to operating expenses. (2) Other changes resulting from the adoption of ASC 606 did not have a material impact. 7
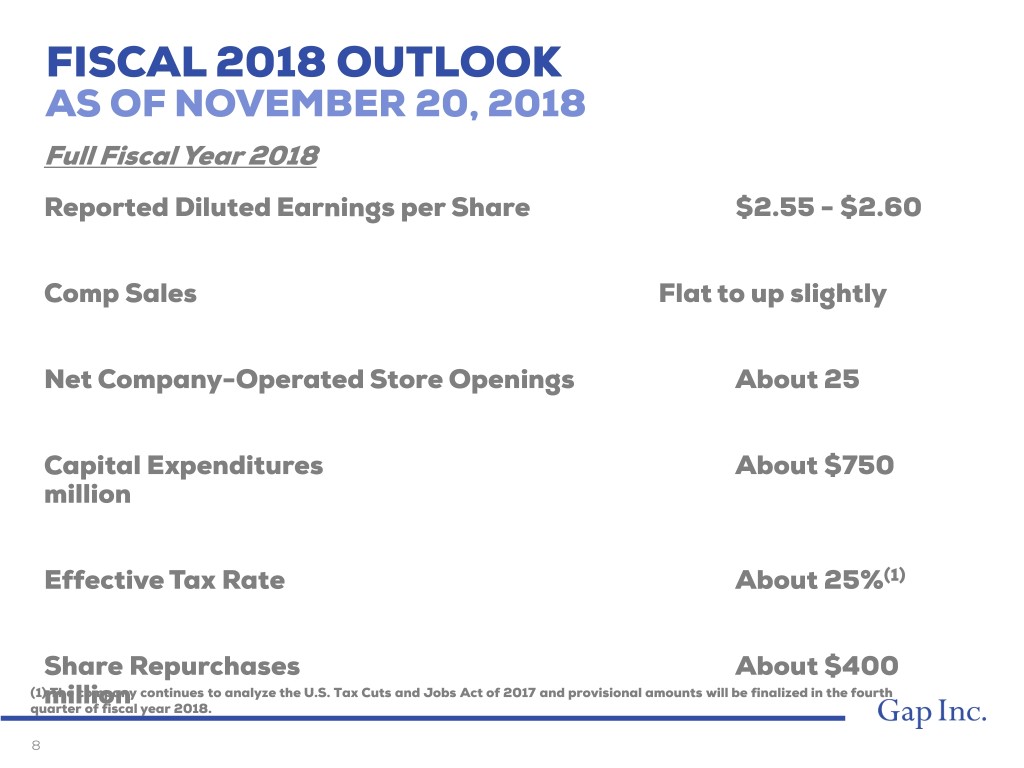
FISCAL 2018 OUTLOOK AS OF NOVEMBER 20, 2018 Full Fiscal Year 2018 Reported Diluted Earnings per Share $2.55 - $2.60 Comp Sales Flat to up slightly Net Company-Operated Store Openings About 25 Capital Expenditures About $750 million Effective Tax Rate About 25%(1) Share Repurchases About $400 (1) The company continues to analyze the U.S. Tax Cuts and Jobs Act of 2017 and provisional amounts will be finalized in the fourth quartermillion of fiscal year 2018. 8

