Attached files
| file | filename |
|---|---|
| EX-99.1 - EX-99.1 - Select Interior Concepts, Inc. | d652405dex991.htm |
| 8-K - FORM 8-K - Select Interior Concepts, Inc. | d652405d8k.htm |

Second Quarter 2018 Earnings Conference Call November 13, 2018 Third Quarter Earnings Call NASDAQ: SIC Exhibit 99.2
Forward-Looking Statements and Non-GAAP Financial Measures Forward-Looking Statements Certain statements in this presentation may constitute forward-looking statements, including statements regarding the Company’s financial position, business strategy and plans, and objectives of management for future operations. These statements, which contain words such as "believe,” “expect,” “anticipate,” “intends,” “estimate,” “forecast,” “project,” “will,” “may,” “should” and similar expressions, reflect the beliefs and expectations of the Company and are subject to risks and uncertainties that may cause actual results to differ materially. These risks and uncertainties include, among other factors, our dependency upon the residential construction and repair and remodel market, the achievement of the anticipated levels of profitability, growth, the ability to anticipate consumer preferences and demand, the impact of competitive pricing, and the impact of general business and economic conditions. These and other factors could adversely affect the outcome and financial effects of the plans and events described herein. The forward-looking statements are based on our beliefs, assumptions and expectations of our future performance, taking into account all information currently available to us. Forward-looking statements are not predictions of future events. These beliefs, assumptions and expectations can change as a result of many possible events or factors, not all of which are known to us. If a change occurs, our business, financial condition, liquidity, and results of operations may vary materially from those expressed in our forward-looking statements. Any forward-looking statement speaks only as of the date on which it is made. New risks and uncertainties arise over time, and it is not possible for us to predict those events or how they may affect us. Except as required by law, we are not obligated to, and do not intend to, update or revise any forward-looking statements, whether as a result of new information, future events or otherwise. Use of Non-GAAP Financial Measures Management believes the non-GAAP financial measures discussed in this presentation are useful to both management and investors in their analysis of the Company’s financial position and results of operations. Further, management uses these non-GAAP financial measures for planning and forecasting future periods. This non-GAAP financial information is provided as additional information for investors, is not in accordance with or an alternative to GAAP, and should not be used as a substitute for the Company’s operating results presented in accordance with GAAP. These non-GAAP measures may be different from similar measures used by other companies. For reconciliations of these non-GAAP financial measures to the most directly comparable financial measures calculated and presented in accordance with GAAP, see the appendix of this presentation.
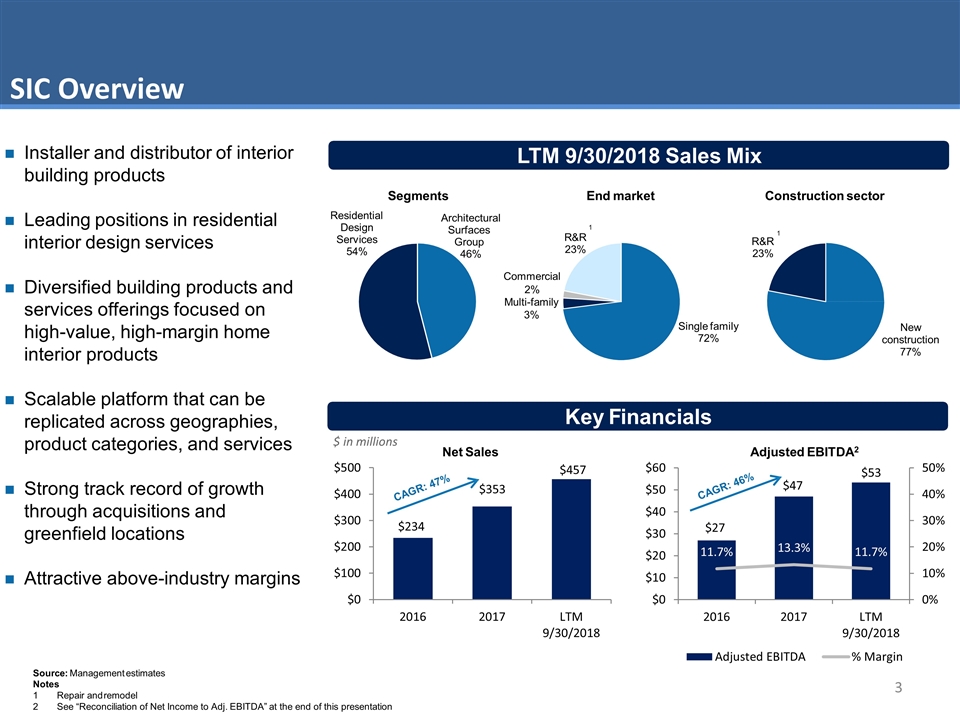
SIC Overview Net Sales 1 LTM 9/30/2018 Sales Mix Key Financials Installer and distributor of interior building products Leading positions in residential interior design services Diversified building products and services offerings focused on high-value, high-margin home interior products Scalable platform that can be replicated across geographies, product categories, and services Strong track record of growth through acquisitions and greenfield locations Attractive above-industry margins Residential Design Services 54% Architectural Surfaces Group 46% Segments Single family 72% Multi-family 3% Commercial 2% End market New construction 77% R&R 23% Construction sector 1 R&R 23% Adjusted EBITDA2 Source: Management estimates Notes 1Repair and remodel 2See “Reconciliation of Net Income to Adj. EBITDA” at the end of this presentation CAGR: 47% CAGR: 46% $ in millions
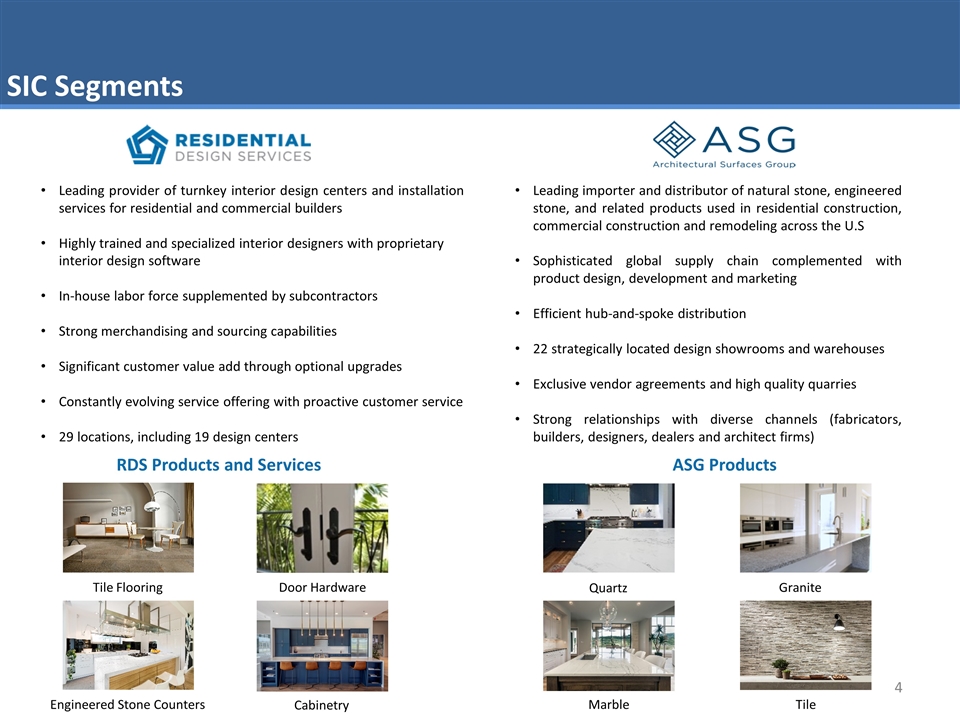
SIC Segments Leading provider of turnkey interior design centers and installation services for residential and commercial builders Highly trained and specialized interior designers with proprietary interior design software In-house labor force supplemented by subcontractors Strong merchandising and sourcing capabilities Significant customer value add through optional upgrades Constantly evolving service offering with proactive customer service 29 locations, including 19 design centers Leading importer and distributor of natural stone, engineered stone, and related products used in residential construction, commercial construction and remodeling across the U.S Sophisticated global supply chain complemented with product design, development and marketing Efficient hub-and-spoke distribution 22 strategically located design showrooms and warehouses Exclusive vendor agreements and high quality quarries Strong relationships with diverse channels (fabricators, builders, designers, dealers and architect firms) RDS Products and Services ASG Products Tile Flooring Door Hardware Engineered Stone Counters Cabinetry Granite Marble Tile Quartz
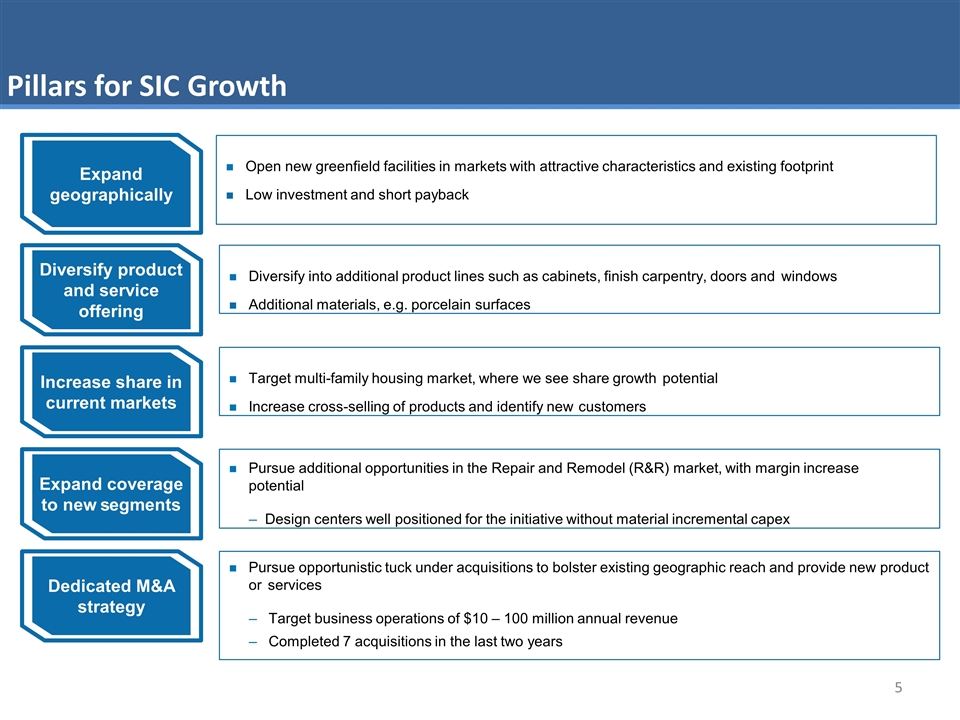
Pillars for SIC Growth Expand geographically Diversify product and service offering Diversify into additional product lines such as cabinets, finish carpentry, doors and windows Additional materials, e.g. porcelain surfaces Increase share in current markets Target multi-family housing market, where we see share growth potential Increase cross-selling of products and identify new customers Expand coverage to new segments Pursue additional opportunities in the Repair and Remodel (R&R) market, with margin increase potential – Design centers well positioned for the initiative without material incremental capex Dedicated M&A strategy Pursue opportunistic tuck under acquisitions to bolster existing geographic reach and provide new product or services Target business operations of $10 – 100 million annual revenue Completed 7 acquisitions in the last two years Open new greenfield facilities in markets with attractive characteristics and existing footprint Low investment and short payback
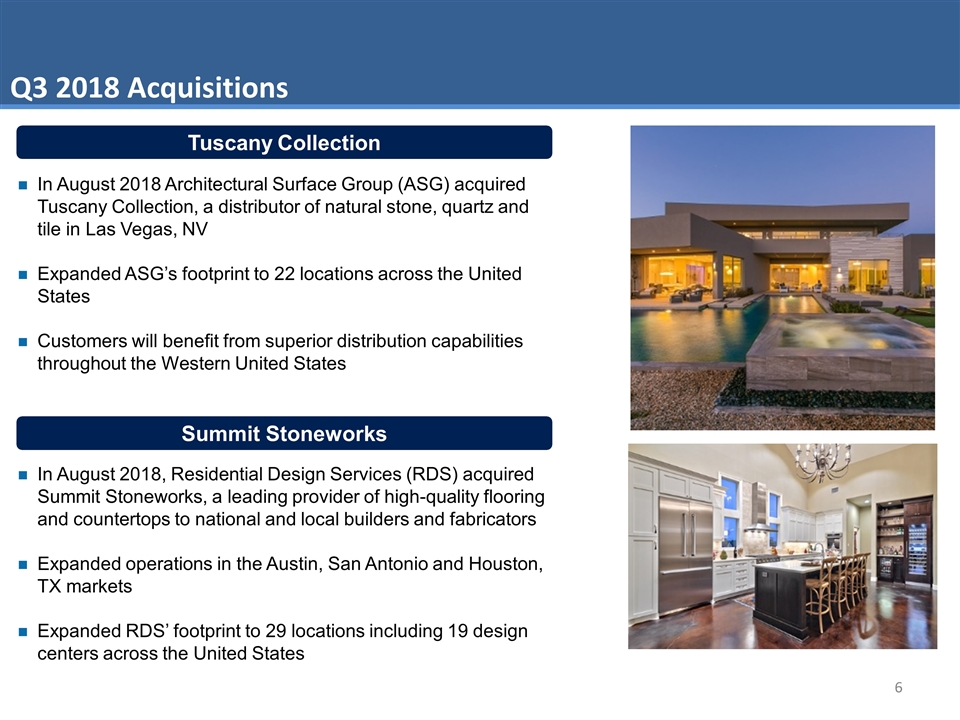
Q3 2018 Acquisitions Tuscany Collection In August 2018 Architectural Surface Group (ASG) acquired Tuscany Collection, a distributor of natural stone, quartz and tile in Las Vegas, NV Expanded ASG’s footprint to 22 locations across the United States Customers will benefit from superior distribution capabilities throughout the Western United States Summit Stoneworks In August 2018, Residential Design Services (RDS) acquired Summit Stoneworks, a leading provider of high-quality flooring and countertops to national and local builders and fabricators Expanded operations in the Austin, San Antonio and Houston, TX markets Expanded RDS’ footprint to 29 locations including 19 design centers across the United States
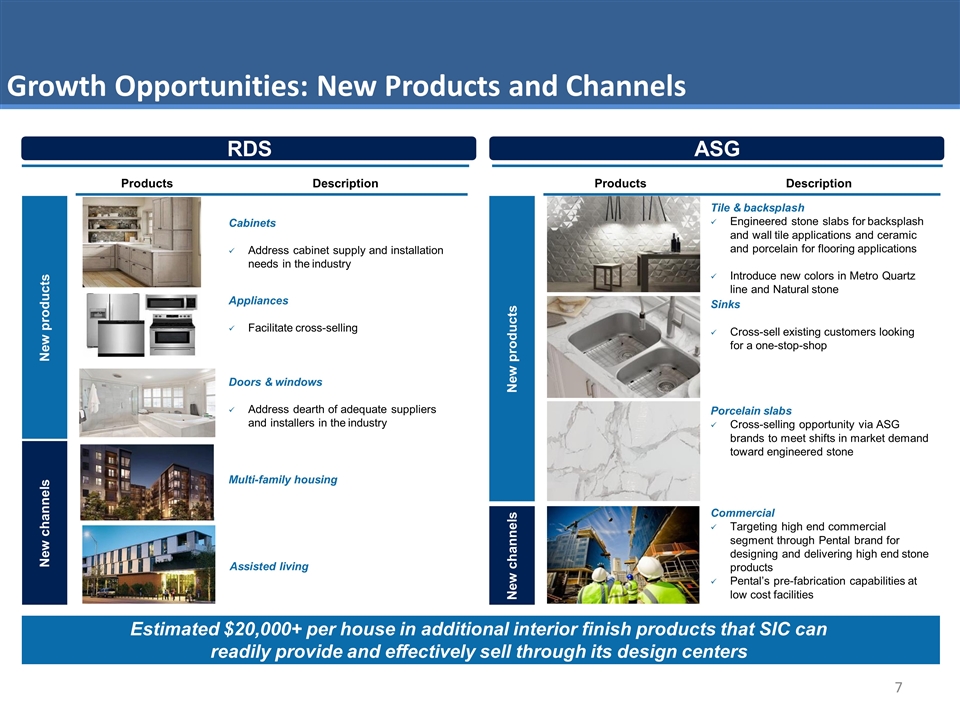
Growth Opportunities: New Products and Channels Estimated $20,000+ per house in additional interior finish products that SIC can readily provide and effectively sell through its design centers New channels New products Products Description Products Description New channels New products Multi-family housing Porcelain slabs Cross-selling opportunity via ASG brands to meet shifts in market demand toward engineered stone Tile & backsplash Engineered stone slabs for backsplash and wall tile applications and ceramic and porcelain for flooring applications Commercial Targeting high end commercial segment through Pental brand for designing and delivering high end stone products Pental’s pre-fabrication capabilities at low cost facilities Introduce new colors in Metro Quartz line and Natural stone Sinks Cross-sell existing customers looking for a one-stop-shop RDS ASG Assisted living Doors & windows Address dearth of adequate suppliers and installers in the industry Appliances Facilitate cross-selling Cabinets Address cabinet supply and installation needs in the industry
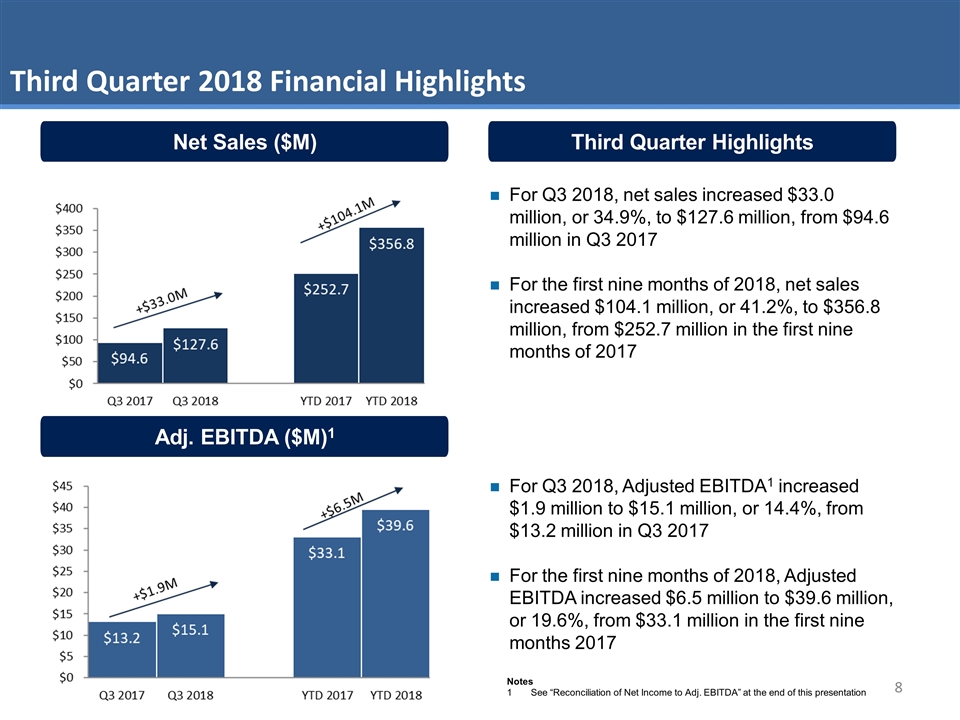
Third Quarter Highlights Adj. EBITDA ($M)1 Net Sales ($M) Third Quarter 2018 Financial Highlights For Q3 2018, net sales increased $33.0 million, or 34.9%, to $127.6 million, from $94.6 million in Q3 2017 For the first nine months of 2018, net sales increased $104.1 million, or 41.2%, to $356.8 million, from $252.7 million in the first nine months of 2017 For Q3 2018, Adjusted EBITDA1 increased $1.9 million to $15.1 million, or 14.4%, from $13.2 million in Q3 2017 For the first nine months of 2018, Adjusted EBITDA increased $6.5 million to $39.6 million, or 19.6%, from $33.1 million in the first nine months 2017 Notes 1See “Reconciliation of Net Income to Adj. EBITDA” at the end of this presentation
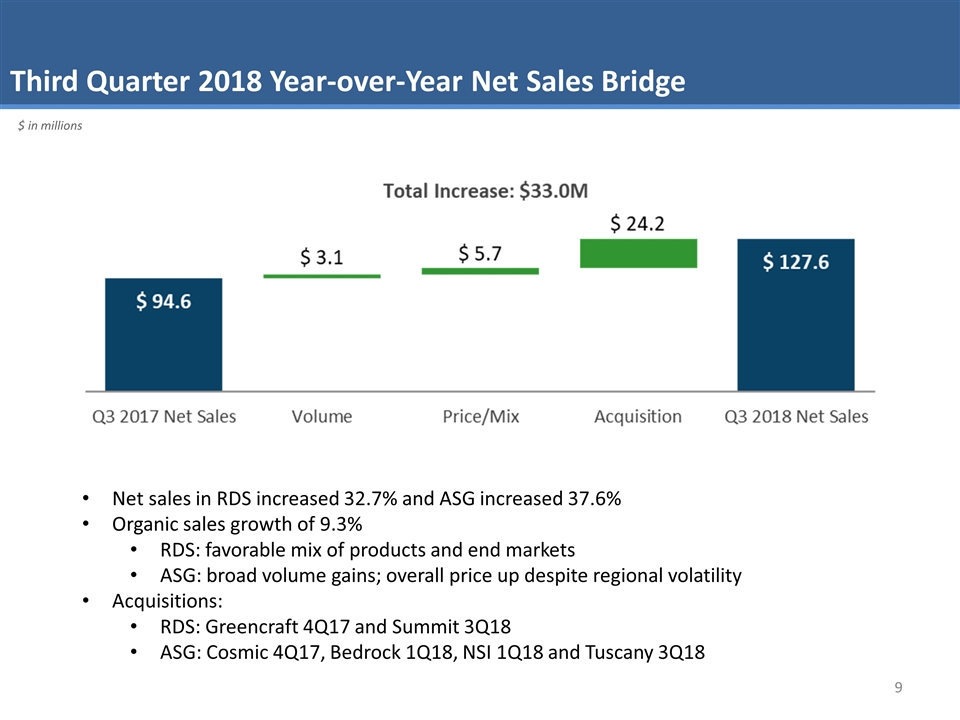
Third Quarter 2018 Year-over-Year Net Sales Bridge Net sales in RDS increased 32.7% and ASG increased 37.6% Organic sales growth of 9.3% RDS: favorable mix of products and end markets ASG: broad volume gains; overall price up despite regional volatility Acquisitions: RDS: Greencraft 4Q17 and Summit 3Q18 ASG: Cosmic 4Q17, Bedrock 1Q18, NSI 1Q18 and Tuscany 3Q18 $ in millions
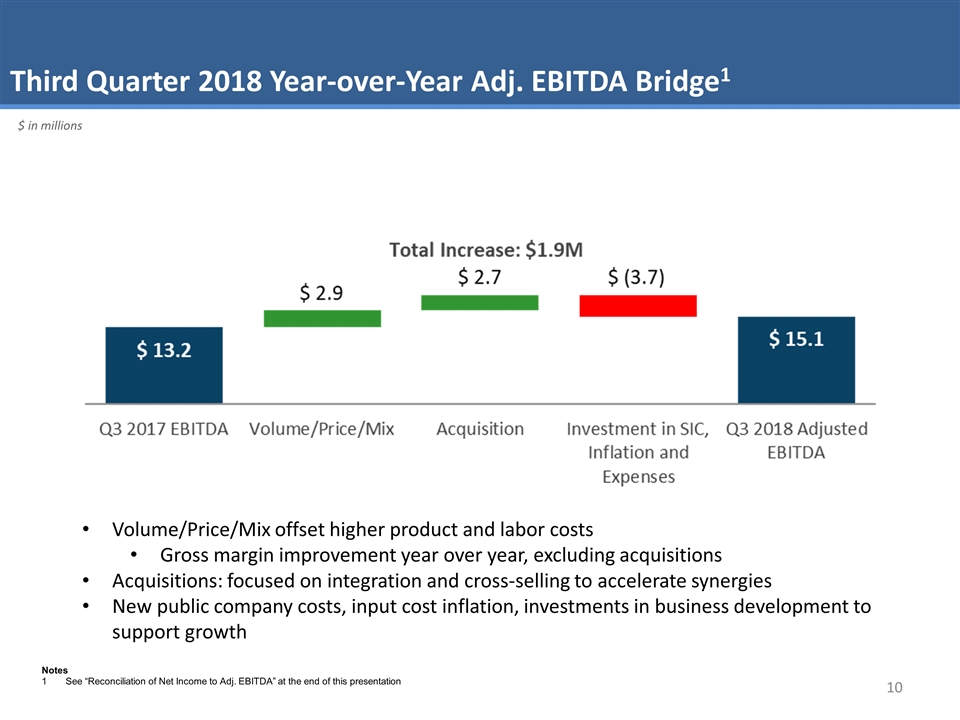
Third Quarter 2018 Year-over-Year Adj. EBITDA Bridge1 Volume/Price/Mix offset higher product and labor costs Gross margin improvement year over year, excluding acquisitions Acquisitions: focused on integration and cross-selling to accelerate synergies New public company costs, input cost inflation, investments in business development to support growth $ in millions Notes 1See “Reconciliation of Net Income to Adj. EBITDA” at the end of this presentation
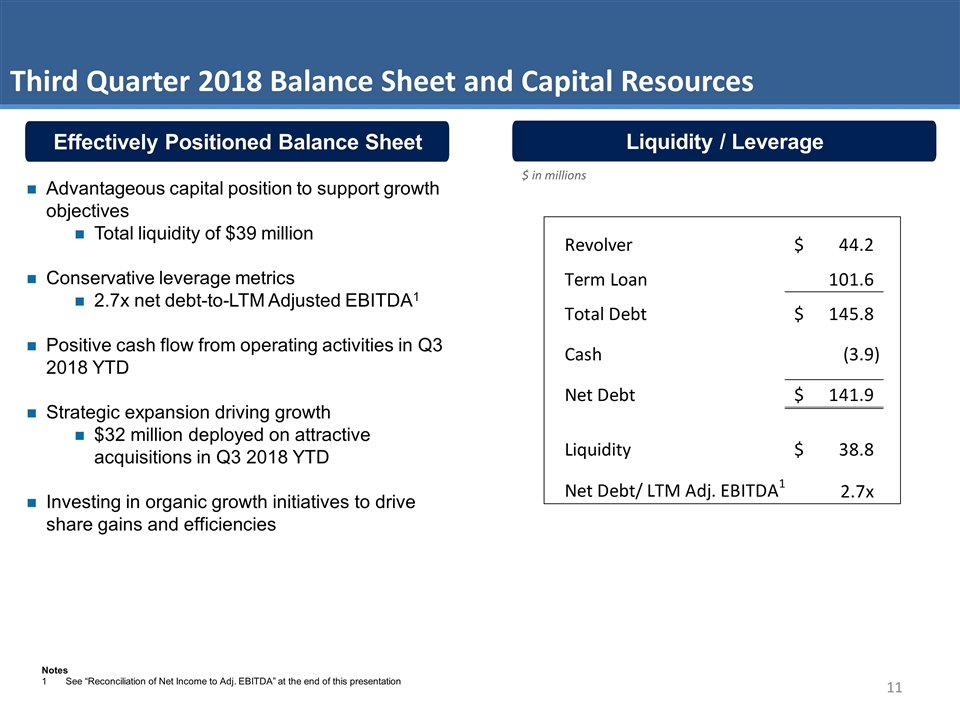
Effectively Positioned Balance Sheet Liquidity / Leverage Third Quarter 2018 Balance Sheet and Capital Resources Advantageous capital position to support growth objectives Total liquidity of $39 million Conservative leverage metrics 2.7x net debt-to-LTM Adjusted EBITDA1 Positive cash flow from operating activities in Q3 2018 YTD Strategic expansion driving growth $32 million deployed on attractive acquisitions in Q3 2018 YTD Investing in organic growth initiatives to drive share gains and efficiencies $ in millions Notes 1See “Reconciliation of Net Income to Adj. EBITDA” at the end of this presentation
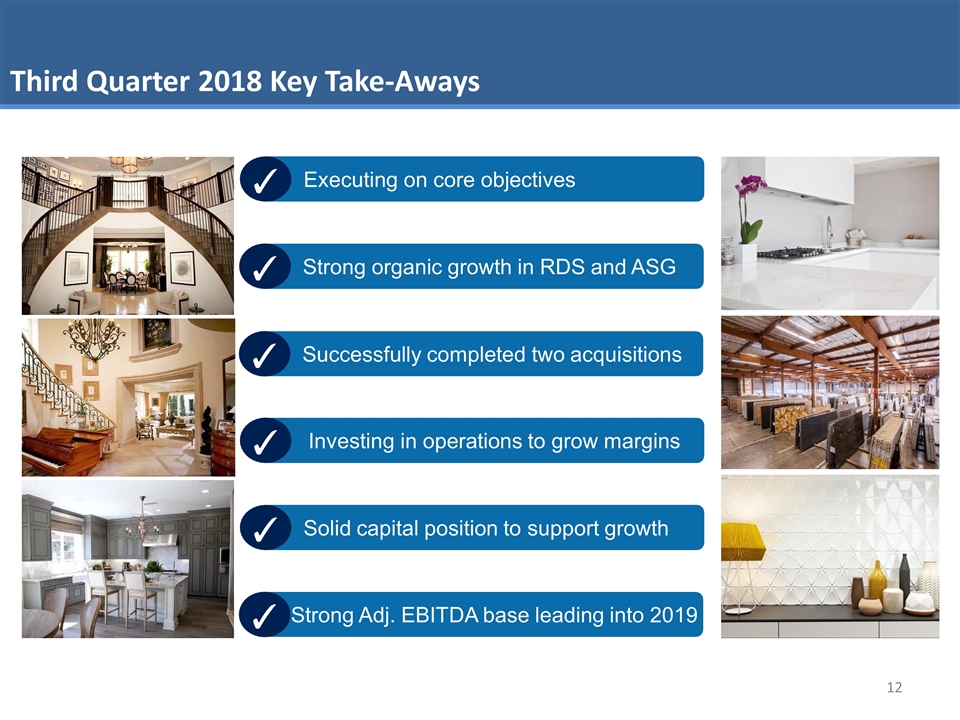
Third Quarter 2018 Key Take-Aways Executing on core objectives Market leadership promotes high barriers to competition Strong customer relationships Strong and experienced management team ✓ Strong organic growth in RDS and ASG ✓ Successfully completed two acquisitions ✓ Investing in operations to grow margins ✓ Solid capital position to support growth ✓ Strong Adj. EBITDA base leading into 2019 ✓

Appendix
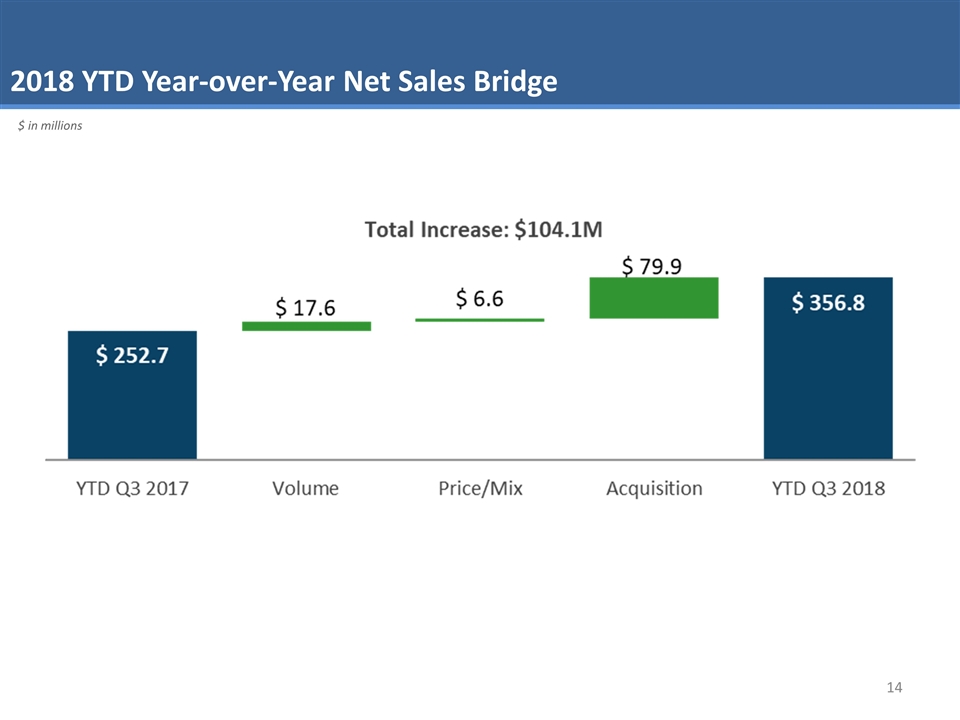
2018 YTD Year-over-Year Net Sales Bridge $ in millions
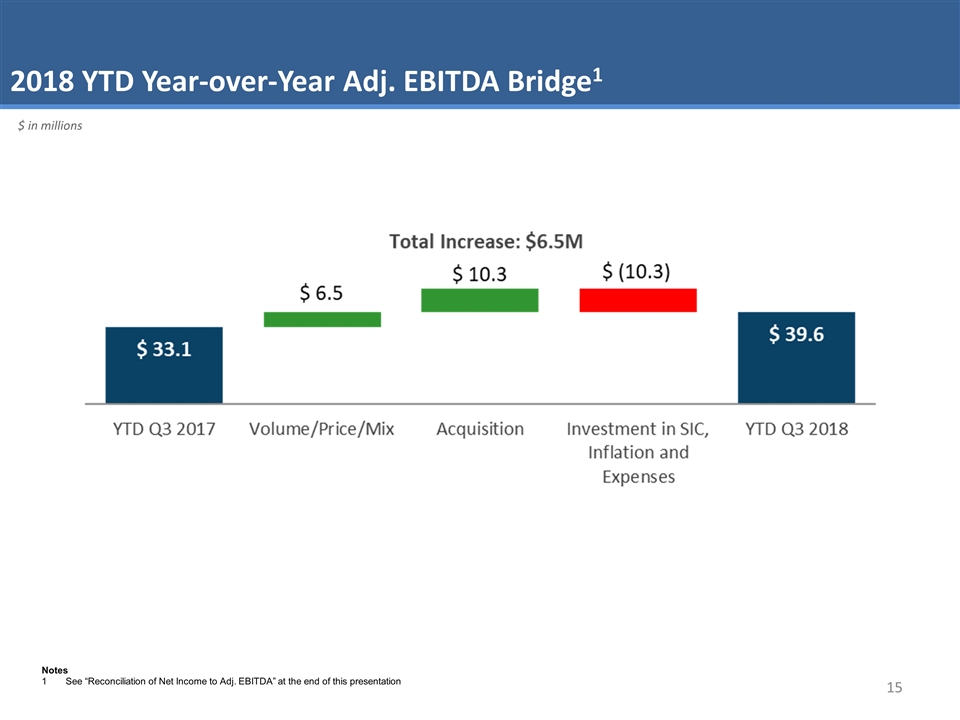
2018 YTD Year-over-Year Adj. EBITDA Bridge1 $ in millions Notes 1See “Reconciliation of Net Income to Adj. EBITDA” at the end of this presentation
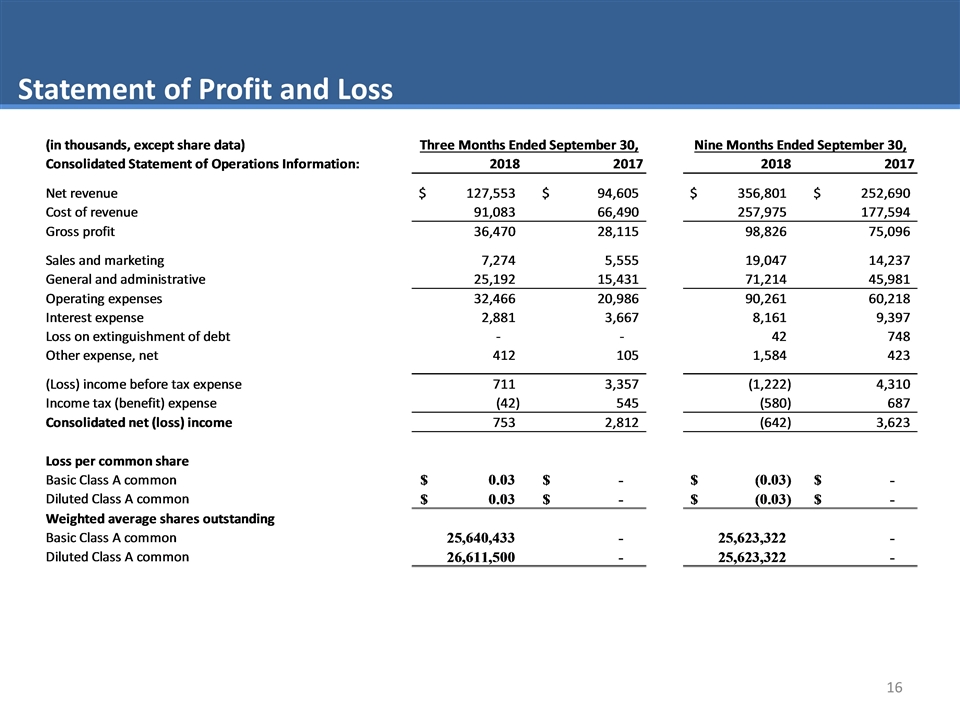
Statement of Profit and Loss
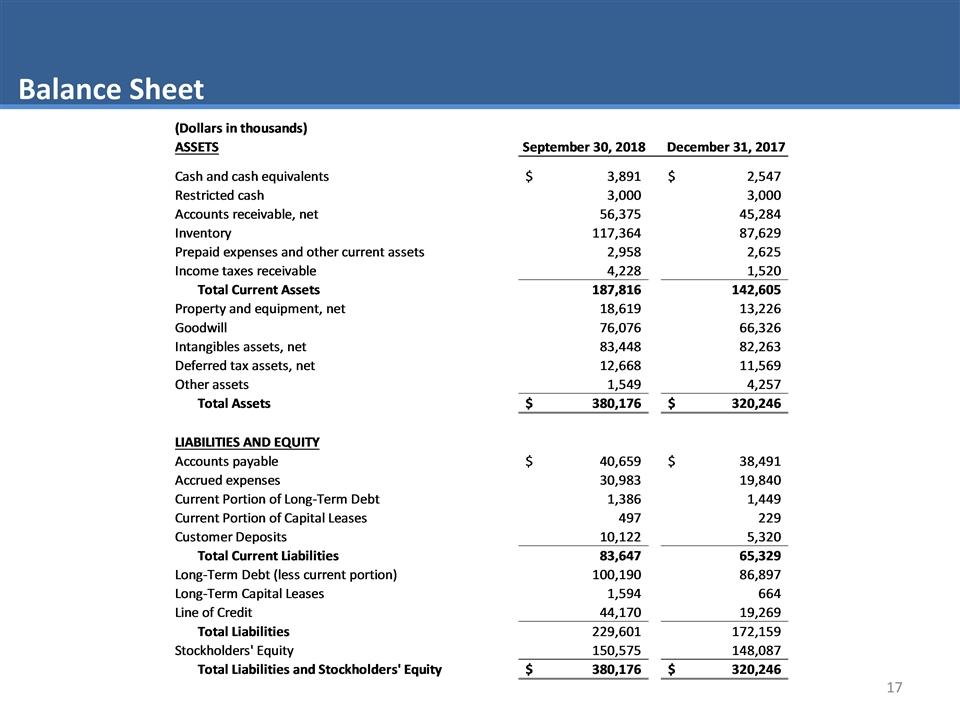
Balance Sheet
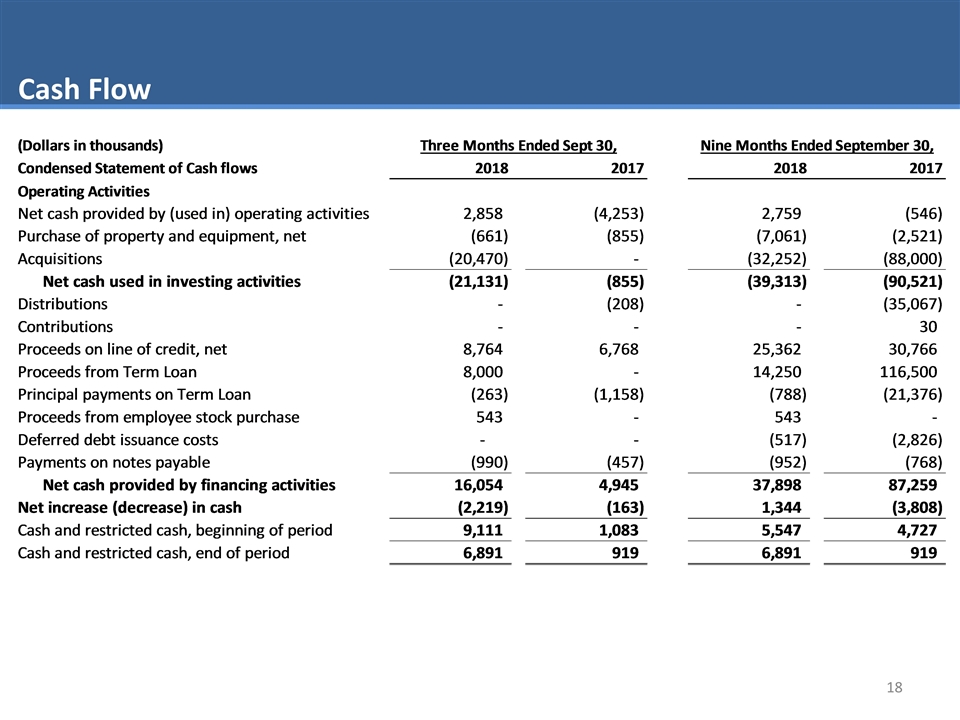
Cash Flow
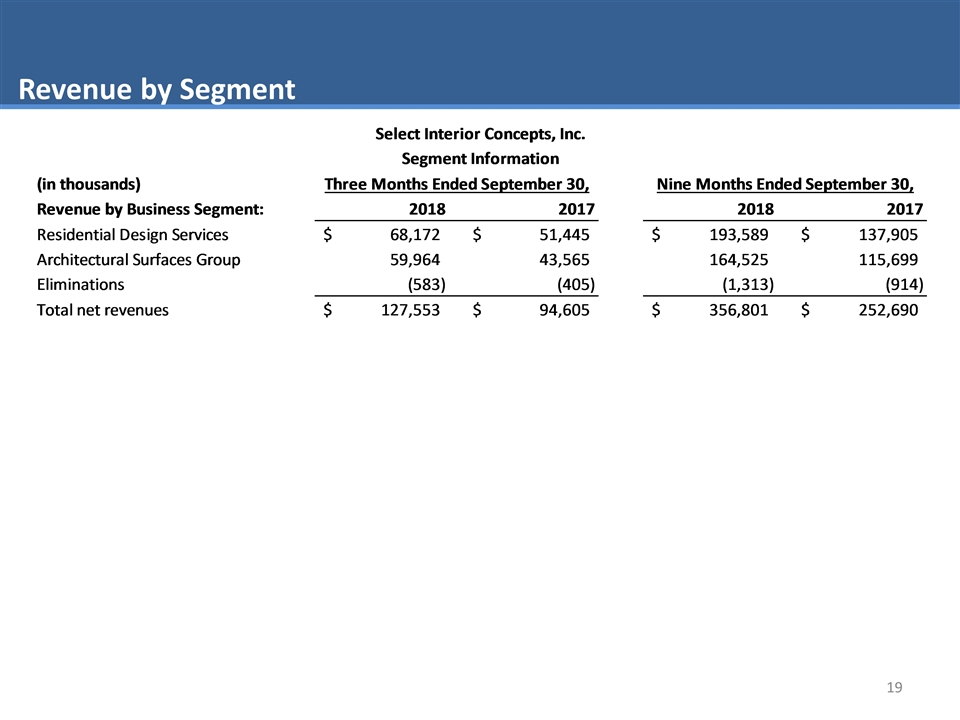
Revenue by Segment
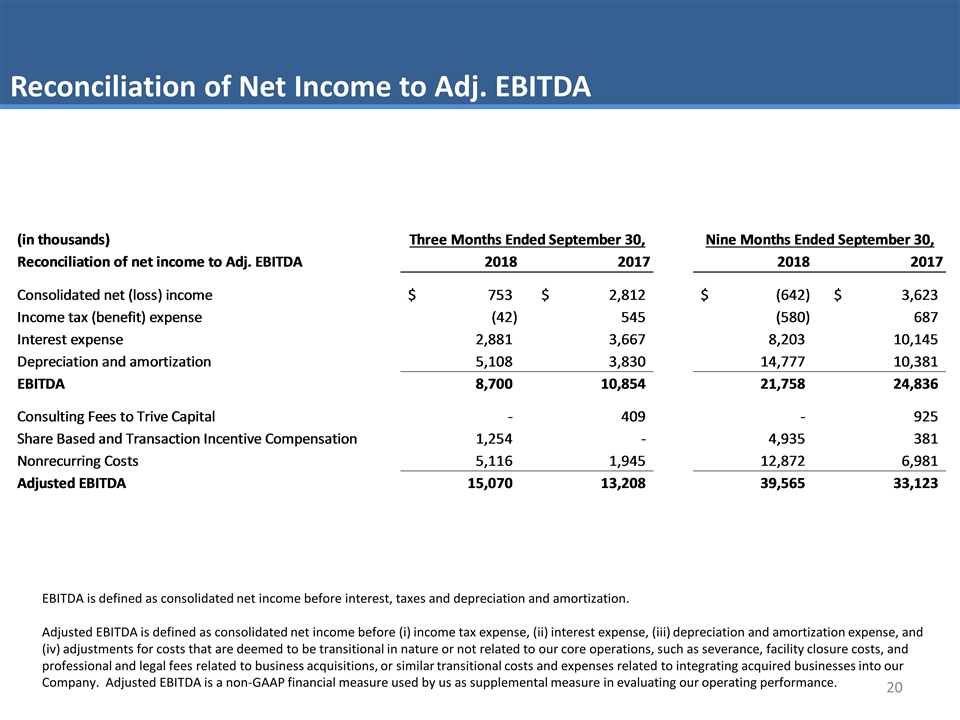
Reconciliation of Net Income to Adj. EBITDA EBITDA is defined as consolidated net income before interest, taxes and depreciation and amortization. Adjusted EBITDA is defined as consolidated net income before (i) income tax expense, (ii) interest expense, (iii) depreciation and amortization expense, and (iv) adjustments for costs that are deemed to be transitional in nature or not related to our core operations, such as severance, facility closure costs, and professional and legal fees related to business acquisitions, or similar transitional costs and expenses related to integrating acquired businesses into our Company. Adjusted EBITDA is a non-GAAP financial measure used by us as supplemental measure in evaluating our operating performance.
