Attached files
| file | filename |
|---|---|
| 8-K - 8-K INVESTOR DAY 2018 - GREENLIGHT CAPITAL RE, LTD. | form8-kinvestorday2018.htm |
Greenlight Capital Re 6th Biennial Investor Day November 14, 2018
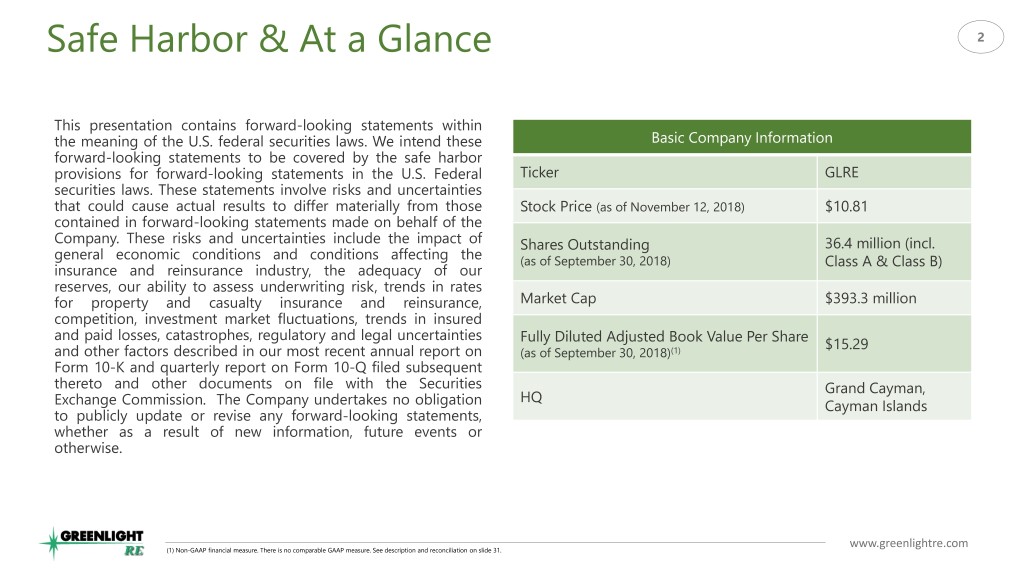
Safe Harbor & At a Glance 2 This presentation contains forward-looking statements within the meaning of the U.S. federal securities laws. We intend these Basic Company Information forward-looking statements to be covered by the safe harbor provisions for forward-looking statements in the U.S. Federal Ticker GLRE securities laws. These statements involve risks and uncertainties that could cause actual results to differ materially from those Stock Price (as of November 12, 2018) $10.81 contained in forward-looking statements made on behalf of the Company. These risks and uncertainties include the impact of Shares Outstanding 36.4 million (incl. general economic conditions and conditions affecting the (as of September 30, 2018) Class A & Class B) insurance and reinsurance industry, the adequacy of our reserves, our ability to assess underwriting risk, trends in rates for property and casualty insurance and reinsurance, Market Cap $393.3 million competition, investment market fluctuations, trends in insured and paid losses, catastrophes, regulatory and legal uncertainties Fully Diluted Adjusted Book Value Per Share $15.29 and other factors described in our most recent annual report on (as of September 30, 2018)(1) Form 10-K and quarterly report on Form 10-Q filed subsequent thereto and other documents on file with the Securities Grand Cayman, HQ Exchange Commission. The Company undertakes no obligation Cayman Islands to publicly update or revise any forward-looking statements, whether as a result of new information, future events or otherwise. www.greenlightre.com (1) Non-GAAP financial measure. There is no comparable GAAP measure. See description and reconciliation on slide 31.
Agenda 3 Simon Burton – CEO The Greenlight Re Strategy & Industry Dynamics Tim Courtis – CFO Brief Financial Overview David Einhorn – Chairman Investments Q & A Lunch & Refreshments www.greenlightre.com

Operational Overview Simon Burton Chief Executive Officer
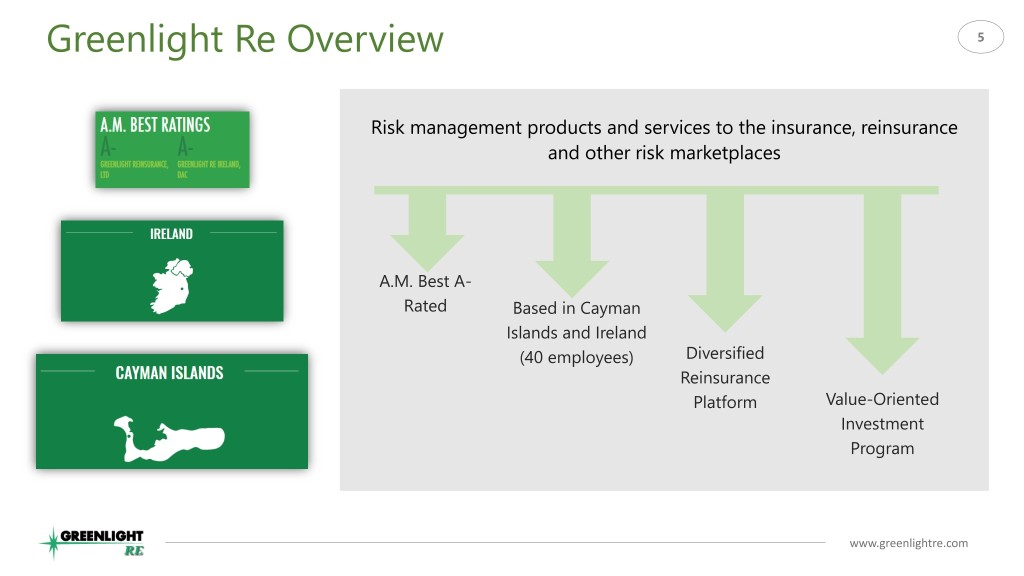
Greenlight Re Overview 5 Risk management products and services to the insurance, reinsurance and other risk marketplaces A.M. Best A- Rated Based in Cayman Islands and Ireland (40 employees) Diversified Reinsurance Platform Value-Oriented Investment Program www.greenlightre.com

Our Lines of Business 6 Other Property Our underwriting risks are grouped into three main 16% lines of business: 18% 1. Casualty: Includes motor liability, workers’ compensation, multi-line, general liability and professional liability 2. Property: Includes catastrophe, motor physical damage, personal and commercial lines 3. Other: Includes accident & health, financial lines, Casualty marine and other specialty business 66% 2018 YTD Gross Written Premiums: $432 million(1) www.greenlightre.com (1) For the nine month period ended September 30, 2018
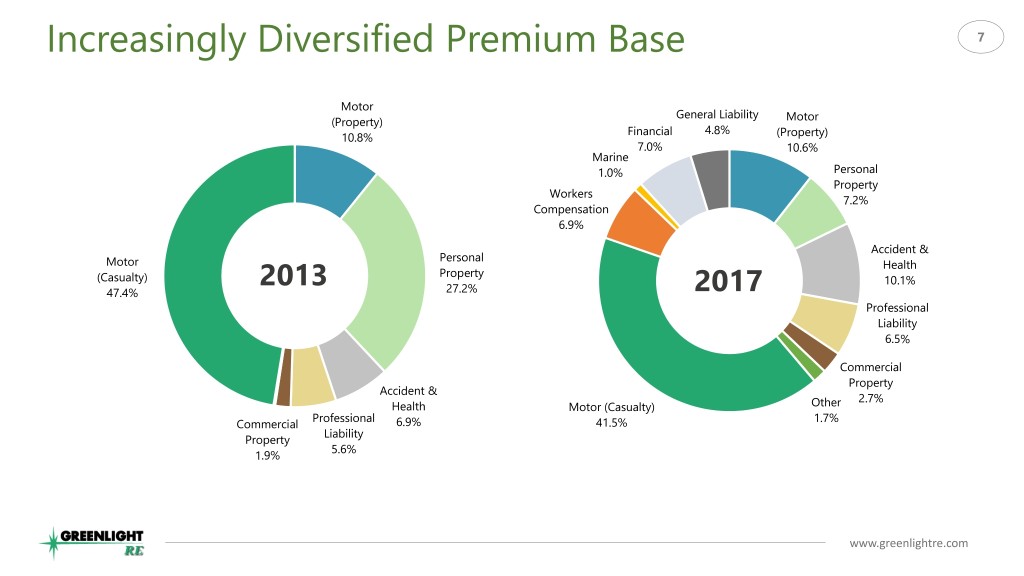
Increasingly Diversified Premium Base 7 Motor General Liability (Property) Motor Financial 4.8% 10.8% (Property) 7.0% 10.6% Marine 1.0% Personal Property Workers 7.2% Compensation 6.9% Accident & Personal Motor Health Property (Casualty) 2013 10.1% 47.4% 27.2% 2017 Professional Liability 6.5% Commercial Property Accident & 2.7% Health Motor (Casualty) Other Professional 1.7% Commercial 6.9% 41.5% Liability Property 5.6% 1.9% www.greenlightre.com
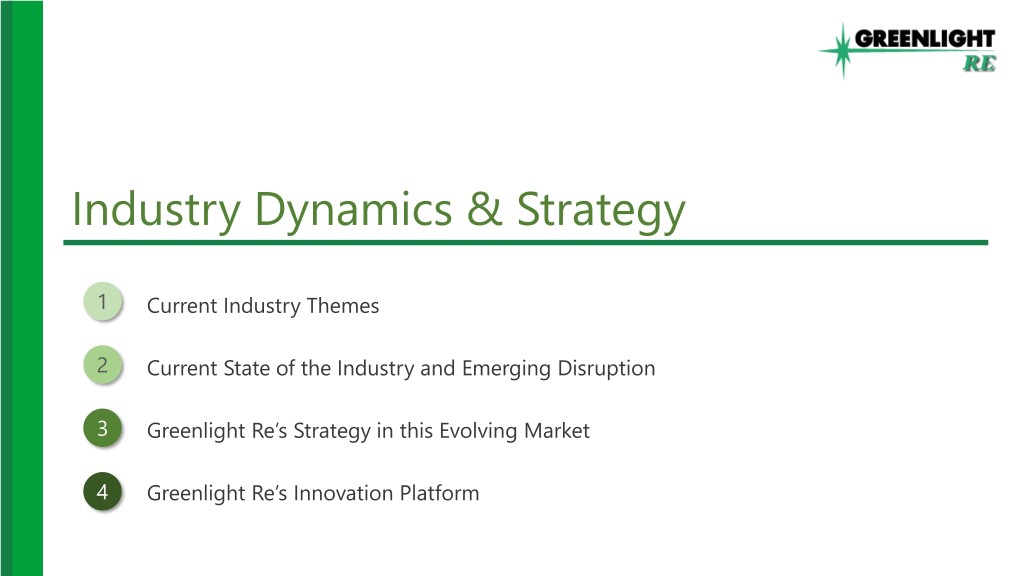
Industry Dynamics & Strategy 1 Current Industry Themes 2 Current State of the Industry and Emerging Disruption 3 Greenlight Re’s Strategy in this Evolving Market 4 Greenlight Re’s Innovation Platform
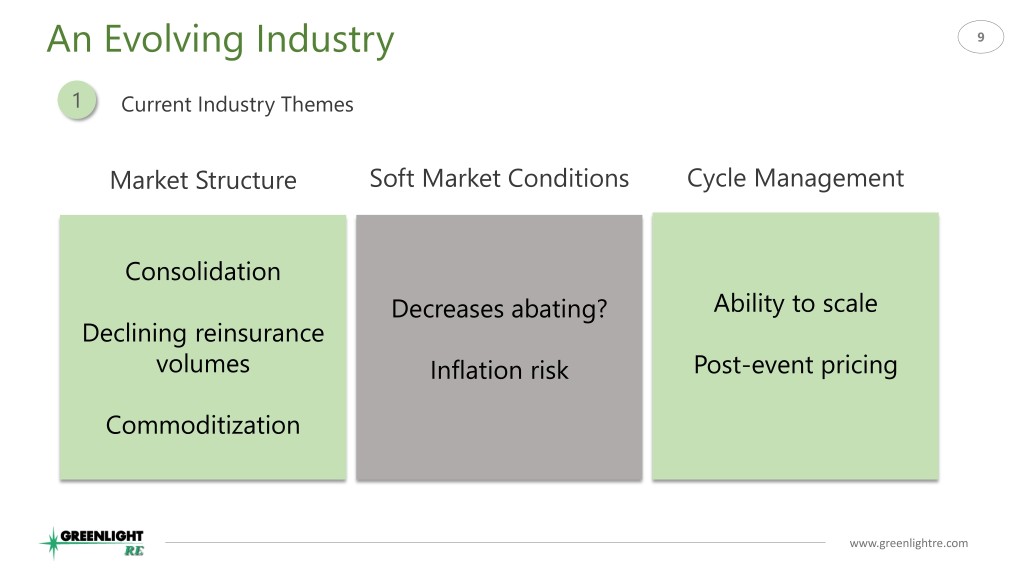
An Evolving Industry 9 1 Current Industry Themes Market Structure Soft Market Conditions Cycle Management Consolidation Decreases abating? Ability to scale Declining reinsurance volumes Inflation risk Post-event pricing Commoditization www.greenlightre.com
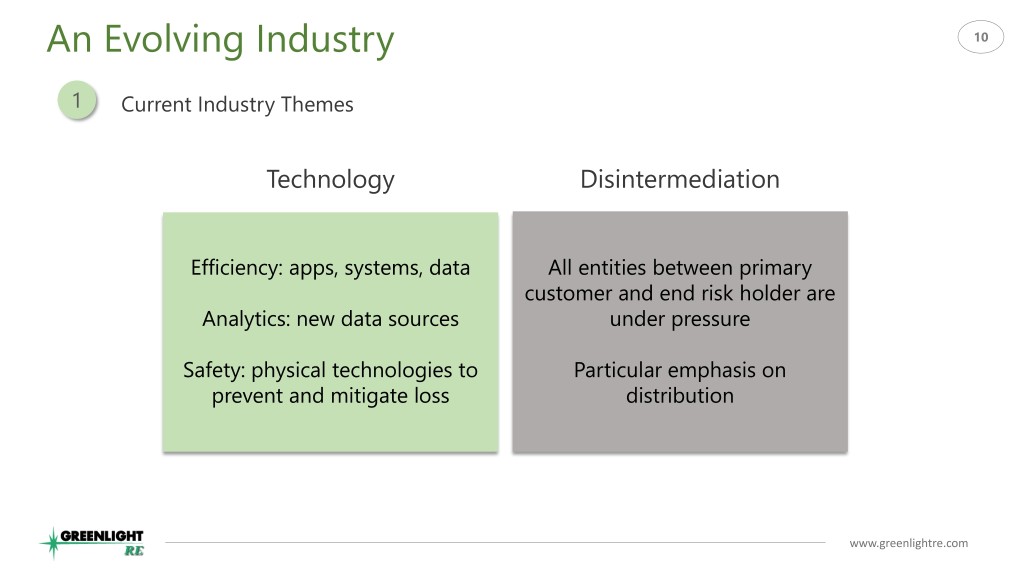
An Evolving Industry 10 1 Current Industry Themes Technology Disintermediation Efficiency: apps, systems, data All entities between primary customer and end risk holder are Analytics: new data sources under pressure Safety: physical technologies to Particular emphasis on prevent and mitigate loss distribution www.greenlightre.com
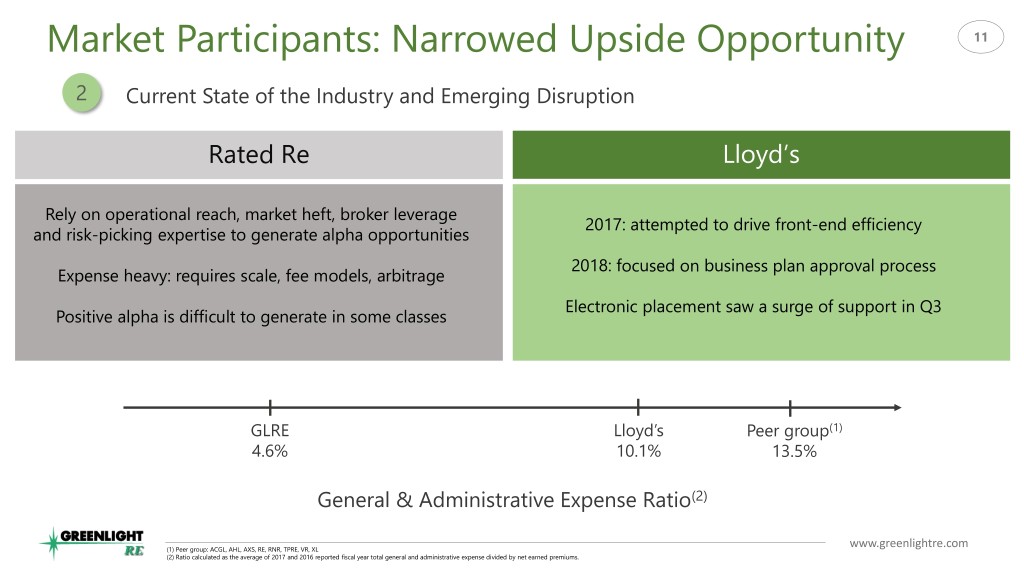
Market Participants: Narrowed Upside Opportunity 11 2 Current State of the Industry and Emerging Disruption Rated Re Lloyd’s Rely on operational reach, market heft, broker leverage 2017: attempted to drive front-end efficiency and risk-picking expertise to generate alpha opportunities 2018: focused on business plan approval process Expense heavy: requires scale, fee models, arbitrage Electronic placement saw a surge of support in Q3 Positive alpha is difficult to generate in some classes GLRE Lloyd’s Peer group(1) 4.6% 10.1% 13.5% General & Administrative Expense Ratio(2) (1) Peer group: ACGL, AHL, AXS, RE, RNR, TPRE, VR, XL www.greenlightre.com (2) Ratio calculated as the average of 2017 and 2016 reported fiscal year total general and administrative expense divided by net earned premiums.
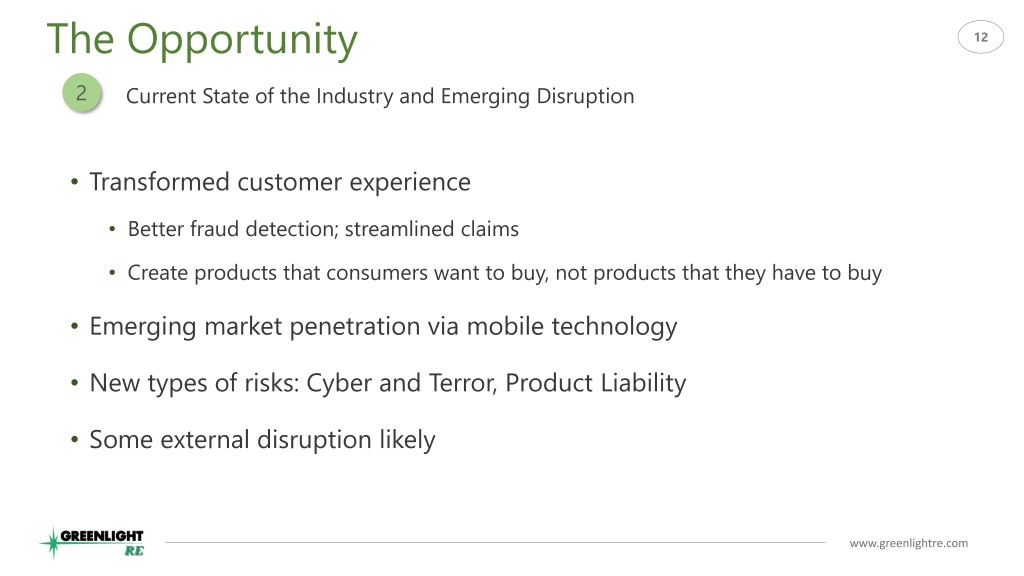
The Opportunity 12 2 Current State of the Industry and Emerging Disruption • Transformed customer experience • Better fraud detection; streamlined claims • Create products that consumers want to buy, not products that they have to buy • Emerging market penetration via mobile technology • New types of risks: Cyber and Terror, Product Liability • Some external disruption likely www.greenlightre.com
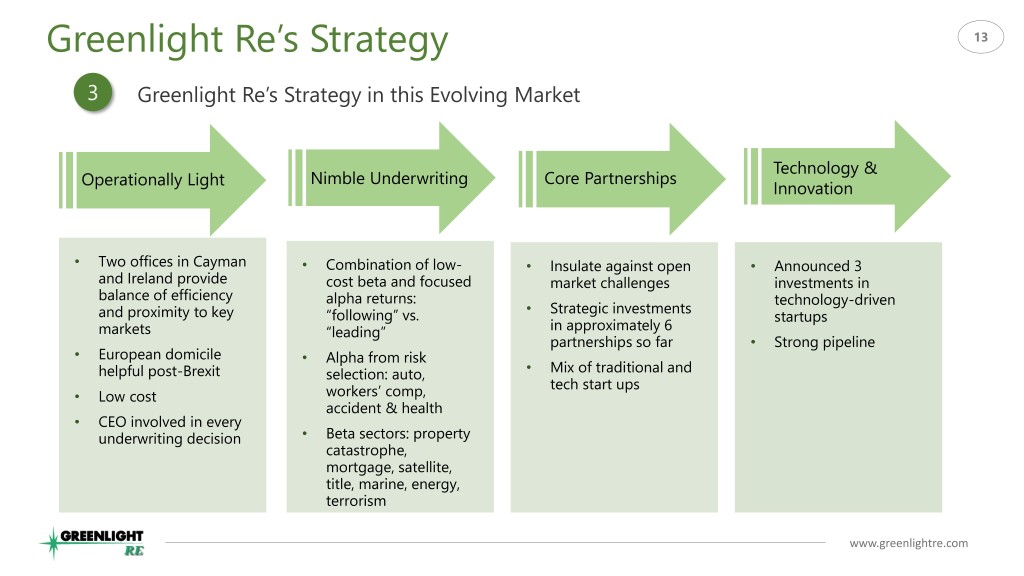
Greenlight Re’s Strategy 13 3 Greenlight Re’s Strategy in this Evolving Market Technology & Operationally Light Nimble Underwriting Core Partnerships Innovation • Two offices in Cayman • Combination of low- • Insulate against open • Announced 3 and Ireland provide cost beta and focused market challenges investments in balance of efficiency alpha returns: technology-driven • Strategic investments and proximity to key “following” vs. startups markets “leading” in approximately 6 partnerships so far • Strong pipeline • European domicile • Alpha from risk helpful post-Brexit selection: auto, • Mix of traditional and tech start ups • Low cost workers’ comp, accident & health • CEO involved in every underwriting decision • Beta sectors: property catastrophe, mortgage, satellite, title, marine, energy, terrorism www.greenlightre.com
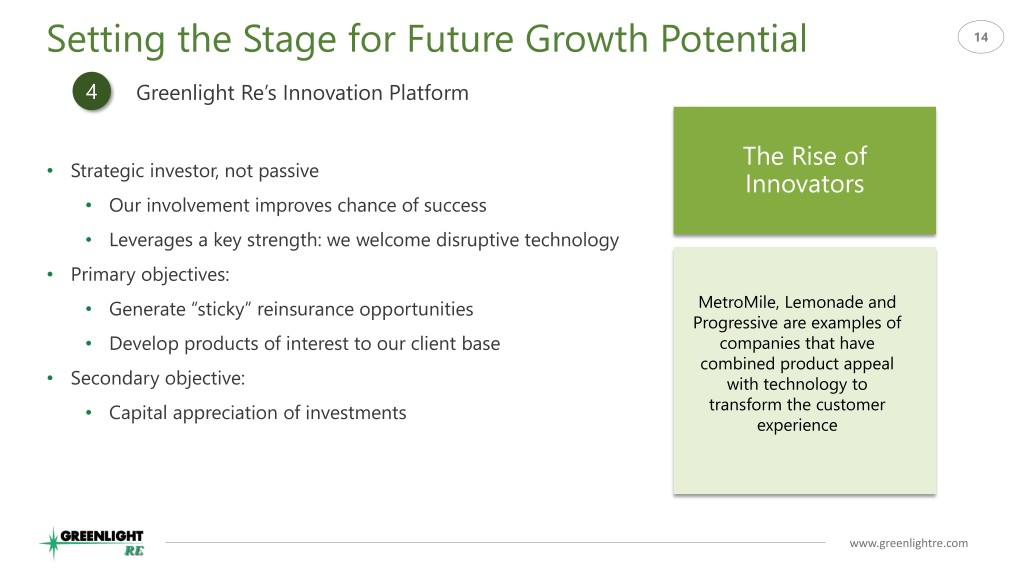
Setting the Stage for Future Growth Potential 14 4 Greenlight Re’s Innovation Platform The Rise of • Strategic investor, not passive Innovators • Our involvement improves chance of success • Leverages a key strength: we welcome disruptive technology • Primary objectives: • Generate “sticky” reinsurance opportunities MetroMile, Lemonade and Progressive are examples of • Develop products of interest to our client base companies that have combined product appeal • Secondary objective: with technology to • Capital appreciation of investments transform the customer experience www.greenlightre.com
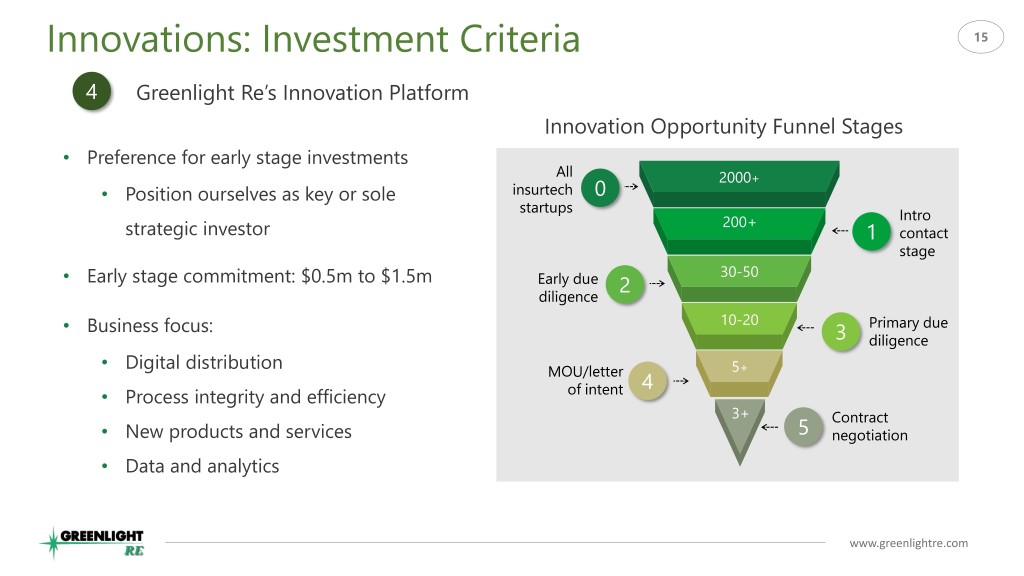
Innovations: Investment Criteria 15 4 Greenlight Re’s Innovation Platform Innovation Opportunity Funnel Stages • Preference for early stage investments All 2000+ • Position ourselves as key or sole insurtech 0 startups 200+ Intro strategic investor 1 contact stage 30-50 • Early stage commitment: $0.5m to $1.5m Early due 2 diligence • Business focus: 10-20 Primary due 3 diligence • Digital distribution 5+ MOU/letter 4 • Process integrity and efficiency of intent 3+ Contract • New products and services 5 negotiation • Data and analytics www.greenlightre.com
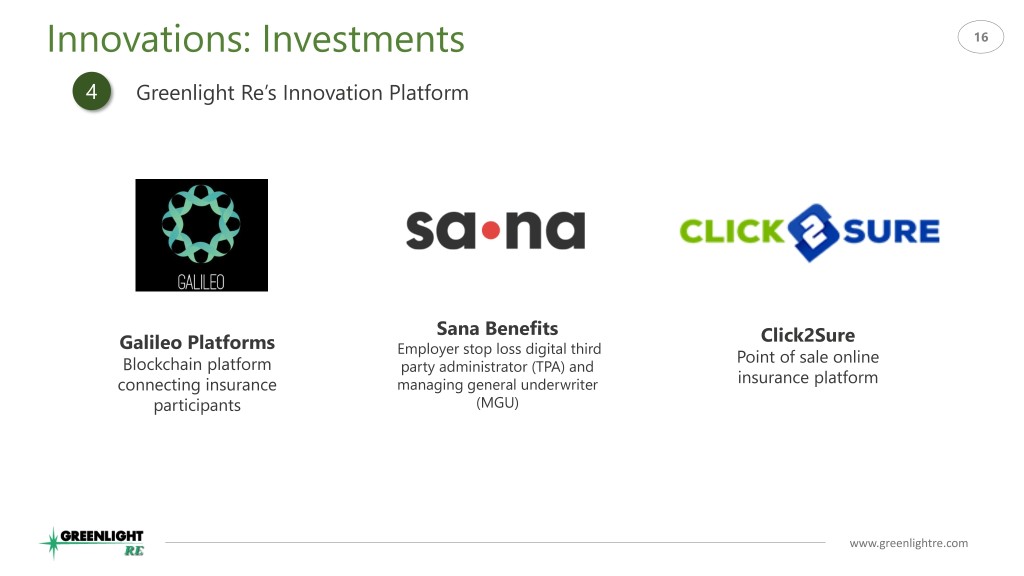
Innovations: Investments 16 4 Greenlight Re’s Innovation Platform Sana Benefits Galileo Platforms Click2Sure Employer stop loss digital third Point of sale online Blockchain platform party administrator (TPA) and connecting insurance managing general underwriter insurance platform participants (MGU) www.greenlightre.com

Financial Overview Tim Courtis Chief Financial Officer

Profitable Underwriting 18 Apart from catastrophe losses in 2017, Greenlight Re’s composite ratio has remained relatively stable over past six years Accident Year Ultimate Composite Ratios Includes catastrophe losses of $43 million (6.9% of net premiums earned) 114.9% 116.1% 99.9% 100.0% 101.6% 95.7% 94.5% 97.0% 97.0% 35.7% 36.5% 91.5% 25.8% 32.2% 26.2% 36.2% 30.6% 28.5% 31.4% 30.4% 79.2% 79.6% 75.8% 67.8% 68.5% 70.8% 63.7% 65.1% 63.1% 61.1% 2008 2009 2010 2011 2012 2013 2014 2015 2016 2017 Accident Year Ultimate Loss Ratios (1) Acquisition Cost Ratio (2) . Note: Composite ratio excludes underwriting expenses which are included in the combined ratio. www.greenlightre.com (1) Calculated as total ultimate incurred claims and allocated claim adjustment expenses of the respective accident year, net of reinsurance, as of fiscal year ended December 31, 2017, divided by net premiums earned for the fiscal year. This is a non-GAAP financial measure that has no comparable GAAP measure. (2) Calculated as acquisition costs, net, incurred during the fiscal year, divided by net premiums earned for the fiscal year.
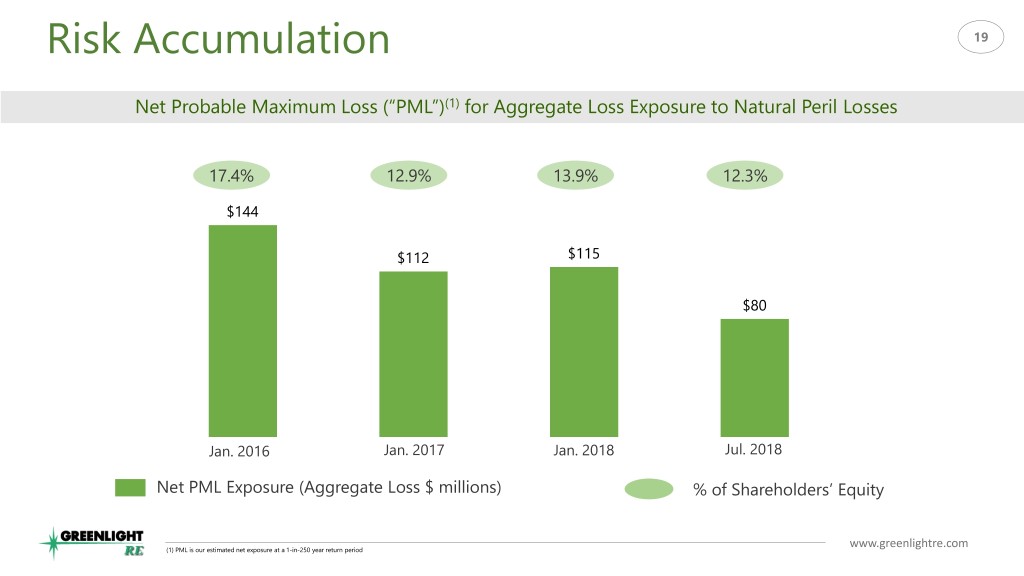
Risk Accumulation 19 Net Probable Maximum Loss (“PML”)(1) for Aggregate Loss Exposure to Natural Peril Losses 17.4% 12.9% 13.9% 12.3% $144 $112 $115 $80 Jan. 2016 Jan. 2017 Jan. 2018 Jul. 2018 Net PML Exposure (Aggregate Loss $ millions) % of Shareholders’ Equity www.greenlightre.com (1) PML is our estimated net exposure at a 1-in-250 year return period
Balance Sheet Restructuring 20 • New fund structure as of September 1, 2018 simplifies the investment presentation on the balance sheet = Solasglas Investments, LP • Greenlight Re will report a net asset value based on its limited partnership interest in Solasglas, in lieu of reporting gross values of long and short investments and derivatives on the balance sheet • Transition from the joint venture to Solasglas to be completed in January 2019 • DME Advisors II, LLC, as general partner, added $36 million of additional capital to Solasglas • Investment leverage was reduced by excluding net reserves from the investment portfolio in Solasglas www.greenlightre.com

Share Price vs. Book Value 21 Greenlight Re is trading at a discount to book value $40 32.65 $35 33.71 $30 26.81 30.76 23.67 23.08 23.59 22.17 23.38 $25 22.22 20.79 27.91 $20 13.39 22.01 15.29 21.61 22.80 18.95 21.39 18.71 20.10 $15 16.57 14.27 12.99 $10 12.40 11.63 10.21 $5 Fully Diluted Adjusted Book Value Per Share Share Price www.greenlightre.com

Investments David Einhorn Chairman
Investment Approach 23 • Value-focused, long/short investment program • Goal is to maximize total risk-adjusted return • Average gross exposure of 95% long and 61% short since formation of GLRE • Portfolio is 92% long and 60% short as of October 31, 2018 • Annualized net return of 4.4% since formation of GLRE in August 2004(1) (1) As of October 31, 2018. See “Investment Portfolio Disclosure” at the end of the presentation. www.greenlightre.com
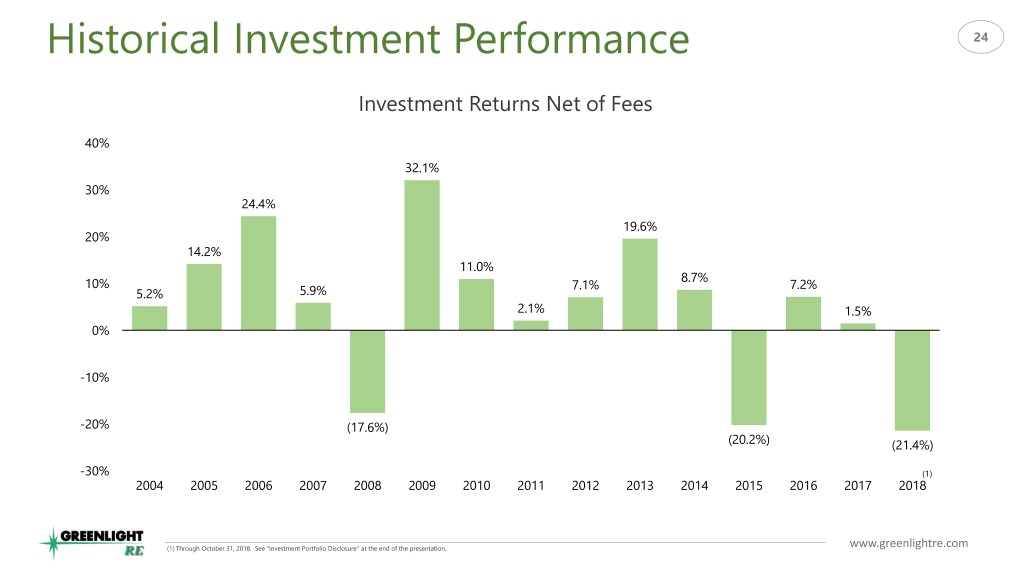
Historical Investment Performance 24 Investment Returns Net of Fees 40% 32.1% 30% 24.4% 19.6% 20% 14.2% 11.0% 8.7% 10% 7.1% 7.2% 5.2% 5.9% 2.1% 1.5% 0% -10% -20% (17.6%) (20.2%) (21.4%) -30% (1) 2004 2005 2006 2007 2008 2009 2010 2011 2012 2013 2014 2015 2016 2017 2018 (1) Through October 31, 2018. See “Investment Portfolio Disclosure” at the end of the presentation. www.greenlightre.com
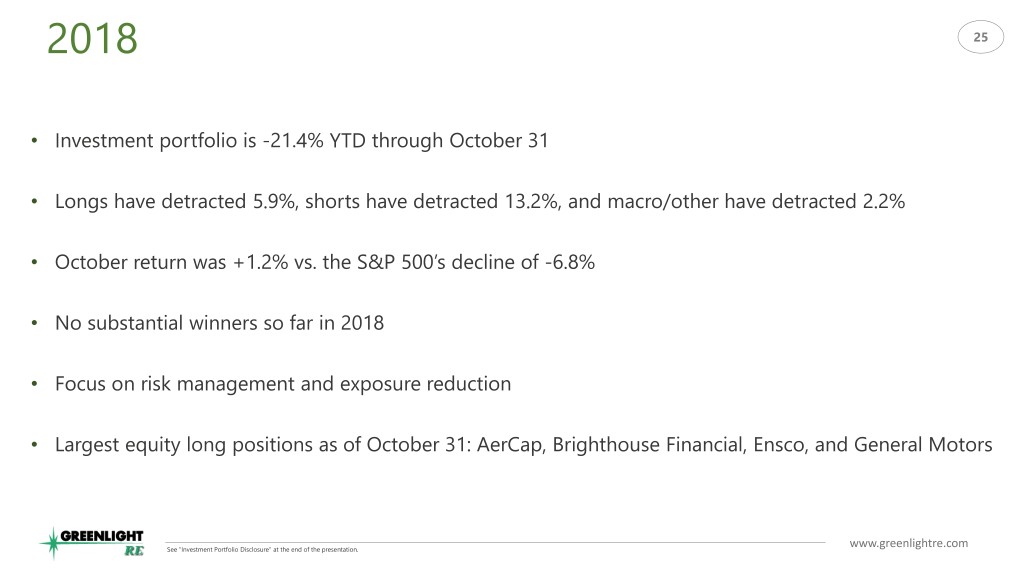
2018 25 • Investment portfolio is -21.4% YTD through October 31 • Longs have detracted 5.9%, shorts have detracted 13.2%, and macro/other have detracted 2.2% • October return was +1.2% vs. the S&P 500’s decline of -6.8% • No substantial winners so far in 2018 • Focus on risk management and exposure reduction • Largest equity long positions as of October 31: AerCap, Brighthouse Financial, Ensco, and General Motors See “Investment Portfolio Disclosure” at the end of the presentation. www.greenlightre.com
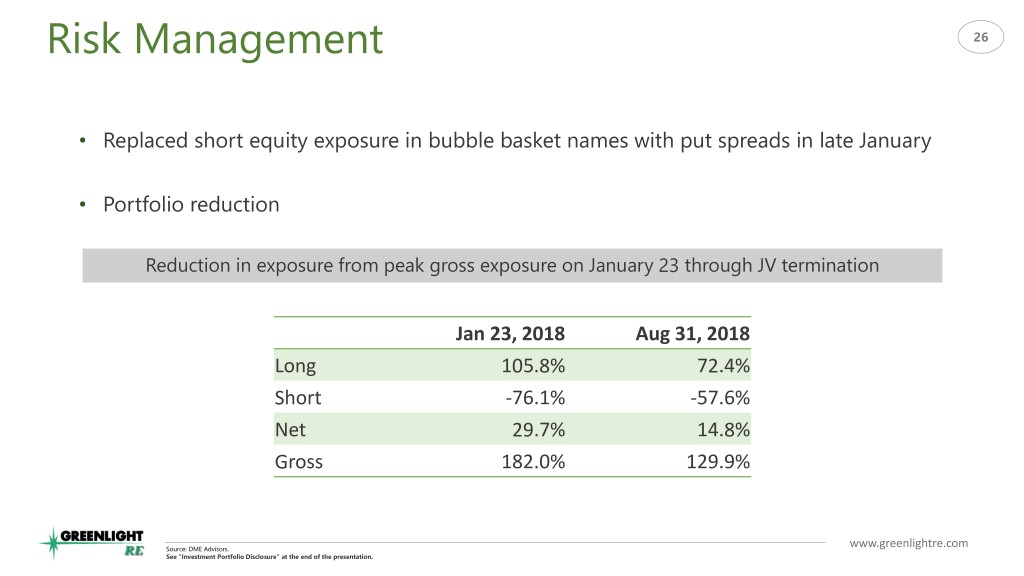
Risk Management 26 • Replaced short equity exposure in bubble basket names with put spreads in late January • Portfolio reduction Reduction in exposure from peak gross exposure on January 23 through JV termination Jan 23, 2018 Aug 31, 2018 Long 105.8% 72.4% Short -76.1% -57.6% Net 29.7% 14.8% Gross 182.0% 129.9% Source: DME Advisors. www.greenlightre.com See “Investment Portfolio Disclosure” at the end of the presentation.
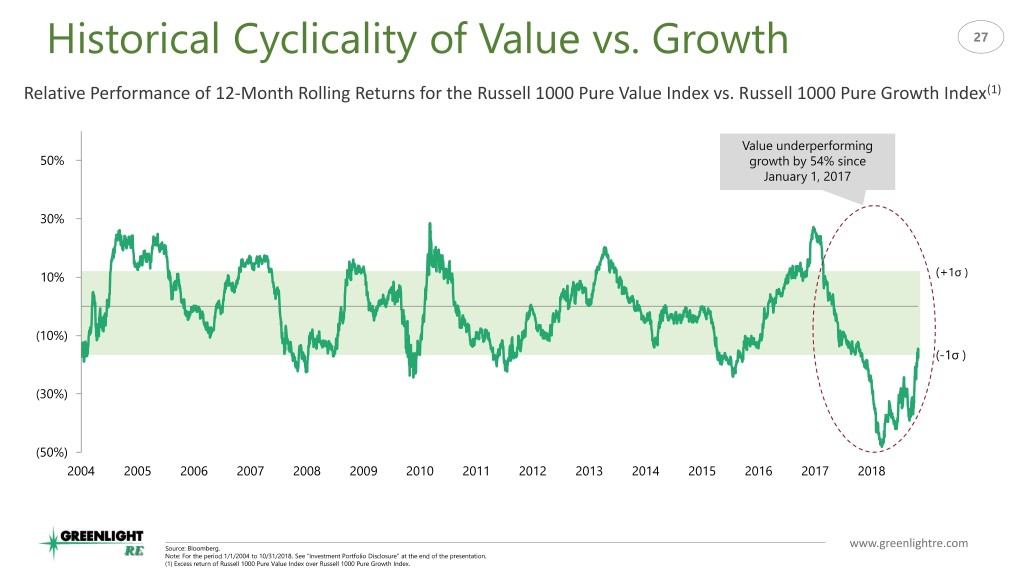
Historical Cyclicality of Value vs. Growth 27 Relative Performance of 12-Month Rolling Returns for the Russell 1000 Pure Value Index vs. Russell 1000 Pure Growth Index(1) Value underperforming 50% growth by 54% since January 1, 2017 30% 10% (+1σ ) (10%) (-1σ ) (30%) (50%) 2004 2005 2006 2007 2008 2009 2010 2011 2012 2013 2014 2015 2016 2017 2018 Source: Bloomberg. www.greenlightre.com Note: For the period 1/1/2004 to 10/31/2018. See “Investment Portfolio Disclosure” at the end of the presentation. (1) Excess return of Russell 1000 Pure Value Index over Russell 1000 Pure Growth Index.
Conclusions 28 • Underwriting portfolio is further diversified and performing well in 2018 • Lower cost base with focus on increased operational efficiency • Greenlight Re Innovations offers an exciting growth opportunity • Compelling value-oriented investment portfolio • GLRE trades at substantial discount to book value www.greenlightre.com

Appendix
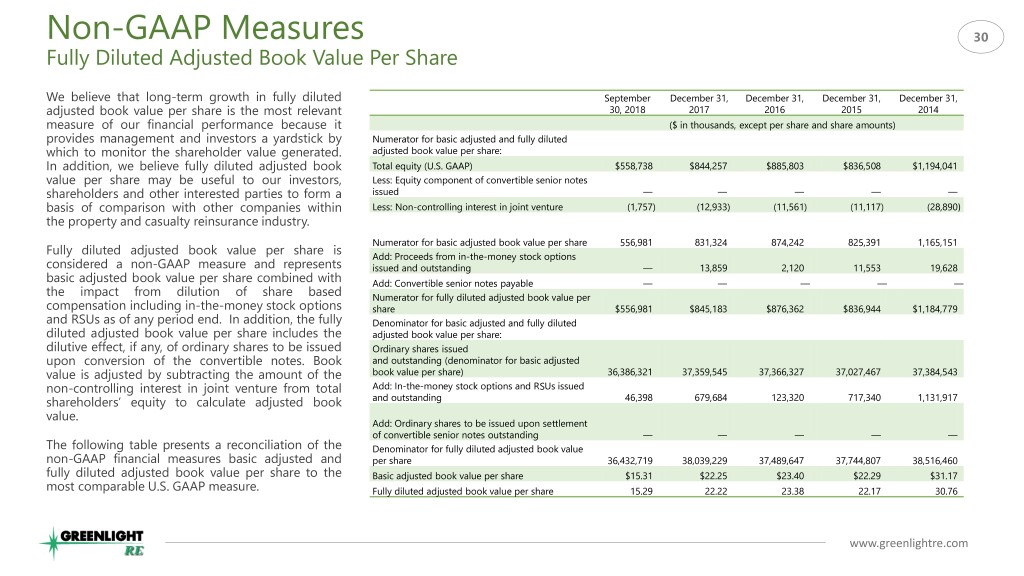
Non-GAAP Measures 30 Fully Diluted Adjusted Book Value Per Share We believe that long-term growth in fully diluted September December 31, December 31, December 31, December 31, adjusted book value per share is the most relevant 30, 2018 2017 2016 2015 2014 measure of our financial performance because it ($ in thousands, except per share and share amounts) provides management and investors a yardstick by Numerator for basic adjusted and fully diluted which to monitor the shareholder value generated. adjusted book value per share: In addition, we believe fully diluted adjusted book Total equity (U.S. GAAP) $558,738 $844,257 $885,803 $836,508 $1,194,041 value per share may be useful to our investors, Less: Equity component of convertible senior notes shareholders and other interested parties to form a issued — — — — — basis of comparison with other companies within Less: Non-controlling interest in joint venture (1,757) (12,933) (11,561) (11,117) (28,890) the property and casualty reinsurance industry. Numerator for basic adjusted book value per share 556,981 831,324 874,242 825,391 1,165,151 Fully diluted adjusted book value per share is Add: Proceeds from in-the-money stock options considered a non-GAAP measure and represents issued and outstanding — 13,859 2,120 11,553 19,628 basic adjusted book value per share combined with Add: Convertible senior notes payable — — — — — the impact from dilution of share based Numerator for fully diluted adjusted book value per compensation including in-the-money stock options share $556,981 $845,183 $876,362 $836,944 $1,184,779 and RSUs as of any period end. In addition, the fully Denominator for basic adjusted and fully diluted diluted adjusted book value per share includes the adjusted book value per share: dilutive effect, if any, of ordinary shares to be issued Ordinary shares issued upon conversion of the convertible notes. Book and outstanding (denominator for basic adjusted value is adjusted by subtracting the amount of the book value per share) 36,386,321 37,359,545 37,366,327 37,027,467 37,384,543 non-controlling interest in joint venture from total Add: In-the-money stock options and RSUs issued shareholders’ equity to calculate adjusted book and outstanding 46,398 679,684 123,320 717,340 1,131,917 value. Add: Ordinary shares to be issued upon settlement of convertible senior notes outstanding — — — — — The following table presents a reconciliation of the Denominator for fully diluted adjusted book value non-GAAP financial measures basic adjusted and per share 36,432,719 38,039,229 37,489,647 37,744,807 38,516,460 fully diluted adjusted book value per share to the Basic adjusted book value per share $15.31 $22.25 $23.40 $22.29 $31.17 most comparable U.S. GAAP measure. Fully diluted adjusted book value per share 15.29 22.22 23.38 22.17 30.76 www.greenlightre.com
Investment Portfolio Disclosure 31 All information provided is for informational purposes only and should not be deemed as investment advice or a recommendation to purchase or sell any specific security. Performance returns are estimated pending the year-end audit. Past performance is not indicative of future results. Actual returns may differ from the returns presented. Positions reflected in this presentation do not represent all the positions held, purchased, or sold, and in the aggregate, the information may represent a small percentage of activity. The information presented is intended to provide insight into the noteworthy events, in the sole opinion of the presenter, affecting the portfolio. Unless otherwise indicated, all exposure information is calculated on a delta-adjusted basis and excludes credit default swaps, interest rate swaps, sovereign debt, currencies, commodities, volatility indexes and derivatives on any of these instruments. Reference to an index does not imply that the managed account will achieve returns, volatility or other results similar to the index. The total returns for the index do not reflect the deduction of any fees or expenses which would reduce returns. www.greenlightre.com
