Attached files
| file | filename |
|---|---|
| 8-K - 8-K - O-I Glass, Inc. /DE/ | a18-40134_18k.htm |
2 INVESTOR DAY 2018 SAFE HARBOR COMMENTS Forward-Looking Statements This presentation contains "forward-looking" statements within the meaning of Section 21E of the Securities Exchange Act of 1934, as amended (the “Exchange Act”) and Section 27A of the Securities Act of 1933. Forward-looking statements reflect the Company's current expectations and projections about future events at the time, and thus involve uncertainty and risk. The words “believe,” “expect,” “anticipate,” “will,” “could,” “would,” “should,” “may,” “plan,” “estimate,” “intend,” “predict,” “potential,” “continue,” and the negatives of these words and other similar expressions generally identify forward-looking statements. It is possible the Company's future financial performance may differ from expectations due to a variety of factors including, but not limited to the following: (1) foreign currency fluctuations relative to the U.S. dollar, (2) changes in capital availability or cost, including interest rate fluctuations and the ability of the Company to refinance debt at favorable terms, (3) the general political, economic and competitive conditions in markets and countries where the Company has operations, including uncertainties related to economic and social conditions, disruptions in the supply chain, competitive pricing pressures, inflation or deflation, and changes in tax rates and laws, (4) the Company’s ability to generate sufficient future cash flows to ensure the Company’s goodwill is not impaired, (5) consumer preferences for alternative forms of packaging, (6) cost and availability of raw materials, labor, energy and transportation, (7) the Company’s ability to manage its cost structure, including its success in implementing restructuring plans and achieving cost savings, (8) consolidation among competitors and customers, (9) the Company’s ability to acquire businesses and expand plants, integrate operations of acquired businesses and achieve expected synergies, (10) unanticipated expenditures with respect to environmental, safety and health laws, (11) unanticipated operational disruptions, including higher capital spending, (12) the Company’s ability to further develop its sales, marketing and product development capabilities, (13) the failure of the Company’s joint venture partners to meet their obligations or commit additional capital to joint ventures, (14) the Company’s ability to prevent and detect cybersecurity threats against its information technology systems, (15) the Company’s ability to accurately estimate its total asbestos-related liability or to control the timing and occurrence of events related to outstanding asbestos-related claims, including but not limited to settlements of those claims, (16) changes in U.S. trade policies, (17) the Company’s ability to achieve its strategic plan, and the other risk factors discussed in the Annual Report on Form 10-K for the year ended December 31, 2017 and any subsequently filed Annual Report on Form 10-K, Quarterly Report on Form 10-Q or the Company’s other filings with the Securities and Exchange Commission. It is not possible to foresee or identify all such factors. Any forward-looking statements in this presentation are based on certain assumptions and analyses made by the Company in light of its experience and perception of historical trends, current conditions, expected future developments, and other factors it believes are appropriate in the circumstances. Forward-looking statements are not a guarantee of future performance and actual results or developments may differ materially from expectations. While the Company continually reviews trends and uncertainties affecting the Company's results of operations and financial condition, the Company does not assume any obligation to update or supplement any particular forward-looking statements contained in this presentation. The Company routinely posts important information on its website – www.o-i.com/investors.
ANDRES LOPEZ // CEO Transformational Journey

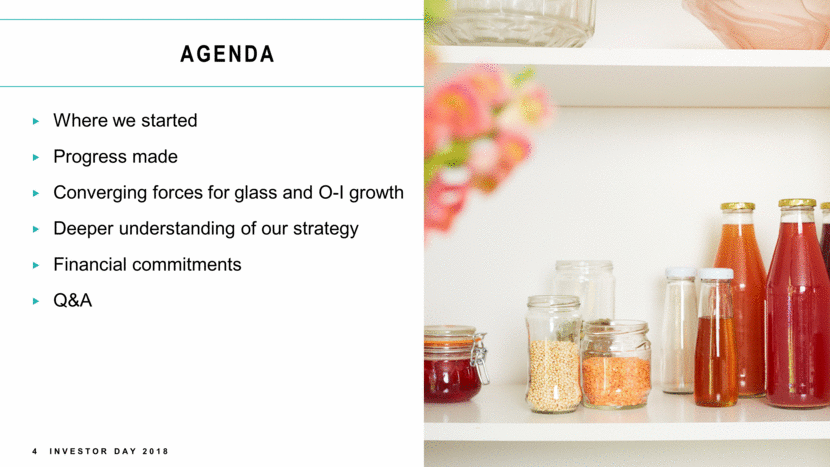
4 INVESTOR DAY 2018 AGENDA Where we started Progress made Converging forces for glass and O-I growth Deeper understanding of our strategy Financial commitments Q&A
5 INVESTOR DAY 2018 O-I’S DRAMATICALLY BETTER POSITION TODAY ENABLES OUR FUTURE Increased aEPS ~37% Integrating acquisitions ADJUSTED Free Cash flow ~$395M average Margin expansion +170 basis points SALES VOLUME GROWTH 12% for O-I De-risking Reduced legacy liabilities ~20% Share Repurchase $125M share buybacks Note: statistics generally 2018f vs 2015
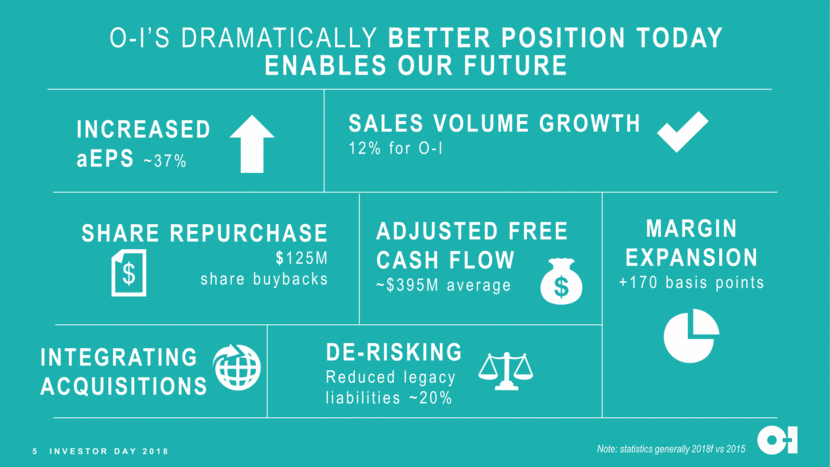
6 INVESTOR DAY 2018 DELIVERING ON OUR TRANSFORMATION Business stability Commercial performance Flexibility Structural cost reduction Performance culture & talent 2016-2018 Rising earnings; solid cash generation; deleverage; initiate share buybacks
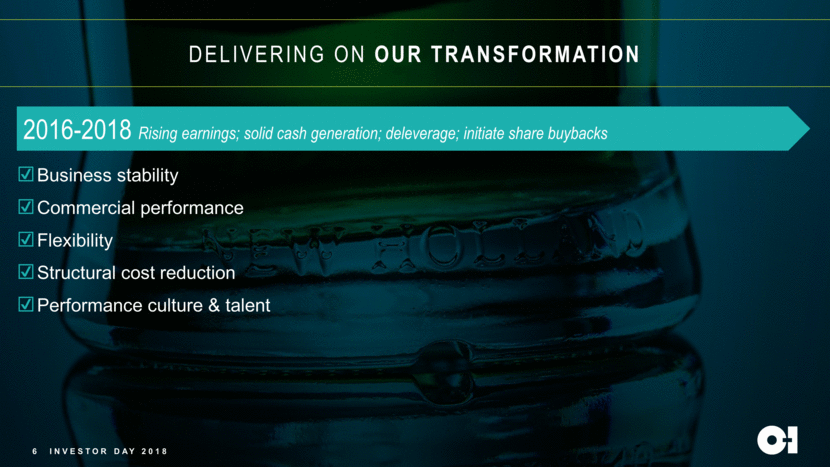
7 INVESTOR DAY 2018 DELIVERING ON OUR TRANSFORMATION 2019-2021 Initiate dividend; increase share buybacks; de-risk balance sheet 2016-2018 Rising earnings; solid cash generation; deleverage; initiate share buybacks Grow & expand given favorable market trends Structural cost improvement Sustainability Breakthrough technology Capital allocation Business stability Commercial performance Flexibility Structural cost reduction Performance culture & talent INITIATE QUARTERLY DIVIDEND $0.05 per share starting 1Q19
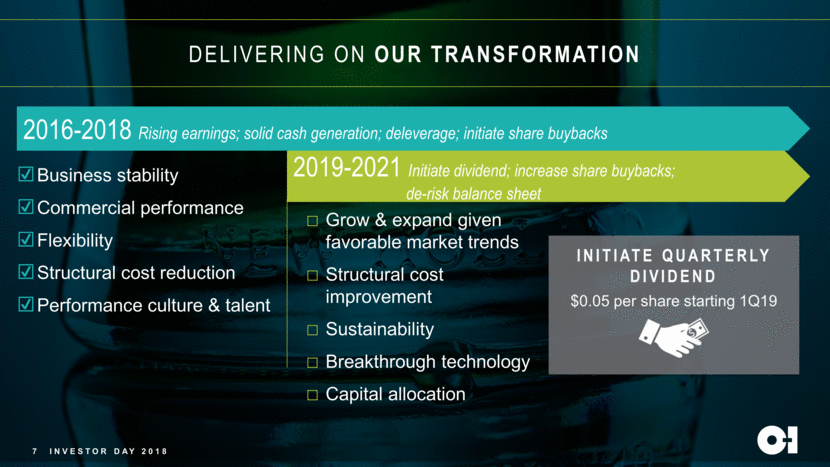
8 INVESTOR DAY 2018 DELIVERING ON OUR TRANSFORMATION BEYOND 2021 Grow & expand given favorable market trends Structural cost improvement Sustainability Breakthrough technology Capital allocation Simplified, agile organization Commercialize technology Continued momentum 2019-2021 Initiate dividend; increase share buybacks; de-risk balance sheet 2016-2018 Rising earnings; solid cash generation; deleverage; initiate share buybacks Business stability Commercial performance Flexibility Structural cost reduction Performance culture & talent
RENEWED INTEREST IN GLASS

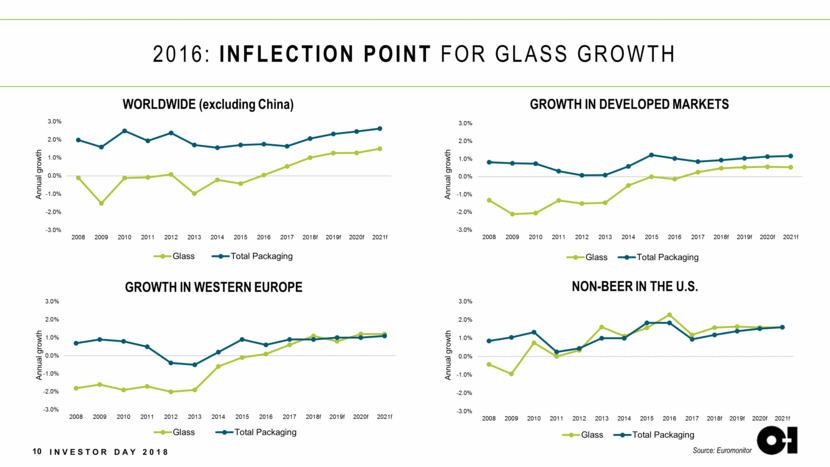
10 INVESTOR DAY 2018 2016: INFLECTION POINT FOR GLASS GROWTH GROWTH IN DEVELOPED MARKETS WORLDWIDE (excluding China) GROWTH IN WESTERN EUROPE Source: Euromonitor NON-BEER IN THE U.S. Annual growth Annual growth Annual growth Annual growth -3.0% -2.0% -1.0% 0.0% 1.0% 2.0% 3.0% 2008 2009 2010 2011 2012 2013 2014 2015 2016 2017 2018f 2019f 2020f 2021f Glass Total Packaging -3.0% -2.0% -1.0% 0.0% 1.0% 2.0% 3.0% 2008 2009 2010 2011 2012 2013 2014 2015 2016 2017 2018f 2019f 2020f 2021f Glass Total Packaging -3.0% -2.0% -1.0% 0.0% 1.0% 2.0% 3.0% 2008 2009 2010 2011 2012 2013 2014 2015 2016 2017 2018f 2019f 2020f 2021f Glass Total Packaging -3.0% -2.0% -1.0% 0.0% 1.0% 2.0% 3.0% 2008 2009 2010 2011 2012 2013 2014 2015 2016 2017 2018f 2019f 2020f 2021f Glass Total Packaging
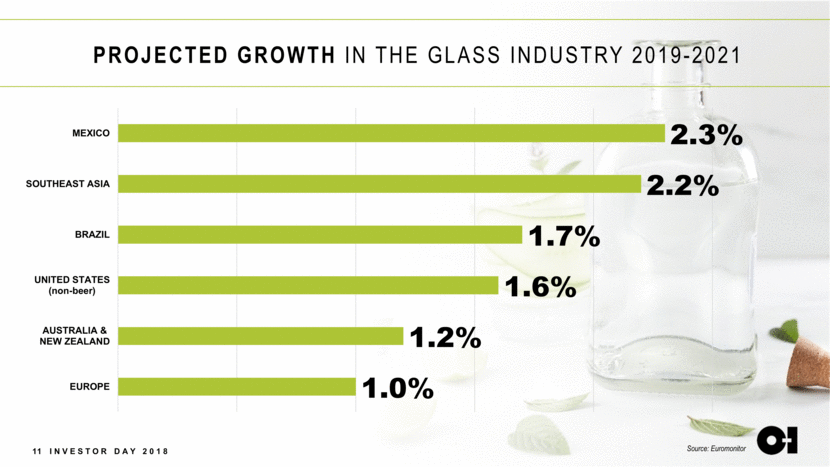
11 INVESTOR DAY 2018 PROJECTED GROWTH IN THE GLASS INDUSTRY 2019-2021 Source: Euromonitor 1.0% 1.2% 1.6% 1.7% 2.2% 2.3% EUROPE AUSTRALIA & NEW ZEALAND UNITED STATES (non-beer) BRAZIL SOUTHEAST ASIA MEXICO
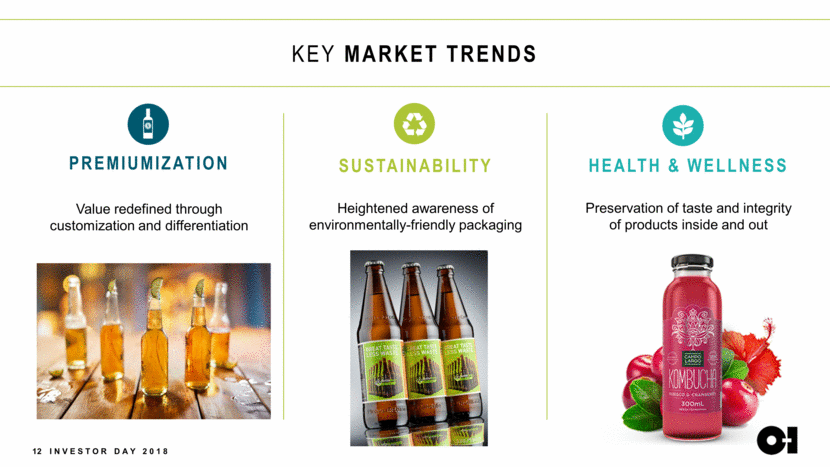
12 INVESTOR DAY 2018 KEY MARKET TRENDS PREMIUMIZATION Value redefined through customization and differentiation Health & wellness Preservation of taste and integrity of products inside and out Sustainability Heightened awareness of environmentally-friendly packaging
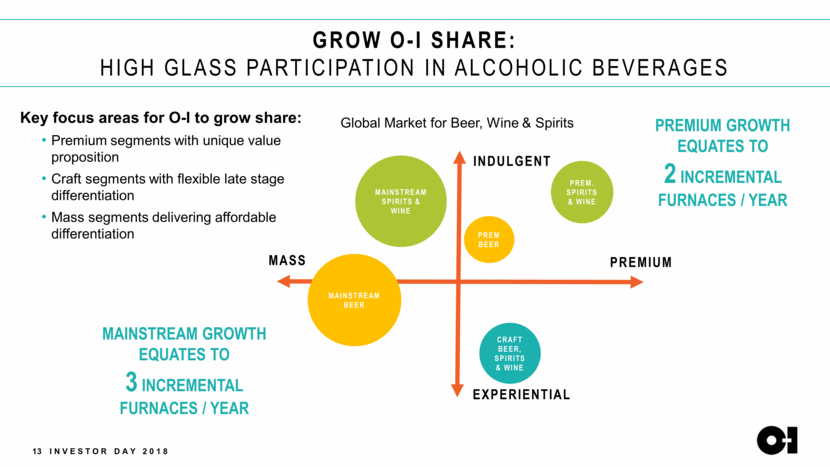
MAINSTREAM GROWTH EQUATES TO 3 INCREMENTAL FURNACES / YEAR EXPERIENTIAL INDULGENT MASS PREMIUM PREM BEER PREM. SPIRITS & WINE MAINSTREAM SPIRITS & WINE MAINSTREAM BEER CRAFT BEER, SPIRITS & WINE 13 INVESTOR DAY 2018 GROW O-I SHARE: HIGH GLASS PARTICIPATION IN ALCOHOLIC BEVERAGES Key focus areas for O-I to grow share: Premium segments with unique value proposition Craft segments with flexible late stage differentiation Mass segments delivering affordable differentiation PREMIUM GROWTH EQUATES TO 2 INCREMENTAL FURNACES / YEAR Global Market for Beer, Wine & Spirits
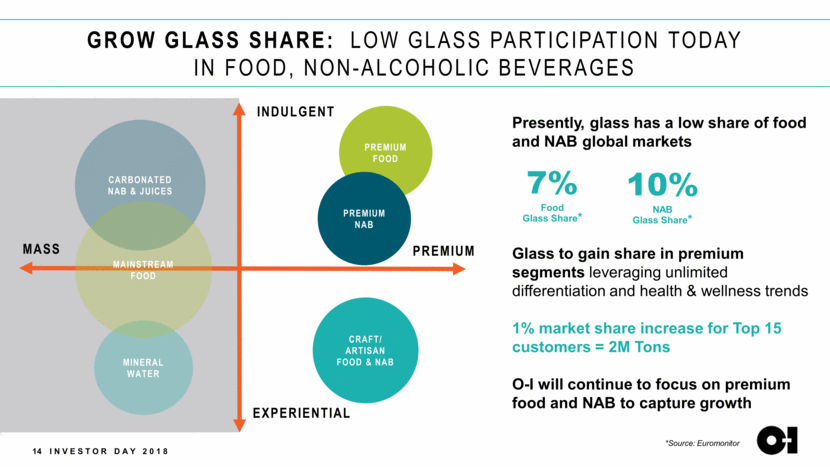
14 INVESTOR DAY 2018 GROW GLASS SHARE: LOW GLASS PARTICIPATION TODAY IN FOOD, NON-ALCOHOLIC BEVERAGES PREM. SPIRITS & WINE PREMIUM FOOD MINERAL WATER CRAFT/ ARTISAN FOOD & NAB CARBONATED NAB & JUICES PREMIUM NAB MAINSTREAM FOOD 7% Food Glass Share* 10% NAB Glass Share* *Source: Euromonitor EXPERIENTIAL INDULGENT MASS PREMIUM Presently, glass has a low share of food and NAB global markets Glass to gain share in premium segments leveraging unlimited differentiation and health & wellness trends 1% market share increase for Top 15 customers = 2M Tons O-I will continue to focus on premium food and NAB to capture growth
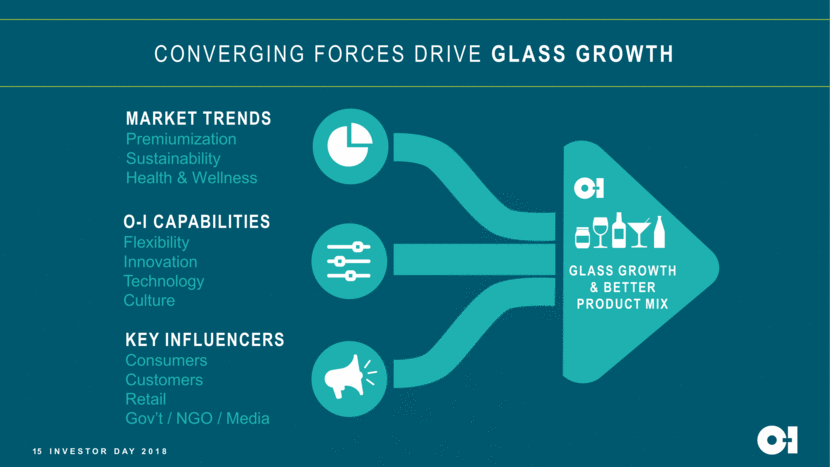
15 INVESTOR DAY 2018 CONVERGING FORCES DRIVE GLASS GROWTH MARKET TRENDS Premiumization Sustainability Health & Wellness KEY INFLUENCERS Consumers Customers Retail Gov’t / NGO / Media GLASS GROWTH & BETTER PRODUCT MIX O-I CAPABILITIES Flexibility Innovation Technology Culture
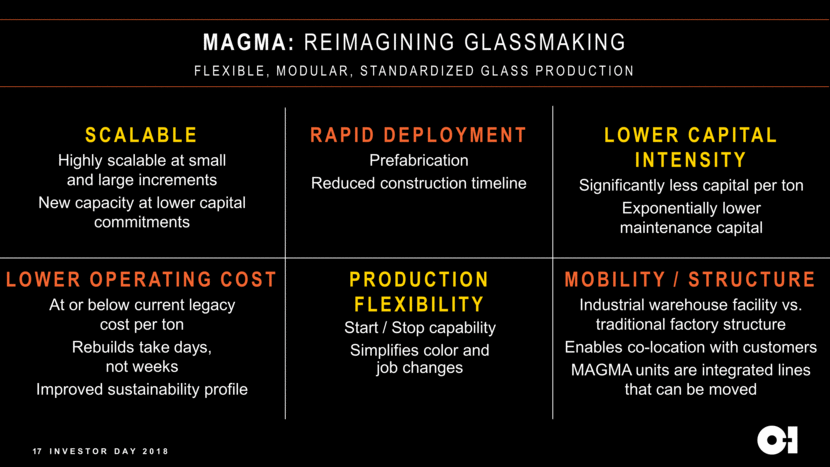
ADDRESSING OPERATIONAL CONSTRAINTS High capital intensity Low scalability Slow speed to market for new capacity Limited production flexibility

17 INVESTOR DAY 2018 MAGMA: REIMAGINING GLASSMAKING FLEXIBLE, MODULAR, STANDARDIZED GLASS PRODUCTION PRODUCTION FLEXIBILITY Start / Stop capability Simplifies color and job changes SCALABLE Highly scalable at small and large increments New capacity at lower capital commitments RAPID DEPLOYMENT Prefabrication Reduced construction timeline LOWER CAPITAL INTENSITY Significantly less capital per ton Exponentially lower maintenance capital LOWER OPERATING COST At or below current legacy cost per ton Rebuilds take days, not weeks Improved sustainability profile MOBILITY / STRUCTURE Industrial warehouse facility vs. traditional factory structure Enables co-location with customers MAGMA units are integrated lines that can be moved
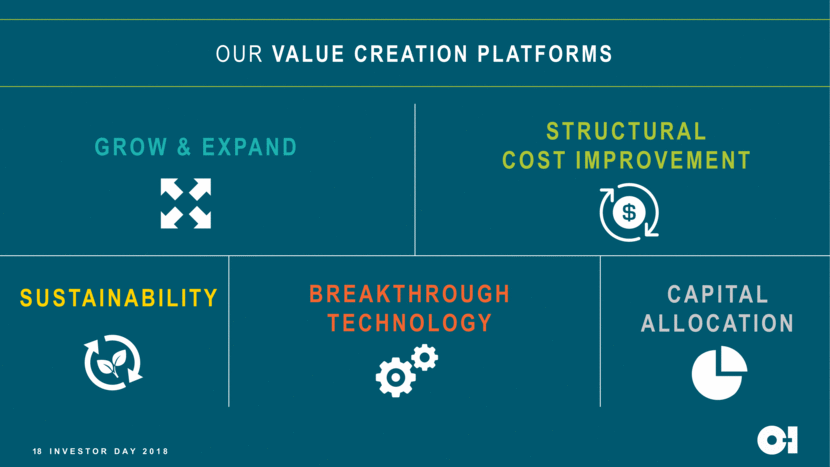
18 INVESTOR DAY 2018 OUR VALUE CREATION PLATFORMS GROW & EXPAND STRUCTURAL COST IMPROVEMENT SUSTAINABILITY BREAKTHROUGH TECHNOLOGY CAPITAL ALLOCATION
JOHN HAUDRICH // CHIEF STRATEGY & INTEGRATION OFFICER Value Creation Platforms

GROW AND EXPAND

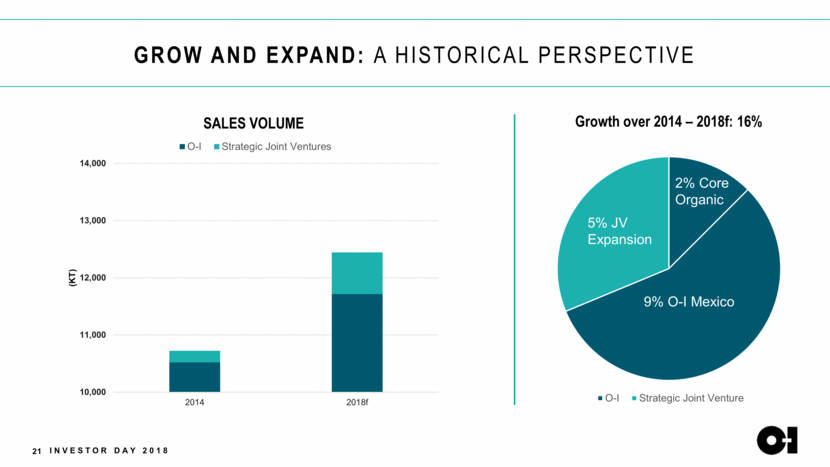
GROW AND EXPAND: A Historical Perspective 21 INVESTOR DAY 2018 9% O-I Mexico 5% JV Expansion 2% Core Organic 10,000 11,000 12,000 13,000 14,000 2014 2018f (KT) SALES VOLUME O-I Strategic Joint Ventures Growth over 2014 – 2018f: 16% O-I Strategic Joint Venture
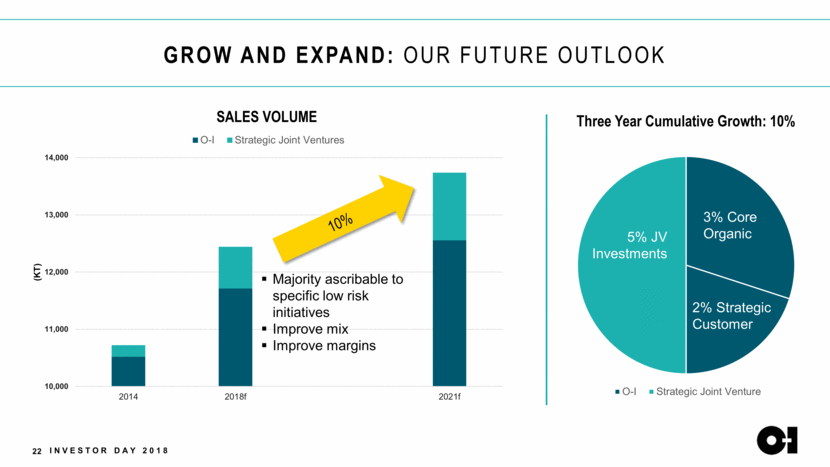
GROW AND EXPAND: Our Future Outlook 22 INVESTOR DAY 2018 2% Strategic Customer 5% JV Investments 3% Core Organic 10% Majority ascribable to specific low risk initiatives Improve mix Improve margins 10,000 11,000 12,000 13,000 14,000 2014 2018f 2021f (KT) SALES VOLUME O-I Strategic Joint Ventures Three Year Cumulative Growth: 10% O-I Strategic Joint Venture
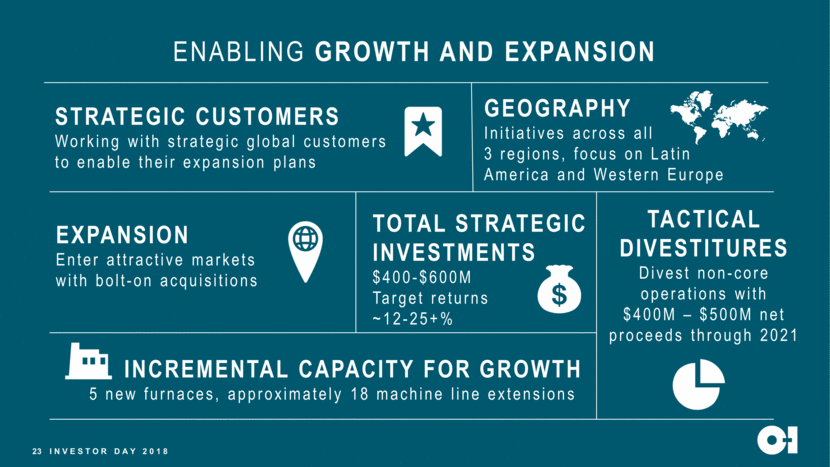
23 INVESTOR DAY 2018 ENABLING GROWTH AND EXPANSION Strategic customers Working with strategic global customers to enable their expansion plans Expansion Enter attractive markets with bolt-on acquisitions Total STRATEGIC investments $400-$600M Target returns ~12-25+% Incremental capacity for growth 5 new furnaces, approximately 18 machine line extensions Tactical divestitures Divest non-core operations with $400M – $500M net proceeds through 2021 geography Initiatives across all 3 regions, focus on Latin America and Western Europe
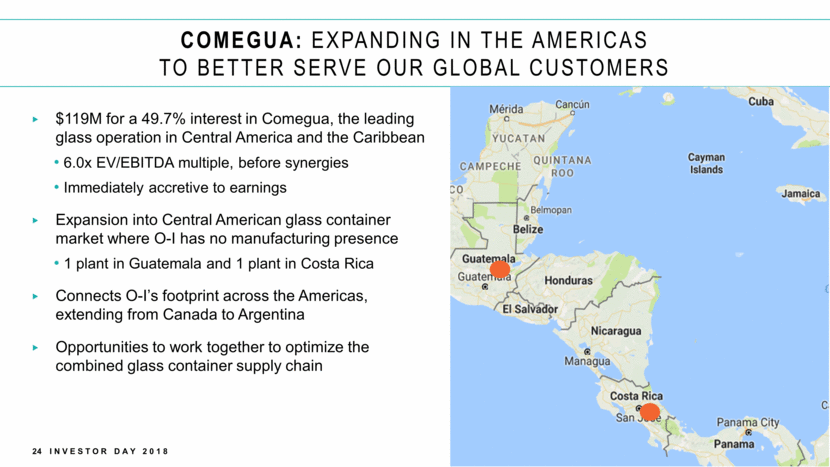
24 INVESTOR DAY 2018 COMEGUA: EXPANDING IN THE AMERICAS TO BETTER SERVE OUR GLOBAL CUSTOMERS $119M for a 49.7% interest in Comegua, the leading glass operation in Central America and the Caribbean 6.0x EV/EBITDA multiple, before synergies Immediately accretive to earnings Expansion into Central American glass container market where O-I has no manufacturing presence 1 plant in Guatemala and 1 plant in Costa Rica Connects O-I’s footprint across the Americas, extending from Canada to Argentina Opportunities to work together to optimize the combined glass container supply chain
STRUCTURAL COST IMPROVEMENT

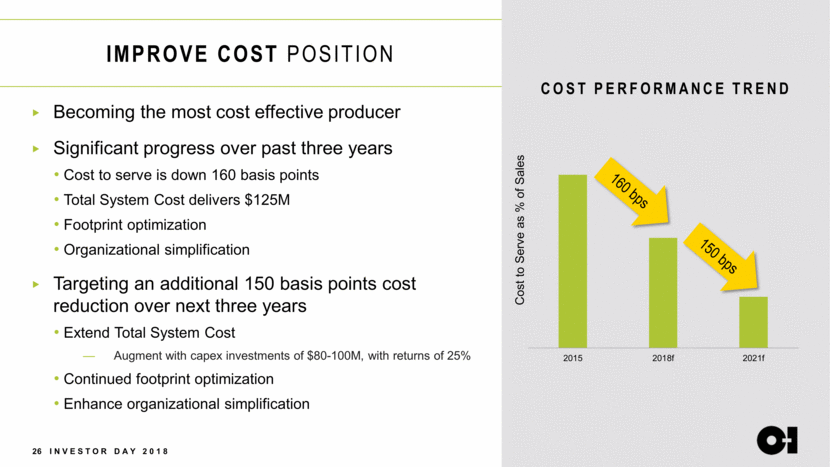
26 INVESTOR DAY 2018 IMPROVE COST POSITION Becoming the most cost effective producer Significant progress over past three years Cost to serve is down 160 basis points Total System Cost delivers $125M Footprint optimization Organizational simplification Targeting an additional 150 basis points cost reduction over next three years Extend Total System Cost Augment with capex investments of $80-100M, with returns of 25% Continued footprint optimization Enhance organizational simplification 150 bps 160 bps 2015 2018f 2021f Cost to Serve as % of Sales COST PERFORMANCE TREND
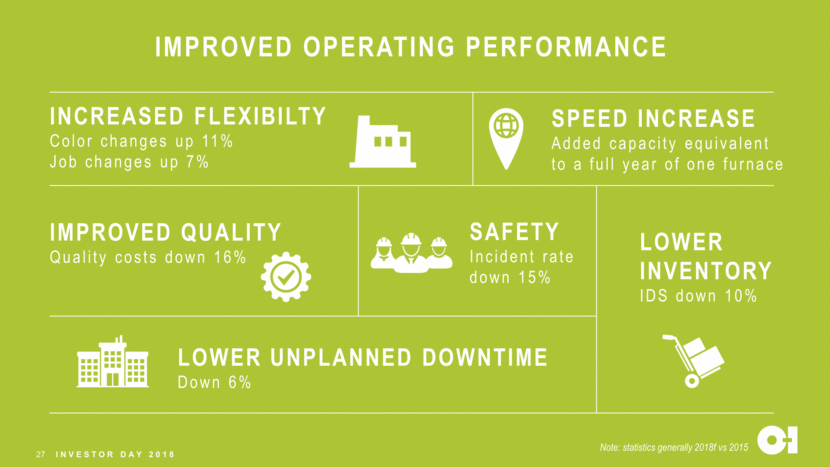
27 SPEED INCREASE Added capacity equivalent to a full year of one furnace INCREASED FLEXIBILTY Color changes up 11% Job changes up 7% IMPROVED OPERATING PERFORMANCE Lower unplanned downtime Down 6% Improved quality Quality costs down 16% INVESTOR DAY 2018 SAFETY Incident rate down 15% Lower inventory IDS down 10% Note: statistics generally 2018f vs 2015
SUSTAINABILITY

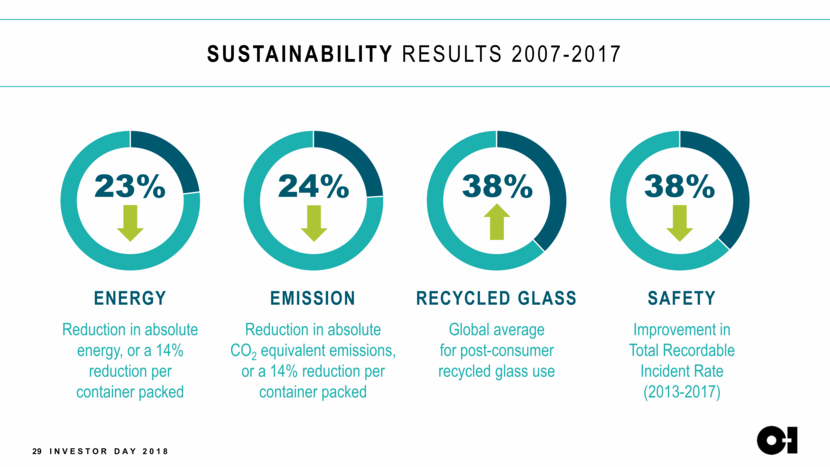
SUSTAINABILITY RESULTS 2007-2017 ENERGY Reduction in absolute energy, or a 14% reduction per container packed 23% 24% 38% 38% EMISSION Reduction in absolute CO2 equivalent emissions, or a 14% reduction per container packed Recycled GLASS Global average for post-consumer recycled glass use SAFETY Improvement in Total Recordable Incident Rate (2013-2017) 29 INVESTOR DAY 2018
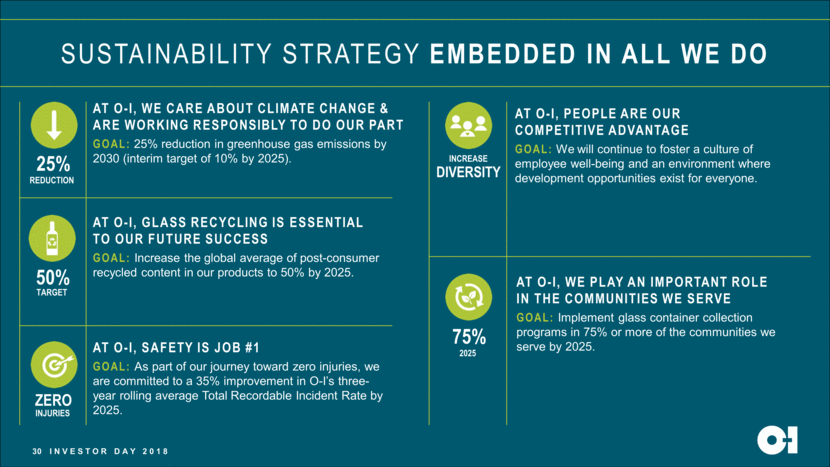
30 INVESTOR DAY 2018 SUSTAINABILITY STRATEGY EMBEDDED IN ALL WE DO AT O-I, WE CARE ABOUT CLIMATE CHANGE & ARE WORKING RESPONSIBLY TO DO OUR PART GOAL: 25% reduction in greenhouse gas emissions by 2030 (interim target of 10% by 2025). AT O-I, GLASS RECYCLING IS ESSENTIAL TO OUR FUTURE SUCCESS GOAL: Increase the global average of post-consumer recycled content in our products to 50% by 2025. AT O-I, SAFETY IS JOB #1 GOAL: As part of our journey toward zero injuries, we are committed to a 35% improvement in O-I’s three-year rolling average Total Recordable Incident Rate by 2025. AT O-I, PEOPLE ARE OUR COMPETITIVE ADVANTAGE GOAL: We will continue to foster a culture of employee well-being and an environment where development opportunities exist for everyone. AT O-I, WE PLAY AN IMPORTANT ROLE IN THE COMMUNITIES WE SERVE GOAL: Implement glass container collection programs in 75% or more of the communities we serve by 2025. 25% REDUCTION 50% ZERO INJURIES 75% 2025 DIVERSITY INCREASE TARGET
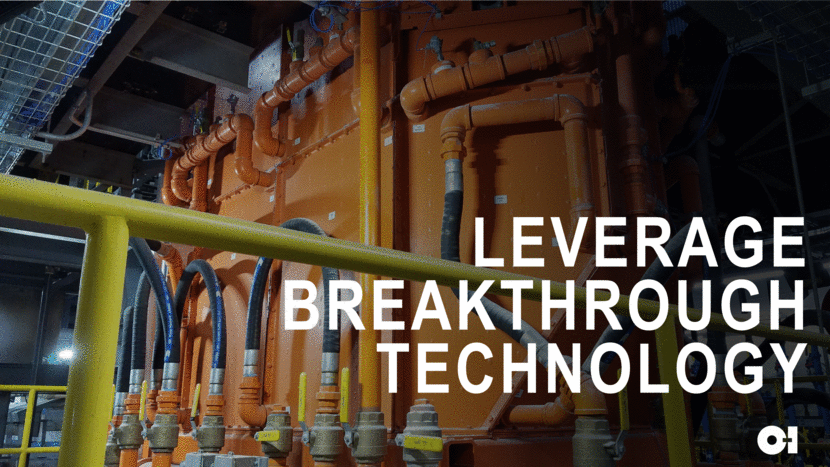
LEVERAGE BREAKTHROUGH TECHNOLOGY
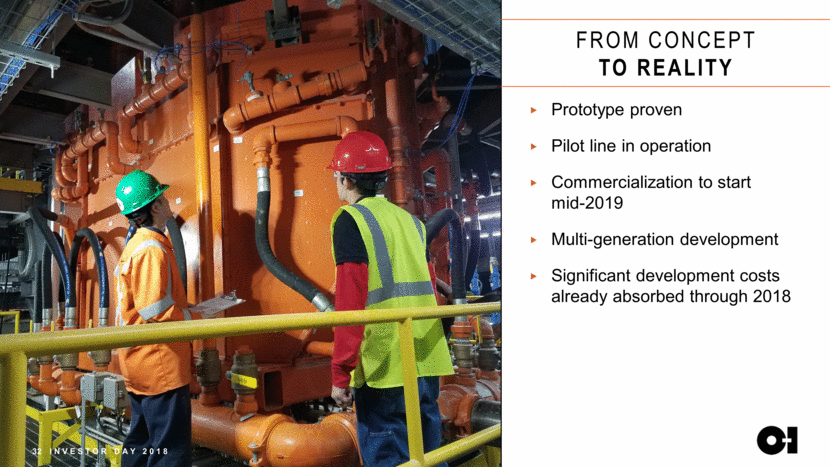
32 INVESTOR DAY 2018 Prototype proven Pilot line in operation Commercialization to start mid-2019 Multi-generation development Significant development costs already absorbed through 2018 FROM CONCEPT TO REALITY
CAPITAL ALLOCATION

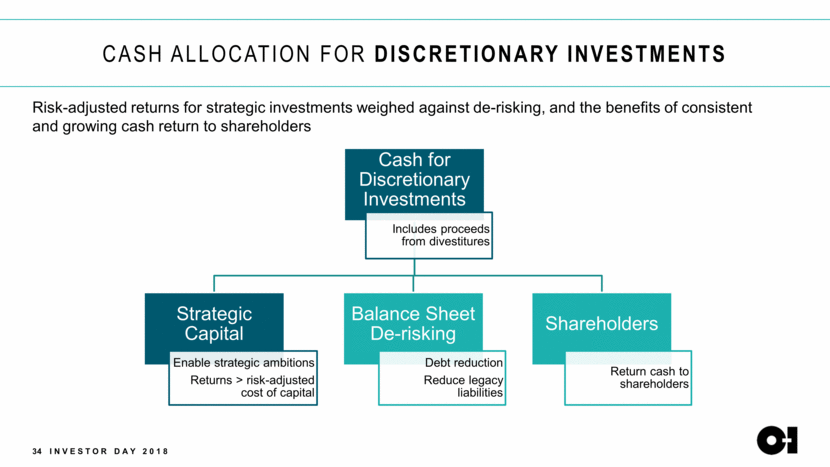
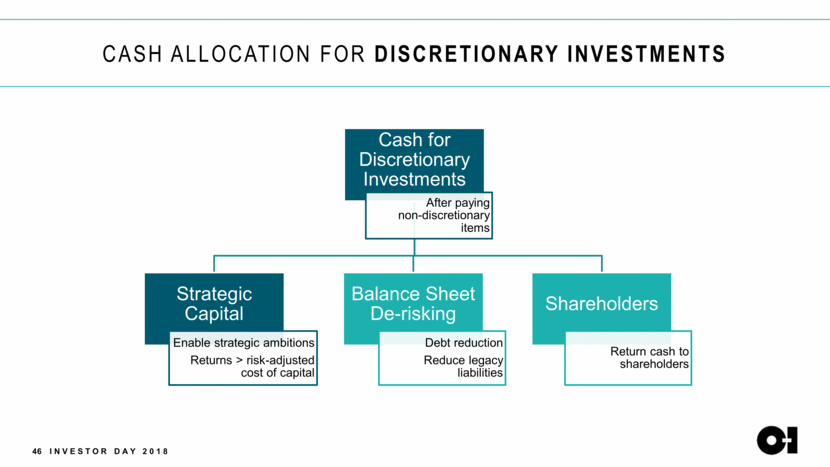
34 INVESTOR DAY 2018 CASH ALLOCATION FOR DISCRETIONARY INVESTMENTS Risk-adjusted returns for strategic investments weighed against de-risking, and the benefits of consistent and growing cash return to shareholders Cash for Discretionary Investments Includes proceeds from divestitures Strategic Capital Enable strategic ambitions Returns > risk-adjusted cost of capital Balance Sheet De-risking Debt reduction Reduce legacy liabilities Shareholders Return cash to shareholders
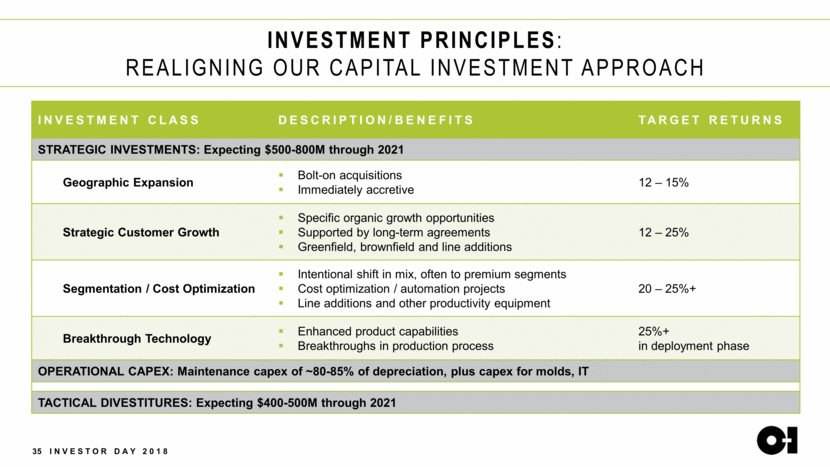
35 INVESTOR DAY 2018 INVESTMENT PRINCIPLES: REALIGNING OUR CAPITAL INVESTMENT APPROACH INVESTMENT CLASS DESCRIPTION / BENEFITS EXPECTED RETURNS INVESTMENT CLASS DESCRIPTION/BENEFITS TARGET RETURNS STRATEGIC INVESTMENTS: Expecting $500-800M through 2021 Geographic Expansion Bolt-on acquisitions Immediately accretive 12 – 15% Strategic Customer Growth Specific organic growth opportunities Supported by long-term agreements Greenfield, brownfield and line additions 12 – 25% Segmentation / Cost Optimization Intentional shift in mix, often to premium segments Cost optimization / automation projects Line additions and other productivity equipment 20 – 25%+ Breakthrough Technology Enhanced product capabilities Breakthroughs in production process 25%+ in deployment phase OPERATIONAL CAPEX: Maintenance capex of ~80-85% of depreciation, plus capex for molds, IT TACTICAL DIVESTITURES: Expecting $400-500M through 2021
36 INVESTOR DAY 2018 OUR VALUE CREATION PLATFORMS GROW & EXPAND STRUCTURAL COST IMPROVEMENT SUSTAINABILITY BREAKTHROUGH TECHNOLOGY CAPITAL ALLOCATION
JAN BERTSCH // CFO The Bottom Line
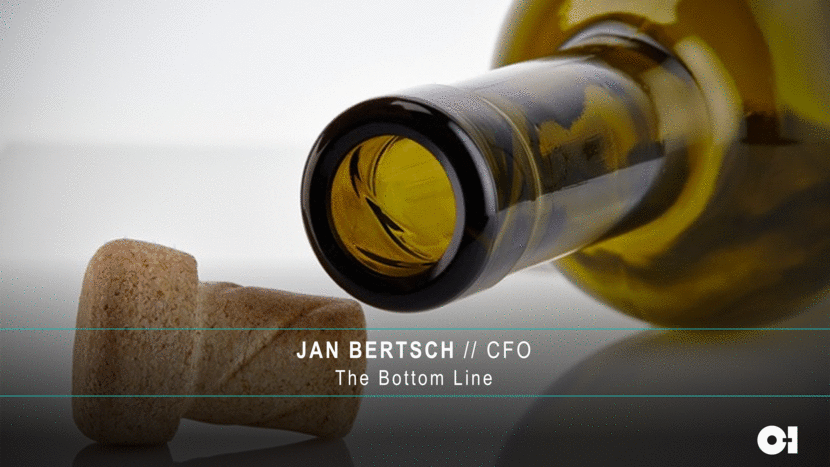
38 INVESTOR DAY 2018 DELIVERING ON OUR TRANSFORMATION BEYOND 2021 Margin expansion aEPS and aFCF growth Improved ROIC Further de-risking Increased share buybacks Initiate dividend 2016-2018 Business stability; commercial performance; flexibility; structural cost reduction; performance, culture & talent Margin expansion 10% CAGR for adj. EPS Solid cash generation De-risk the balance sheet Balanced capital allocation 2019-2021 Grow & expand; structural cost improvement; sustainability; breakthrough technology; capital allocation
39 INVESTOR DAY 2018 KEY FINANCIAL PRIORITIES CASH GENERATION CAPITAL STEWARDSHIP RISK MANAGEMENT 1 3
CASH GENERATION
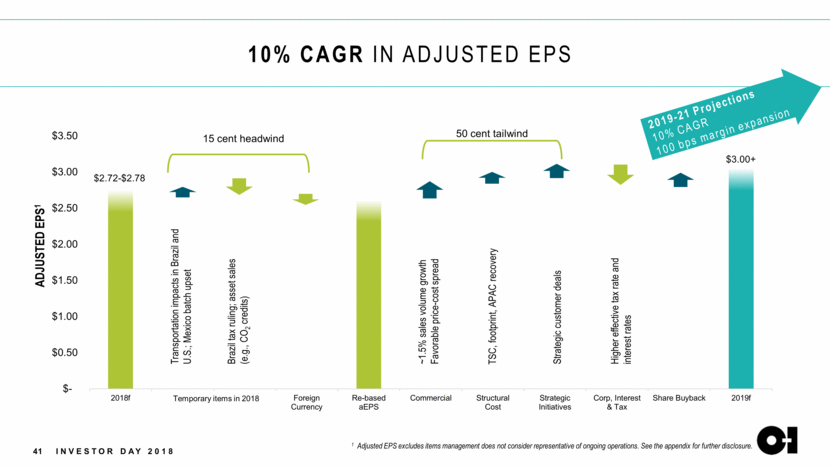
41 INVESTOR DAY 2018 10% CAGR IN ADJUSTED EPS ADJUSTED EPS1 $2.72-$2.78 $3.00+ 15 cent headwind 50 cent tailwind Brazil tax ruling; asset sales (e.g., CO2 credits) Transportation impacts in Brazil and U.S.; Mexico batch upset 1 Adjusted EPS excludes items management does not consider representative of ongoing operations. See the appendix for further disclosure. Temporary items in 2018 2019-21 Projections 10% CAGR 100 bps margin expansion Higher effective tax rate and interest rates $- $0.50 $1.00 $1.50 $2.00 $2.50 $3.00 $3.50 2018f Foreign Currency Re-based aEPS Commercial Structural Cost Strategic Initiatives Corp, Interest & Tax Share Buyback 2019f ~1.5% sales volume growth Favorable price - cost spread TSC, footprint, APAC recovery Strategic customer deals
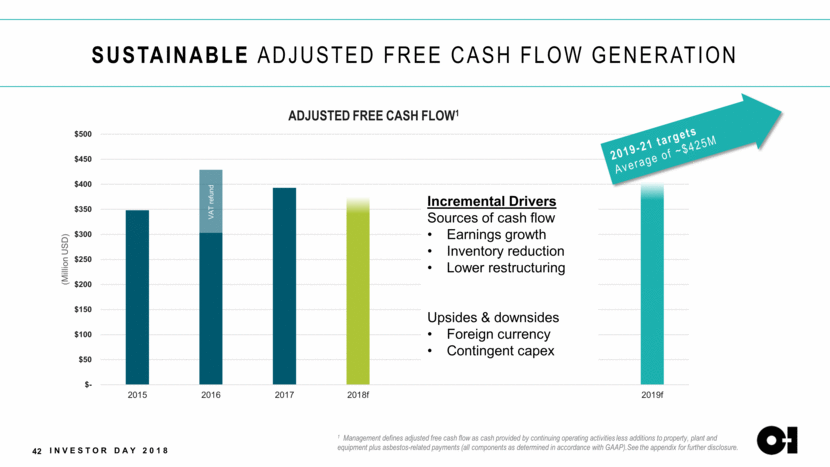
SUSTAINABLE ADJUSTED FREE CASH FLOW GENERATION 42 INVESTOR DAY 2018 Incremental Drivers Sources of cash flow Earnings growth Inventory reduction Lower restructuring Upsides & downsides Foreign currency Contingent capex 1 Management defines adjusted free cash flow as cash provided by continuing operating activities less additions to property, plant and equipment plus asbestos-related payments (all components as determined in accordance with GAAP).See the appendix for further disclosure. 2019-21 targets Average of ~$425M VAT refund $- $50 $100 $150 $200 $250 $300 $350 $400 $450 $500 2015 2016 2017 2018f 2019f (Million USD) ADJUSTED FREE CASH FLOW 1
CAPITAL STEWARDSHIP

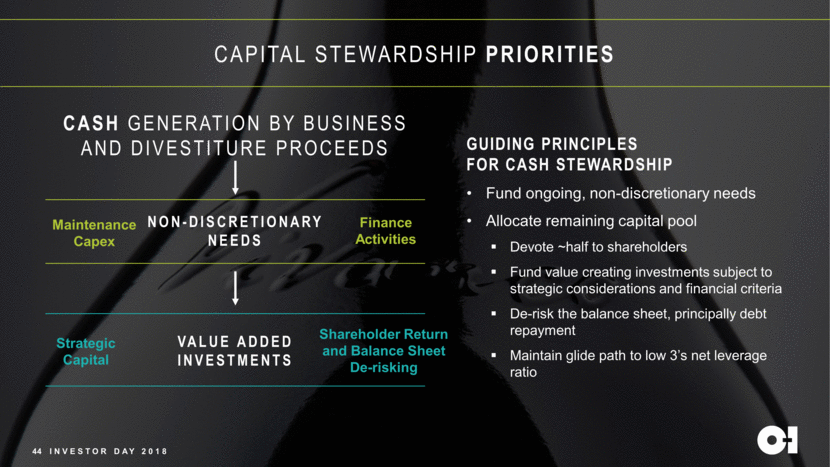
NON-DISCRETIONARY NEEDS VALUE ADDED INVESTMENTS CASH GENERATION BY BUSINESS AND DIVESTITURE PROCEEDS 44 INVESTOR DAY 2018 CAPITAL STEWARDSHIP PRIORITIES Maintenance Capex Finance Activities Strategic Capital Shareholder Return and Balance Sheet De-risking GUIDING PRINCIPLES FOR CASH STEWARDSHIP Fund ongoing, non-discretionary needs Allocate remaining capital pool Devote ~half to shareholders Fund value creating investments subject to strategic considerations and financial criteria De-risk the balance sheet, principally debt repayment Maintain glide path to low 3’s net leverage ratio
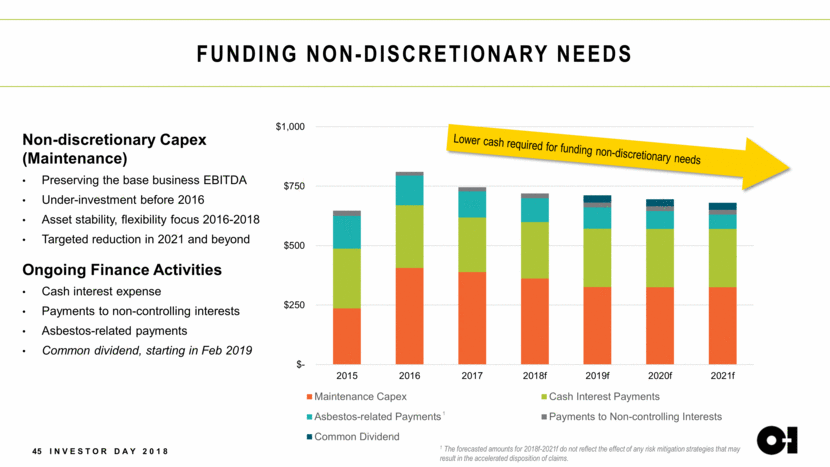
FUNDING NON-DISCRETIONARY NEEDS Non-discretionary Capex (Maintenance) Preserving the base business EBITDA Under-investment before 2016 Asset stability, flexibility focus 2016-2018 Targeted reduction in 2021 and beyond Ongoing Finance Activities Cash interest expense Payments to non-controlling interests Asbestos-related payments Common dividend, starting in Feb 2019 45 INVESTOR DAY 2018 1 The forecasted amounts for 2018f-2021f do not reflect the effect of any risk mitigation strategies that may result in the accelerated disposition of claims. 1 Lower cash required for funding non-discretionary needs $- $250 $500 $750 $1,000 2015 2016 2017 2018f 2019f 2020f 2021f Maintenance Capex Cash Interest Payments Asbestos-related Payments Payments to Non-controlling Interests Common Dividend
46 INVESTOR DAY 2018 CASH ALLOCATION FOR DISCRETIONARY INVESTMENTS Cash for Discretionary Investments After paying non-discretionary items Strategic Capital Enable strategic ambitions Returns > risk-adjusted cost of capital Balance Sheet De-risking Debt reduction Reduce legacy liabilities Shareholders Return cash to shareholders
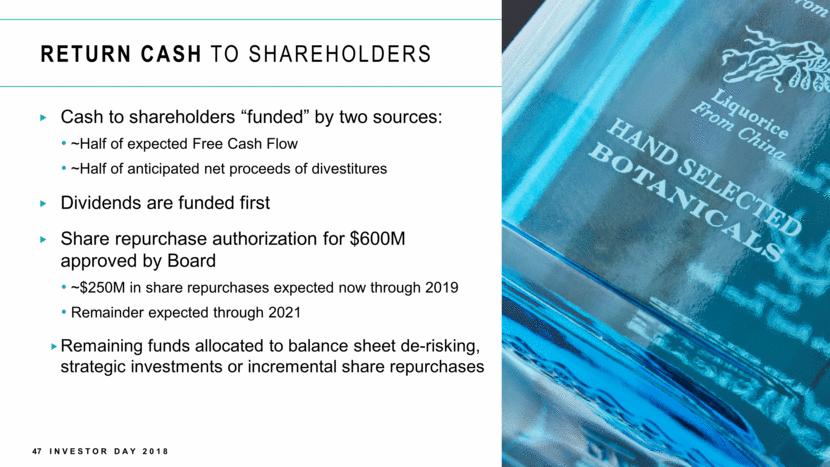
47 INVESTOR DAY 2018 RETURN CASH TO SHAREHOLDERS Cash to shareholders “funded” by two sources: ~Half of expected Free Cash Flow ~Half of anticipated net proceeds of divestitures Dividends are funded first Share repurchase authorization for $600M approved by Board ~$250M in share repurchases expected now through 2019 Remainder expected through 2021 Remaining funds allocated to balance sheet de-risking, strategic investments or incremental share repurchases
RISK MANAGEMENT

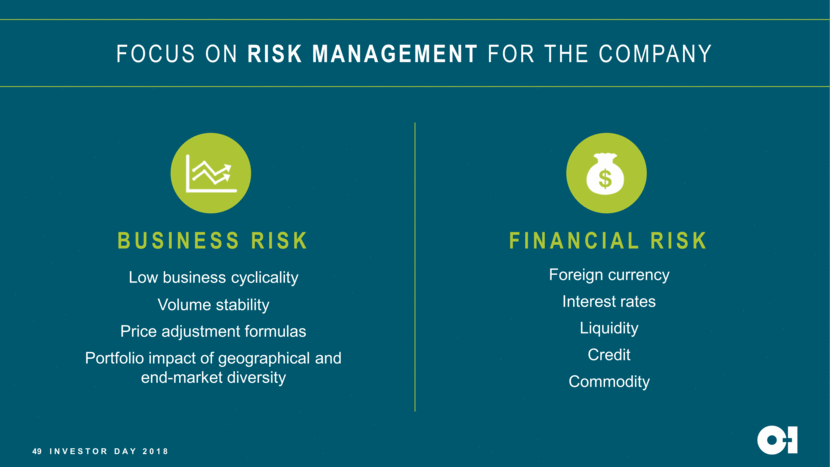
49 INVESTOR DAY 2018 FOCUS ON RISK MANAGEMENT FOR THE COMPANY Business risk Low business cyclicality Volume stability Price adjustment formulas Portfolio impact of geographical and end-market diversity FINANCIAL risk Foreign currency Interest rates Liquidity Credit Commodity
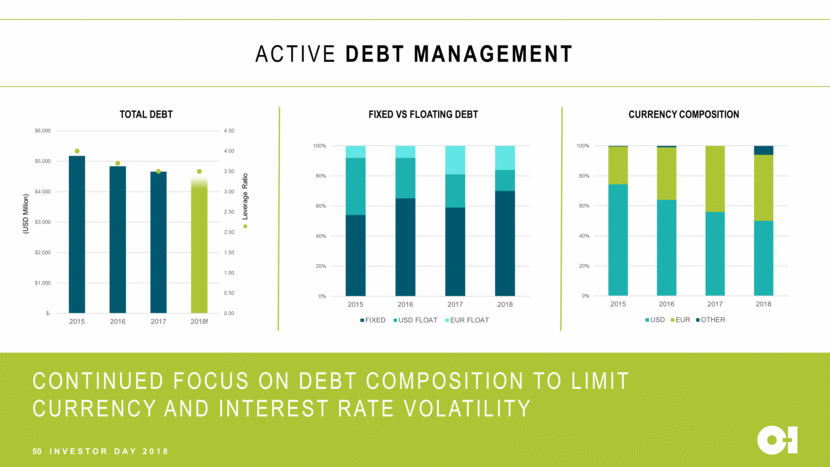
50 INVESTOR DAY 2018 ACTIVE DEBT MANAGEMENT CONTINUED FOCUS ON DEBT COMPOSITION TO LIMIT CURRENCY AND INTEREST RATE VOLATILITY (USD Million) Leverage Ratio 0.00 0.50 1.00 1.50 2.00 2.50 3.00 3.50 4.00 4.50 $- $1,000 $2,000 $3,000 $4,000 $5,000 $6,000 2015 2016 2017 2018f TOTAL DEBT Leverage Ratio 0% 20% 40% 60% 80% 100% 2015 2016 2017 2018 FIXED VS FLOATING DEBT FIXED USD FLOAT EUR FLOAT 0% 20% 40% 60% 80% 100% 2015 2016 2017 2018 CURRENCY COMPOSITION USD EUR OTHER
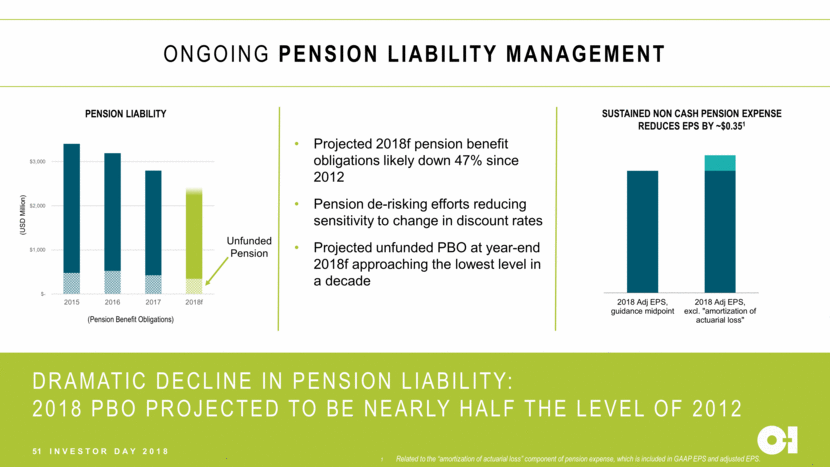
51 INVESTOR DAY 2018 ONGOING PENSION LIABILITY MANAGEMENT DRAMATIC DECLINE IN PENSION LIABILITY: 2018 PBO PROJECTED TO BE NEARLY HALF THE LEVEL OF 2012 (USD Million) (Pension Benefit Obligations) Projected 2018f pension benefit obligations likely down 47% since 2012 Pension de-risking efforts reducing sensitivity to change in discount rates Projected unfunded PBO at year-end 2018f approaching the lowest level in a decade SUSTAINED NON CASH PENSION EXPENSE REDUCES EPS BY ~$0.351 Related to the “amortization of actuarial loss” component of pension expense, which is included in GAAP EPS and adjusted EPS. Unfunded Pension $- $1,000 $2,000 $3,000 2015 2016 2017 2018f PENSION LIABILITY
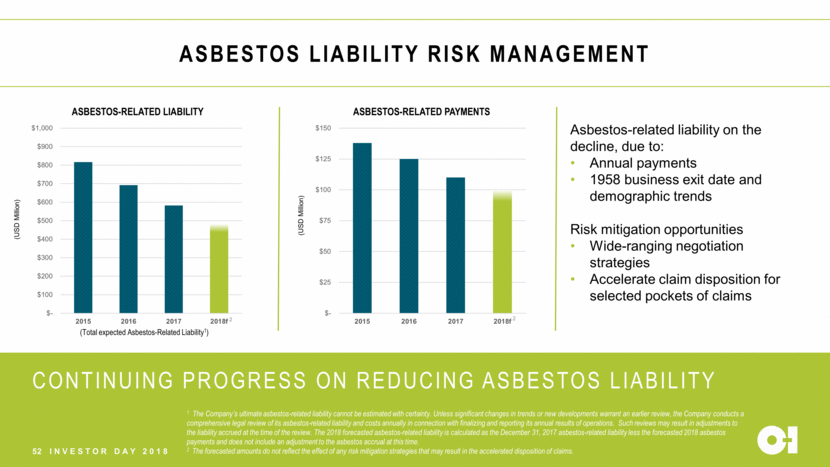
52 INVESTOR DAY 2018 ASBESTOS LIABILITY RISK MANAGEMENT CONTINUING PROGRESS ON REDUCING ASBESTOS LIABILITY (USD Million) (Total expected Asbestos-Related Liability1) 1 The Company’s ultimate asbestos-related liability cannot be estimated with certainty. Unless significant changes in trends or new developments warrant an earlier review, the Company conducts a comprehensive legal review of its asbestos-related liability and costs annually in connection with finalizing and reporting its annual results of operations. Such reviews may result in adjustments to the liability accrued at the time of the review. The 2018 forecasted asbestos-related liability is calculated as the December 31, 2017 asbestos-related liability less the forecasted 2018 asbestos payments and does not include an adjustment to the asbestos accrual at this time. 2 The forecasted amounts do not reflect the effect of any risk mitigation strategies that may result in the accelerated disposition of claims. Asbestos-related liability on the decline, due to: Annual payments 1958 business exit date and demographic trends Risk mitigation opportunities Wide-ranging negotiation strategies Accelerate claim disposition for selected pockets of claims (USD Million) 2018f less than half 2012 2 2 $- $100 $200 $300 $400 $500 $600 $700 $800 $900 $1,000 2015 2016 2017 2018f ASBESTOS - RELATED LIABILITY $- $25 $50 $75 $100 $125 $150 2015 2016 2017 2018f ASBESTOS - RELATED PAYMENTS
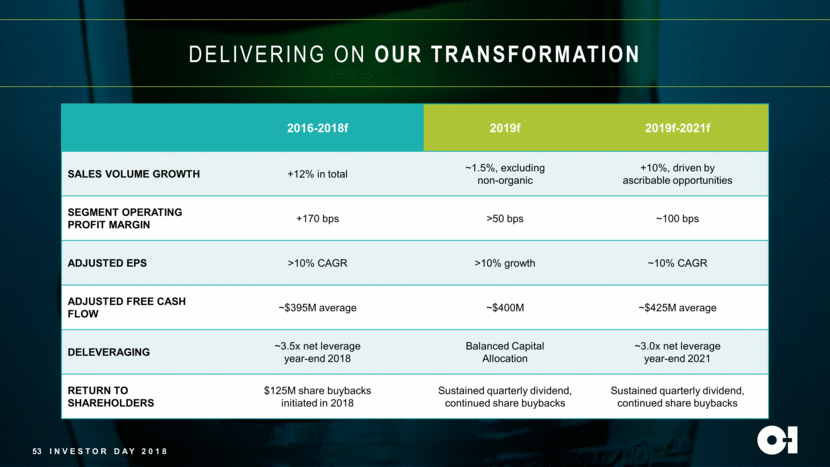
53 INVESTOR DAY 2018 DELIVERING ON OUR TRANSFORMATION 2016-2018f 2019f 2019f-2021f SALES VOLUME GROWTH +12% in total ~1.5%, excluding non-organic +10%, driven by ascribable opportunities SEGMENT OPERATING PROFIT MARGIN +170 bps >50 bps ~100 bps ADJUSTED EPS >10% CAGR >10% growth ~10% CAGR ADJUSTED FREE CASH FLOW ~$395M average ~$400M ~$425M average DELEVERAGING ~3.5x net leverage year-end 2018 Balanced Capital Allocation ~3.0x net leverage year-end 2021 RETURN TO SHAREHOLDERS $125M share buybacks initiated in 2018 Sustained quarterly dividend, continued share buybacks Sustained quarterly dividend, continued share buybacks
[LOGO]
[LOGO]
[LOGO]

COMPANY OVERVIEW
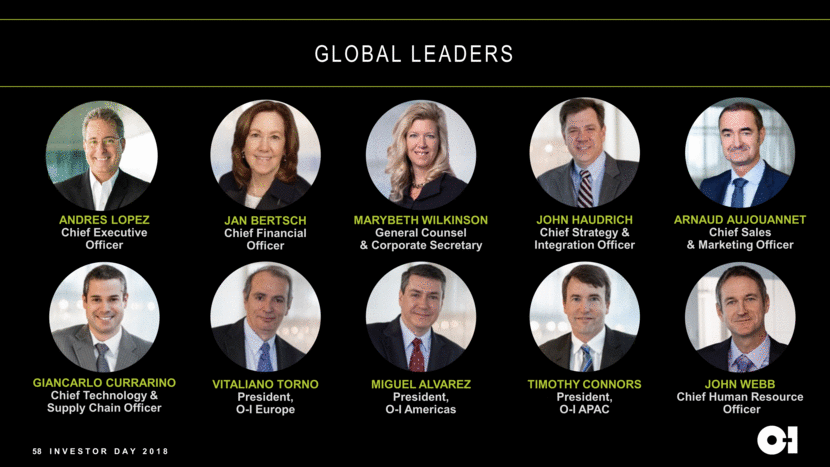
58 INVESTOR DAY 2018 GLOBAL LEADERS ARNAUD AUJOUANNET Chief Sales & Marketing Officer ANDRES LOPEZ Chief Executive Officer JAN BERTSCH Chief Financial Officer MARYBETH WILKINSON General Counsel & Corporate Secretary GIANCARLO CURRARINO Chief Technology & Supply Chain Officer VITALIANO TORNO President, O-I Europe JOHN HAUDRICH Chief Strategy & Integration Officer MIGUEL ALVAREZ President, O-I Americas TIMOTHY CONNORS President, O-I APAC JOHN WEBB Chief Human Resource Officer
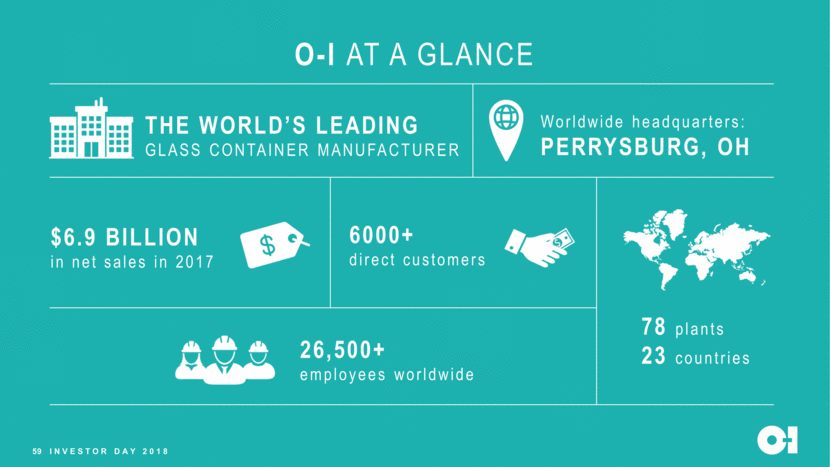
59 INVESTOR DAY 2018 The WORLD’s LEADING GLASS CONTAINER MANUFACTURER Worldwide headquarters: PERRYSBURG, OH $6.9 BILLION in net sales in 2017 6000+ direct customers O-I AT A GLANCE 26,500+ employees worldwide 78 plants 23 countries
FINANCIAL APPENDIX
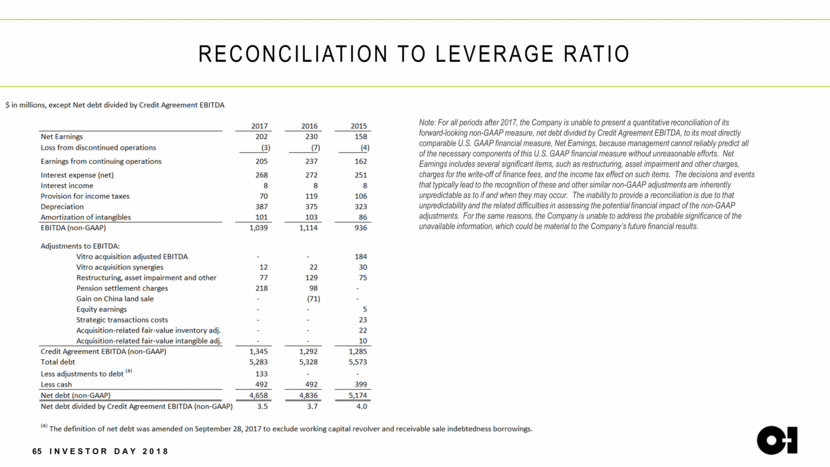
61 INVESTOR DAY 2018 NON-GAAP FINANCIAL MEASURES The Company uses certain non-GAAP financial measures, which are measures of its historical or future financial performance that are not calculated and presented in accordance with GAAP, within the meaning of applicable SEC rules. Management believes that its presentation and use of certain non-GAAP financial measures, including adjusted earnings, adjusted earnings per share, adjusted free cash flow and leverage ratio provide relevant and useful supplemental financial information, which are widely used by analysts and investors, as well as by management in assessing both consolidated and business unit performance. These non-GAAP measures are reconciled to the most directly comparable GAAP measures and should be considered supplemental in nature and should not be considered in isolation or be construed as being more important than comparable GAAP measures. Adjusted earnings relates to net earnings from continuing operations attributable to the Company, exclusive of items management considers not representative of ongoing operations because such items are not reflective of the Company’s principal business activity, which is glass container production. Adjusted earnings are divided by weighted average shares outstanding (diluted) to derive adjusted earnings per share. Management uses adjusted earnings and adjusted earnings per share to evaluate its period-over-period operating performance because it believes this provides a useful supplemental measure of the results of operations of its principal business activity by excluding items that are not reflective of such operations. Adjusted earnings and adjusted earnings per share may be useful to investors in evaluating the underlying operating performance of the Company’s business as these measures eliminate items that are not reflective of its principal business activity. Leverage Ratio, as reported under O-I’s Bank Credit Agreement, is defined as consolidated total debt, less cash and cash equivalents, divided by Consolidated EBITDA (as defined in the Agreement). Leverage ratio is an important metric management uses to ensure the Company is in compliance with its debt covenants. Further, adjusted free cash flow relates to cash provided by continuing operating activities less additions to property, plant and equipment plus asbestos-related payments. Management uses adjusted free cash flow to evaluate its period-over-period cash generation performance because it believes this provides a useful supplemental measure related to its principal business activity. Adjusted free cash flow may be useful to investors to assist in understanding the comparability of cash flows generated by the Company’s principle business activity. Since a significant majority of the Company’s asbestos-related claims are expected to be received in the next ten years, adjusted free cash flow may help investors to evaluate the long-term cash generation ability of the Company’s principal business activity as these asbestos-related payments decline. It should not be inferred that the entire adjusted free cash flow amount is available for discretionary expenditures since the Company has mandatory debt service requirements and other non-discretionary expenditures that are not deducted from the measure. Management uses non-GAAP information principally for internal reporting, forecasting, budgeting and calculating compensation payments.
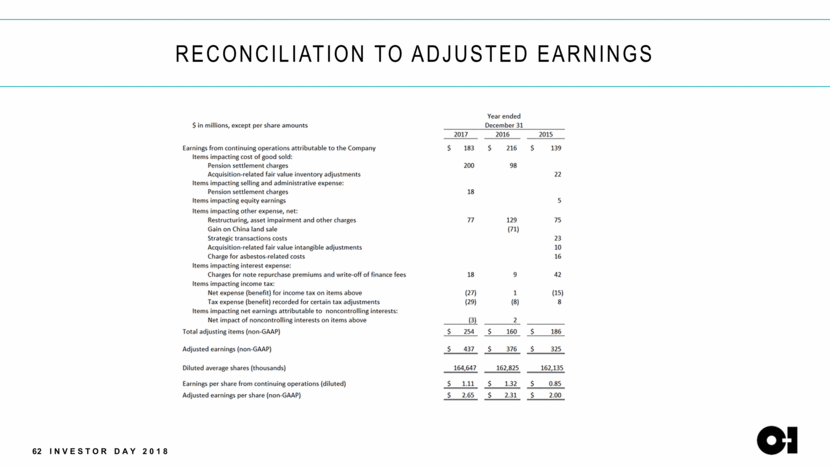
62 INVESTOR DAY 2018 RECONCILIATION TO ADJUSTED EARNINGS
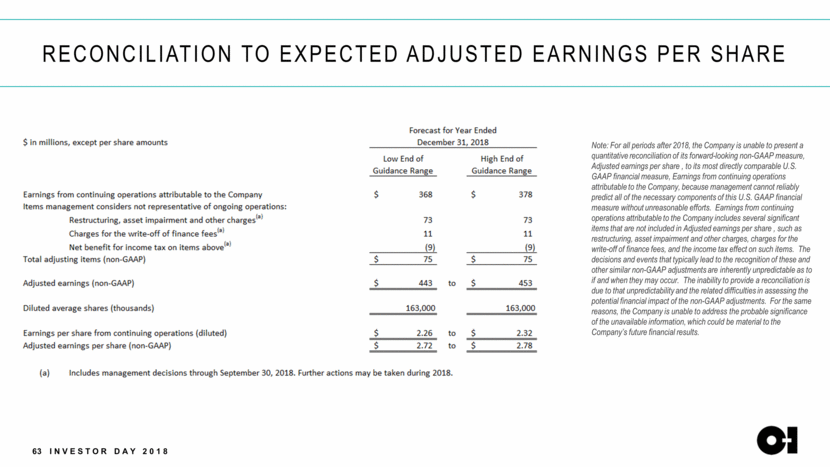
63 INVESTOR DAY 2018 RECONCILIATION TO EXPECTED ADJUSTED EARNINGS PER SHARE Note: For all periods after 2018, the Company is unable to present a quantitative reconciliation of its forward-looking non-GAAP measure, Adjusted earnings per share , to its most directly comparable U.S. GAAP financial measure, Earnings from continuing operations attributable to the Company, because management cannot reliably predict all of the necessary components of this U.S. GAAP financial measure without unreasonable efforts. Earnings from continuing operations attributable to the Company includes several significant items that are not included in Adjusted earnings per share , such as restructuring, asset impairment and other charges, charges for the write-off of finance fees, and the income tax effect on such items. The decisions and events that typically lead to the recognition of these and other similar non-GAAP adjustments are inherently unpredictable as to if and when they may occur. The inability to provide a reconciliation is due to that unpredictability and the related difficulties in assessing the potential financial impact of the non-GAAP adjustments. For the same reasons, the Company is unable to address the probable significance of the unavailable information, which could be material to the Company’s future financial results.
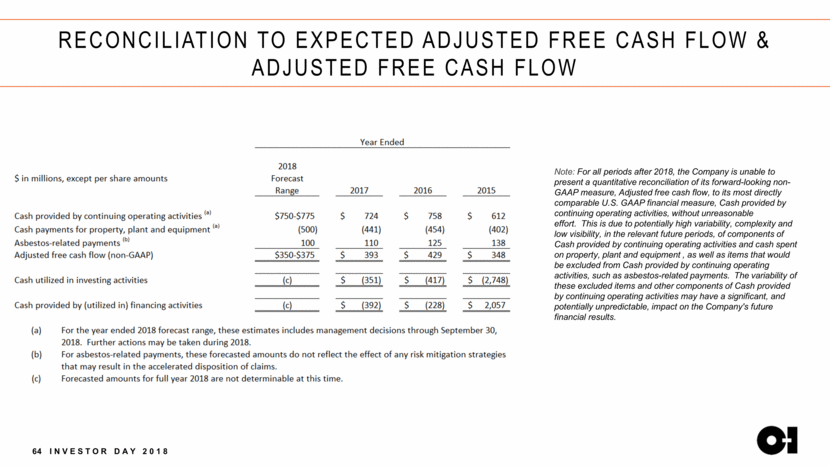
64 INVESTOR DAY 2018 RECONCILIATION TO EXPECTED ADJUSTED FREE CASH FLOW & ADJUSTED FREE CASH FLOW Note: For all periods after 2018, the Company is unable to present a quantitative reconciliation of its forward-looking non-GAAP measure, Adjusted free cash flow, to its most directly comparable U.S. GAAP financial measure, Cash provided by continuing operating activities, without unreasonable effort. This is due to potentially high variability, complexity and low visibility, in the relevant future periods, of components of Cash provided by continuing operating activities and cash spent on property, plant and equipment , as well as items that would be excluded from Cash provided by continuing operating activities, such as asbestos-related payments. The variability of these excluded items and other components of Cash provided by continuing operating activities may have a significant, and potentially unpredictable, impact on the Company's future financial results.
65 INVESTOR DAY 2018 RECONCILIATION TO LEVERAGE RATIO Note: For all periods after 2017, the Company is unable to present a quantitative reconciliation of its forward-looking non-GAAP measure, net debt divided by Credit Agreement EBITDA, to its most directly comparable U.S. GAAP financial measure, Net Earnings, because management cannot reliably predict all of the necessary components of this U.S. GAAP financial measure without unreasonable efforts. Net Earnings includes several significant items, such as restructuring, asset impairment and other charges, charges for the write-off of finance fees, and the income tax effect on such items. The decisions and events that typically lead to the recognition of these and other similar non-GAAP adjustments are inherently unpredictable as to if and when they may occur. The inability to provide a reconciliation is due to that unpredictability and the related difficulties in assessing the potential financial impact of the non-GAAP adjustments. For the same reasons, the Company is unable to address the probable significance of the unavailable information, which could be material to the Company’s future financial results.
