Attached files
| file | filename |
|---|---|
| EX-32.1 - EX-32.1 - Corporate Capital Trust II | d601749dex321.htm |
| EX-31.2 - EX-31.2 - Corporate Capital Trust II | d601749dex312.htm |
| EX-31.1 - EX-31.1 - Corporate Capital Trust II | d601749dex311.htm |
Table of Contents
UNITED STATES
SECURITIES AND EXCHANGE COMMISSION
Washington, D.C. 20549
FORM 10-Q
QUARTERLY REPORT PURSUANT TO SECTION 13 OR 15 (d) OF THE SECURITIES EXCHANGE ACT OF 1934
For the quarterly period ended September 30, 2018
OR
TRANSITION REPORT PURSUANT TO SECTION 13 OR 15 (d) OF THE SECURITIES EXCHANGE ACT OF 1934
Commission file number: 814-01108
Corporate Capital Trust II
(Exact name of registrant as specified in its charter)
| Delaware | 47-1595504 | |
| (State or other jurisdiction of incorporation or organization) | (I.R.S. Employer Identification No.) | |
| 201 Rouse Boulevard | ||
| Philadelphia, Pennsylvania | 19112 | |
| (Address of principal executive offices) | (Zip Code) |
(215) 495-1150
(Registrant’s telephone number, including area code)
Indicate by check mark whether the registrant (1) has filed all reports required to be filed by Section 13 or 15(d) of the Securities Exchange Act of 1934 during the preceding 12 months (or for such shorter period that the registrant was required to file such reports), and (2) has been subject to such filing requirements for the past 90 days. Yes ☒ No ☐
Indicate by check mark whether the registrant has submitted electronically every Interactive Data File required to be submitted pursuant to Rule 405 of Regulation S-T (§232.405 of this chapter) during the preceding 12 months (or for such shorter period that the registrant was required to submit such files). Yes ☐ No ☐
Indicate by check mark whether the registrant is a large accelerated filer, an accelerated filer, a non-accelerated filer, or a smaller reporting company. See the definitions of “large accelerated filer,” “accelerated filer,” “smaller reporting company,” and “emerging growth company” in Rule 12b-2 of the Exchange Act.
| Large accelerated filer | ☐ | Accelerated filer | ☐ | |||
| Non-accelerated filer | ☒ | Smaller reporting company | ☐ | |||
| Emerging growth company | ☐ |
If an emerging growth company, indicate by check mark if the registrant has elected not to use the extended transition period for complying with any new or revised financial accounting standards provided pursuant to Section 13(a) of the Exchange Act. ☐
Indicate by check mark whether the registrant is a shell company (as defined in Rule 12b-2 of the Exchange Act). Yes ☐ No ☒
The number of shares of common stock of the registrant outstanding as of November 9, 2018 was 12,479,873.
Table of Contents
INDEX
| PAGE | ||||||
| PART I. FINANCIAL INFORMATION |
||||||
| Item 1. |
1 | |||||
| 1 | ||||||
| 2 | ||||||
| 3 | ||||||
| Unaudited Condensed Statements of Cash Flows for the nine months ended September 30, 2018 and 2017 |
4 | |||||
| Condensed Schedules of Investments as of September
30, 2018 (Unaudited) and |
5 | |||||
| 20 | ||||||
| Item 2. |
Management’s Discussion and Analysis of Financial Condition and Results of Operations |
48 | ||||
| Item 3. |
72 | |||||
| Item 4. |
74 | |||||
| PART II. OTHER INFORMATION |
||||||
| Item 1. |
75 | |||||
| Item 1A. |
75 | |||||
| Item 2. |
75 | |||||
| Item 3. |
75 | |||||
| Item 4. |
76 | |||||
| Item 5. |
76 | |||||
| Item 6. |
76 | |||||
| 77 | ||||||
| 78 | ||||||
Table of Contents
PART I—FINANCIAL INFORMATION
Condensed Statements of Assets and Liabilities
(in thousands, except share and per share amounts)
| September 30, 2018 (Unaudited) |
December 31, 2017 | |||||||
| Assets |
||||||||
| Investments at fair value: |
||||||||
| Non-controlled, non-affiliated investments (amortized cost of $187,554 and $162,976, respectively) |
$ | 187,482 | $ | 163,911 | ||||
| Cash |
2,793 | 7,392 | ||||||
| Cash denominated in foreign currency (cost of $328 and $95, respectively) |
329 | 97 | ||||||
| Income receivable |
2,237 | 1,551 | ||||||
| Receivable for investments sold |
443 | 1,340 | ||||||
| Principal receivable |
389 | 36 | ||||||
| Unrealized appreciation on foreign currency forward contracts |
208 | 96 | ||||||
| Receivable from Advisors |
44 | — | ||||||
| Deferred financing costs |
180 | 260 | ||||||
| Prepaid expenses and other assets |
182 | 396 | ||||||
|
|
|
|
|
|
| |||
| Total assets |
$ | 194,287 | $ | 175,079 | ||||
|
|
|
|
|
|
| |||
| Liabilities |
||||||||
| Revolving credit facility |
$ | 75,471 | $ | 53,000 | ||||
| Payable for investments purchased |
1,129 | 4,220 | ||||||
| Accrued performance-based incentive fees |
200 | 279 | ||||||
| Accrued trustees’ fees |
2 | 5 | ||||||
| Accrued distribution and shareholder servicing fees |
— | 95 | ||||||
| Accrued professional services |
228 | 217 | ||||||
| Payable to Advisors |
800 | 287 | ||||||
| Other accrued expenses and liabilities |
915 | 505 | ||||||
|
|
|
|
|
|
| |||
| Total liabilities |
78,745 | 58,608 | ||||||
|
|
|
|
|
|
| |||
| Net assets |
$ | 115,542 | $ | 116,471 | ||||
|
|
|
|
|
|
| |||
| Commitments and contingencies (Note 11) |
||||||||
| Components of Net Assets |
||||||||
| Preferred stock, $0.001 par value per share, 100,000,000 shares authorized and unissued at September 30, 2018 and December 31, 2017 |
$ | — | $ | — | ||||
| Common stock, $0.001 par value per share, 1,000,000,000 shares authorized, 12,640,594 and 12,656,616 shares issued and outstanding at September 30, 2018 and December 31, 2017, respectively |
13 | 13 | ||||||
| Paid-in capital in excess of par value |
115,562 | 115,686 | ||||||
| Retained earnings (accumulated deficit) |
(33) | 772 | ||||||
|
|
|
|
|
|
| |||
| Net assets |
$ | 115,542 | $ | 116,471 | ||||
|
|
|
|
|
|
| |||
| Net asset value per share of common stock at period end |
$ | 9.14 | $ | 9.20 | ||||
|
|
|
|
|
|
| |||
See notes to unaudited condensed financial statements.
1
Table of Contents
Unaudited Condensed Statements of Operations
(in thousands, except share and per share amounts)
| Three Months Ended September 30, |
Nine Months Ended September 30, | |||||||||||||||
| 2018 | 2017 | 2018 | 2017 | |||||||||||||
| Investment income |
||||||||||||||||
| Interest income |
$ | 4,173 | $ | 2,203 | $ | 11,377 | $ | 5,181 | ||||||||
| Fee income |
52 | 339 | 348 | 385 | ||||||||||||
| Dividend and other income |
20 | — | 47 | — | ||||||||||||
|
|
|
|
|
|
|
|
|
|
|
|
| |||||
| Total investment income |
4,245 | 2,542 | 11,772 | 5,566 | ||||||||||||
|
|
|
|
|
|
|
|
|
|
|
|
| |||||
| Operating expenses |
||||||||||||||||
| Investment advisory fees |
724 | 629 | 2,295 | 1,520 | ||||||||||||
| Professional services |
247 | 65 | 654 | 496 | ||||||||||||
| Administrative services |
128 | 327 | 780 | 720 | ||||||||||||
| Custodian and accounting fees |
84 | 89 | 253 | 243 | ||||||||||||
| Interest expense |
977 | 326 | 2,350 | 326 | ||||||||||||
| Trustee fees and expenses |
72 | 52 | 200 | 155 | ||||||||||||
| Insurance |
41 | 42 | 122 | 123 | ||||||||||||
| Performance-based incentive fees |
185 | 109 | (79 | ) | 136 | |||||||||||
| Distribution and shareholder servicing fees |
— | 252 | 376 | 687 | ||||||||||||
| Offering expense |
— | 91 | 20 | 91 | ||||||||||||
| Organization expenses |
— | 117 | — | 205 | ||||||||||||
| Other |
93 | 50 | 250 | 175 | ||||||||||||
|
|
|
|
|
|
|
|
|
|
|
|
| |||||
| Total operating expenses |
2,551 | 2,149 | 7,221 | 4,877 | ||||||||||||
| Expense support |
(44 | ) | (606 | ) | (625 | ) | (1,866 | ) | ||||||||
|
|
|
|
|
|
|
|
|
|
|
|
| |||||
| Net operating expenses |
2,507 | 1,543 | 6,596 | 3,011 | ||||||||||||
|
|
|
|
|
|
|
|
|
|
|
|
| |||||
| Net investment income |
1,738 | 999 | 5,176 | 2,555 | ||||||||||||
|
|
|
|
|
|
|
|
|
|
|
|
| |||||
| Net realized and unrealized gains (losses) |
||||||||||||||||
| Net realized gains (losses) on: |
||||||||||||||||
| Non-controlled, non-affiliated investments |
101 | 57 | 332 | 361 | ||||||||||||
| Foreign currency forward contracts |
— | — | (1 | ) | — | |||||||||||
| Foreign currency transactions |
(10 | ) | 3 | (31 | ) | 6 | ||||||||||
|
|
|
|
|
|
|
|
|
|
|
|
| |||||
| Net realized gains (losses) |
91 | 60 | 300 | 367 | ||||||||||||
|
|
|
|
|
|
|
|
|
|
|
|
| |||||
| Net change in unrealized appreciation (depreciation) on: |
||||||||||||||||
| Non-controlled, non-affiliated investments |
875 | 410 | (1,007 | ) | 233 | |||||||||||
| Foreign currency forward contracts |
(71 | ) | 77 | 112 | 77 | |||||||||||
| Foreign currency translation |
27 | — | 197 | 5 | ||||||||||||
|
|
|
|
|
|
|
|
|
|
|
|
| |||||
| Net change in unrealized appreciation (depreciation) |
831 | 487 | (698 | ) | 315 | |||||||||||
|
|
|
|
|
|
|
|
|
|
|
|
| |||||
| Net realized and unrealized gains (losses) |
922 | 547 | (398 | ) | 682 | |||||||||||
|
|
|
|
|
|
|
|
|
|
|
|
| |||||
| Net increase (decrease) in net assets resulting from operations |
$ | 2,660 | $ | 1,546 | $ | 4,778 | $ | 3,237 | ||||||||
|
|
|
|
|
|
|
|
|
|
|
|
| |||||
| Net investment income per share |
$ | 0.14 | $ | 0.09 | $ | 0.41 | $ | 0.28 | ||||||||
|
|
|
|
|
|
|
|
|
|
|
|
| |||||
| Diluted and basic earnings (losses) per share |
$ | 0.21 | $ | 0.14 | $ | 0.38 | $ | 0.35 | ||||||||
|
|
|
|
|
|
|
|
|
|
|
|
| |||||
| Weighted average number of shares of common stock outstanding (basic and diluted) |
12,588,969 | 11,024,578 | 12,733,097 | 9,231,778 | ||||||||||||
|
|
|
|
|
|
|
|
|
|
|
|
| |||||
| Distributions declared per share |
$ | 0.15 | $ | 0.15 | $ | 0.44 | $ | 0.44 | ||||||||
|
|
|
|
|
|
|
|
|
|
|
|
| |||||
See notes to unaudited condensed financial statements.
2
Table of Contents
Unaudited Condensed Statements of Changes in Net Assets
(in thousands, except share and per share amounts)
| Nine Months Ended September 30, | ||||||||
| 2018 | 2017 | |||||||
| Operations |
||||||||
| Net investment income |
$ | 5,176 | $ | 2,555 | ||||
| Net realized gains on investments, foreign currency forward contracts and foreign currency transactions |
300 | 367 | ||||||
| Net change in unrealized appreciation (depreciation) on investments, foreign currency forward contracts and foreign currency translation |
(698) | 315 | ||||||
|
|
|
|
|
|
| |||
| Net increase in net assets resulting from operations |
4,778 | 3,237 | ||||||
|
|
|
|
|
|
| |||
| Shareholder distributions |
||||||||
| Distributions to shareholders(1) |
(5,583) | (4,021) | ||||||
|
|
|
|
|
|
| |||
| Net decrease in net assets resulting from shareholders’ distributions |
(5,583) | (4,021) | ||||||
|
|
|
|
|
|
| |||
| Capital share transactions |
||||||||
| Issuance of shares of common stock |
1,270 | 52,231 | ||||||
| Reinvestment of shareholders’ distributions |
2,744 | 2,091 | ||||||
| Repurchase of shares of common stock |
(4,138) | — | ||||||
|
|
|
|
|
|
| |||
| Net increase (decrease) in net assets resulting from capital share transactions |
(124) | 54,322 | ||||||
|
|
|
|
|
|
| |||
| Total increase (decrease) in net assets |
(929) | 53,538 | ||||||
| Net assets at beginning of period |
116,471 | 55,017 | ||||||
|
|
|
|
|
|
| |||
| Net assets at end of period |
$ | 115,542 | $ | 108,555 | ||||
|
|
|
|
|
|
| |||
| Capital share activity |
||||||||
| Shares issued from subscriptions |
136,070 | 5,599,058 | ||||||
| Shares issued from reinvestment of distributions |
296,059 | 224,213 | ||||||
| Shares repurchased |
(448,151) | — | ||||||
|
|
|
|
|
|
| |||
| Net increase (decrease) in shares outstanding |
(16,022) | 5,823,271 | ||||||
|
|
|
|
|
|
| |||
| (1) | The Company estimates that none of the distributions declared during the nine months ended September 30, 2018 would be classified as a tax basis return of capital. |
See notes to unaudited condensed financial statements.
3
Table of Contents
Unaudited Condensed Statements of Cash Flows
(in thousands)
| Nine Months Ended September 30, | ||||||||
| 2018 | 2017 | |||||||
| Operating Activities: |
||||||||
| Net increase (decrease) in net assets resulting from operations |
$ | 4,778 | $ | 3,237 | ||||
| Adjustments to reconcile net increase (decrease) in net assets resulting from operations to net cash provided by (used in) operating activities: |
||||||||
| Purchases of investments |
(82,627 | ) | (145,853 | ) | ||||
| Paid-in-kind interest |
(75 | ) | — | |||||
| Proceeds from sales of investments |
38,229 | 41,657 | ||||||
| Proceeds from principal payments |
21,176 | 13,328 | ||||||
| Net realized (gain) loss on investments |
(332 | ) | (362 | ) | ||||
| Net change in unrealized (appreciation) depreciation on investments |
1,007 | (233 | ) | |||||
| Net change in unrealized (appreciation) depreciation on foreign currency forward contracts |
(112 | ) | (77 | ) | ||||
| Net change in unrealized (appreciation) depreciation on foreign currency translation |
2 | (5 | ) | |||||
| (Gain) loss on borrowings in foreign currency |
(199 | ) | — | |||||
| Amortization of premium/discount, net |
(949 | ) | (622 | ) | ||||
| Amortization of deferred financing costs |
80 | 23 | ||||||
| (Increase) decrease in receivable for investments sold |
897 | 761 | ||||||
| (Increase) decrease in principal receivable |
(353 | ) | (45 | ) | ||||
| (Increase) decrease in receivable from Advisors |
(44 | ) | 281 | |||||
| (Increase) decrease in income receivable |
(686 | ) | (1,019 | ) | ||||
| (Increase) decrease in prepaid expenses and other assets |
214 | (59 | ) | |||||
| Increase (decrease) in payable for investments purchased |
(3,091 | ) | 8,367 | |||||
| Increase (decrease) in accrued performance-based incentive fees |
(79 | ) | 136 | |||||
| Increase (decrease) in payable to Advisors |
513 | 215 | ||||||
| Increase (decrease) in accrued distribution and shareholder servicing fees |
(95 | ) | 31 | |||||
| Increase (decrease) in accrued trustees’ fees |
(3 | ) | 3 | |||||
| Increase (decrease) in accrued professional services |
11 | 26 | ||||||
| Increase (decrease) in other accrued expenses and liabilities |
410 | 586 | ||||||
|
|
|
|
|
|
| |||
| Net cash provided by (used in) operating activities |
(21,328 | ) | (79,624 | ) | ||||
|
|
|
|
|
|
| |||
| Financing Activities: |
||||||||
| Proceeds from issuance of shares of common stock |
1,270 | 52,231 | ||||||
| Payments on repurchases of shares of common stock |
(4,138 | ) | — | |||||
| Borrowings under revolving credit facility |
53,068 | 31,500 | ||||||
| Repayments of revolving credit facility |
(30,398 | ) | — | |||||
| Distributions paid |
(2,839 | ) | (2,182 | ) | ||||
| Deferred financing costs |
— | (141 | ) | |||||
|
|
|
|
|
|
| |||
| Net cash provided by (used in) financing activities |
16,963 | 81,408 | ||||||
|
|
|
|
|
|
| |||
| Effect of exchange rate changes on cash |
(2 | ) | — | |||||
|
|
|
|
|
|
| |||
| Net increase (decrease) in cash |
(4,367 | ) | 1,784 | |||||
| Cash and cash denominated in foreign currency, beginning of period |
7,489 | 3,843 | ||||||
|
|
|
|
|
|
| |||
| Cash and cash denominated in foreign currency, end of period |
$ | 3,122 | $ | 5,627 | ||||
|
|
|
|
|
|
| |||
| Supplemental disclosure of cash flow information and non-cash financing activities: |
||||||||
| Cash paid for interest |
$ | 2,339 | $ | — | ||||
|
|
|
|
|
|
| |||
| Distributions reinvested |
$ | 2,744 | $ | 2,091 | ||||
|
|
|
|
|
|
| |||
| Excise taxes paid |
$ | 27 | $ | 6 | ||||
|
|
|
|
|
|
| |||
See notes to unaudited condensed financial statements.
4
Table of Contents
Unaudited Condensed Schedule of Investments
As of September 30, 2018
(in thousands, except share amounts)
|
Portfolio Company(a)(b) |
Footnotes | Industry |
Rate |
Floor | Maturity Date |
Principal Amount(c) |
Cost(d) | Fair Value | ||||||||||||||
| Senior Secured Loans—First Lien—80.2% |
||||||||||||||||||||||
| Accuride Corporation |
(l) | Automobiles & Components | L+525 | 1.00% | 11/17/23 | $ | 414 | $ | 409 | $ | 420 | |||||||||||
| Acosta, Inc. |
(m) | Media | L+325 | 1.00% | 9/26/21 | 5,189 | 4,714 | 3,914 | ||||||||||||||
| Advantage Sales & Marketing Inc. |
(m) | Media | L+325 | 1.00% | 7/23/21 | 2,821 | 2,708 | 2,622 | ||||||||||||||
| Agro Merchants North America Holdings, Inc. |
(l) | Commercial & Professional Services | L+375 | 1.00% | 12/6/24 | 70 | 69 | 70 | ||||||||||||||
| Aleris International, Inc. |
(m) | Materials | L+475 | 2/27/23 | 1,032 | 1,022 | 1,052 | |||||||||||||||
| American Tire Distributors, Inc. |
(m) | Retailing | L+425 | 1.00% | 9/1/21 | 1,379 | 1,206 | 1,200 | ||||||||||||||
| Belk, Inc. |
(l) | Retailing | L+475 | 1.00% | 12/12/22 | 4,901 | 4,453 | 4,302 | ||||||||||||||
| Berner Food & Beverage Inc. |
(f)(l) | Food, Beverage & Tobacco | L+675 | 1.00% | 2/2/23 | 3,910 | 3,875 | 3,798 | ||||||||||||||
| Berner Food & Beverage Inc. |
(f)(l)(s) | Food, Beverage & Tobacco | L+675 | 1.00% | 2/2/23 | 2,623 | 2,623 | 2,548 | ||||||||||||||
| Bugaboo International B.V. (NLD) |
(e)(f)(g)(h)(j)(o) | Consumer Durables & Apparel | E+375, 7.75% PIK (7.75% Max PIK) | 3/20/25 | € | 1,215 | 1,445 | 1,368 | ||||||||||||||
| CommerceHub, Inc. |
(m) | Software & Services | L+375 | 5/2/25 | $ | 303 | 301 | 304 | ||||||||||||||
| Distribution International, Inc. |
(l) | Capital Goods | L+500 | 1.00% | 12/15/21 | 7,502 | 6,662 | 7,127 | ||||||||||||||
| Eacom Timber Corp (CAN) |
(f)(g)(h)(l) | Materials | L+650 | 1.00% | 11/30/23 | 2,819 | 2,794 | 2,811 | ||||||||||||||
| Eagle Family Foods Group LLC |
(f)(l)(s) | Food, Beverage & Tobacco | L+650 | 1.00% | 6/14/23 | 159 | 157 | 142 | ||||||||||||||
| Eagle Family Foods Group LLC |
(f)(l) | Food, Beverage & Tobacco | L+650 | 1.00% | 6/14/24 | 1,058 | 1,047 | 1,044 | ||||||||||||||
| Evergreen AcqCo 1 LP |
(l) | Retailing | L+375 | 1.25% | 7/9/19 | 1,065 | 1,022 | 1,038 | ||||||||||||||
| Foresight Energy LLC |
(g)(l) | Energy | L+575 | 1.00% | 3/28/22 | 1,557 | 1,483 | 1,560 | ||||||||||||||
| Frontline Technologies Group, LLC |
(f)(m) | Software & Services | L+650 | 1.00% | 9/18/23 | 4,490 | 4,432 | 4,325 | ||||||||||||||
| Frontline Technologies Group, LLC |
(f)(m)(s) | Software & Services | L+650 | 1.00% | 9/18/23 | 889 | 878 | 857 | ||||||||||||||
| GC Agile Intermediate Holdings Limited (GBR) |
(f)(g)(h)(l)(s) | Commercial & Professional Services | L+650 | 6/15/23 | 89 | 86 | 79 | |||||||||||||||
| GC Agile Intermediate Holdings Limited (GBR) |
(f)(g)(h)(l) | Commercial & Professional Services | L+650 | 1.00% | 6/15/25 | 602 | 590 | 596 | ||||||||||||||
| GC Agile Intermediate Holdings Limited (GBR) |
(f)(g)(h)(l)(s) | Commercial & Professional Services | L+650 | 1.00% | 6/15/25 | 290 | 284 | 287 | ||||||||||||||
| GC Agile Intermediate Holdings Limited (GBR) |
(f)(g)(h)(l)(s) | Commercial & Professional Services | L+650 | 1.00% | 6/15/25 | 241 | 237 | 239 | ||||||||||||||
| Harrison Gypsum, LLC |
(f)(m) | Materials | L+700 | 1.00% | 4/29/24 | 812 | 804 | 796 | ||||||||||||||
| Harrison Gypsum, LLC |
(f)(m)(s) | Materials | L+700 | 1.00% | 4/29/24 | 260 | 260 | 255 | ||||||||||||||
See notes to unaudited condensed financial statements.
5
Table of Contents
Corporate Capital Trust II
Unaudited Condensed Schedule of Investments (continued)
As of September 30, 2018
(in thousands, except share amounts)
|
Portfolio Company(a)(b) |
Footnotes | Industry |
Rate |
Floor | Maturity Date |
Principal Amount(c) |
Cost(d) | Fair Value | ||||||||||||||
| ID Verde (FRA) |
(f)(g)(h)(l) | Commercial & Professional Services | L+725 | 3/29/25 | £ | 342 | $ | 467 | $ | 445 | ||||||||||||
| ID Verde (FRA) |
(f)(g)(h)(o) | Commercial & Professional Services | E+700 | 3/29/25 | € | 936 | 1,119 | 1,083 | ||||||||||||||
| ID Verde (FRA) |
(f)(g)(h)(o)(s) | Commercial & Professional Services | E+700 | 3/29/24 | € | 271 | 333 | 332 | ||||||||||||||
| Integro Intermediate Inc. |
(f)(l) | Insurance | L+575 | 10/30/22 | $ | 1,194 | 1,188 | 1,194 | ||||||||||||||
| Jo-Ann Stores, LLC |
(l) | Retailing | L+500 | 1.00% | 10/16/23 | 3,404 | 3,378 | 3,425 | ||||||||||||||
| Mitel US Holdings, Inc. |
(e)(l) | Software & Services | L+450 | 7/11/25 | 1,077 | 1,075 | 1,090 | |||||||||||||||
| Monitronics International, Inc. |
(g)(l) | Commercial & Professional Services | L+550 | 1.00% | 9/30/22 | 2,012 | 1,978 | 1,968 | ||||||||||||||
| NCI, Inc. |
(f)(l) | Software & Services | L+750 | 1.00% | 8/15/24 | 4,287 | 4,242 | 4,289 | ||||||||||||||
| nThrive, Inc. |
(m) | Health Care Equipment & Services | L+450 | 1.00% | 10/20/22 | 71 | 71 | 71 | ||||||||||||||
| Onvoy, LLC |
(l) | Telecommunication Services | L+450 | 1.00% | 2/10/24 | 156 | 139 | 153 | ||||||||||||||
| Patriot Well Solutions LLC |
(f)(l) | Energy | L+875 | 1.00% | 3/31/21 | 667 | 657 | 656 | ||||||||||||||
| Patriot Well Solutions LLC |
(f)(l)(s) | Energy | L+875 | 1.00% | 4/17/21 | 334 | 334 | 328 | ||||||||||||||
| Quidditch Acquisition, Inc |
(m) | Consumer Services | L+700 | 1.00% | 3/21/25 | 1,990 | 1,952 | 2,024 | ||||||||||||||
| Quorum Health Corp. |
(m) | Health Care Equipment & Services | L+675 | 1.00% | 4/29/22 | 4,518 | 4,506 | 4,593 | ||||||||||||||
| Reliant Acquisitions Holdings, Inc. |
(f)(m) | Health Care Equipment & Services | L+675 | 1.00% | 8/30/24 | 2,127 | 2,106 | 2,119 | ||||||||||||||
| Revere Superior Holdings, Inc. |
(f)(l) | Software & Services | L+675 | 1.00% | 11/21/22 | 4,546 | 4,507 | 4,551 | ||||||||||||||
| Revere Superior Holdings, Inc. |
(f)(p) | Software & Services | L+675 | 1.00% | 11/21/22 | 1,246 | 1,238 | 1,241 | ||||||||||||||
| Revere Superior Holdings, Inc. |
(f)(p)(s) | Software & Services | L+675 | 1.00% | 11/21/22 | 385 | 382 | 383 | ||||||||||||||
| Revere Superior Holdings, Inc. |
(f)(l) | Software & Services | L+675 | 1.00% | 11/21/22 | 164 | 161 | 164 | ||||||||||||||
| Revere Superior Holdings, Inc. |
(f)(l) | Software & Services | L+675 | 1.00% | 11/21/22 | 221 | 217 | 192 | ||||||||||||||
| Revere Superior Holdings, Inc. |
(f)(l)(s) | Software & Services | L+675 | 1.00% | 11/21/22 | 131 | 129 | 114 | ||||||||||||||
| Sequa Mezzanine Holdings L.L.C. |
(m) | Capital Goods | L+500 | 1.00% | 11/28/21 | 1,534 | 1,543 | 1,511 | ||||||||||||||
| SIRVA Worldwide Inc |
(q) | Transportation | L+550 | 7/31/25 | 464 | 457 | 466 | |||||||||||||||
| SMART Global Holdings, Inc. |
(f)(q) | Semiconductors & Semiconductor Equipment | L+400 | 2/9/21 | 64 | 64 | 58 | |||||||||||||||
| SMART Global Holdings, Inc. |
(f)(q)(s) | Semiconductors & Semiconductor Equipment | L+400 | 2/9/21 | 33 | 33 | 30 | |||||||||||||||
| SMART Global Holdings, Inc. |
(e)(f)(l) | Semiconductors & Semiconductor Equipment | L+625 | 1.00% | 8/9/22 | 3,194 | 3,151 | 3,226 | ||||||||||||||
| Staples Canada, ULC (CAN) |
(f)(g)(h)(n) | Retailing | CDOR+700 | 1.00% | 9/12/24 | C$ | 5,942 | 4,807 | 4,654 | |||||||||||||
| Sutherland Global Services Inc. |
(l) | Commercial & Professional Services | L+538 | 1.00% | 4/23/21 | $ | 1,799 | 1,757 | 1,726 | |||||||||||||
| Sutherland Global Services Inc. |
(g)(l) | Commercial & Professional Services | L+538 | 1.00% | 4/23/21 | 419 | 409 | 402 | ||||||||||||||
See notes to unaudited condensed financial statements.
6
Table of Contents
Corporate Capital Trust II
Unaudited Condensed Schedule of Investments (continued)
As of September 30, 2018
(in thousands, except share amounts)
|
Portfolio Company(a)(b) |
Footnotes | Industry |
Rate |
Floor | Maturity Date |
Principal Amount(c) |
Cost(d) | Fair Value | ||||||||||||||||||||
| Team Health Holdings Inc |
(m) | Health Care Equipment & Services | L+275 | 1.00% | 2/6/24 | $ | 970 | $ | 940 | $ | 945 | |||||||||||||||||
| TruGreen, LP |
(m) | Commercial & Professional Services | L+400 | 1.00% | 4/13/23 | 980 | 988 | 992 | ||||||||||||||||||||
| UOS LLC |
(m) | Capital Goods | L+550 | 1.00% | 4/18/23 | 3,280 | 3,264 | 3,358 | ||||||||||||||||||||
| VP Parent Holdings, Inc. |
(f)(l) | Software & Services | L+650 | 1.00% | 5/22/25 | 2,488 | 2,465 | 2,463 | ||||||||||||||||||||
| Wheels Up Partners LLC |
(f)(l)(s) | Capital Goods | L+710 | 1.00% | 12/31/18 | 827 | 827 | 827 | ||||||||||||||||||||
| Wheels Up Partners LLC |
(f)(l) | Capital Goods | L+710 | 1.00% | 12/31/18 | 809 | 808 | 811 | ||||||||||||||||||||
| Wheels Up Partners LLC |
(f)(l) | Capital Goods | L+710 | 1.00% | 12/31/18 | 827 | 823 | 830 | ||||||||||||||||||||
| Wheels Up Partners LLC |
(f)(l) | Capital Goods | L+710 | 1.00% | 12/31/18 | 1,254 | 1,252 | 1,258 | ||||||||||||||||||||
| Wheels Up Partners LLC |
(f)(l) | Capital Goods | L+710 | 1.00% | 12/31/18 | 514 | 513 | 516 | ||||||||||||||||||||
| Wheels Up Partners LLC |
(f)(l) | Capital Goods | L+710 | 1.00% | 12/31/18 | 263 | 261 | 264 | ||||||||||||||||||||
| Wheels Up Partners LLC |
(f)(l) | Capital Goods | L+855 | 1.00% | 12/31/18 | 758 | 756 | 757 | ||||||||||||||||||||
| Wheels Up Partners LLC |
(f)(l) | Capital Goods | L+855 | 1.00% | 12/31/18 | 386 | 385 | 384 | ||||||||||||||||||||
| WireCo WorldGroup, Inc. |
(m) | Materials | L+500 | 1.00% | 9/29/23 | 554 | 553 | 562 | ||||||||||||||||||||
|
|
|
|
|
|||||||||||||||||||||||||
| Total Senior Secured Loans—First Lien |
|
99,796 | 99,209 | |||||||||||||||||||||||||
| Unfunded Loan Commitments |
(6,563) | (6,563) | ||||||||||||||||||||||||||
|
|
|
|
|
|||||||||||||||||||||||||
| Net Senior Secured Loans—First Lien |
|
93,233 | 92,646 | |||||||||||||||||||||||||
|
|
|
|
|
|||||||||||||||||||||||||
| Senior Secured Loans—Second Lien—29.8% |
|
|||||||||||||||||||||||||||
| Access CIG, LLC |
(m) | Software & Services | L+775 | 2/27/26 | 200 | 198 | 201 | |||||||||||||||||||||
| Access CIG, LLC |
(m)(s) | Software & Services | L+775 | 2/27/26 | 11 | 11 | 11 | |||||||||||||||||||||
| Advantage Sales & Marketing Inc. |
(m) | Media | L+650 | 1.00% | 7/25/22 | 542 | 483 | 461 | ||||||||||||||||||||
| Albany Molecular Research, Inc. |
(m) | Pharmaceuticals, Biotechnology & Life Sciences | L+700 | 1.00% | 8/30/25 | 913 | 927 | 918 | ||||||||||||||||||||
| Ammeraal Beltech Holding BV (NLD) |
(f)(g)(h)(m) | Capital Goods | L+800 | 9/28/26 | 2,018 | 1,977 | 1,977 | |||||||||||||||||||||
| Applied Systems, Inc. |
(l) | Software & Services | L+700 | 1.00% | 9/19/25 | 2,624 | 2,624 | 2,681 | ||||||||||||||||||||
| Arclin, Inc. |
(g)(l) | Materials | L+875 | 1.00% | 2/14/25 | 289 | 286 | 293 | ||||||||||||||||||||
| CommerceHub, Inc. |
(f)(m) | Software & Services | L+775 | 1.00% | 5/21/26 | 3,222 | 3,130 | 3,143 | ||||||||||||||||||||
| CTI Foods Holding Co., LLC |
(m) | Food, Beverage & Tobacco | L+725 | 1.00% | 6/28/21 | 222 | 211 | 94 | ||||||||||||||||||||
| Deck Chassis Acquisition Inc. |
(m) | Automobiles & Components | L+600 | 6/15/23 | 587 | 584 | 593 | |||||||||||||||||||||
See notes to unaudited condensed financial statements.
7
Table of Contents
Corporate Capital Trust II
Unaudited Condensed Schedule of Investments (continued)
As of September 30, 2018
(in thousands, except share amounts)
|
Portfolio Company(a)(b) |
Footnotes | Industry |
Rate |
Floor | Maturity Date |
Principal Amount(c) |
Cost(d) | Fair Value | ||||||||||||||
| EXC Holdings III Corp. |
(l) | Technology Hardware & Equipment | L+750 | 1.00% | 12/1/25 | $ | 811 | $ | 804 | $ | 824 | |||||||||||
| FPC Holdings, Inc. |
(m) | Capital Goods | L+800 | 1.25% | 5/19/23 | 12 | 12 | 12 | ||||||||||||||
| GOBP Holdings, Inc. |
(m) | Food & Staples Retailing | L+825 | 1.00% | 10/21/22 | 50 | 47 | 50 | ||||||||||||||
| Higginbotham Insurance Agency, Inc. |
(f)(m) | Insurance | L+725 | 12/19/25 | 1,304 | 1,293 | 1,304 | |||||||||||||||
| Integro Intermediate Inc. |
(f)(l) | Insurance | L+925 | 6/8/25 | 222 | 220 | 222 | |||||||||||||||
| Invictus U.S., LLC |
(p) | Materials | L+675 | 3/30/26 | 451 | 452 | 450 | |||||||||||||||
| iParadigms Holdings LLC |
(l) | Software & Services | L+725 | 1.00% | 7/29/22 | 183 | 180 | 183 | ||||||||||||||
| Jo-Ann Stores, LLC |
(l) | Retailing | L+925 | 1.00% | 5/21/24 | 396 | 390 | 392 | ||||||||||||||
| LBM Borrower, LLC |
(p) | Capital Goods | L+925 | 1.00% | 8/20/23 | 900 | 895 | 907 | ||||||||||||||
| Misys, Ltd. (GBR) |
(g)(h)(l) | Software & Services | L+725 | 1.00% | 6/13/25 | 2,814 | 2,824 | 2,795 | ||||||||||||||
| NEP Group, Inc. |
(l) | Media | L+700 | 1.00% | 1/23/23 | 239 | 231 | 240 | ||||||||||||||
| One Call Corp. |
(f)(j)(m) | Health Care Equipment & Services | L+375, 6.00% PIK (6.00% Max PIK) | 4/11/24 | 1,180 | 1,169 | 1,164 | |||||||||||||||
| Polyconcept North America, Inc. |
(f)(m) | Consumer Durables & Apparel | L+1000 | 1.00% | 2/16/24 | 624 | 613 | 643 | ||||||||||||||
| Press Ganey Holdings, Inc. |
(m) | Health Care Equipment & Services | L+650 | 1.00% | 10/21/24 | 1,066 | 1,080 | 1,077 | ||||||||||||||
| Sequa Mezzanine Holdings L.L.C. |
(p) | Capital Goods | L+900 | 1.00% | 4/28/22 | 4,024 | 4,063 | 3,969 | ||||||||||||||
| SIRVA Worldwide Inc |
(l) | Transportation | L+950 | 7/31/26 | 417 | 386 | 388 | |||||||||||||||
| SMG US Midco 2, Inc. |
(m) | Consumer Services | L+700 | 1/23/26 | 230 | 231 | 232 | |||||||||||||||
| Sparta Systems, Inc. |
(f)(m) | Software & Services | L+825 | 7/27/25 | 2,438 | 2,405 | 2,309 | |||||||||||||||
| Transplace, Inc. |
(m) | Transportation | L+875 | 1.00% | 10/6/25 | 3,289 | 3,216 | 3,334 | ||||||||||||||
| Ultimate Baked Goods Midco LLC |
(f)(l) | Food & Staples Retailing | L+800 | 1.00% | 8/9/26 | 694 | 687 | 686 | ||||||||||||||
| Vantage Specialty Chemicals, Inc. |
(p) | Materials | L+825 | 1.00% | 10/27/25 | 755 | 745 | 761 | ||||||||||||||
| Vectra Co. |
(m) | Materials | L+725 | 3/8/26 | 450 | 446 | 450 | |||||||||||||||
| WireCo WorldGroup, Inc. |
(m) | Materials | L+900 | 1.00% | 9/30/24 | 1,632 | 1,628 | 1,649 | ||||||||||||||
|
|
|
|
|
|||||||||||||||||||
| Total Senior Secured Loans—Second Lien |
34,448 | 34,413 | ||||||||||||||||||||
| Unfunded Loan Commitments |
(11) | (11) | ||||||||||||||||||||
|
|
|
|
|
|||||||||||||||||||
| Net Senior Secured Loans—Second Lien |
34,437 | 34,402 | ||||||||||||||||||||
|
|
|
|
|
|||||||||||||||||||
See notes to unaudited condensed financial statements.
8
Table of Contents
Corporate Capital Trust II
Unaudited Condensed Schedule of Investments (continued)
As of September 30, 2018
(in thousands, except share amounts)
|
Portfolio Company(a)(b) |
Footnotes | Industry |
Rate |
Floor | Maturity Date |
Principal Amount(c) |
Cost(d) | Fair Value | ||||||||||||||||||||
| Senior Secured Bonds—10.5% |
||||||||||||||||||||||||||||
| APX Group, Inc. |
Consumer Services | 7.88% | 12/1/22 | $ | 1,752 | $ | 1,729 | $ | 1,789 | |||||||||||||||||||
| Avantor, Inc. |
(i) | Materials | 6.00% | 10/1/24 | 776 | 776 | 789 | |||||||||||||||||||||
| Boyne USA Inc. |
(i) | Consumer Services | 7.25% | 5/1/25 | 110 | 114 | 116 | |||||||||||||||||||||
| Cleaver-Brooks, Inc. |
(i) | Capital Goods | 7.88% | 3/1/23 | 800 | 800 | 819 | |||||||||||||||||||||
| Cornerstone Chemical Co. |
(i) | Materials | 6.75% | 8/15/24 | 2,682 | 2,686 | 2,688 | |||||||||||||||||||||
| DJO Finco Inc. |
(i) | Health Care Equipment & Services | 8.13% | 6/15/21 | 2,100 | 2,093 | 2,152 | |||||||||||||||||||||
| Frontier Communications Corp. |
(g)(i) | Telecommunication Services | 8.50% | 4/1/26 | 353 | 353 | 334 | |||||||||||||||||||||
| Genesys Telecommunications Laboratories, Inc. |
(i) | Software & Services | 10.00% | 11/30/24 | 672 | 748 | 745 | |||||||||||||||||||||
| Pattonair Holdings, Ltd. (GBR) |
(g)(h)(i) | Capital Goods | 9.00% | 11/1/22 | 1,057 | 1,072 | 1,095 | |||||||||||||||||||||
| Pisces Midco Inc. |
(i) | Capital Goods | 8.00% | 4/15/26 | 1,666 | 1,633 | 1,680 | |||||||||||||||||||||
|
|
|
|
|
|||||||||||||||||||||||||
| Total Senior Secured Bonds |
12,004 | 12,207 | ||||||||||||||||||||||||||
|
|
|
|
|
|||||||||||||||||||||||||
| Total Senior Debt |
139,674 | 139,255 | ||||||||||||||||||||||||||
|
|
|
|
|
|||||||||||||||||||||||||
| Subordinated Debt—33.0% |
||||||||||||||||||||||||||||
| Allegheny Technologies Incorporated |
(g) | Materials | 7.88% | 8/15/23 | 4,350 | 4,343 | 4,660 | |||||||||||||||||||||
| APX Group, Inc. |
Consumer Services | 8.75% | 12/1/20 | 1,695 | 1,557 | 1,696 | ||||||||||||||||||||||
| APX Group, Inc. |
Consumer Services | 7.63% | 9/1/23 | 821 | 739 | 758 | ||||||||||||||||||||||
| CDK Global Inc |
(g) | Software & Services | 4.88% | 6/1/27 | 7 | 7 | 7 | |||||||||||||||||||||
| Clear Channel International BV (NLD) |
(g)(h)(i) | Media | 8.75% | 12/15/20 | 3,779 | 3,883 | 3,907 | |||||||||||||||||||||
| ClubCorp Holdings, Inc. |
(i) | Consumer Services | 8.50% | 9/15/25 | 5,260 | 5,167 | 5,021 | |||||||||||||||||||||
| Consolidated Energy Finance S.A. (BRB) |
(g)(h)(i) | Materials | 6.50% | 5/15/26 | 201 | 201 | 203 | |||||||||||||||||||||
| Datatel, Inc. |
(i) | Software & Services | 9.00% | 9/30/23 | 102 | 107 | 107 | |||||||||||||||||||||
| Foresight Energy LLC |
(g)(i) | Energy | 11.50% | 4/1/23 | 545 | 476 | 487 | |||||||||||||||||||||
| Hub International Ltd. |
(i) | Insurance | 7.00% | 5/1/26 | 1,180 | 1,179 | 1,183 | |||||||||||||||||||||
| Kenan Advantage Group, Inc. |
(i) | Transportation | 7.88% | 7/31/23 | 3,262 | 3,376 | 3,376 | |||||||||||||||||||||
See notes to unaudited condensed financial statements.
9
Table of Contents
Corporate Capital Trust II
Unaudited Condensed Schedule of Investments (continued)
As of September 30, 2018
(in thousands, except share amounts)
|
Portfolio Company(a)(b) |
Footnotes | Industry |
Rate |
Floor | Maturity Date |
Principal Amount(c) |
Cost(d) | Fair Value | ||||||||||||||||||
| Pactiv LLC |
Materials | 7.95% | 12/15/25 | 849 | $ | 931 | $ | 910 | ||||||||||||||||||
| Pactiv LLC |
Materials | 8.38% | 4/15/27 | 2,653 | 2,947 | 2,888 | ||||||||||||||||||||
| PAREXEL International Corp. |
(i) | Pharmaceuticals, Biotechnology & Life Sciences | 6.38% | 9/1/25 | 610 | 590 | 579 | |||||||||||||||||||
| Quorum Health Corp. |
Health Care Equipment & Services | 11.63% | 4/15/23 | 268 | 269 | 269 | ||||||||||||||||||||
| SRS Distribution Inc. |
(i) | Capital Goods | 8.25% | 7/1/26 | 3,010 | 2,997 | 2,946 | |||||||||||||||||||
| Surgery Center Holdings, Inc. |
(i) | Health Care Equipment & Services | 6.75% | 7/1/25 | 548 | 501 | 527 | |||||||||||||||||||
| Surgery Partners Holdings LLC |
(i) | Health Care Equipment & Services | 8.88% | 4/15/21 | 18 | 18 | 19 | |||||||||||||||||||
| Team Health Holdings Inc |
(i) | Health Care Equipment & Services | 6.38% | 2/1/25 | 1,943 | 1,702 | 1,709 | |||||||||||||||||||
| Tenet Healthcare Corp. |
(g) | Health Care Equipment & Services | 7.00% | 8/1/25 | 31 | 31 | 31 | |||||||||||||||||||
| Triumph Group, Inc. |
Capital Goods | 7.75% | 8/15/25 | 217 | 217 | 211 | ||||||||||||||||||||
| USA Compression Partners, LP |
(g)(i) | Energy | 6.88% | 4/1/26 | 247 | 247 | 255 | |||||||||||||||||||
| Vertiv Group Corp. |
(i) | Capital Goods | 9.25% | 10/15/24 | 6,124 | 6,332 | 6,402 | |||||||||||||||||||
|
|
|
|
|
|||||||||||||||||||||||
| Total Subordinated Debt |
37,817 | 38,151 | ||||||||||||||||||||||||
|
|
|
|
|
|||||||||||||||||||||||
| Asset Based Finance—5.1% |
No. of Shares | |||||||||||||||||||||||||
| KKR Zeno Aggregator, LP (IRE), Membership Interest |
(f)(g)(h) | Capital Goods | 4,335,848 | 4,336 | 4,336 | |||||||||||||||||||||
| Montgomery Credit Holdings, LP, Membership Interest |
(f)(g)(r) | Diversified Financials | 1,522,825 | 1,523 | 1,391 | |||||||||||||||||||||
| Neos SPV I (NLD), Membership Interest |
(f)(g)(h)(r) | Diversified Financials | 107,825 | 126 | 125 | |||||||||||||||||||||
|
|
|
|
|
|||||||||||||||||||||||
| Total Asset Based Finance |
5,985 | 5,852 | ||||||||||||||||||||||||
|
|
|
|
|
|||||||||||||||||||||||
See notes to unaudited condensed financial statements.
10
Table of Contents
Corporate Capital Trust II
Unaudited Condensed Schedule of Investments (continued)
As of September 30, 2018
(in thousands, except share amounts)
|
Portfolio Company(a)(b) |
Footnotes | Industry |
Rate |
Floor | Maturity Date |
No. of Shares | Cost(d) | Fair Value | ||||||||||||||||||||
| Equity/Other—3.7% |
||||||||||||||||||||||||||||
| Misys, Ltd. (GBR), Perpetual Preferred Equity |
(f)(g)(h)(j)(l) | Software & Services | L+1025 | 2,842 | $ | 2,788 | $ | 2,703 | ||||||||||||||||||||
| Polyconcept North America, Inc., Membership Units |
(f) | Consumer Durables & Apparel | 624 | 62 | 94 | |||||||||||||||||||||||
| VICI Properties, Inc., Common Stock |
(g) | Consumer Services | 66,020 | 1,228 | 1,427 | |||||||||||||||||||||||
|
|
|
|
|
|||||||||||||||||||||||||
| Total Equity/Other |
4,078 | 4,224 | ||||||||||||||||||||||||||
|
|
|
|
|
|||||||||||||||||||||||||
| TOTAL INVESTMENTS—162.3% |
(k) | $ | 187,554 | 187,482 | ||||||||||||||||||||||||
|
|
|
|||||||||||||||||||||||||||
| OTHER ASSETS IN EXCESS OF LIABILITIES—(62.3%) |
(71,940) | |||||||||||||||||||||||||||
|
|
|
|||||||||||||||||||||||||||
| NET ASSETS—100.0% |
$ | 115,542 | ||||||||||||||||||||||||||
|
|
|
|||||||||||||||||||||||||||
| Derivative Instruments (Note 4)—0.2% |
|
|||||||||||||||||||||||||||
|
|
|
|||||||||||||||||||||||||||
| Foreign currency forward contracts |
$ | 208 | ||||||||||||||||||||||||||
| (a) | Security may be an obligation of one or more entities affiliated with the named company. |
| (b) | Non-controlled/non-affiliated investments as defined by the Investment Company Act of 1940, as amended (“1940 Act”), unless otherwise indicated. Non-controlled/non-affiliated investments are investments that are neither controlled investments nor affiliated investments. |
| (c) | Denominated in U.S. dollars unless otherwise noted. |
| (d) | Represents amortized cost for debt securities and cost for equity investments translated to U.S. dollars. |
| (e) | Position or portion thereof unsettled as of September 30, 2018. |
| (f) | Investments classified as Level 3 whereby fair value was determined by the Company’s Board of Trustees (see Note 2). |
| (g) | The investment is not a qualifying asset as defined in Section 55(a) under the 1940 Act. A business development company may not acquire any asset other than qualifying assets, unless, at the time the acquisition is made, qualifying assets represent at least 70% of the company’s total assets. As of September 30, 2018, 79.4% of the Company’s total assets represented qualifying assets. |
| (h) | A portfolio company domiciled in a foreign country. The jurisdiction of the security issuer may be a different country than the domicile of the portfolio company. |
| (i) | This security was acquired in a transaction that was exempt from the registration requirements of the Securities Act, pursuant to Rule 144A thereunder. This security may be resold only in transactions that are exempt from the registration requirements of the Securities Act, normally to qualified institutional buyers. |
| (j) | The issuer of this security may elect at any time to capitalize distributions or interest. |
See notes to unaudited condensed financial statements.
11
Table of Contents
Corporate Capital Trust II
Unaudited Condensed Schedule of Investments (continued)
As of September 30, 2018
(in thousands, except share amounts)
| (k) | As of September 30, 2018, the aggregate gross unrealized appreciation for all securities in which there was an excess of value over tax cost was $2,562; the aggregate gross unrealized depreciation for all securities in which there was an excess of tax cost over value was $2,702; the net unrealized depreciation was $140; the aggregate cost of securities for Federal income tax purposes was $188,030. |
| (l) | The interest rate on these investments is subject to a base rate of 3-Month LIBOR, which at September 30, 2018 was 2.40%. The current base rate for each investment may be different from the reference rate on September 30, 2018. |
| (m) | The interest rate on these investments is subject to a base rate of 2-Month LIBOR, which at September 30, 2018 was 2.31%. The current base rate for each investment may be different from the reference rate on September 30, 2018. |
| (n) | The interest rate on these investments is subject to a base rate of 1-Month LIBOR, which at September 30, 2018 was 2.26%. The current base rate for each investment may be different from the reference rate on September 30, 2018. |
| (o) | The interest rate on these investments is subject to a base rate of 3-Month Canadian Banker Acceptance Rate, which at September 30, 2018 was approximately 2.02%. The current base rate for each investment may be different from the reference rate on September 30, 2018. |
| (p) | The interest rate on these investments is subject to a base rate of 3-Month Euro Interbank Offered Rate, which at September 30, 2018 was approximately (0.32)%. The current base rate for each investment may be different from the reference rate on September 30, 2018. |
| (q) | The interest rate on these investments is subject to a base rate of the PRIME rate, which at September 30, 2018 was approximately 5.25%. The current base rate for each investment may be different from the reference rate on September 30, 2018. |
| (r) | Security is non-income producing. |
| (s) | Security is an unfunded loan commitment. |
Abbreviations:
C$ - Canadian Dollar; local currency investment amount is denominated in Canadian Dollar. C$ 1 / U.S. $0.77 as of September 30, 2018.
€ - Local currency investment amount is denominated in Euros. € 1 / U.S. $1.16 as of September 30, 2018.
£ - Local currency investment amount is denominated in British Pound Sterling. £ 1 / U.S. $1.31 as of September 30, 2018.
BRB = Barbados
CAN = Canada
CDOR = Canadian Banker Acceptance Rate
E = EURIBOR - Euro Interbank Offered Rate
FRA = France
GBR = United Kingdom
IRE = Ireland
L = LIBOR - London Interbank Offered Rate, typically 3-Month
NLD = Netherlands
PIK = Payment-in-kind; the issuance of additional securities by the borrower to settle interest payment obligations.
See notes to unaudited condensed financial statements.
12
Table of Contents
Corporate Capital Trust II
Schedule of Investments
As of December 31, 2017
(in thousands, except share amounts)
|
Portfolio Company(a)(b) |
Footnotes |
Industry |
Rate | Floor | Maturity Date |
No. Shares/ Principal Amount(c) |
Cost(d) | Fair Value | ||||||||||||||||||||
| First Lien Senior Secured Loans—80.4% |
||||||||||||||||||||||||||||
| ABB CONCISE Optical Group, LLC |
(1) | Retailing | L + 500 | 1.00% | 6/15/23 | $ | 510 | $ | 508 | $ | 511 | |||||||||||||||||
| Accuride Corp. |
(e),(1) | Capital Goods | L + 525 | 1.00% | 11/17/23 | 2,508 | 2,478 | 2,555 | ||||||||||||||||||||
| Acosta Holdco, Inc. |
(2) | Commercial & Professional Services | L + 325 | 1.00% | 9/26/21 | 2,761 | 2,515 | 2,439 | ||||||||||||||||||||
| Advantage Sales & Marketing, Inc. |
(1) | Commercial & Professional Services | L + 325 | 1.00% | 7/23/21 | 616 | 590 | 602 | ||||||||||||||||||||
| Agro Merchants Global, LP |
(e),(1) | Transportation | L + 375 | 1.00% | 12/6/24 | 70 | 70 | 71 | ||||||||||||||||||||
| BakerCorp International, Inc. |
(1) | Capital Goods | L + 300 | 1.25% | 2/7/20 | 4,565 | 4,418 | 4,525 | ||||||||||||||||||||
| Bay Club, Co. |
(2) | Consumer Services | L + 650 | 1.00% | 8/31/22 | 2,224 | 2,195 | 2,258 | ||||||||||||||||||||
| Belk, Inc. |
(1) | Retailing | L + 475 | 1.00% | 12/12/22 | 4,945 | 4,430 | 4,075 | ||||||||||||||||||||
| Commercial Barge Line Co. |
(2) | Transportation | L + 875 | 1.00% | 11/12/20 | 346 | 330 | 202 | ||||||||||||||||||||
| David’s Bridal, Inc. |
(1) | Retailing | L + 400 | 1.25% | 10/11/19 | 398 | 379 | 350 | ||||||||||||||||||||
| DigiCert, Inc. |
(1) | Software & Services | L + 475 | 1.00% | 10/31/24 | 1,975 | 1,965 | 2,003 | ||||||||||||||||||||
| Distribution International, Inc. |
(1) | Retailing | L + 500 | 1.00% | 12/15/21 | 7,560 | 6,558 | 6,431 | ||||||||||||||||||||
| Eacom Timber Corp. (CAN) |
(f),(g),(h),(1) | Materials | L + 650 | 1.00% | 11/30/23 | 2,928 | 2,899 | 2,909 | ||||||||||||||||||||
| FleetPride Corp. |
(1) | Capital Goods | L + 400 | 1.25% | 11/19/19 | 3,412 | 3,279 | 3,406 | ||||||||||||||||||||
| Foresight Energy, LLC |
(g),(1) | Materials | L + 575 | 1.00% | 3/17/22 | 3,676 | 3,543 | 3,458 | ||||||||||||||||||||
| Frontline Technologies Group, LLC |
(f),(1) | Software & Services | L + 650 | 1.00% | 9/18/23 | 4,524 | 4,446 | 4,448 | ||||||||||||||||||||
| Intelsat S.A. (LUX) |
(g),(h),(1) | Media | L + 275 | 1.00% | 6/30/19 | 2,267 | 2,259 | 2,265 | ||||||||||||||||||||
| JC Penney Corp., Inc. |
(g),(1) | Retailing | L + 425 | 1.00% | 6/23/23 | 16 | 16 | 15 | ||||||||||||||||||||
| Jo-Ann Stores, Inc. |
(1) | Retailing | L + 500 | 1.00% | 10/20/23 | 3,497 | 3,467 | 3,384 | ||||||||||||||||||||
| Koosharem, LLC |
(1) | Commercial & Professional Services | L + 650 | 1.00% | 5/15/20 | 2,495 | 2,292 | 2,437 | ||||||||||||||||||||
| MedAssets, Inc. |
(2) | Health Care Equipment & Services | L + 450 | 1.00% | 10/20/22 | 71 | 72 | 72 | ||||||||||||||||||||
| Monitronics International, Inc. |
(1) | Commercial & Professional Services | L + 550 | 1.00% | 9/30/22 | 2,027 | 1,987 | 2,013 | ||||||||||||||||||||
| NCI, Inc. |
(f),(1) | Software & Services | L + 750 | 1.00% | 8/15/24 | 4,330 | 4,279 | 4,289 | ||||||||||||||||||||
| Netsmart Technologies, Inc. |
(1) | Health Care Equipment & Services | L + 450 | 1.00% | 4/19/23 | 81 | 81 | 82 | ||||||||||||||||||||
| P2 Energy Solutions, Inc. |
(g),(1) | Software & Services | L + 400 | 1.00% | 10/30/20 | 3,317 | 3,246 | 3,253 | ||||||||||||||||||||
See notes to unaudited condensed financial statements.
13
Table of Contents
Corporate Capital Trust II
Schedule of Investments (continued)
As of December 31, 2017
(in thousands, except share amounts)
|
Portfolio Company(a)(b) |
Footnotes |
Industry |
Rate | Floor | Maturity Date |
No. Shares/ Principal Amount(c) |
Cost(d) | Fair Value | ||||||||||||||||
| Polyconcept North America, Inc. |
(2) | Consumer Durables & Apparel | L + 475 | 1.00% | 8/16/23 | $ | 332 | $ | 329 | $ | 334 | |||||||||||||
| Quorum Health Corp. |
(2) | Health Care Equipment & Services | L + 675 | 1.00% | 4/29/22 | 4,575 | 4,561 | 4,632 | ||||||||||||||||
| Revere Superior Holdings, Inc. |
(f),(1) | Software & Services | L + 675 | 1.00% | 11/21/22 | 4,581 | 4,536 | 4,567 | ||||||||||||||||
| Revere Superior Holdings, Inc. |
(f),(1) | Software & Services | L + 675 | 1.00% | 11/21/22 | 164 | 160 | 163 | ||||||||||||||||
| Revere Superior Holdings, Inc. |
(f),(1) | Software & Services | L + 675 | 1.00% | 11/21/22 | 33 | 26 | 2 | ||||||||||||||||
| Savers, Inc. |
(1) | Retailing | L + 375 | 1.25% | 7/9/19 | 1,074 | 1,000 | 1,012 | ||||||||||||||||
| Sequa Corp. |
(1) | Materials | L + 500 | 1.00% | 11/28/21 | 1,545 | 1,557 | 1,559 | ||||||||||||||||
| SI Organization, Inc. |
(1) | Capital Goods | L + 475 | 1.00% | 11/23/19 | 597 | 597 | 604 | ||||||||||||||||
| SIRVA Worldwide, Inc. |
(1) | Commercial & Professional Services | L + 650 | 1.00% | 11/22/22 | 2,061 | 2,016 | 2,081 | ||||||||||||||||
| SMART Global Holdings, Inc. |
(f),(g),(4) | Semiconductors & Semiconductor Equipment | P + 400 | 0.00% | 2/9/22 | 46 | 46 | 37 | ||||||||||||||||
| SMART Global Holdings, Inc. |
(f),(g),(1) | Semiconductors & Semiconductor Equipment | L + 625 | 1.00% | 8/9/22 | 3,261 | 3,201 | 3,288 | ||||||||||||||||
| Staples Canada, Inc. |
(f),(g),(h),(5) | Retailing | CDOR + 700 | 1.00% | 9/12/23 | C$ | 5,689 | 4,608 | 4,412 | |||||||||||||||
| Sutherland Global Services, Inc. |
(g),(1) | Software & Services | L + 537.5 | 1.00% | 4/23/21 | $ | 709 | 691 | 682 | |||||||||||||||
| Sutherland Global Services, Inc. |
(g),(1) | Software & Services | L + 537.5 | 1.00% | 4/23/21 | 3,046 | 2,967 | 2,931 | ||||||||||||||||
| Talbots, Inc. |
(2) | Retailing | L + 450 | 1.00% | 3/19/20 | 720 | 671 | 701 | ||||||||||||||||
| TruGreen, LP |
(1) | Consumer Services | L + 400 | 1.00% | 4/13/23 | 1,573 | 1,588 | 1,598 | ||||||||||||||||
| Utility One Source, LP |
(2) | Capital Goods | L + 550 | 1.00% | 4/7/23 | 3,305 | 3,287 | 3,384 | ||||||||||||||||
| Vertafore, Inc. |
(2) | Software & Services | L + 325 | 1.00% | 6/30/23 | 139 | 139 | 140 | ||||||||||||||||
| Wheels Up Partners, LLC |
(f),(1) | Transportation | L + 855 | 1.00% | 10/15/21 | 372 | 370 | 369 | ||||||||||||||||
| Wheels Up Partners, LLC |
(f),(1) | Transportation | L + 855 | 1.00% | 7/15/22 | 424 | 422 | 421 | ||||||||||||||||
| Wheels Up Partners, LLC |
(f),(1) | Transportation | L + 710 | 1.00% | 8/1/24 | 1,347 | 1,338 | 1,336 | ||||||||||||||||
| Wheels Up Partners, LLC |
(f),(1) | Transportation | L + 710 | 1.00% | 11/1/24 | 551 | 547 | 547 | ||||||||||||||||
| Wheels Up Partners, LLC |
(f),(1) | Transportation | L + 710 | 1.00% | 2/1/25 | 276 | 273 | 273 | ||||||||||||||||
See notes to unaudited condensed financial statements.
14
Table of Contents
Corporate Capital Trust II
Schedule of Investments (continued)
As of December 31, 2017
(in thousands, except share amounts)
|
Portfolio Company(a)(b) |
Footnotes |
Industry |
Rate | Floor | Maturity Date |
No. Shares/ Principal Amount(c) |
Cost(d) | Fair Value | ||||||||||||||||
| WireCo WorldGroup, Inc. |
(1) | Capital Goods | L + 550 | 1.00% | 9/29/23 | $ | 558 | $ | 557 | $ | 563 | |||||||||||||
|
|
|
|
|
|||||||||||||||||||||
| Total First Lien Senior Secured Loans |
93,789 | 93,689 | ||||||||||||||||||||||
|
|
|
|
|
|||||||||||||||||||||
| Second Lien Senior Secured Loans—28.6% |
||||||||||||||||||||||||
| ABILITY Network, Inc. |
(e) | Health Care Equipment & Services | L + 775 | 1.00% | 12/12/25 | 856 | 851 | 860 | ||||||||||||||||
| Albany Molecular Research, Inc. |
(2) | Pharmaceuticals, Biotechnology & Life Sciences | L + 700 | 1.00% | 8/28/25 | 913 | 909 | 901 | ||||||||||||||||
| Applied Systems, Inc. |
(1) | Software & Services | L + 700 | 1.00% | 9/12/25 | 2,624 | 2,624 | 2,721 | ||||||||||||||||
| Arclin, Inc. |
(1) | Materials | L + 875 | 1.00% | 2/9/25 | 424 | 421 | 430 | ||||||||||||||||
| BJ’s Wholesale Club, Inc. |
(3) | Food & Staples Retailing | L + 750 | 1.00% | 1/27/25 | 949 | 941 | 930 | ||||||||||||||||
| CTI Foods Holding Co., LLC |
(2) | Food, Beverage & Tobacco | L + 725 | 1.00% | 6/28/21 | 222 | 208 | 173 | ||||||||||||||||
| Direct ChassisLink, Inc. |
(e) | Transportation | L + 600 | 0.00% | 6/15/23 | 587 | 584 | 599 | ||||||||||||||||
| Excelitas Technologies Corp. |
(e)(1) | Technology Hardware & Equipment | L + 750 | 1.00% | 11/15/25 | 811 | 803 | 820 | ||||||||||||||||
| FleetPride Corp. |
(1) | Capital Goods | L + 800 | 1.25% | 5/19/20 | 853 | 775 | 838 | ||||||||||||||||
| Genoa, a QoL Healthcare Co., LLC |
(2) | Health Care Equipment & Services | L + 800 | 1.00% | 10/28/24 | 353 | 354 | 359 | ||||||||||||||||
| Grocery Outlet, Inc. |
(1) | Food & Staples Retailing | L + 825 | 1.00% | 10/21/22 | 198 | 186 | 199 | ||||||||||||||||
| Higginbotham Insurance Agency, Inc. |
(e)(f)(4) | Insurance | L + 725 | 1.00% | 12/19/25 | 1,304 | 1,291 | 1,291 | ||||||||||||||||
| iParadigms Holdings, LLC |
(1) | Software & Services | L + 725 | 1.00% | 7/29/22 | 183 | 179 | 179 | ||||||||||||||||
| Misys, Ltd. (GBR) |
(g),(h),(1) | Software & Services | L + 725 | 1.00% | 6/13/25 | 2,814 | 2,825 | 2,829 | ||||||||||||||||
| NEP Group, Inc. |
(2) | Media | L + 700 | 1.00% | 1/23/23 | 239 | 230 | 241 | ||||||||||||||||
| NeuStar, Inc. |
(1) | Software & Services | L + 800 | 1.00% | 8/8/25 | 1,807 | 1,781 | 1,831 | ||||||||||||||||
| Polyconcept North America, Inc. |
(f),(2) | Consumer Durables & Apparel | L + 1000 | 1.00% | 2/16/24 | 624 | 611 | 638 | ||||||||||||||||
| Press Ganey Holdings, Inc. |
(2) | Health Care Equipment & Services | L + 650 | 1.00% | 10/21/24 | 1,598 | 1,622 | 1,621 | ||||||||||||||||
| Sequa Corp. |
(1) | Materials | L + 900 | 1.00% | 4/28/22 | 3,468 | 3,507 | 3,515 | ||||||||||||||||
See notes to unaudited condensed financial statements.
15
Table of Contents
Corporate Capital Trust II
Schedule of Investments (continued)
As of December 31, 2017
(in thousands, except share amounts)
|
Portfolio Company(a)(b) |
Footnotes |
Industry |
Rate | Floor | Maturity Date |
No. Shares/ Principal Amount(c) |
Cost(d) | Fair Value | ||||||||||||||||
| SI Organization, Inc. |
(1) | Capital Goods | L + 875 | 1.00% | 5/23/20 | $ | 461 | $ | 456 | $ | 466 | |||||||||||||
| Sparta Systems, Inc. |
(f),(1) | Software & Services | L + 825 | 1.00% | 7/27/25 | 2,438 | 2,402 | 2,381 | ||||||||||||||||
| SRS Distribution, Inc. |
(2) | Capital Goods | L + 875 | 1.00% | 2/24/23 | 2,756 | 2,769 | 2,842 | ||||||||||||||||
| Sungard Public Sector, LLC |
(f),(1) | Software & Services | L + 850 | 1.00% | 1/30/25 | 654 | 648 | 654 | ||||||||||||||||
| Transplace, Inc. |
(2) | Transportation | L + 875 | 1.00% | 10/6/25 | 3,628 | 3,539 | 3,637 | ||||||||||||||||
| Vantage Specialty Chemicals, Inc. |
(1) | Materials | L + 825 | 1.00% | 10/26/25 | 755 | 744 | 744 | ||||||||||||||||
| WireCo WorldGroup, Inc. |
(1) | Capital Goods | L + 900 | 1.00% | 9/30/24 | 1,632 | 1,627 | 1,643 | ||||||||||||||||
|
|
|
|
|
|||||||||||||||||||||
| Total Second Lien Senior Secured Loans |
32,887 | 33,342 | ||||||||||||||||||||||
|
|
|
|
|
|||||||||||||||||||||
| Other Senior Secured Debt—5.2% |
||||||||||||||||||||||||
| Avantor, Inc. |
(i) | Pharmaceuticals, Biotechnology & Life Sciences | 6.00% | 0.00% | 10/1/24 | 776 | 776 | 773 | ||||||||||||||||
| Cleaver-Brooks Inc |
(i) | Capital Goods | 7.88% | 0.00% | 3/1/23 | 1,378 | 1,378 | 1,412 | ||||||||||||||||
| Cornerstone Chemical, Co. |
(i) | Materials | 6.75% | 0.00% | 8/15/24 | 2,682 | 2,687 | 2,679 | ||||||||||||||||
| DJO Finance, LLC |
(i) | Health Care Equipment & Services | 8.13% | 0.00% | 6/15/21 | 452 | 429 | 423 | ||||||||||||||||
| Pattonair Holdings, Ltd. |
(g),(i) | Capital Goods | 9.00% | 0.00% | 11/1/22 | 748 | 748 | 773 | ||||||||||||||||
|
|
|
|
|
|||||||||||||||||||||
| Total Other Senior Secured Debt |
6,018 | 6,060 | ||||||||||||||||||||||
|
|
|
|
|
|||||||||||||||||||||
| Total Senior Debt |
132,694 | 133,091 | ||||||||||||||||||||||
|
|
|
|
|
|||||||||||||||||||||
| Subordinated Debt—20.6% |
||||||||||||||||||||||||
| Allegheny Technologies, Inc. |
(g) | Materials | 7.88% | 0.00% | 8/15/23 | 4,350 | 4,343 | 4,701 | ||||||||||||||||
| Clear Channel International BV (NLD) |
(g),(h),(i) | Media | 8.75% | 0.00% | 12/15/20 | 3,779 | 3,915 | 3,902 | ||||||||||||||||
| ClubCorp Club Operations, Inc. |
(i) | Consumer Services | 8.50% | 0.00% | 9/15/25 | 4,032 | 3,978 | 3,931 | ||||||||||||||||
| Datatel, Inc. |
(i) | Software & Services | 9.00% | 0.00% | 9/30/23 | 102 | 107 | 108 | ||||||||||||||||
| Envision Healthcare Holdings |
(g),(i) | Health Care Equipment & Services | 5.13% | 0.00% | 7/1/22 | 599 | 589 | 581 | ||||||||||||||||
See notes to unaudited condensed financial statements.
16
Table of Contents
Corporate Capital Trust II
Schedule of Investments (continued)
As of December 31, 2017
(in thousands, except share amounts)
|
Portfolio Company(a)(b) |
Footnotes |
Industry |
Rate | Floor | Maturity Date |
No. Shares/ Principal Amount(c) |
Cost(d) | Fair Value | ||||||||||||||||
| Intelsat S.A. (LUX) |
(g),(h) | Media | 7.25% | 0.00% | 10/15/20 | $ | 1,334 | $ | 1,277 | $ | 1,254 | |||||||||||||
| Kenan Advantage Group, Inc. |
(i) | Transportation | 7.88% | 0.00% | 7/31/23 | 2,620 | 2,722 | 2,712 | ||||||||||||||||
| Pactiv, LLC |
Materials | 7.95% | 0.00% | 12/15/25 | 849 | 938 | 962 | |||||||||||||||||
| Pactiv, LLC |
Materials | 8.38% | 0.00% | 4/15/27 | 2,653 | 2,965 | 3,038 | |||||||||||||||||
| Plastipak Holdings, Inc. |
(i) | Materials | 6.25% | 0.00% | 10/15/25 | 163 | 163 | 167 | ||||||||||||||||
| Surgery Center Holdings, Inc. |
(g),(i) | Health Care Equipment & Services | 6.75% | 0.00% | 7/1/25 | 635 | 576 | 600 | ||||||||||||||||
| Tenet Healthcare Corp. |
(g),(i) | Health Care Equipment & Services | 7.00% | 0.00% | 8/1/25 | 31 | 31 | 29 | ||||||||||||||||
| Triumph Group, Inc. |
(g),(i) | Capital Goods | 7.75% | 0.00% | 8/15/25 | 1,360 | 1,360 | 1,443 | ||||||||||||||||
| Vertiv Group Corp. |
(i) | Technology Hardware & Equipment | 9.25% | 0.00% | 10/15/24 | 508 | 551 | 542 | ||||||||||||||||
|
|
|
|
|
|||||||||||||||||||||
| Total Subordinated Debt |
23,515 | 23,970 | ||||||||||||||||||||||
|
|
|
|
|
|||||||||||||||||||||
| Asset Based Finance—2.3% |
||||||||||||||||||||||||
| Montgomery Credit Holdings, LP, Membership Interest |
(f),(g)* | Diversified Financials | 2,689,166 | 2,689 | 2,682 | |||||||||||||||||||
|
|
|
|
|
|||||||||||||||||||||
| Total Asset Based Finance |
2,689 | 2,682 | ||||||||||||||||||||||
|
|
|
|
|
|||||||||||||||||||||
| Equity/Other—3.6% |
||||||||||||||||||||||||
| Misys, Ltd. (CYM), Perpetual Preferred Equity |
(f),(g),(h),(j) | Software & Services | L + 1025 |
1.00% | 2,841 | 2,788 | 2,756 | |||||||||||||||||
| Polyconcept North America, Inc. Membership Units |
(f) | Consumer Durables & Apparel | 624 | 62 | 58 | |||||||||||||||||||
| VICI Properties, Inc., Common Stock |
(g) | Consumer Services | 66,020 | 1,228 | 1,354 | |||||||||||||||||||
|
|
|
|
|
|||||||||||||||||||||
| Total Equity/Other |
4,078 | 4,168 | ||||||||||||||||||||||
|
|
|
|
|
|||||||||||||||||||||
| TOTAL INVESTMENTS—140.7% (k) |
$ | 162,976 | 163,911 | |||||||||||||||||||||
|
|
|
|||||||||||||||||||||||
See notes to unaudited condensed financial statements
17
Table of Contents
Corporate Capital Trust II
Schedule of Investments (continued)
As of December 31, 2017
(in thousands, except share amounts)
|
Portfolio Company(a)(b) |
Footnotes |
Industry |
Rate | Floor | Maturity Date |
No. Shares/ Principal Amount(c) |
Cost(d) | Fair Value | ||||||||||||||||||||||
| OTHER ASSETS IN EXCESS OF LIABILITIES—(40.7%) |
$ | (47,440) | ||||||||||||||||||||||||||||
|
|
|
|||||||||||||||||||||||||||||
| NET ASSETS—100.0% |
$ | 116,471 | ||||||||||||||||||||||||||||
|
|
|
|||||||||||||||||||||||||||||
| Derivative Instrument (Note 4)—0.1% |
|
|||||||||||||||||||||||||||||
|
|
|
|||||||||||||||||||||||||||||
| Foreign currency forward contract |
$ | 96 | ||||||||||||||||||||||||||||
| (a) | Security may be an obligation of one or more entities affiliated with the named company. |
| (b) | Non-controlled/non-affiliated investments as defined by the 1940 Act, unless otherwise indicated. Non-controlled/non-affiliated investments are investments that are neither controlled investments nor affiliated investments. |
| (c) | Denominated in U.S. dollars unless otherwise noted. |
| (d) | Represents amortized cost for debt securities and cost for equity investments translated to U.S. dollars. |
| (e) | Position or portion thereof unsettled as of December 31, 2017. |
| (f) | Investments classified as Level 3 whereby fair value was determined by the Company’s Board of Trustees (see Note 2). |
| (g) | The investment is not a qualifying asset as defined in Section 55(a) under the 1940 Act. A business development company may not acquire any asset other than qualifying assets, unless, at the time the acquisition is made, qualifying assets represent at least 70% of the company’s total assets. As of December 31, 2017, qualifying assets represented 73.2% of the Company’s total assets. |
| (h) | A portfolio company domiciled in a foreign country. The jurisdiction of the security issuer may be a different country than the domicile of the portfolio company. |
| (i) | This security was acquired in a transaction that was exempt from the registration requirements of the Securities Act, pursuant to Rule 144A thereunder. This security may be resold only in transactions that are exempt from the registration requirements of the Securities Act, normally to qualified institutional buyers. |
| (j) | The issue of this security may elect at any time to capitalize distributions. |
| (k) | As of December 31, 2017, the aggregate gross unrealized appreciation for all securities in which there was an excess of value over tax cost was $2,341; the aggregate gross unrealized depreciation for all securities in which there was an excess of tax cost over value was $1,409; the net unrealized appreciation was $932; the aggregate cost of securities for Federal income tax purposes was $163,077. |
| (1) | The interest rate on these investments is subject to a base rate of 3-Month LIBOR, which at December 31, 2017 was 1.69%. The current base rate for each investment may be different from the reference rate on December 31, 2017. |
| (2) | The interest rate on these investments is subject to a base rate of 1-Month LIBOR, which at December 31, 2017 was 1.56%. The current base rate for each investment may be different from the reference rate on December 31, 2017. |
See notes to unaudited condensed financial statements.
18
Table of Contents
Corporate Capital Trust II
Schedule of Investments (continued)
As of December 31, 2017
(in thousands, except share amounts)
| (3) | The interest rate on these investments is subject to a base rate of 6-Month LIBOR, which at December 31, 2017 was 1.84%. The current base rate for each investment may be different from the reference rate on December 31, 2017. |
| (4) | The interest rate on these investments is subject to a base rate of the PRIME rate, which at December 31, 2017 was 4.5%. The current base rate for each investment may be different from the reference rate on December 31, 2017. |
| (5) | The interest rate on these investments is subject to a base rate of 3-Month Canadian Banker Acceptance Rate, which at December 31, 2017 was 1.54%. The current base rate for each investment may be different from the reference rate on December 31, 2017. |
| * | Non-income producing security. |
Abbreviations:
CAD - Canadian Dollar; local currency investment amount is denominated in Canadian Dollar. C$1 / U.S. $0.80 as of December 31, 2017.
CAN - Canada
CDOR = Canadian Banker Acceptance Rate
LUX - Luxembourg
L = LIBOR - London Interbank Offered Rate, typically 3-Month
P = PRIME - U.S. Prime Rate
See notes to unaudited condensed financial statements.
19
Table of Contents
Notes to Unaudited Condensed Financial Statements
(in thousands, except share and per share amounts)
Note 1. Principal Business and Organization
Corporate Capital Trust II (the “Company”) was formed as a Delaware statutory trust on August 12, 2014. The Company is a non-diversified closed-end management investment company and has elected to be regulated as a business development company under the Investment Company Act of 1940 (the “1940 Act”). The Company’s investment objective is to provide its shareholders with current income and, to a lesser extent, long-term capital appreciation, by investing primarily in the debt of privately owned U.S. companies with a focus on originated transactions sourced through the networks of its advisors. The Company has elected to be taxed as a regulated investment company (“RIC”) under the Internal Revenue Code of 1986, as amended (the “Code”) and operate in a manner so as to qualify for the tax treatment applicable to RICs.
Since inception and through April 8, 2018, the Company was externally managed by CNL Fund Advisors II, LLC, as investment adviser (“CNL”), and KKR Credit Advisors (US) LLC, as investment sub-adviser (“KKR”, and together with CNL, the “Former Advisors”). On April 9, 2018, the Company entered into a new investment advisory agreement with FS/KKR Advisor, LLC (the “Joint Advisor”), a newly-formed entity that is jointly operated by KKR and an affiliate of Franklin Square Holdings, L.P., which does business as FS Investments, pursuant to which the Joint Advisor serves as the Company’s investment adviser. See Note 6. “Related Party Transactions” for additional information.
Since inception and through April 8, 2018, the Former Advisors were, and effective April 9, 2018, the Joint Advisor is, responsible for sourcing potential investments, conducting due diligence on prospective investments, analyzing investment opportunities, structuring investments, determining the securities and other assets that the Company will purchase, retain or sell and monitoring the Company’s portfolio on an ongoing basis, as well as providing the administrative services necessary for the Company to operate. Both the Former Advisors and the Joint Advisor (collectively, the “Advisors”) are registered as investment advisers with the Securities and Exchange Commission (“SEC”).
On September 29, 2014, the Company filed a registration statement on Form N-2 (the “Registration Statement”) with the SEC to permit the Company to sell up to $2.6 billion of shares of common stock (275 million shares) on a continuous basis (the “Offering”). The Registration Statement was declared effective on October 9, 2015. In January 2018, the Company suspended its Offering to new investors and on April 30, 2018, terminated the Offering. See Note 9. “Share Transactions” for additional information regarding the Offering.
Note 2. Significant Accounting Policies
Basis of Presentation – The accompanying unaudited condensed financial statements of the Company are prepared in accordance with the instructions to Form 10-Q and accounting principles generally accepted in the United States of America (“GAAP”). The Company is an investment company following accounting and reporting guidance in Financial Accounting Standards Board (“FASB”) Accounting Standards Codification (“ASC”) Topic 946, Financial Services—Investment Companies (“ASC Topic 946”). The unaudited condensed financial statements reflect all normal recurring adjustments, which are, in the opinion of management, necessary for the fair presentation of the Company’s results for the interim periods presented. The results of operations for interim periods are not indicative of results to be expected for the full year.
Certain financial information that is normally included in annual financial statements, including certain financial statement footnotes, prepared in accordance with GAAP, is not required for interim reporting purposes and has
20
Table of Contents
Corporate Capital Trust II
Notes to Unaudited Condensed Financial Statements (continued)
(in thousands, except share and per share amounts)
Note 2. Significant Accounting Policies (continued)
been condensed or omitted herein. These unaudited condensed financial statements should be read in conjunction with the Company’s financial statements and notes related thereto included in the Company’s Annual Report on Form 10-K for the year ended December 31, 2017, which was filed with the SEC on March 2, 2018.
Use of Estimates – The preparation of the unaudited condensed financial statements in conformity with GAAP requires management to make estimates and assumptions that affect (i) the reported amounts of assets and liabilities at the date of the unaudited condensed financial statements, (ii) the reported amounts of income and expenses during the reporting periods presented and (iii) disclosure of contingent assets and liabilities at the date of the unaudited condensed financial statements. Actual results could differ from those estimates.
Cash – Cash consists of demand deposits.
Valuation of Investments – The Company measures the value of its investments in accordance with ASC Topic 820, Fair Value Measurements and Disclosure (“ASC Topic 820”), issued by the FASB. Fair value is the price that would be received to sell an asset or paid to transfer a liability in an orderly transaction between market participants at the measurement date. Market participants are defined as buyers and sellers in the principal or most advantageous market (which may be a hypothetical market) that are independent, knowledgeable, and willing and able to transact. In accordance with ASC Topic 820, the Company considers its principal market to be the market that has the greatest volume and level of activity.
ASC Topic 820 defines hierarchical levels directly related to the amount of subjectivity associated with the inputs used to determine fair values of assets and liabilities. The hierarchical levels and types of inputs used to measure fair value for each level are described as follows:
Level 1 – Quoted prices are available in active markets for identical investments as of the reporting date. Publicly listed equities and debt securities, publicly listed derivatives, money market/short-term investment funds and foreign currency are generally included in Level 1. The Company does not adjust the quoted price for these investments.
Level 2 – Valuation inputs are other than quoted prices in active markets, which are either directly or indirectly observable as of the reporting date, and fair value is determined through the use of models or other valuation methodologies. In certain cases, debt and equity securities are valued on the basis of prices from orderly transactions for similar investments in active markets between market participants and provided by reputable dealers or independent pricing services. In determining the value of a particular investment, independent pricing services may use certain information with respect to transactions in such investments, quotations from dealers, pricing matrices, market transactions in comparable investments, and various relationships between investments. Investments generally included in this category are corporate bonds and loans, convertible debt indexed to publicly listed securities, foreign currency forward contracts, cross currency and certain over-the-counter derivatives.
Level 3 – Valuation inputs are unobservable for the investment and include situations where there is little, if any, market activity for the investment. The inputs into the determination of fair value require significant judgment or estimation. Investments generally included in this category are illiquid corporate bonds and loans, unlisted common and preferred stock investments, and equity options that lack observable market pricing.
21
Table of Contents
Corporate Capital Trust II
Notes to Unaudited Condensed Financial Statements (continued)
(in thousands, except share and per share amounts)
Note 2. Significant Accounting Policies (continued)
In certain cases, the inputs used to measure fair value may fall within different levels of the fair value hierarchy. In such cases, an investment’s level within the fair value hierarchy is based on the lowest level of input that is significant to the fair value measurement. Depending on the relative liquidity in the markets for certain investments, the Company may transfer assets to Level 3 if it determines that observable quoted prices, obtained directly or indirectly, are not available or reliable. Investments are transferred at fair value as of the beginning of the month in which they are transferred. The Company’s assessment of the significance of a particular input to the fair value measurement requires judgment, and the consideration of factors specific to the investment.
Investments for which market quotations are readily available are valued using market quotations, which are generally obtained from independent pricing services, broker-dealers or market makers. With respect to the Company’s portfolio investments for which market quotations are not readily available, the Company’s board of trustees is responsible for determining in good faith the fair value of the Company’s portfolio investments in accordance with the valuation policy and procedures approved by the board of trustees, based on, among other things, the input of the Joint Advisor and the Company’s management, its audit committee, and independent third-party valuation firms.
The Company and the board of trustees conduct their fair value determination process when a decision regarding the fair value of the portfolio investments is required. A determination of fair value involves subjective judgments and estimates. Due to the inherent uncertainty of determining the fair value of portfolio investments that do not have a readily available market value, the fair value of the investments may differ significantly from the values that would have been determined had a readily available market value existed for such investments, and the differences could be material. Further, such investments are generally less liquid than publicly traded securities. If the Company were required to liquidate a portfolio investment that does not have a readily available market value in a forced or liquidation sale, the Company could realize significantly less than the value recorded by the Company.
The Company and the Joint Advisor undertake a multi-step valuation process for determining the fair value of the Company’s investments, the market prices of which are not readily available, as described below:
| • | Each investment is valued by the Company’s independent third-party valuation firm, which provides a valuation range for each investment to the Joint Advisor. |
| • | Valuation recommendations, which include selection of a specific value within the valuation range, are formulated and documented by personnel of the Joint Advisor. Valuation recommendations, along with supporting documentation, for each investment are provided to the Company. |
| • | Following Company management review, valuation recommendations and supporting documentation are provided to the Company’s audit committee for further review. |
| • | As a final step, the Company’s board of trustees discusses the investment valuation recommendations with the Joint Advisor, the Company’s independent third-party valuation firm, where applicable, and the Company’s management, and based on those discussions and the related review process conducted by the Company’s audit committee, determines the fair value of the investments in good faith. |
22
Table of Contents
Corporate Capital Trust II
Notes to Unaudited Condensed Financial Statements (continued)
(in thousands, except share and per share amounts)
Note 2. Significant Accounting Policies (continued)
The valuation techniques used by the Company for the assets and liabilities that are classified as Level 3 in the fair value hierarchy are described below.
Senior Debt and Subordinated Debt: Senior debt and subordinated debt investments are initially valued at transaction price and are subsequently valued using (i) market data for similar instruments (e.g., recent transactions or indicative broker quotes), (ii) comparisons to benchmark derivative indices or (iii) valuation models. Valuation models are generally based on yield analysis and discounted cash flow techniques, where the key inputs are based on relative value analyses and the assignment of risk-adjusted discounted rates, based on the analysis of similar instruments from similar issuers. In addition, an illiquidity discount is applied where appropriate.
Equity/Other Investments: Equity/other investments are initially valued at transaction price and are subsequently valued using valuation models in the absence of readily observable market prices. Valuation models are generally based on (i) market and income (discounted cash flow) approaches, in which various internal and external factors are considered, and (ii) earnings before interest, taxes, depreciation and amortization (“EBITDA”) valuation multiples analysis. Factors include key financial inputs and recent public and private transactions for comparable investments. Key inputs used for the discounted cash flow approach include the weighted average cost of capital and assumed inputs used to calculate terminal values, such as EBITDA exit multiples. The fair value for a particular investment will generally be within the value range conclusions derived by the two approaches. Upon completion of the valuations conducted, an illiquidity discount is applied where appropriate.
The Company utilizes several valuation techniques that use unobservable pricing inputs and assumptions in determining the fair value of its Level 3 investments. The valuation techniques, as well as key unobservable inputs that have a significant impact on the Company’s Level 3 valuations, are described in Note 5. “Fair Value of Financial Instruments.” The unobservable pricing inputs and assumptions may differ by asset and in the application of the Company’s valuation methodologies. The reported fair value estimates could vary materially if the Company had chosen to incorporate different unobservable pricing inputs and other assumptions.
Security Transactions, Realized/Unrealized Gains or Losses, and Income Recognition – Investment transactions are recorded on the trade date. The Company measures realized gains or losses from the sale of investments using the specific identification method. Realized gains or losses are measured by the difference between the net proceeds from the sale and the amortized cost basis of the investment without regard to unrealized gains or losses previously recognized, and include investments charged off during the period, net of recoveries. Unrealized gains or losses primarily reflect the change in investment values, including the reversal of previously recorded unrealized gains or losses when gains or losses are realized. The amortized cost basis of investments includes (i) the original cost and (ii) adjustments for the accretion/amortization of market discounts and premiums and original issue discount and loan origination fees. The Company reports changes in fair value of investments as a component of net change in unrealized appreciation (depreciation) on investments in the unaudited condensed statements of operations.
Interest Income – Interest income is recorded on an accrual basis and includes amortization of premiums to par value and accretion of discounts to par value. Discounts and premiums to par value on securities purchased are accreted/amortized into interest income over the life of the respective security using the effective interest method. Generally, loan origination, closing, commitment and other fees received by the Company directly or indirectly from borrowers in connection with the closing of investments are accreted over the contractual life of
23
Table of Contents
Corporate Capital Trust II
Notes to Unaudited Condensed Financial Statements (continued)
(in thousands, except share and per share amounts)
Note 2. Significant Accounting Policies (continued)
the debt investment as interest income based on the effective interest method. Upon prepayment of a debt investment, any prepayment penalties and unamortized loan fees and discounts are recorded as interest income.
Certain of the Company’s investments in debt securities contain a contractual payment-in-kind (“PIK”) interest provision. The PIK provisions generally feature the obligation or the option at each interest payment date of making interest payments in (i) cash, (ii) additional debt securities or (iii) a combination of cash and additional debt securities. PIK interest, computed at the contractual rate specified in the investment’s credit agreement, is accrued as interest income and recorded as interest receivable up to the interest payment date. On the interest payment dates, the Company will capitalize the accrued interest receivable attributable to PIK as additional principal due from the borrower. When additional PIK securities are received on the interest payment date, they typically have the same terms, including maturity dates and interest rates as the original securities issued. PIK interest generally becomes due at maturity of the investment or upon the investment being called by the issuer.
If the portfolio company valuation indicates the value of the PIK investment is not sufficient to cover the contractual PIK interest, the Company will not accrue additional PIK interest income and will record an allowance for any accrued PIK interest receivable as a reduction of interest income in the period the Company determines it is not collectible.
Debt securities are placed on nonaccrual status when principal or interest payments are at least 90 days past due or when there is reasonable doubt that principal or interest will be collected. Generally, accrued interest is reversed against interest income when a debt security is placed on nonaccrual status. Interest payments received on debt securities on nonaccrual status may be recognized as interest income or applied to principal based on management’s judgment. Debt securities on nonaccrual status are restored to accrual status when past due principal and interest are paid and, in management’s judgment, such investments are likely to remain current on interest payment obligations. The Company may make exceptions to this treatment if the debt security has sufficient collateral value and is in the process of collection.
Fee Income – In its role as the Company’s investment adviser, the Joint Advisor or its affiliates may provide financial advisory services to portfolio companies and in return may receive fees for capital structuring services. The Joint Advisor is obligated to remit to the Company any earned capital structuring fees based on the pro-rata portion of the Company’s investment in co-investment transactions and originated investments. These fees are generally nonrecurring and are recognized as fee income by the Company upon the investment closing date. The Company may also receive fees for commitments, amendments and other services related to portfolio companies. Such fees are recognized as fee income when earned or the services are rendered.
Dividend Income – Dividend income on preferred equity securities is recorded as dividend income on an accrual basis to the extent such amounts are payable by the portfolio company and are expected to be collected. Dividend income on common equity securities is recorded on the record date for private portfolio companies or on the ex-dividend date for publicly traded portfolio companies. Each distribution received from a limited liability company (“LLC”) and limited partnership (“LP”) investments are evaluated to determine if the distribution should be recorded as dividend income or a return of capital. Generally, the Company will not record distributions from equity investments in LLCs and LPs as dividend income unless there are sufficient accumulated earnings in the LLC and LP prior to the distribution. Distributions that are classified as a return of capital are recorded as a reduction in the cost basis of the investment.
24
Table of Contents
Corporate Capital Trust II
Notes to Unaudited Condensed Financial Statements (continued)
(in thousands, except share and per share amounts)
Note 2. Significant Accounting Policies (continued)
Derivative Instruments – The Company’s derivative instruments consist of foreign currency forward contracts. The Company recognizes all derivative instruments as assets or liabilities at fair value in its unaudited condensed financial statements. Derivative contracts entered into by the Company are not designated as hedging instruments, and as a result, the Company presents changes in fair value through net change in unrealized appreciation (depreciation) on derivative instruments in the unaudited condensed statements of operations. Realized gains and losses that occur upon the cash settlement of the derivative instruments are included in net realized gains (losses) on derivative instruments in the unaudited condensed statements of operations.
Paid In Capital – The Company records the proceeds from the sale of its common stock on a net basis to (i) capital stock and (ii) paid-in capital in excess of par value, excluding up-front selling commissions and dealer manager fees.
Deferred Financing Costs – Financing costs, including upfront fees, commitment fees and legal fees related to the Company’s credit facility are deferred and amortized over the life of the related financing instrument using the straight-line method. The amortization of deferred financing costs is included in interest expense in the unaudited condensed statements of operations.
Foreign Currency Translation, Transactions and Gains/Losses – Foreign currency amounts are translated into U.S. dollars on the following basis: (i) at the exchange rate on the last business day of the reporting period for the fair value of investment securities, other assets and liabilities; and (ii) at the prevailing exchange rate on the respective recording dates for the purchase and sale of investment securities, income, expenses, gains and losses.
Net assets and fair values are presented based on the applicable foreign exchange rates described above and the Company does not isolate that portion of the results of operations resulting from changes in foreign exchange rates on investments from the fluctuations arising from changes in fair values of investments held; therefore, fluctuations related to foreign exchange rate conversions are included with the net realized gains (losses) and unrealized appreciation (depreciation) on investments.
Net realized gains or losses on foreign currency transactions arise from sales of foreign currency, and the difference between the amounts of dividends, interest, and foreign withholding taxes recorded by the Company and the U.S. dollar equivalent of the amounts actually received or paid by the Company.
Unrealized appreciation (depreciation) from foreign currency translation for other receivables or payables is presented as net change in unrealized appreciation (depreciation) in foreign currency translation in the unaudited condensed statements of operations.
Management Fees – The Company incurs a base management fee (recorded as investment advisory fees) and performance-based incentive fees, including (i) a subordinated incentive fee on income and (ii) an incentive fee on capital gains, due to the Joint Advisor pursuant to an investment advisory agreement described in Note 6. “Related Party Transactions.” The two components of performance-based incentive fees are combined and expensed in the unaudited condensed statements of operations and accrued as accrued performance-based incentive fees in the unaudited condensed statements of assets and liabilities. Pursuant to the terms of the investment advisory agreement, the incentive fee on capital gains is determined and payable in arrears as of the end of each calendar year (or upon termination of the investment advisory agreement) based on the Company’s realized capital gains on a cumulative basis from inception, net of all realized capital losses on a cumulative basis
25
Table of Contents
Corporate Capital Trust II
Notes to Unaudited Condensed Financial Statements (continued)
(in thousands, except share and per share amounts)
Note 2. Significant Accounting Policies (continued)
and unrealized depreciation at year end, less the aggregate amount of any previously paid capital gains incentive fees. Although the terms of the investment advisory agreement do not provide for the inclusion of unrealized gains in the calculation of the incentive fee on capital gains, pursuant to relevant authoritative guidance for investment companies, the Company includes unrealized gains in the calculation of the incentive fee on capital gains expense and related accrued incentive fee on capital gains. This accrual reflects the incentive fees that would be payable to the Joint Advisor if the Company’s entire portfolio was liquidated at its fair value as of the balance sheet date even though the Joint Advisor is not entitled to an incentive fee with respect to unrealized gains unless and until such gains are actually realized.
Organization and Offering Expenses – Organization expenses were expensed on the Company’s statements of operations. Offering expenses were capitalized on the Company’s statements of assets and liabilities as deferred offering expenses and expensed to the Company’s statements of operations over a 12-month period, however, the deferral period did not exceed 12 months from the date the Former Advisors incurred the offering expenses.
Earnings per Share – Earnings per share is calculated based upon the weighted average number of shares of common stock outstanding during the reporting period.
Distributions – Weekly or monthly distributions are generally declared from time to time by the Company’s board of trustees and recognized as a liability on the applicable record date. Distributions are generally paid monthly. The Company has adopted a distribution reinvestment plan that provides for reinvestment of distributions on behalf of shareholders. Shareholders who have elected to participate in the distribution reinvestment plan will have their cash distribution automatically reinvested in additional shares of common stock at a price per share equivalent to the then current public offering price, net of up-front selling commissions and dealer manager fees.
Federal Income Taxes – The Company has elected to be treated for federal income tax purposes, and intends to maintain its qualification, as a RIC under Subchapter M of the Code. Generally, a RIC is not subject to federal income taxes on distributed income and gains if it distributes at least 90% of its “Investment Company Taxable Income,” as defined in the Code. The Company intends to distribute sufficient amounts to maintain RIC status and minimize income taxes on undistributed capital gains and investment company taxable income.
The Company is generally subject to nondeductible federal excise taxes if it does not distribute to its shareholders an amount at least equal to the sum of (i) 98% of its net ordinary income for the calendar year, (ii) 98.2% of its capital gains in excess of capital losses for the one-year period generally ending on October 31 of the calendar year and (iii) any ordinary income and net capital gains for preceding years that were not distributed during such years and on which the Company paid no federal income tax. The Company may pay a 4% nondeductible federal excise tax on under-distribution of capital gains and net ordinary income.
The Company recognizes in its unaudited condensed financial statements the effect of a tax position when it is deemed more likely than not, based on the technical merits, that the position will be sustained upon examination. Tax benefits of positions not deemed to meet the more-likely-than-not threshold are recorded as tax expenses in the current year. The Company did not have any uncertain tax positions that met the recognition or measurement criteria of ASC 740-10-25, Income Taxes—Overall—Recognition, nor did it have any unrecognized tax benefits for the periods presented herein. Although the Company files federal and state tax returns, its major tax jurisdiction is federal.
26
Table of Contents
Corporate Capital Trust II
Notes to Unaudited Condensed Financial Statements (continued)
(in thousands, except share and per share amounts)
Note 2. Significant Accounting Policies (continued)
Permanent book and tax basis differences are reclassified among the Company’s capital accounts, as appropriate on an annual basis. Additionally, the tax character and amount of distributions is determined in accordance with the Code which differs from GAAP.
Reclassifications – As of September 30, 2018, the Company has revised its investment categories to reclassify investments that were previously categorized as Equity/Other to two new categories of Asset Based Finance and Equity/Other. This revision better distinguishes between corporate equity investments and investments that are primarily collateralized by hard assets, financial assets or investments in specialty finance platforms that provide exposure to hard assets or financial assets. The Company’s Asset Based Finance investments may be in the form of debt, equity, derivatives or private placement funds. The Company has adjusted the presentation of its asset categories for all periods presented to conform to the current period presentation.
The following table provides additional details of the fair value of investments reclassified by category as of December 31, 2017:
| Asset Category | As Filed December 31, 2017 |
Adjustments | Adjusted December 31, 2017 |
|||||||
|
|
|
|
|
|
||||||
| Asset Based Finance |
$ — | $ | 2,682 | $ | 2,682 | |||||
| Equity/Other |
6,850 | (2,682 | ) | 4,168 | ||||||
|
|
|
|
|
|
|
|||||
| $ 6,850 | $ | — | $ | 6,850 | ||||||
|
|
|
|
|
|
|
|||||
Recent Accounting Pronouncements – Effective January 1, 2018, the Company adopted ASC Topic 606, Revenue from Contracts with Customers, or ASC Topic 606, using the cumulative effect method applied to in-scope contracts with customers that have not been completed as of the date of adoption. The Company did not identify any in-scope contracts that had not been completed as of the date of adoption and, as a result, did not recognize a cumulative effect on stockholders’ equity in connection with the adoption of the new revenue recognition guidance.
In August 2018, the FASB issued ASU No. 2018-13, Fair Value Measurement (Topic 820)—Disclosure Framework—Changes to the Disclosure Requirements for Fair Value Measurement, which is designed to improve the effectiveness of disclosures by removing, modifying and adding disclosures related to fair value measurements. ASU No. 2018-13 is effective for fiscal years beginning after December 15, 2019, including interim periods within those fiscal years; the ASU allows for early adoption in any interim period after issuance of the update. The Company is currently assessing the impact this ASU will have on its consolidated financial statements.
Note 3. Investments
The Company is engaged in a strategy to invest primarily in the debt of privately owned and thinly traded U.S. companies. The primary investment concentrations include (i) senior debt securities and (ii) subordinated debt securities. The Company’s investments may, in some cases, be accompanied by warrants, options or other forms of equity participation. The Company may separately purchase common or preferred equity interests, including non-controlling equity investments. Additionally, the Company may invest in convertible securities, derivatives and private investment funds. The Company may also co-invest with third parties through partnerships, joint ventures or other entities, thereby acquiring jointly controlled or non-controlling interests in certain investments
27
Table of Contents
Corporate Capital Trust II
Notes to Unaudited Condensed Financial Statements (continued)
(in thousands, except share and per share amounts)
Note 3. Investments (continued)
in conjunction with participation by one or more third parties in such investment. The fair value of the Company’s investments will generally fluctuate with, among other things, changes in prevailing interest rates, the general supply of, and demand for, debt capital among private and public companies, general domestic and global economic conditions, the condition of certain financial markets, developments or trends in any particular industry and changes in the financial condition and credit quality of each security’s issuer.
As of September 30, 2018 and December 31, 2017, the Company’s investment portfolio consisted of the following:
| September 30, 2018 | ||||||||||||||||
| Asset Category |
Amortized Cost(1) |
Fair Value | Percentage of Investment Portfolio |
Percentage of Net Assets |
||||||||||||
| Senior debt |
||||||||||||||||
| Senior secured loans—first lien |
$ | 93,233 | $ | 92,646 | 49.4% | 80.2% | ||||||||||
| Senior secured loans—second lien |
34,437 | 34,402 | 18.4% | 29.8% | ||||||||||||
| Senior secured bonds |
12,004 | 12,207 | 6.5% | 10.5% | ||||||||||||
|
|
|
|
|
|
|
|
|
|
|
|||||||
| Total senior debt |
$ | 139,674 | $ | 139,255 | 74.3% | 120.5% | ||||||||||
| Subordinated debt |
37,817 | 38,151 | 20.3% | 33.0% | ||||||||||||
| Asset based finance |
5,985 | 5,852 | 3.1% | 5.1% | ||||||||||||
| Equity/Other |
4,078 | 4,224 | 2.3% | 3.7% | ||||||||||||
|
|
|
|
|
|
|
|
|
|
|
|||||||
| Total |
$ | 187,554 | $ | 187,482 | 100.0% | 162.3% | ||||||||||
|
|
|
|
|
|
|
|
|
|
|
|||||||
| December 31, 2017 | ||||||||||||||||
| Asset Category |
Amortized Cost(1) |
Fair Value | Percentage of Investment Portfolio |
Percentage of Net Assets |
||||||||||||
| Senior debt |
||||||||||||||||
| Senior secured loans—first lien |
$ | 93,789 | $ | 93,689 | 57.2% | 80.4% | ||||||||||
| Senior secured loans—second lien |
32,887 | 33,342 | 20.3% | 28.6% | ||||||||||||
| Senior secured bonds |
6,018 | 6,060 | 3.7% | 5.2% | ||||||||||||
|
|
|
|
|
|
|
|
|
|
|
|||||||
| Total senior debt |
$ | 132,694 | $ | 133,091 | 81.2% | 114.2% | ||||||||||
| Subordinated debt |
23,515 | 23,970 | 14.6% | 20.6% | ||||||||||||
| Asset based finance |
2,689 | 2,682 | 1.6% | 2.3% | ||||||||||||
| Equity/Other |
4,078 | 4,168 | 2.6% | 3.6% | ||||||||||||
|
|
|
|
|
|
|
|
|
|
|
|||||||
| Total |
$ | 162,976 | $ | 163,911 | 100.0% | 140.7% | ||||||||||
|
|
|
|
|
|
|
|
|
|
|
|||||||
| (1) | Represents amortized costs for debt securities and costs for equity investments translated to U.S. dollars. |
As of September 30, 2018 and December 31, 2017, none of the Company’s debt investments were on non-accrual status.
28
Table of Contents
Corporate Capital Trust II
Notes to Unaudited Condensed Financial Statements (continued)
(in thousands, except share and per share amounts)
Note 3. Investments (continued)
The industry composition and geographic dispersion of the Company’s investment portfolio as a percentage of total fair value of the Company’s investments as of September 30, 2018 and December 31, 2017 were as follows:
|
Industry Composition |
September 30, 2018 | December 31, 2017 | ||||||
| Automobiles & Components |
0.5% | —% | ||||||
| Capital Goods |
22.0% | 14.9% | ||||||
| Commercial & Professional Services |
3.9% | 5.9% | ||||||
| Consumer Durables & Apparel |
1.1% | 0.6% | ||||||
| Consumer Services |
7.0% | 5.6% | ||||||
| Diversified Financials |
0.8% | 1.6% | ||||||
| Energy |
1.6% | —% | ||||||
| Food & Staples Retailing |
0.4% | 0.7% | ||||||
| Food, Beverage & Tobacco |
2.6% | 0.1% | ||||||
| Health Care Equipment & Services |
7.8% | 5.7% | ||||||
| Insurance |
2.1% | 0.8% | ||||||
| Materials |
11.2% | 14.8% | ||||||
| Media |
5.9% | 4.7% | ||||||
| Pharmaceuticals, Biotechnology & Life Sciences |
0.8% | 1.0% | ||||||
| Retailing |
8.0% | 12.7% | ||||||
| Semiconductors & Semiconductor Equipment |
1.8% | 2.0% | ||||||
| Software & Services |
17.8% | 21.9% | ||||||
| Technology Hardware & Equipment |
0.4% | 0.8% | ||||||
| Telecommunication Services |
0.3% | —% | ||||||
| Transportation |
4.0% | 6.2% | ||||||
|
|
|
|
|
|||||
| Total |
100.0% | 100.0% | ||||||
|
|
|
|
|
|||||
|
Geographic Dispersion(1) |
September 30, 2018 | December 31, 2017 | ||||||
| United States |
85.1% | 87.6% | ||||||
| Canada |
4.0% | 4.5% | ||||||
| United Kingdom |
3.8% | 1.7% | ||||||
| Netherlands |
3.9% | 2.4% | ||||||
| France |
0.8% | —% | ||||||
| Ireland |
2.3% | —% | ||||||
| Barbados |
0.1% | —% | ||||||
| Luxembourg |
—% | 2.1% | ||||||
| Cayman Islands |
—% | 1.7% | ||||||
|
|
|
|
|
|||||
| Total |
100.0% | 100.0% | ||||||
|
|
|
|
|
|||||
| (1) | The geographic dispersion is determined by the portfolio company’s country of domicile or the jurisdiction of the security’s issuer. |
29
Table of Contents
Corporate Capital Trust II
Notes to Unaudited Condensed Financial Statements (continued)
(in thousands, except share and per share amounts)
Note 3. Investments (continued)
All investments held at September 30, 2018 were denominated in U.S. dollars except for six investments, which were denominated in Canadian dollars, Euros and British pound sterling and represented 4.1% of the investment portfolio. All investments held at December 31, 2017 were denominated in U.S. dollars except for one investment, which was denominated in Canadian dollars and represented 2.7% of the investment portfolio.
Note 4. Derivative Instruments
The following is a summary of the fair value and location of the Company’s derivative instruments in the unaudited condensed statements of assets and liabilities held as of September 30, 2018 and December 31, 2017:
| Fair Value | ||||||||||
|
Derivative Instrument |
Statement Location |
September 30, 2018 | December 31, 2017 | |||||||
| Foreign currency forward contracts |
Unrealized appreciation on foreign currency forward contracts |
$ | 208 | $ | 96 | |||||
|
|
|
|
|
|||||||
| Total |
$ | 208 | $ | 96 | ||||||
|
|
|
|
|
|||||||
Net unrealized gains and losses on derivative instruments recorded by the Company for the three and nine months ended September 30, 2018 and 2017 are in the following locations in the unaudited condensed statements of operations:
| Net Unrealized Gains (Losses) | ||||||||||||||||||
| Three Months Ended September 30, |
Nine Months Ended September 30, |
|||||||||||||||||
|
Derivative Instrument |
Statement Location |
2018 | 2017 | 2018 | 2017 | |||||||||||||
| Foreign currency forward contracts |
Net change in unrealized appreciation on foreign currency forward contracts | $ | (71) | $ | 77 | $ | 112 | $ | 77 | |||||||||
|
|
|
|
|
|
|
|
|
|||||||||||
| Total |
$ | (71) | $ | 77 | $ | 112 | $ | 77 | ||||||||||
|
|
|
|
|
|
|
|
|
|||||||||||
Foreign Currency Forward Contracts
The Company may enter into foreign currency forward contracts from time to time to facilitate settlement of purchases and sales of investments denominated in foreign currencies and to economically hedge the impact that an adverse change in foreign exchange rates would have on the value of the Company’s investments denominated in foreign currencies. A foreign currency forward contract is a commitment to purchase or sell a foreign currency at a future date at a negotiated forward rate. These contracts are marked-to-market by recognizing the difference between the contract forward exchange rate and the forward market exchange rate on the last day of the period presented as unrealized appreciation or depreciation. Realized gains or losses are recognized when forward contracts are settled. Risks arise as a result of the potential inability of the counterparties to meet the terms of their contracts. The Company attempts to limit counterparty risk by only dealing with well-known counterparties.
30
Table of Contents
Corporate Capital Trust II
Notes to Unaudited Condensed Financial Statements (continued)
(in thousands, except share and per share amounts)
Note 4. Derivative Instruments (continued)
The Company was a party to two foreign currency forward contracts during the period which related to economic hedging of the Company’s foreign currency denominated debt investments. As of September 30, 2018 and December 31, 2017, the Company’s open foreign currency forward contracts were as follows:
| Foreign Currency |
Settlement Date |
Counterparty |
Notional Amount |
US $ Value at Settlement Date |
US $ Value at September 30, 2018 |
Unrealized Appreciation |
||||||||||||
| CAD |
October 10, 2019 | JP Morgan Chase Bank |
C$ 5,690 Sold |
$ | 4,642 | $ | 4,435 | $ | 207 | |||||||||
| EUR |
July 17, 2023 | JP Morgan Chase Bank | € 107 Sold | 144 | 143 | 1 | ||||||||||||
|
|
|
|
|
|
|
|||||||||||||
| Total |
$ | 4,786 | $ | 4,578 | $ | 208 | ||||||||||||
|
|
|
|
|
|
|
|||||||||||||
| Foreign Currency |
Settlement Date |
Counterparty |
Notional Amount |
US $ Value at Settlement Date |
US $ Value at December 31, 2017 |
Unrealized Appreciation |
||||||||||||
| CAD |
October 10, 2019 | JP Morgan Chase Bank |
C$ 5,690 Sold |
$ | 4,642 | $ | 4,546 | $ | 96 | |||||||||
|
|
|
|
|
|
|
|||||||||||||
| Total |
$ | 4,642 | $ | 4,546 | $ | 96 | ||||||||||||
|
|
|
|
|
|
|
|||||||||||||
Note 5. Fair Value of Financial Instruments
The Company’s investments were categorized in the fair value hierarchy described in Note 2. “Significant Accounting Policies,” as follows as of September 30, 2018 and December 31, 2017:
| September 30, 2018 | ||||||||||||||||
| Description |
Level 1 | Level 2 | Level 3 | Total | ||||||||||||
| Senior debt |
$ | — | $ | 82,056 | $ | 57,199 | $ | 139,255 | ||||||||
| Subordinated debt |
— | 38,151 | — | 38,151 | ||||||||||||
| Asset based finance |
— | — | 5,852 | 5,852 | ||||||||||||
| Equity/Other |
1,427 | — | 2,797 | 4,224 | ||||||||||||
|
|
|
|
|
|
|
|
|
|
|
|
| |||||
| Total investments |
$ | 1,427 | $ | 120,207 | $ | 65,848 | $ | 187,482 | ||||||||
|
|
|
|
|
|
|
|
|
|
|
|
| |||||
| December 31, 2017 | ||||||||||||||||
| Description |
Level 1 | Level 2 | Level 3 | Total | ||||||||||||
| Senior debt |
$ | — | $ | 101,066 | $ | 32,025 | $ | 133,091 | ||||||||
| Subordinated debt |
— | 23,970 | — | 23,970 | ||||||||||||
| Asset based finance |
— | — | 2,682 | 2,682 | ||||||||||||
| Equity/Other |
1,354 | — | 2,814 | 4,168 | ||||||||||||
|
|
|
|
|
|
|
|
|
|
|
|
| |||||
| Total investments |
$ | 1,354 | $ | 125,036 | $ | 37,521 | $ | 163,911 | ||||||||
|
|
|
|
|
|
|
|
|
|
|
|
| |||||
In addition, the Company had foreign currency forward contracts, as described in Note 4. “Derivative Instruments,” which were categorized as Level 2 in the fair value hierarchy as of September 30, 2018 and December 31, 2017.
31
Table of Contents
Corporate Capital Trust II
Notes to Unaudited Condensed Financial Statements (continued)
(in thousands, except share and per share amounts)
Note 5. Fair Value of Financial Instruments (continued)
There were no transfers between Level 1 and Level 2 during the nine months ended September 30, 2018 and the year ended December 31, 2017. The carrying value of cash is classified as Level 1 with respect to the fair value hierarchy. At September 30, 2018, the Company held 54 distinct investment positions classified as Level 3, representing an aggregate fair value of $65,848 or 35.1% of the total investment portfolio. At December 31, 2017, the Company held 21 distinct investment positions classified as Level 3, representing an aggregate fair value of $37,521 or 22.9% of the total investment portfolio. The ranges of unobservable inputs used in the fair value measurement of the Company’s Level 3 investments as of September 30, 2018 and December 31, 2017 were as follows:
|
As of September 30, 2018 |
||||||||||||||||||||
| Asset Group |
Fair Value(1) | Valuation Techniques | Unobservable Inputs | Range (Weighted Average)(2) |
Impact to Valuation from an Increase in Input(3) |
|||||||||||||||
| Senior Debt |
$ 53,103 | Discounted Cash Flow | Discount Rate | 7.84% - 13.71% (10.35%) | Decrease | |||||||||||||||
| 4,096 | Cost | Cost | N/A | N/A | ||||||||||||||||
| Asset Based Finance |
1,391 | Discounted Cash Flow | Discount Rate | 10.70% (10.70%) | Decrease | |||||||||||||||
| 4,461 | Cost | Cost | N/A | N/A | ||||||||||||||||
| Equity/Other |
2,703 | Discounted Cash Flow | Discount Rate | 15.15% (15.15%) | Decrease | |||||||||||||||
| 94 | Market Comparables | Illiquidity Discount | 10.00% (10.00%) | Decrease | ||||||||||||||||
|
|
|
|||||||||||||||||||
| Total |
$ 65,848 | |||||||||||||||||||
|
|
|
|||||||||||||||||||
|
As of December 31, 2017 |
||||||||||||||||||||
| Asset Group |
Fair Value(1) | Valuation Techniques | Unobservable Inputs | Range (Weighted Average)(2) |
Impact to Valuation from an Increase in Input(3) |
|||||||||||||||
| Senior Debt |
$ 32,025 | Discounted Cash Flow | Discount Rate | 7.52% - 12.32% (9.87%) | Decrease | |||||||||||||||
| Asset Based Finance |
2,682 | Discounted Cash Flow | Discount Rate | 17.79% (17.79%) | Decrease | |||||||||||||||
| Equity/Other |
2,756 | Discounted Cash Flow | Discount Rate | 13.81% - 17.79% (15.77%) | Decrease | |||||||||||||||
| 58 | Discounted Cash Flow | Discount Rate | 11.02% (11.02%) | Decrease | ||||||||||||||||
| Market Comparables | EBITDA Multiple | 9.26x - 10.32x (9.79x) | Increase | |||||||||||||||||
| Illiquidity Discount | 10.00% (10.00%) | Decrease | ||||||||||||||||||
|
|
|
|||||||||||||||||||
| Total |
$ 37,521 | |||||||||||||||||||
|
|
|
|||||||||||||||||||
| (1) | Certain investments may be valued at cost for a period of time after an acquisition as the best indicator of fair value. |
| (2) | Weighted average amounts are based on the estimated fair values. |
| (3) | This column represents the directional change in the fair value of the Level 3 investments that would result from an increase to the corresponding unobservable input. A decrease to the input would have the opposite effect. Significant changes in these inputs in isolation could result in significantly higher or lower fair value measurements. |
32
Table of Contents
Corporate Capital Trust II
Notes to Unaudited Condensed Financial Statements (continued)
(in thousands, except share and per share amounts)
Note 5. Fair Value of Financial Instruments (continued)
The preceding tables represent the significant unobservable inputs as they relate to the Company’s determination of fair values for the majority of its investments categorized within Level 3 as of September 30, 2018 and December 31, 2017. In addition to the techniques and inputs noted in the table above, according to the Company’s valuation policy, the Company may also use other valuation techniques and methodologies when determining the fair value estimates for the Company’s investments. Any significant increases or decreases in the unobservable inputs would result in significant increases or decreases in the fair value of the Company’s investments.
Investments that do not have a readily available market value are valued utilizing a market approach, an income approach (i.e. discounted cash flow approach), or both approaches, as appropriate. The market comparables approach uses prices, including third party indicative broker quotes, and other relevant information generated by market transactions involving identical or comparable assets or liabilities (including a business). The income approach uses valuation techniques to convert future amounts (for example, cash flows or earnings) that are discounted based on a required or expected discount rate to derive a single present value amount. The measurement is based on the value indicated by current market expectations about those future amounts. In following these approaches, the types of factors the Company may take into account to determine the fair value of its investments include, as relevant: available current market data, including an assessment of the credit quality of the security’s issuer, relevant and applicable market trading and transaction comparables, applicable market yields and multiples, illiquidity discounts, security covenants, call protection provisions, information rights, the nature and realizable value of any collateral, the portfolio company’s ability to make payments, its earnings and cash flows, the markets in which the portfolio company does business, comparisons of financial ratios of peer companies that are public, data derived from merger and acquisition activities for comparable companies, and enterprise values, among other factors.
The following tables provide reconciliations for the nine months ended September 30, 2018 and the year ended December 31, 2017 of investments for which Level 3 inputs were used in determining fair value:
| Nine Months Ended September 30, 2018 |
||||||||||||||||
| Senior Debt | Asset Based Finance |
Equity/Other | Total | |||||||||||||
| Fair value at beginning of period |
$ | 32,025 | $ | 2,682 | $ | 2,814 | $ | 37,521 | ||||||||
| Additions(1) |
27,499 | 4,462 | — | 31,961 | ||||||||||||
| Paid-in-kind interest |
75 | — | — | 75 | ||||||||||||
| Net realized gains (losses)(2) |
(6) | — | — | (6) | ||||||||||||
| Net change in unrealized appreciation (depreciation)(3) |
(391) | (126) | (17) | (534) | ||||||||||||
| Sales or repayments(4) |
(2,116) | (1,166) | — | (3,282) | ||||||||||||
| Net discount accretion |
113 | — | — | 113 | ||||||||||||
|
|
|
|
|
|
|
|
|
|||||||||
| Fair value at end of period |
$ | 57,199 | $ | 5,852 | $ | 2,797 | $ | 65,848 | ||||||||
|
|
|
|
|
|
|
|
|
|||||||||
| Change in net unrealized appreciation (depreciation) in investments still held at the reporting date(3) |
$ | (381) | $ | (126) | $ | (17) | $ | (524) | ||||||||
|
|
|
|
|
|
|
|
|
|||||||||
33
Table of Contents
Corporate Capital Trust II
Notes to Unaudited Condensed Financial Statements (continued)
(in thousands, except share and per share amounts)
Note 5. Fair Value of Financial Instruments (continued)
| Year Ended December 31, 2017 |
||||||||||||||||
| Senior Debt | Asset Based Finance |
Equity/Other | Total | |||||||||||||
| Fair value at beginning of period |
$ | 616 | $ | — | $ | 58 | $ | 674 | ||||||||
| Additions(1) |
33,449 | 2,682 | 3,018 | 39,149 | ||||||||||||
| Net realized gains (losses)(2) |
2 | — | — | 2 | ||||||||||||
| Net change in unrealized appreciation (depreciation)(3) |
(88 | ) | — | (38 | ) | (126 | ) | |||||||||
| Sales or repayments(4) |
(1,979 | ) | — | (224 | ) | (2,203 | ) | |||||||||
| Net discount accretion |
25 | — | — | 25 | ||||||||||||
|
|
|
|
|
|
|
|
|
|||||||||
| Fair value at end of period |
$ | 32,025 | $ | 2,682 | $ | 2,814 | $ | 37,521 | ||||||||
|
|
|
|
|
|
|
|
|
|||||||||
| Change in net unrealized appreciation (depreciation) in investments still held at the reporting date(3) |
$ | (88 | ) | $ | — | $ | (38 | ) | $ | (126 | ) | |||||
|
|
|
|
|
|
|
|
|
|||||||||
| (1) | Includes increases in the cost basis of investments resulting from new and add-on portfolio investments. |
| (2) | Included in net realized gain (loss) in the statements of operations. |
| (3) | Included in net change in unrealized appreciation (depreciation) in the statements of operations. |
| (4) | Includes principal payments/paydowns on debt investments and proceeds from sale of investments. |
No securities were transferred into or out of the Level 3 hierarchy during the nine months ended September 30, 2018. All realized and unrealized gains and losses are included in earnings and are reported as separate line items within the Company’s unaudited condensed statements of operations.
Note 6. Related Party Transactions
Managing Dealer Agreement and Distribution and Shareholder Servicing Plan
The Company was a party to a managing dealer agreement with CNL Securities Corp., an affiliate of CNL. CNL Securities Corp. which served as the managing dealer (the “Managing Dealer”) of the Company’s Offering and in connection therewith received up-front selling commissions of up to 2.00% of gross offering proceeds, up-front dealer manager fees of up to 2.75% of gross offering proceeds and ongoing distribution and shareholder servicing fees at an annualized rate of 1.25% of the Company’s most recently published net asset value per share, excluding shares issued through the distribution reinvestment plan. All or any portion of these fees were re-allowed to participating brokers.
On March 16, 2017, the board of trustees approved an amended and restated managing dealer agreement (the “Managing Dealer Agreement”) between the Company and the Managing Dealer and approved an amended and restated distribution and shareholder servicing plan for the Company (the “Distribution and Shareholder Servicing Plan”) which lowered the ongoing distribution and shareholder servicing fee paid to the Managing Dealer from an annualized rate of 1.25% to an annualized rate of 1.00% of the Company’s net asset value per share. On April 9, 2018, the Managing Dealer Agreement and the Distribution and Shareholder Servicing Plan were terminated effective April 30, 2018.
34
Table of Contents
Corporate Capital Trust II
Notes to Unaudited Condensed Financial Statements (continued)
(in thousands, except share and per share amounts)
Note 6. Related Party Transactions (continued)
Investment Advisory Agreements
On April 9, 2018, the Company terminated the Former Investment Advisory Agreement (as defined below) and concurrently entered into a new investment advisory agreement with the Joint Advisor (the “Joint Advisor Investment Advisory Agreement”). Pursuant to the Joint Advisor Investment Advisory Agreement, the Company pays the Joint Advisor a fee for their services consisting of two components – a base management fee based on the average value of the Company’s gross assets and incentive fees based on the Company’s performance. Under the Joint Advisor Investment Advisory Agreement, the Joint Advisor is entitled to an annual base management fee of 1.50% of the average value of the Company’s gross assets, as compared to the annual rate of 2.00% under the Former Investment Advisory Agreement. In addition, the calculation of the base management fee under the Joint Advisor Investment Advisory Agreement excludes cash and cash equivalents from gross assets, as compared to the Former Investment Advisory Agreement, which included cash and cash equivalents within the definition of gross assets. Under the Joint Advisor Investment Advisory Agreement, the Joint Advisor serves as the sole investment adviser of the Company.
Previously, the Company was a party to an investment advisory agreement with CNL (the “Former Investment Advisory Agreement”) for the overall management of the Company’s activities. CNL was a party to a sub-advisory agreement with KKR (the “Former Sub-Advisory Agreement”), under which KKR was responsible for the day-to-day management of the Company’s investment portfolio. Pursuant to the Former Investment Advisory Agreement, CNL earned (i) a management fee equal to an annual rate of 2.00% of the Company’s average gross assets, and (ii) an incentive fee based on the Company’s performance. The incentive fee consisted of (i) a subordinated incentive fee on income and (ii) an incentive fee on capital gains. CNL compensated KKR for advisory services that it provided to the Company with 50% of the fees that CNL received under the Investment Advisory Agreement.
A subordinated incentive fee on income is payable to the Joint Advisor each calendar quarter if the Company’s pre-incentive fee net investment fee income (as defined in the Joint Advisor Investment Advisory Agreement and approved by the Company’s board of trustees) exceeds the 1.75% quarterly preference return to the Company’s shareholders (the ratio of pre-incentive fee net investment income divided by average adjusted capital).
The annual incentive fees on capital gains recorded for GAAP purposes are equal to (i) 20% of the Company’s realized and unrealized capital gains on a cumulative basis since inception, net of all realized capital losses and unrealized depreciation on a cumulative basis from inception, less (ii) the aggregate amount of any previously paid incentive fees on capital gains. For financial reporting purposes, in accordance with GAAP, the Company includes unrealized appreciation on the investment portfolio in the calculation of incentive fees on capital gains; however, such amounts are not payable by the Company unless and until the net unrealized appreciation is actually realized. The actual amount of incentive fees on capital gains that are due and payable to the Joint Advisor is determined at the end of the calendar year.
The terms of the incentive fees are substantially the same as those to which CNL was entitled to receive under the Former Investment Advisory Agreement.
The Company did not incur any subordinated incentive fee on income under the Investment Advisory Agreements during the nine months ended September 30, 2018 and 2017. The Company had accrued $200 of incentive fees payable on capital gains under the Investment Advisory Agreements as of September 30, 2018.
35
Table of Contents
Corporate Capital Trust II
Notes to Unaudited Condensed Financial Statements (continued)
(in thousands, except share and per share amounts)
Note 6. Related Party Transactions (continued)
Under the terms of the Former Investment Advisory Agreement, CNL (and indirectly KKR) was entitled to receive up to 1.50% of gross offering proceeds as reimbursement for organization and offering expenses incurred by the Former Advisors on behalf of the Company. The Former Advisors had incurred organization and offering costs of approximately $5,400 as of March 31, 2018 on behalf of the Company. The Former Advisors waived the reimbursement of organization and offering expenses in connection with the Company’s gross capital raise received from the Offering from March 1, 2016 (when the Company satisfied the minimum offering requirement) through April 30, 2017 (the “O&O Reimbursement Waiver”). The O&O Reimbursement Waiver did not reduce the amount of organization and offering expenses incurred by the Former Advisors that were eligible for reimbursement in future periods based on subsequent gross capital raised by the Company after April 30, 2017. Gross capital raised by the Company after April 30, 2017 was subject to the maximum organization and offering cost reimbursement of 1.50%. The Former Advisors were entitled to reimbursement of approximately $400 of organization and offering costs for gross capital raised for the period May 1, 2017 through April 9, 2018, all of which had been reimbursed to the Former Advisors as of April 9, 2018. A contingent obligation for the balance of organization and offering costs, subject to reimbursement based on future gross proceeds raised assuming a reinstatement of the Company’s Offering, was approximately $5,000 as of April 30, 2018.
On April 30, 2018, the Company terminated its Offering and in conjunction therewith, the Former Advisors agreed to permanently waive their rights to receive reimbursement of approximately $5,000 of organization and offering expenses that they had incurred on the Company’s behalf. As such, as of September 30, 2018, the Company had no contingent obligations to reimburse its Former Advisors for organization and offering expenses.
Administrative Services Agreements
The Company was a party to an administrative services agreement with CNL (“Former Administrative Services Agreement”), under which CNL performed, or oversaw the performance of, various administrative services on behalf of the Company. Administrative services included investor services, general ledger accounting, fund accounting, maintaining required financial records, calculating the Company’s net asset value, filing tax returns, preparing and filing SEC reports, preparing, printing, and disseminating shareholder reports and generally overseeing the payment of the Company’s expenses and the performance of administrative and professional services rendered to the Company by others. The Company reimbursed CNL for administrative expenses it incurred in performing its obligations.
On April 9, 2018, the Company terminated the Former Administrative Services Agreement with CNL and concurrently entered into a new administrative services agreement with the Joint Advisor (the “Joint Advisor Administrative Services Agreement”). Under the Joint Advisor Administrative Services Agreement, the Joint Advisor serves as the Company’s administrator. The terms of the Joint Advisor Administrative Services Agreement, including the services to be provided by the Joint Advisor as administrator and the amount of reimbursements to be paid by the Company for certain administrative expenses, are substantially the same as those under the Former Administrative Services Agreement.
Expense Support Agreements
The Company was a party to an expense support and conditional reimbursement agreement, as amended and restated (the “Former Expense Support Agreement”) with the Former Advisors pursuant to which the Former Advisors jointly and severally agreed to pay to the Company some or all of its operating expenses (an “Expense Support Payment”) for each month during the Former Expense Support Payment Period (as defined below) in
36
Table of Contents
Corporate Capital Trust II
Notes to Unaudited Condensed Financial Statements (continued)
(in thousands, except share and per share amounts)
Note 6. Related Party Transactions (continued)
which the Company’s board of trustees declared a distribution to its shareholders. Expense Support Payments were made in accordance with the terms of the Former Expense Support Agreement. The “Expense Support Payment Period” commenced on March 1, 2016 and terminated effective with the termination of the Former Expense Support Agreement on April 9, 2018.
The Former Advisors were entitled to be reimbursed promptly by the Company (a “Reimbursement Payment”) for Expense Support Payments made with respect to any class of common stock, subject to the limitation that no Reimbursement Payment may be made by the Company to the extent that it would cause the Company’s Other Operating Expenses (as defined in the Former Expense Support Agreement) for such class of common stock to exceed the lesser of (A) 1.75% of average net assets attributable to common shares on an annualized basis after taking such payment into account and (B) the percentage of average net assets attributable to shares of such class of common stock represented by Other Operating Expenses (as defined in the Former Expense Support Agreement) during the period in which such Expense Support Payment from the Former Advisors was made (provided, however, that this clause (B) did not apply to any reimbursement payment which related to an Expense Support Payment from the Former Advisors made during the same period).
Concurrently with the Company’s entry into the Joint Advisor Investment Advisory Agreement and the Joint Advisor Administrative Services Agreement, on April 9, 2018, the Company entered into a new expense support and conditional reimbursement agreement (the “Joint Advisor Expense Support Agreement”), which replaced the Former Expense Support Agreement. The Joint Advisor Expense Support Agreement is substantially similar to the Former Expense Support Agreement.
On November 14, 2018, the Joint Advisor announced that for any calendar month ending on or prior to September 30, 2019 it will defer the receipt of base management fees under the Joint Advisor Investment Advisory Agreement if, and to the extent that, the Company’s distributions paid to the Company’s shareholders in the calendar month exceeds the sum of the Company’s investment company taxable income (as defined in Section 852 of the Internal Revenue Code of 1986, as amended, or the Code), net capital gains (as defined in Section 1222 of the Code) and dividends and other distributions paid to the Company on account of preferred and common equity investments in portfolio companies (to the extent such amounts were not included in net investment company taxable income or net capital gains) in the calendar month, or collectively, the Company’s distributable funds on a tax basis. The Joint Advisor will only receive any deferred fees in a future calendar month if, and to the extent that, the Company’s distributable funds on a tax basis in the future calendar month exceeds the Company’s distributions paid to the Company’s shareholders in such month. In light of this commitment by the Joint Advisor, the Joint Advisor Expense Support Agreement was terminated on November 14, 2018. The Company’s conditional obligation to reimburse the Joint Advisor pursuant to the terms of the Joint Advisor Expense Support Agreement survived the termination of such agreement. Prior to September 30, 2019, the Joint Advisor will evaluate whether to extend this commitment to future periods.
37
Table of Contents
Corporate Capital Trust II
Notes to Unaudited Condensed Financial Statements (continued)
(in thousands, except share and per share amounts)
Note 6. Related Party Transactions (continued)
Related party fees and expenses incurred on behalf of the Company during the three and nine months ended September 30, 2018 and 2017 are summarized below:
| Three Months Ended September 30, |
Nine Months Ended September 30, |
|||||||||||||||||
| Related Party |
Source Agreement & Description |
2018 | 2017 | 2018 | 2017 | |||||||||||||
| CNL Securities Corp. |
Former Managing Dealer Agreement: | |||||||||||||||||
| Up-front selling commissions and dealer manager fees | $ | — | $ | 653 | $ | 61 | $ | 2,560 | ||||||||||
| Distribution and shareholder servicing fees | $ | — | $ | 252 | $ | 376 | $ | 687 | ||||||||||
| KKR |
Former Investment Sub-Advisory Agreement: | |||||||||||||||||
| Investment expenses reimbursement(2) | $ | 33 | $ | 7 | $ | 71 | $ | 14 | ||||||||||
| FS/KKR Advisor |
Joint Advisor Investment Advisory Agreement: | |||||||||||||||||
| CNL and KKR |
Former Investment Advisory Agreement: | |||||||||||||||||
| Base management fees (investment advisory fees)(1) | $ | 724 | $ | 629 | $ | 2,295 | $ | 1,520 | ||||||||||
| Incentive fee on capital gains(3) | $ | 185 | $ | 109 | $ | (79) | $ | 136 | ||||||||||
| Organization and offering expense reimbursement | $ | — | $ | 208 | $ | 20 | $ | 296 | ||||||||||
| FS/KKR Advisor |
Joint Advisor Administrative Services Agreement: | |||||||||||||||||
| CNL |
Former Administrative Services Agreement: | |||||||||||||||||
| Administrative and compliance services(1) | $ | (37) | $ | 178 | $ | 289 | $ | 476 | ||||||||||
| FS/KKR Advisor |
Joint Advisor Expense Support Agreement: | |||||||||||||||||
| CNL and KKR |
Former Expense Support Agreement: | |||||||||||||||||
| Expense support provided | $ | (44) | $ | (606) | $ | (625) | $ | (1,866) | ||||||||||
| (1) | Expenses subject to expense support. |
| (2) | Includes reimbursement of fees related to transactional expenses for prospective investments, including fees and expenses associated with performing due diligence reviews of investments that do not close, often referred to as “broken deal” costs. Broken deal costs were approximately $16 and $12 for the nine months ended September 30, 2018 and 2017, respectively. |
| (3) | Incentive fees on capital gains are included in performance-based incentive fees in the unaudited condensed statements of operations. The following table provides additional details for the incentive fee on capital gains for the three and nine months ended September 30, 2018 and 2017: |
| Three Months Ended September 30, |
Nine Months Ended September 30, |
|||||||||||||||
| Incentive Fee on Capital Gains |
2018 | 2017 | 2018 | 2017 | ||||||||||||
| Accrued incentive fee at beginning of period |
$ | 15 | $ | 194 | $ | 279 | $ | 167 | ||||||||
| Incentive fee on capital gains during the period |
185 | 109 | (79) | 136 | ||||||||||||
| Less: Incentive fee on capital gains paid to the Advisors during the period |
— | — | — | — | ||||||||||||
|
|
|
|
|
|
|
|
|
|||||||||
| Accrued incentive fee at end of period |
200 | 303 | 200 | 303 | ||||||||||||
| Less: Accrued incentive fee on capital gains attributable to unrealized gains at end of period |
(200) | (303) | (200) | (303) | ||||||||||||
|
|
|
|
|
|
|
|
|
|||||||||
| Incentive fee on capital gains earned by and payable to the Advisors at end of period |
$ | — | $ | — | $ | — | $ | — | ||||||||
|
|
|
|
|
|
|
|
|
|||||||||
38
Table of Contents
Corporate Capital Trust II
Notes to Unaudited Condensed Financial Statements (continued)
(in thousands, except share and per share amounts)
Note 6. Related Party Transactions (continued)
The amount of Expense Support Payments provided by the Former Advisors since inception was approximately $5,400. Effective April 30, 2018, the Former Advisors waived their right to reimbursement of such Expense Support Payments.
The following table presents amounts payable to Advisors as of September 30, 2018 and December 31, 2017:
| September 30, 2018 | December 31, 2017 | |||||||
| Receivable from Advisors: |
||||||||
| Expense support |
$ | 44 | $ | 492 | ||||
|
|
|
|
|
|||||
| Total receivable from Advisors |
44 | 492 | ||||||
| Payable to Advisors: |
||||||||
| Base management fees (investment advisory fees) |
724 | 556 | ||||||
| Operating expense reimbursement |
76 | 146 | ||||||
| Offering expense reimbursement |
— | 77 | ||||||
|
|
|
|
|
|||||
| Total payable to Advisors |
800 | 779 | ||||||
|
|
|
|
|
|||||
| Net due (to) from Advisors |
$ | (756) | $ | (287) | ||||
|
|
|
|
|
|||||
Note 7. Distributions
The Company currently intends to declare regular cash distributions on a monthly basis and pay such distributions on a monthly basis. On July 31, 2018, the Company’s board of trustees declared regular weekly cash distributions for September through October 2018, each in the amount of $0.011250 per share. These distributions have been recorded weekly and paid monthly to shareholders of record as of monthly record dates previously determined by the Company’s board of trustees. On October 26, 2018, the Company’s board of trustees declared regular monthly cash distributions for November through December 2018, each in the amount of $0.04875 per share. These distributions will be paid monthly to shareholders of record as of monthly record dates previously determined by the Company’s board of trustees. The timing and amount of any future distributions to shareholders are subject to applicable legal restrictions and the sole discretion of the Company’s board of trustees.
The total and the sources of declared distributions on a GAAP basis for the nine months ended September 30, 2018 and 2017 are presented in the tables below:
| Nine Months Ended September 30, |
||||||||||||||||||||||||
| 2018 | 2017 | |||||||||||||||||||||||
| Per Share | Amount | Allocation | Per Share | Amount | Allocation | |||||||||||||||||||
| Net investment income |
$ | 0.41 | $ | 5,176 | 92.7% | $ | 0.28 | $ | 2,555 | 63.5% | ||||||||||||||
| Net realized gains |
0.02 | 300 | 5.4% | 0.04 | 367 | 9.1% | ||||||||||||||||||
| Distributions in excess of net investment income |
0.01 | 107 | 1.9% | 0.12 | 1,099 | 27.4% | ||||||||||||||||||
|
|
|
|
|
|
|
|
|
|
|
|
|
|||||||||||||
| Total Declared Distributions |
$ | 0.44 | $ | 5,583 | 100.0% | $ | 0.44 | $ | 4,021 | 100.0% | ||||||||||||||
|
|
|
|
|
|
|
|
|
|
|
|
|
|||||||||||||
39
Table of Contents
Corporate Capital Trust II
Notes to Unaudited Condensed Financial Statements (continued)
(in thousands, except share and per share amounts)
Note 7. Distributions (continued)
Net investment income includes Expense Support Payments of $625 and $1,866 which supported distributions of $5,583 and $4,021 during the nine months ended September 30, 2018 and 2017, respectively. Sources of distributions, other than net investment income and realized gains on a GAAP basis, include (i) the ordinary income component of prior year tax basis undistributed earnings and (ii) required adjustments to GAAP net investment income and realized gains in the current period to determine taxable income available for distributions.
The following table summarizes the primary sources of differences between (i) GAAP net investment income and realized gains and (ii) taxable income available for distributions that contribute to tax-related distributions in excess of net investment income for the nine months ended September 30, 2018 and 2017:
| Nine Months Ended September 30, | ||||||||
| 2018 | 2017 | |||||||
| Ordinary income component of tax basis undistributed earnings |
$ | 580 | $ | 223 | ||||
| Unearned performance-based incentive fees on unrealized gains |
(79 | ) | 136 | |||||
| Marked-to-market foreign currency forward contracts |
112 | — | ||||||
| Organization and offering expenses |
10 | 296 | ||||||
| Distribution and shareholder servicing fees |
376 | 687 | ||||||
|
|
|
|
|
|
| |||
| Total(1) |
$ | 999 | $ | 1,342 | ||||
|
|
|
|
|
|
| |||
| (1) | The above table does not represent all adjustments to calculate taxable income available for distributions. |
For the nine months ended September 30, 2018, the tax-related sources of distributions of $999 were greater than the distributions in excess of net investment income of $107. As a result, the Company estimates that none of the distributions declared during the nine months ended September 30, 2018 would be classified as a tax basis return of capital. None of the distributions declared during the year ended December 31, 2017 were classified as a tax basis return of capital. As of September 30, 2018 and December 31, 2017, the Company had distributions in excess of net investment income of $480 and $373, respectively.
Note 8. Fee Income
Fee income, which is non-recurring, consisted of the following:
| Three Months Ended September 30, |
Nine Months Ended September 30, | |||||||||||||||
| Fee Income |
2018 | 2017 | 2018 | 2017 | ||||||||||||
| Capital structuring fees |
$ | 29 | $ | 332 | $ | 135 | $ | 332 | ||||||||
| Prepayment fees |
— | — | 84 | — | ||||||||||||
| Other |
23 | 7 | 129 | 53 | ||||||||||||
|
|
|
|
|
|
|
|
|
|
|
|
| |||||
| Total |
$ | 52 | $ | 339 | $ | 348 | $ | 385 | ||||||||
|
|
|
|
|
|
|
|
|
|
|
|
| |||||
40
Table of Contents
Corporate Capital Trust II
Notes to Unaudited Condensed Financial Statements (continued)
(in thousands, except share and per share amounts)
Note 9. Share Transactions
The following table summarizes the total shares issued and proceeds received in connection with the Company’s Offering for the nine months ended September 30, 2018 and 2017:
| Nine Months Ended September 30, |
||||||||||||||||
| 2018(1) | 2017 | |||||||||||||||
| Shares | Amount | Shares | Amount | |||||||||||||
| Gross proceeds |
136,070 | $ | 1,331 | 5,599,058 | $ | 54,791 | ||||||||||
| Up-front selling commissions and dealer manager fees |
— | (61) | — | (2,560) | ||||||||||||
|
|
|
|
|
|
|
|
|
|||||||||
| Net proceeds to company |
136,070 | 1,270 | 5,599,058 | 52,231 | ||||||||||||
| Reinvestment of distributions |
296,059 | 2,744 | 224,213 | 2,091 | ||||||||||||
|
|
|
|
|
|
|
|
|
|||||||||
| Net proceeds |
432,129 | $ | 4,014 | 5,823,271 | $ | 54,322 | ||||||||||
|
|
|
|
|
|
|
|
|
|||||||||
| Average net proceeds per share |
$ | 9.29 | $ | 9.33 | ||||||||||||
| (1) | The Company suspended its Offering to new investors effective January 10, 2018. However, the Company continues to issue new shares under its distribution reinvestment plan. |
On February 7, 2017, the Company’s board of trustees increased the public offering price of the Company’s continuous public offering of common stock from $9.75 per share to $9.80 per share. This increase in the Company’s public offering price became effective as of February 7, 2017. As a result of the increase in the Company’s public offering per share, the Company’s maximum sales load per share and the net proceeds per share correspondingly increased from $0.463 to $0.466 and from $9.29 to $9.33, respectively.
From inception through the suspension of the Company’s Offering on January 10, 2018, the Company raised gross proceeds of approximately $123.6 million (12.8 million shares) through its Offering, including approximately $3.4 million (0.4 million shares) through its distribution reinvestment plan. Following the suspension of its Offering, the Company has and will continue to issue shares pursuant to its distribution reinvestment plan. During the nine months ended September 30, 2018, the Company issued $2,744 (296,059 shares) through its distribution reinvestment plan. The Company terminated its Offering effective April 30, 2018 as described in Note 6. “Related Party Transactions.”
The Company conducts quarterly tender offers pursuant to its share repurchase program. The Company currently limits the number of shares to be repurchased during any calendar year to the number of shares it can repurchase with the proceeds it receives from the issuance of shares of its common stock under is distribution reinvestment plan. At the discretion of the Company’s board of trustees, the Company may also use cash on hand, cash available from borrowings and cash from the sale of investments as the end of the applicable period to repurchase shares. The Company limits repurchases in each quarter to 2.5% of the weighted average number of shares of common stock outstanding. The Company’s board of trustees may amend, suspend or terminate the share repurchase program upon 30 days’ notice.
41
Table of Contents
Corporate Capital Trust II
Notes to Unaudited Condensed Financial Statements (continued)
(in thousands, except share and per share amounts)
Note 9. Share Transactions (continued)
The following table is a summary of the share repurchases completed during the nine months ended September 30, 2018:
| Repurchase Date |
Total Number of Shares Offered to Repurchase |
Total Number of Shares Repurchased |
Total Consideration | No. of Shares Repurchased/ Total Offer |
Price Paid Per Share |
|||||||||||||||
| February 20, 2018 |
249,708 | 91,276 | $ | 840 | 37% | $ | 9.20 | |||||||||||||
| July 2, 2018(1) |
356,875 | 356,875 | $ | 3,298 | 100% | $ | 9.24 | |||||||||||||
| (1) | On May 21, 2018, the Company offered to purchase 284,984 shares of its issued and outstanding common shares at a purchase price of $9.24 per share. The Company’s board of trustees subsequently approved the purchase of an additional 71,891 shares in connection with the tender offer. On July 2, 2018, the Company repurchased approximately 356,875 shares (representing 100% of the common shares tendered for repurchase) at $9.24 per share for aggregate consideration totaling $3,298. |
On October 1, 2018, the Company repurchased approximately 197,598 shares (representing 65% of the common shares tendered for repurchase) at $9.08 per share for aggregate consideration totaling $1,794.
Note 10. Borrowings
On July 14, 2017, the Company entered into a senior secured revolving credit agreement (the “Credit Agreement”). The Credit Agreement provides for a revolving credit facility (the “Revolving Credit Facility”) consisting of loans to be made in dollars and other foreign currencies in an initial aggregate principal amount of $70,000. Availability under the Revolving Credit Facility will terminate on July 14, 2019, and the outstanding loans under the Revolving Credit Facility will mature on July 14, 2020. On June 11, 2018, the Company entered into an incremental commitment agreement with ING Capital LLC to increase the total borrowing capacity under the Revolving Credit Facility to $82,000.
Under the Revolving Credit Facility, the Company has made certain representations and warranties and is required to comply with various covenants, reporting requirements and other customary requirements for similar revolving credit facilities. The Company was in compliance with all covenants required by the Revolving Credit Facility as of September 30, 2018.
As of September 30, 2018 and December 31, 2017, the principal amount outstanding on the Revolving Credit Facility was approximately $75,471 and $53,000, respectively. Of the $75,471 principal outstanding as of September 30, 2018, approximately $387, $2,484 and $450 were denominated in Canadian dollars, Euros and British pound sterling, respectively. There were no borrowings denominated in foreign currencies as of December 31, 2017.
42
Table of Contents
Corporate Capital Trust II
Notes to Unaudited Condensed Financial Statements (continued)
(in thousands, except share and per share amounts)
Note 10. Borrowings (continued)
The components of interest expense, average interest rates (i.e., base interest rate in effect plus the spread) and average outstanding balances for the Revolving Credit Facility for the three and nine months ended September 30, 2018 and 2017 were as follows:
| Three Months Ended September 30, |
Nine Months Ended September 30, |
|||||||||||||||
| 2018 | 2017 | 2018 | 2017 | |||||||||||||
| Interest expense |
$ | 943 | $ | 138 | $ | 2,226 | $ | 138 | ||||||||
| Unused commitment fees |
6 | 165 | 44 | 165 | ||||||||||||
| Amortization of deferred financing costs |
28 | 23 | 80 | 23 | ||||||||||||
|
|
|
|
|
|
|
|
|
|||||||||
| Total interest expense |
$ | 977 | $ | 326 | $ | 2,350 | $ | 326 | ||||||||
|
|
|
|
|
|
|
|
|
|||||||||
| Weighted average interest rate(1) |
4.9% | 4.1% | 4.8% | 4.1% | ||||||||||||
| Average borrowings |
$ | 76,773 | $ | 13,321 | $ | 63,183 | $ | 4,489 | ||||||||
| (1) | Weighted average interest rates for the three and nine months ended September 30, 2018 include the effect of unused commitment fees. Weighted average interest rates for the three and nine months ended September 30, 2017 do not include the effect of unused commitment fees. |
The weighted average effective interest rate and weighted average remaining years to maturity of the Company’s outstanding borrowings as of September 30, 2018 were approximately 5.0% and 1.8 years, respectively. As of September 30, 2018, the asset coverage per unit was 2.53. Asset coverage per unit is the ratio of the carrying value of the Company’s total assets available to cover senior securities, less all liabilities and indebtedness not represented by senior securities, to the aggregate amount of senior securities representing indebtedness.
43
Table of Contents
Corporate Capital Trust II
Notes to Unaudited Condensed Financial Statements (continued)
(in thousands, except share and per share amounts)
Note 11. Commitments and Contingencies
Unfunded commitments to provide funds to portfolio companies are not recorded in the Company’s unaudited condensed statements of assets and liabilities. Since these commitments may expire without being drawn upon, the total commitment amount does not necessarily represent future cash requirements. The Company has sufficient liquidity to fund these commitments. As of September 30, 2018, the Company’s unfunded commitments consisted of the following:
| Category / Portfolio Company |
Cost | |||
| Unfunded Term Loan Commitments: |
||||
| Access CIG, LLC |
$ | 11 | ||
| Berner Food & Beverage Inc. |
2,623 | |||
| Frontline Technologies Group, LLC |
878 | |||
| GC Agile Intermediate Holdings Limited (GBR) |
86 | |||
| GC Agile Intermediate Holdings Limited (GBR) |
284 | |||
| Harrison Gypsum, LLC |
260 | |||
| ID Verde (FRA)(1) |
333 | |||
| Patriot Well Solutions LLC |
334 | |||
| Revere Superior Holdings, Inc. |
382 | |||
| Wheels Up Partners, LLC |
827 | |||
| Unfunded Revolving Loan Commitments: |
||||
| Eagle Family Foods Group LLC |
157 | |||
| GC Agile Intermediate Holdings Limited (GBR) |
237 | |||
| Revere Superior Holdings, Inc. |
129 | |||
| SMART Global Holdings, Inc. |
33 | |||
| Unfunded Asset Based Finance Commitments: |
||||
| KKR Zeno Aggregator, LP (IRE) |
2,476 | |||
| Neos SPV I (NLD)(1) |
935 | |||
| Unfunded Equity Commitments: |
||||
| Polyconcept North America, Inc. |
26 | |||
|
|
|
|||
| Total Unfunded Commitments |
$ | 10,011 | ||
|
|
|
|||
|
|
||||
| (1) Local currency commitment amount is denominated in Euros. As of September 30, 2018, €1 equaled approximately US $1.16. |
| |||
The Company funds its commitments as it receives funding notices from the portfolio companies. At September 30, 2018, the Company’s unfunded commitments have a net fair value of $(142).
On April 30, 2018, the Former Advisors agreed to permanently waive the Company’s obligation to reimburse the Former Advisors approximately $5,400 in expense support payments not previously reimbursed under the Former Expense Support Agreement and approximately $5,000 of organization and offering expenses that they had incurred on the Company’s behalf. As such, as of September 30, 2018, the Company had no contingent obligations to reimburse its Former Advisors for expense support and organization and offering expenses. See Note 6. “Related Party Transactions” for further detail of the agreements with the Former Advisors.
44
Table of Contents
Corporate Capital Trust II
Notes to Unaudited Condensed Financial Statements (continued)
(in thousands, except share and per share amounts)
Note 11. Commitments and Contingencies (continued)
In the normal course of business, the Company may enter into guarantees on behalf of portfolio companies. Under these arrangements, the Company would be required to make payments to third parties if the portfolio companies were to default on their related payment obligations. The Company had no such guarantees outstanding as of September 30, 2018.
The Company enters into contracts that contain a variety of indemnification provisions. The Company’s maximum exposure under these arrangements is unknown; however, the Company has not had prior claims or losses pursuant to these contracts. Management of Joint Advisor has reviewed the Company’s existing contracts and expects the risk of loss to the Company to be remote.
45
Table of Contents
Corporate Capital Trust II
Notes to Unaudited Condensed Financial Statements (continued)
(in thousands, except share and per share amounts)
Note 12. Financial Highlights
The following is a schedule of financial highlights for one share of common stock during the nine months ended September 30, 2018 and 2017:
| Nine Months Ended September 30, |
||||||||
| 2018 | 2017 | |||||||
| OPERATING PERFORMANCE PER SHARE |
||||||||
| Net Asset Value, Beginning of Period |
$ | 9.20 | $ | 9.26 | ||||
|
|
|
|
|
|||||
| Net investment income, before expense support(1) |
0.36 | 0.08 | ||||||
| Expense support(1) |
0.05 | 0.20 | ||||||
|
|
|
|
|
|||||
| Net investment income(1) |
0.41 | 0.28 | ||||||
| Net realized and unrealized gain (loss)(1)(2) |
(0.03) | 0.09 | ||||||
|
|
|
|
|
|||||
| Net increase resulting from investment operations |
0.38 | 0.37 | ||||||
|
|
|
|
|
|||||
| Distributions from net investment income(3) |
(0.41) | (0.28) | ||||||
| Distributions from net realized gains(3) |
(0.02) | (0.04) | ||||||
| Distributions in excess of net investment income(3)(4) |
(0.01) | (0.12) | ||||||
|
|
|
|
|
|||||
| Net decrease resulting from distributions to common shareholders |
(0.44) | (0.44) | ||||||
|
|
|
|
|
|||||
| Issuance of common stock above net asset value(5) |
0.00 | 0.04 | ||||||
| Repurchases of common stock(6) |
0.00 | — | ||||||
|
|
|
|
|
|||||
| Net increase resulting from capital share transactions |
0.00 | 0.04 | ||||||
|
|
|
|
|
|||||
| Net Asset Value, End of Period |
$ | 9.14 | $ | 9.23 | ||||
|
|
|
|
|
|||||
| OPERATING PERFORMANCE PER SHARE |
||||||||
| Total Investment Return–Net Asset Value(7) |
4.16% | 4.46% | ||||||
| RATIOS/SUPPLEMENTAL DATA |
||||||||
| Net assets, end of period |
$ | 115,542 | $ | 108,555 | ||||
| Average net assets(8) |
$ | 116,916 | $ | 85,350 | ||||
| Average borrowings(8) |
$ | 63,183 | $ | 4,489 | ||||
| Shares outstanding, end of period |
12,640,594 | 11,767,474 | ||||||
| Weighted average shares outstanding |
12,733,097 | 9,231,778 | ||||||
| Ratios to average net assets: |
||||||||
| Total operating expenses before expense support(8) |
6.18% | 5.71% | ||||||
| Total operating expenses after expense support(8) |
5.64% | 3.53% | ||||||
| Net investment income |
4.43% | 2.99% | ||||||
| Portfolio turnover rate |
34% | 60% | ||||||
| (1) | The per share data was derived by using the weighted average shares outstanding during the period. |
| (2) | The amount shown at this caption is the balancing figure derived from the other figures in the schedule. The amount shown at this caption for a share outstanding throughout the period may not agree with the change in the aggregate gains and losses in portfolio securities for the period because of the timing of sales of the Company’s shares in relation to fluctuating market values for the portfolio. |
46
Table of Contents
Corporate Capital Trust II
Notes to Unaudited Condensed Financial Statements (continued)
(in thousands, except share and per share amounts)
Note 12. Financial Highlights (continued)
| (3) | The per share data for distributions is the actual amount of distributions paid or payable per share of common stock outstanding during the entire period; distributions per share are rounded to the nearest $0.01. |
| (4) | See Note 7. “Distributions” for further information on the source of distributions from other than net investment income and realized gains. |
| (5) | The issuance of common stock may cause an incremental increase in net asset value per share due to the sale of shares at the then prevailing public offering price and the receipt of net proceeds per share by the Company in excess of net asset value per share on each subscription closing date. The per share data was derived by computing (i) the sum of (A) the number of shares issued in connection with subscriptions and/or distribution reinvestment on each share transaction date times (B) the differences between the net proceeds per share and the net asset value per share on each share transaction date, divided by (ii) the total shares outstanding at the end of the period. |
| (6) | The per share impact of the Company’s repurchase of common stock reflects a change in net asset value of less than $0.01 per share during the nine months ended September 30, 2018. |
| (7) | Total investment return–net asset value is a measure of the change in total value for shareholders who held the Company’s common stock at the beginning and end of the period, including distributions declared during the period. Total investment return–net asset value is based on (i) net asset value per share on the first day of the period, (ii) the net asset value per share on the last day of the period, of (A) one share plus (B) any fractional shares issued in connection with the reinvestment of monthly distributions, and (iii) distributions payable relating to one share, if any, on the last day of the period. The total investment return–net asset value calculation assumes that (i) monthly cash distributions are reinvested in accordance with the Company’s distribution reinvestment plan and (ii) the fractional shares issued pursuant to the distribution reinvestment plan are issued at the then current public offering price, net of sales load, on each monthly distribution payment date. Since there is no public market for the Company’s shares, terminal market value per share is assumed to be equal to net asset value per share on the last day of the period presented. The Company’s performance changes over time and currently may be different than that shown above. Past performance is no guarantee of future results. Investment performance is presented without regard to sales load that may be incurred by shareholders in the purchase of the Company’s shares of common stock. Total investment return is not annualized. |
| (8) | The computation of average net assets during the period is based on the daily value of net assets and borrowing balances, respectively. Ratios are not annualized. |
47
Table of Contents
Item 2. Management’s Discussion and Analysis of Financial Condition and Results of Operations
The following discussion is based on the unaudited condensed financial statements as of September 30, 2018 and December 31, 2017, and for the three and nine months ended September 30, 2018 and 2017. Amounts as of December 31, 2017 included in the unaudited condensed financial statements have been derived from the audited financial statements as of that date. This information should be read in conjunction with the accompanying unaudited condensed financial statements and the notes thereto, as well as, the audited financial statements, notes and management’s discussion and analysis of financial condition and results of operations included in our Annual Report on Form 10-K for the period ended December 31, 2017. Capitalized terms used in this Item 2 have the same meaning as in the accompanying unaudited condensed financial statements in Item 1 unless otherwise defined herein. All amounts are in thousands, except share and per share amounts.
Statement Regarding Forward-Looking Information
The following information contains statements that constitute forward-looking statements within the meaning of Section 27A of the Securities Act of 1933, as amended (the “Securities Act”), and Section 21E of the Securities Exchange Act of 1934, as amended (the “Exchange Act”). These statements generally are characterized by the use of terms such as “may,” “should,” “plan,” “anticipate,” “estimate,” “intend,” “predict,” “believe” and “expect” or the negative of these terms or other comparable terminology. Although we believe that the expectations reflected in such forward-looking statements are based upon reasonable assumptions, our actual results could differ materially from those set forth in the forward-looking statements. Some factors that might cause such a difference include the following: persistent economic weakness at the global or national level, increased direct competition, changes in government regulations or accounting rules, changes in local, national and global capital market conditions, our ability to obtain or maintain credit lines or credit facilities on satisfactory terms, changes in interest rates, availability of proceeds from our offering of shares, our ability to identify suitable investments, our ability to close on identified investments, our ability to obtain or maintain our qualification as a regulated investment company and as a business development company, the ability of our investment adviser and their affiliates to attract and retain highly talented professionals, inaccuracies of our accounting estimates, the ability of our investment adviser to locate suitable borrowers for our loans and the ability of such borrowers to make payments under their respective loans. Given these uncertainties, we caution you not to place undue reliance on such statements, which apply only as of the date hereof. We undertake no obligation to publicly release the results of any revisions to these forward-looking statements that may be made to reflect future events or circumstances or to reflect the occurrence of unanticipated events. The forward-looking statements should be read in light of the risk factors identified in the “Risk Factors” section of our Annual Report on Form 10-K filing for the period ended December 31, 2017 and Item 1A in Part II of this Quarterly Report.
The forward-looking statements and projections contained in this report are excluded from the safe harbor protection provided by Section 27A of the Securities Act and Section 21E of the Exchange Act.
Overview
We are a non-diversified closed-end management investment company that has elected to be treated as a business development company under the Investment Company Act of 1940 Act (as amended, the “1940 Act”). We commenced operations on March 1, 2016 when we satisfied our minimum offering requirement. Formed as a Delaware statutory trust on August 12, 2014, we were externally managed by CNL Fund Advisors II, LLC (“CNL”) and KKR Credit Advisors (US) LLC (“KKR”), (collectively, our “Former Advisor”) through April 8, 2018 under a Former Investment Advisory Agreement and under a Former Administrative Services Agreement (as defined and further described below under “Changes to Advisory Structure and Other Agreements).”
On April 9, 2018, we entered into a new investment advisory agreement (the “Joint Advisor Investment Advisory Agreement”) with FS/KKR Advisor, LLC (the “Joint Advisor”), a newly-formed entity that is jointly operated by KKR and an affiliate of Franklin Square Holdings, L.P. (“FS Investments”). The Joint Advisor
48
Table of Contents
Investment Advisory Agreement replaced the Former Investment Advisory Agreement with KKR and CNL, as further described below under “Changes to Advisory Structure and Other Agreements.” In addition, we entered into a new administrative services agreement with the Joint Advisor (the “Joint Advisor Administrative Services Agreement”), which replaced the Former Administrative Services Agreement between us and CNL, as further described below under “Changes to Advisory Structure and Other Agreements.”
Through April 8, 2018, our Former Advisors were, and commencing April 9, 2018, our Joint Advisor is responsible for sourcing potential investments, conducting due diligence on prospective investments, analyzing investment opportunities, structuring investments, determining the securities and other assets that we purchase, retain or sell and monitoring our portfolio on an ongoing basis, as well as providing the administrative services necessary for our company to operate. Our Former Advisors were, and our Joint Advisor is, registered as investment advisers with the SEC.
We have elected to be taxed as a regulated investment company (“RIC”) under the Internal Revenue Code of 1986 (as amended, the “Code”) and operated in a manner as to qualify for tax treatments applicable to RICs.
Changes to Advisory Structure and Other Agreements
On April 9, 2018, we entered into the Joint Advisor Investment Advisory Agreement, which replaced the Former Investment Advisory Agreement, dated September 24, 2015, by and between us and our Former Advisors. We pay the Joint Advisor a fee for its services under the Joint Advisor Investment Advisory Agreement consisting of two components – a base management fee based on the average value of the Company’s gross assets and an incentive fee based on the Company’s performance. Under the Joint Advisor Investment Advisory Agreement, the base management fee calculation is at an annual rate of 1.50% of the average value of the Company’s gross assets, as compared to the annual rate of 2.00% under the Former Investment Advisory Agreement. Under the Joint Advisor Investment Advisory Agreement, the Joint Advisor serves as our sole investment adviser. The terms of the incentive fee are substantially the same as those under the Former Investment Advisory Agreement.
On April 9, 2018, we also entered into the Joint Advisor Administrative Services Agreement, which replaced the Former Advisor Administrative Services Agreement, dated September 24, 2015, by and between us and CNL (one of our Former Advisors). Under the Joint Advisor Administrative Services Agreement, the Joint Advisor serves as our administrator. The terms of the Joint Advisor Administrative Services Agreement, including the services provided by the Joint Advisor and the amount of reimbursements paid by us for certain administrative expenses, are substantially the same as those of the Former Advisor Administrative Services Agreement.
Concurrently with our entry into the Joint Advisor Investment Advisory Agreement and the Joint Advisor Administrative Services Agreement, on April 9, 2018, we entered into a new expense support and conditional reimbursement agreement with the Joint Advisor (the “Joint Advisor Expense Support Agreement”), which replaced the Fourth Amended and Restated Expense Support and Conditional Reimbursement Agreement, dated January 22, 2018, by and among us and the Former Advisors (the “Former Advisor Expense Support Agreement”). The Joint Advisor Expense Support Agreement, which was substantially similar to the Former Advisor Expense Support Agreement was terminated on November 14, 2018.
On April 5, 2018, in connection with the transition of investment advisory services to the Joint Advisor and due to the January 10, 2018 suspension of our continuous public offering of our common shares (the “Offering”), our board of trustees approved the termination, effective as of April 30, 2018, of (i) the Amended and Restated Managing Dealer Agreement with an affiliate of CNL that became effective on April 28, 2017, and (ii) our amended and restated distribution and shareholder servicing plan that became effective on April 28, 2017. We will not incur any distribution and shareholder servicing fees subsequent to the April 30, 2018 termination of the plan.
49
Table of Contents
Additional information on the above agreements can be located in our Form 8-K filed with the SEC on April 9, 2018.
On April 30, 2018, our Former Advisors agreed to permanently waive our obligation to reimburse the Former Advisors approximately $5,400 in expense support payments not previously reimbursed under our Former Expense Support Agreement. The reimbursement of these amounts had been subject to certain conditions, as described further below in “Capital Resources and Liquidity—Expense Support and Reimbursement Arrangements with Our Former Advisor.”
On April 30, 2018, we also terminated our Offering. In conjunction therewith, the Former Advisors agreed to permanently waive their rights to receive reimbursement of approximately $5,000 of organization and offering expenses to which they had been entitled to collect from us to the extent we reinstated our offering of our common shares, subject to certain conditions, as described further below in “Capital Resources and Liquidity—Expense Support and Reimbursement Arrangements with Our Former Advisor.”
Our Common Stock Offering
In December 2017, in conjunction with approving changes to our advisory structure described above, our board of trustees announced that we would suspend our Offering to new investors and on January 10, 2018, we suspended our Offering. From inception through the suspension of our Offering, we raised gross proceeds of approximately $123.6 million (12.8 million shares) through our Offering, including approximately $3.4 million (0.4 million shares) through our distribution reinvestment plan. Following the suspension of our Offering, we have and will continue to issue shares pursuant to our distribution reinvestment plan. From the suspension of our Offering through September 30, 2018, we issued approximately $2.7 million (0.3 million shares) through our distribution reinvestment plan. We formally terminated our Offering effective April 30, 2018, as described above in “Overview—Changes to Advisory Structure and Other Agreements.”
Investment Objective, Investment Program and Primary Investment Types
Our investment objective is to provide our shareholders with current income and, to a lesser extent, long-term capital appreciation. We pursue our investment objective by investing primarily in the debt of privately owned and thinly traded U.S. companies with a focus on originated transactions sourced through the network of our Joint Advisor. On April 3, 2018, we obtained an amended exemptive order (the “SEC Exemptive Order”) from the SEC extending the co-investment exemptive relief previously granted by the SEC to us in June 2017 to allow us, together with the other business development companies managed by the Joint Advisor, to co-invest in privately negotiated investment transactions with certain other accounts managed by KKR. We define originated transactions as any investment where our investment adviser negotiates the terms of the transaction beyond just the price, which, for example, may include negotiating financial covenants, maturity dates or interest rate terms (the “Directly Originated Transactions”). Additionally, we have the ability to participate in other originated transactions where there may be third parties involved, or a bank acting as an intermediary, for a closely held club, or similar transactions (the “Other Originated Transactions”). We refer to Other Originated Transactions and our Directly Originated Transactions collectively as our “Originated Strategies.” A substantial portion of our portfolio will consist of senior and subordinated debt, which we believe offer potential opportunities for attractive risk-adjusted returns and income generation. Our debt investments may take the form of corporate loans or bonds, may be secured or unsecured and may, in some cases, be accompanied by warrants, options or other forms of equity participation. We may separately purchase common or preferred equity interests in transactions. We may also co-invest with third parties through partnerships, joint ventures or other entities, thereby acquiring jointly controlled or non-controlling interest in certain investments in conjunction with participation by one or more parties in such investment.
Our investment strategy consists of carefully selecting investments through rigorous due diligence and actively managing and monitoring our investment portfolio. When evaluating an investment and the related
50
Table of Contents
portfolio company, we use the resources of our Joint Advisor to develop an investment thesis and a proprietary view of a potential portfolio company’s intrinsic value. We believe our flexible approach to investing allows us to take advantage of opportunities that offer favorable risk/reward characteristics.
We primarily focus on the following investment types:
| • | Senior Debt. We invest in senior debt, in which we generally take a security interest in the available assets of the portfolio company, including equity interests in any of its subsidiaries. These investments generally take the form of senior secured first lien loans, senior secured second lien loans or other senior secured debt. In some circumstances, our lien could be subordinated to claims of other creditors. |
| • | Subordinated Debt. Our subordinated debt investments are generally subordinated to senior debt and are generally unsecured. These investments are generally structured with interest-only payments throughout the life of the security, with the principal due at maturity. |
| • | Equity Investments. We also make selected equity investments. In addition, when we invest in senior and subordinated debt, we may acquire warrants or options to purchase equity securities or benefit from other types of equity participation. Our goal is ultimately to dispose of these equity securities and realize gains upon our disposition of such interests. |
| • | Convertible Securities. We may invest in convertible securities, such as bonds, debentures, notes, preferred stocks or other securities that may be converted into, or exchanged for, a specified amount of common stock of the same or different issuer within a particular period of time at a specified price or formula. |
| • | Investments in Private Investment Funds. We may invest in, or wholly own, private investment funds, including hedge funds, private equity funds, limited liability companies, REITs, and other business entities. In valuing our investments in private investment funds, we rely primarily on information provided by managers of such funds. Valuations of illiquid securities, such as interests in certain private investment funds, involve various judgments and consideration of factors that may be subjective. There is a risk that inaccurate valuations provided by managers of private investment funds could adversely affect the value of our common stock. We may not be able to withdraw our investment in certain private investment funds promptly after we have made a decision to do so, which may result in a loss to us and adversely affect our investment returns. |
| • | Asset Based Finance. We may invest in investments that are primarily collateralized by hard assets, financial assets or investments in specialty finance platforms that provide exposure to hard assets or financial assets. Our asset based finance investments may be in the form of debt, equity, derivatives or private placement funds. |
| • | Derivatives. We may invest in various types of derivatives, including total return swaps, interest rate swaps and foreign currency forward contracts and options. |
| • | Investments with Third-Parties. We may co-invest with third parties through partnerships, joint ventures or other entities, thereby acquiring jointly-controlled or non-controlling interests in certain investments in conjunction with participation by one or more third parties in such investment. Such joint venture partners or third party managers may include former Joint Advisor personnel or associated persons. |
The level of our investment activity can and will vary substantially from period to period depending on many factors, including: the availability of credit to finance investment transactions, the demand for debt from creditworthy privately owned U.S. companies, the level of merger, acquisition and refinancing activity involving private companies, the general economic environment and the competitive investment environment for the types of investments we intend to make.
As a business development company, we are required to comply with certain regulatory requirements. For instance, we may not acquire any assets other than “qualifying assets” as specified in the 1940 Act unless at least 70% of our total assets are qualifying assets as determined at the end of the prior quarter (with certain limited
51
Table of Contents
exceptions). Qualifying assets include investments in “eligible portfolio companies.” Under the relevant SEC rules, the term “eligible portfolio company” includes all U.S. private companies, U.S. companies whose securities are not listed on a national securities exchange, and certain U.S. public companies that have listed their securities on a national securities exchange and have a market capitalization of less than $250 million. These rules also permit us to include as qualifying assets certain follow-on investments in companies that were eligible portfolio companies at the time of initial investment but no longer meet the definition of eligible portfolio company at the time of the follow-on investment.
Revenues
We generate revenue primarily in the form of interest on the debt securities of portfolio companies that we acquire and hold for investment purposes. We expect that our investments in debt securities will generally have an expected maturity of three to ten years, although we have no lower or upper constraint on maturity, and we expect to earn interest at a fixed or floating rate. Interest on our debt securities is generally payable to us quarterly or semi-annually. In some cases, our debt investments may partially defer cash interest payments with payment-in-kind provisions. Any outstanding principal amount of our debt securities and any accrued but unpaid interest will generally become due at the maturity date. In addition, we may generate revenue in the form of dividends from equity investments, prepayment fees, amendment fees, origination fees, and fees for providing significant managerial assistance.
Operating Expenses
Our primary operating expenses include an investment advisory fee, administrative expenses, custodian and accounting fees, other third-party professional services and expenses and, depending on our operating results, performance-based incentive fees. The investment advisory fee and performance-based incentive fees compensate our investment advisers for their services in identifying, evaluating, negotiating, closing and monitoring our investments. As stated above in “Overview—Changes to Advisory Structure and Other Agreements,” in April 2018, we entered into new agreements with the Joint Advisor.
Financial and Operating Highlights
The following tables present financial and operating highlights as of September 30, 2018 and December 31, 2017 and for the nine months ended September 30, 2018 and 2017:
| September 30, 2018 | December 31, 2017 | |||||||
| Total assets |
$ | 194,287 | $ | 175,079 | ||||
| Adjusted total assets (Total assets, net of payable for investments purchased) |
$ | 193,158 | $ | 170,859 | ||||
| Investments in portfolio companies |
$ | 187,482 | $ | 163,911 | ||||
| Borrowings |
$ | 75,471 | $ | 53,000 | ||||
| Net assets |
$ | 115,542 | $ | 116,471 | ||||
| Net asset value per share |
$ | 9.14 | $ | 9.20 | ||||
52
Table of Contents
| Nine Months Ended September 30, |
||||||||
| Activity |
2018 | 2017 | ||||||
| Average net assets |
$ | 116,916 | $ | 85,350 | ||||
| Average borrowings under credit facility |
$ | 63,183 | $ | 4,489 | ||||
| Purchases of investments |
$ | 82,627 | $ | 145,853 | ||||
| Sales, principal payments and other exits |
$ | 59,405 | $ | 54,985 | ||||
| Net investment income |
$ | 5,176 | $ | 2,555 | ||||
| Net realized gains (losses) on investments, foreign currency forward contracts and foreign currency transactions |
$ | 300 | $ | 367 | ||||
| Net change in unrealized appreciation (depreciation) on investments, foreign currency forward contracts and foreign currency translation |
$ | (698 | ) | $ | 315 | |||
| Net increase in net assets resulting from operations |
$ | 4,778 | $ | 3,237 | ||||
| Total distributions declared |
$ | 5,583 | $ | 4,021 | ||||
| Net investment income before unearned incentive fees per share |
$ | 0.40 | $ | 0.29 | ||||
| Net investment income per share |
$ | 0.41 | $ | 0.28 | ||||
| Earnings per share |
$ | 0.38 | $ | 0.35 | ||||
| Distributions declared per share outstanding for the entire period |
$ | 0.44 | $ | 0.44 | ||||
| Nine Months Ended September 30, |
||||||||
| Summary of Common Stock Offering |
2018 | 2017 | ||||||
| Gross proceeds, excluding reinvestment of distributions |
$ | 1,331 | $ | 54,791 | ||||
| Net proceeds to Company, excluding reinvestments of distributions |
$ | 1,270 | $ | 52,231 | ||||
| Reinvestment of distributions |
$ | 2,744 | $ | 2,091 | ||||
| Average net proceeds per share |
$ | 9.29 | $ | 9.33 | ||||
| Shares issued in connection with Offering, excluding reinvestments of distributions |
136,070 | 5,599,058 | ||||||
| Shares issued in connection with reinvestment of distributions |
296,059 | 224,213 | ||||||
Business Environment
Our focus is on Originated Strategy investments because they offer an illiquidity premium over broadly syndicated investments and often have better structures and therefore have attractive risk-adjusted returns today. As of September 30, 2018, 35.1% of total investments at fair market value were in Originated Strategy investments. An additional focus is on senior secured investments, which represented 74.3% of the portfolio and also floating rate investments, which comprised 72.6% of the portfolio as of September 30, 2018. We believe that our investment strategy, and as a closed-ended business development company, offers a route for investors to access these risk adjusted returns over the long-term without being subject to the technical pressures of more broadly syndicated or traded assets.
We believe this has been evident over the first nine months of 2018 as the more broadly syndicated, traditional sub-investment grade credit asset classes exhibited volatility due to fears of a global trade war and a move to quantitative tightening by central banks. For example, during the first six months of 2018, the high yield index returned just 0.08% but during the three months ended September 30, 2018 the same index returned 2.4%. Floating rate loans, which have been less impacted by the more hawkish central banks stance, returned 1.8% and 4.0% during the three and nine months ended September 30, 2018, respectively.
53
Table of Contents
Portfolio and Investment Activity
Portfolio Investment Activity for the three and nine months ended September 30, 2018 and 2017
The following tables summarize our investment activity as of September 30, 2018 and December 31, 2017 and for the three and nine months ended September 30, 2018 and 2017:
| Investment Portfolio | ||||||||
| September 30, 2018 | December 31, 2017 | |||||||
| Total fair value |
$ | 187,482 | $ | 163,911 | ||||
| Number of portfolio companies |
98 | 82 | ||||||
| Number of debt investments |
133 | 94 | ||||||
| Number of equity/other investments |
6 | 4 | ||||||
| Weighted average annual yield of debt investments(1) |
8.8% | 8.6 | % | |||||
| (1) | The weighted average annual yield for our debt investments is computed as (i) the sum of (a) the annual interest rate of each accruing debt investment multiplied by its par amount as of the end of the applicable reporting period, plus (b) the annual accretion (amortization) of any discount/(premium), if any, for each accruing debt investment, divided by (ii) the total amortized cost of all accruing debt investments as of the end of the applicable reporting period. The weighted average yield on our investments does not represent the return to our shareholders, because it does not take into account the impact of leverage, fund expenses or any sales load. For data on investment returns, including the method of calculation, see Note 12. “Financial Highlights” in our unaudited condensed financial statements. |
| Investment Portfolio Activity Summary | ||||||||||||||||
| Three Months Ended September 30, |
Nine Months Ended September 30, |
|||||||||||||||
| 2018 | 2017 | 2018 | 2017 | |||||||||||||
| Purchases of investments: |
||||||||||||||||
| Senior secured loans—first lien |
$ | 2,575 | $ | 35,344 | $ | 38,705 | $ | 88,341 | ||||||||
| Senior secured loans—second lien |
4,624 | 9,364 | 11,792 | 23,067 | ||||||||||||
| Senior secured bonds |
— | 3,541 | 7,934 | 3,541 | ||||||||||||
| Subordinated debt |
1,008 | 15,915 | 19,734 | 28,116 | ||||||||||||
| Asset based finance |
2,936 | — | 4,462 | — | ||||||||||||
| Equity/Other |
— | — | — | 2,788 | ||||||||||||
|
|
|
|
|
|
|
|
|
|||||||||
| Total |
$ | 11,143 | $ | 64,164 | $ | 82,627 | $ | 145,853 | ||||||||
|
|
|
|
|
|
|
|
|
|||||||||
| Sales, principal payments and other exits: |
||||||||||||||||
| Senior secured loans—first lien |
$ | 8,105 | $ | 10,453 | $ | 40,389 | $ | 36,841 | ||||||||
| Senior secured loans—second lien |
2,178 | 2,934 | 10,446 | 9,825 | ||||||||||||
| Senior secured bonds |
68 | — | 2,010 | — | ||||||||||||
| Subordinated debt |
556 | 1,598 | 5,394 | 8,319 | ||||||||||||
| Asset based finance |
1,166 | — | 1,166 | — | ||||||||||||
|
|
|
|
|
|
|
|
|
|||||||||
| Total |
$ | 12,073 | $ | 14,985 | $ | 59,405 | $ | 54,985 | ||||||||
|
|
|
|
|
|
|
|
|
|||||||||
| Portfolio Company Additions |
5 | 20 | 57 | 36 | ||||||||||||
| Portfolio Company Exits |
(9) | (5) | (42) | (20) | ||||||||||||
| Debt Investment Additions |
7 | 26 | 88 | 56 | ||||||||||||
| Debt Investment Exits |
(11) | (14) | (64) | (35) | ||||||||||||
54
Table of Contents
Since obtaining co-investment exemptive relief from the SEC in June 2017, we have increased our focus on Originated Strategies as a main element of our investment strategy. Directly Originated Transactions give us the opportunity to participate in those investments alongside KKR’s institutional clients and proprietary funds and starting in April 2018, our amended SEC Exemptive Order allows us to participate together with other business development companies managed by the Joint Advisor. See “Overview—Investment Objective, Investment Program and Primary Investment Types” above for further information regarding our increased focus on Originated Strategies.
The following summarizes our investment activity associated with our investment focus on new originated debt investments during the nine months ended September 30, 2018 and the status of originated investments held in the Investment Portfolio as of September 30, 2018:
| Directly Originated Transactions Activity |
Nine Months Ended September 30, 2018 |
|||
| Number of investments, by issuer |
22 | |||
| Total amount of investments, at cost(1) |
$ | 29,516 | ||
| Percentage of total investment activity |
35.7% | |||
| Fee income recognized in connection with directly originated investments |
$ | 149 | ||
| Directly Originated Transactions Investment Summary |
September 30, 2018 | |||
| Total investments, at fair value |
$ | 65,848 | ||
| Percentage of total investment portfolio, at fair value |
35.1% | |||
| Weighted average annual yield of debt investments(2)(3) |
9.6% | |||
| (1) | The total amount of investments, at cost, includes new issuers during the reporting periods and any follow-on investments from existing issuers. |
| (2) | The weighted average annual yield on debt investments is based on amortized cost as of the end of the applicable period. The weighted average annual yield for our debt investments is computed as (i) the sum of (a) the annual interest rate of each accruing debt investment multiplied by its par amount as of the end of the applicable reporting period, plus (b) the straight line method annual accretion (amortization) of any discount or (premium), if any, for each accruing debt investment, divided by (ii) the total amortized cost of all accruing debt investments as of the end of the applicable reporting period. |
| (3) | The weighted average annual yield of originated debt investments is higher than what our investors will realize because it does not reflect the impact of leverage, fund expenses or any sales load. Total investment return–net asset value was 4.2% for the nine months ended September 30, 2018, as compared to 4.5% for the nine months ended September 30, 2017. See Note 12. “Financial Highlights” in our unaudited condensed financial statements for information on how such returns were calculated. |
55
Table of Contents
The changes in the fair value of our investment portfolio are directly related to (i) the changes in their cost basis as a result of incremental purchases and (ii) the changes in fair value for assets held at the beginning and end of the period. The net change in unrealized depreciation for the nine months ended September 30, 2018 was $1,007. See “Results of Operations—Net Change in Unrealized Appreciation or Depreciation” below for further details relating to the changes.
| September 30, 2018 | December 31, 2017 | |||||||||||||||
| Asset Category |
Amortized Cost | Fair Value | Amortized Cost | Fair Value | ||||||||||||
| Senior debt |
||||||||||||||||
| Senior secured loans—first lien |
$ | 93,233 | $ | 92,646 | $ | 93,789 | $ | 93,689 | ||||||||
| Senior secured loans—second lien |
34,437 | 34,402 | 32,887 | 33,342 | ||||||||||||
| Senior secured bonds |
12,004 | 12,207 | 6,018 | 6,060 | ||||||||||||
|
|
|
|
|
|
|
|
|
|||||||||
| Total senior debt |
$ | 139,674 | $ | 139,255 | $ | 132,694 | $ | 133,091 | ||||||||
| Subordinated debt |
37,817 | 38,151 | 23,515 | 23,970 | ||||||||||||
| Asset based finance |
5,985 | 5,852 | 2,689 | 2,682 | ||||||||||||
| Equity/Other |
4,078 | 4,224 | 4,078 | 4,168 | ||||||||||||
|
|
|
|
|
|
|
|
|
|||||||||
| Total |
$ | 187,554 | $ | 187,482 | $ | 162,976 | $ | 163,911 | ||||||||
|
|
|
|
|
|
|
|
|
|||||||||
The weighted average yield on debt investments at amortized cost held in our investment portfolio as of September 30, 2018 and December 31, 2017 were as follows:
| Asset Category |
September 30, 2018 | December 31, 2017 | ||
| Senior debt(1) |
||||
| Senior secured loans—first lien |
8.6% | 8.4% | ||
| Senior secured loans—second lien |
10.6% | 10.0% | ||
| Senior secured bonds |
7.3% | 7.4% | ||
| Subordinated debt(1) |
7.9% | 7.6% |
| (1) | The weighted average yield on debt investments is based on amortized cost as of the end of the applicable period. The weighted average yield for our debt investments is computed as (i) the sum of (a) the annual interest rate of each accruing debt investment multiplied by its par amount as of the end of the applicable reporting period, plus (b) the annual accretion (amortization) of any discount or (premium), if any, for each accruing debt investment, divided by (ii) the total amortized cost of all accruing debt as of the end of the applicable reporting period. The weighted average annual yield on our investments does not represent the return to our shareholders because it does not take into account the impact of leverage, fund expenses or any sales load. For data on investment returns, including the method of calculation, see Note 12. “Financial Highlights” in our unaudited condensed financial statements. |
56
Table of Contents
The following table presents a summary of interest rate and maturity statistics for the debt investments, based on par value, in our investment portfolio as of September 30, 2018 and December 31, 2017:
| Floating interest rate debt investments: | September 30, 2018 | December 31, 2017 | ||
| Percent of debt portfolio |
72.6% | 81.7% | ||
| Percent of floating rate debt investments with interest rate floors |
87.7% | 99.5% | ||
| Weighted average interest rate floor |
1.0% | 1.0% | ||
| Weighted average coupon spread to base rate |
635 bps | 612 bps | ||
| Weighted average years to maturity |
4.8 | 5.0 | ||
| Fixed interest rate debt investments: | ||||
| Percent of debt portfolio |
27.4% | 18.3% | ||
| Weighted average coupon rate |
8.2% | 7.9% | ||
| Weighted average years to maturity |
5.6 | 6.0 |
All of our floating interest rate debt investments have base rate reset frequencies of less than twelve months with the majority resetting at least quarterly. USD three-month LIBOR, the most prevalent index employed among our floating interest rate debt investments, ranged between 1.69% and 2.40%, and 1.00% and 1.33% during the nine months ended September 30, 2018 and 2017, respectively, and was 2.40% and 1.69% on September 30, 2018 and December 31, 2017, respectively. Base rate resets for floating interest rate investments will only result in interest income increases when the reset base interest rate exceeds the associated interest rate floor.
Our weighted average annual yield on debt investments was 8.8%, as based on amortized cost, as of September 30, 2018, as compared to 8.6% as of December 31, 2017. The weighted average yield on debt investments is higher than what our investors will realize because it does not reflect our expenses or any sales load. Total investment return–net asset value was 4.2% for the nine months ended September 30, 2018, as compared to 4.5% for the nine months ended September 30, 2017. See Note 12. “Financial Highlights” in our unaudited condensed financial statements for information on how such returns were calculated.
The following table shows the credit ratings of the investments in our investment portfolio, based upon the rating scale of Standard & Poor’s Ratings Services, as of September 30, 2018 and December 31, 2017:
| September 30, 2018 | December 31, 2017 | |||||||||||||||
| Standard & Poor’s Rating | Fair Value | Percentage of Portfolio |
Fair Value | Percentage of Portfolio |
||||||||||||
| BB+ |
$ | 7 | 0.0% | $ | — | —% | ||||||||||
| BB |
203 | 0.1% | — | —% | ||||||||||||
| BB- |
2,721 | 1.5% | 4,227 | 2.6% | ||||||||||||
| B+ |
1,283 | 0.7% | 5,251 | 3.2% | ||||||||||||
| B |
23,889 | 12.7% | 38,142 | 23.3% | ||||||||||||
| B- |
33,911 | 18.1% | 30,787 | 18.8% | ||||||||||||
| CC |
1,968 | 1.0% | — | —% | ||||||||||||
| CCC+ |
36,247 | 19.3% | 32,582 | 19.9% | ||||||||||||
| CCC |
16,773 | 9.0% | 14,501 | 8.8% | ||||||||||||
| CCC- |
5,264 | 2.8% | 838 | 0.5% | ||||||||||||
| Not Rated |
65,216 | 34.8% | 37,583 | 22.9% | ||||||||||||
|
|
|
|
|
|
|
|
|
|||||||||
| Total |
$ | 187,482 | 100.0% | $ | 163,911 | 100.0% | ||||||||||
|
|
|
|
|
|
|
|
|
|||||||||
57
Table of Contents
As of September 30, 2018, we had two debt investments (both originated investments) held in our investment portfolio with par values of €1.2 million and $1.2 million, respectively, that featured a PIK interest provision for some or all of the portfolio company’s interest payment obligation. As of September 30, 2018, both of our investments had active PIK elections. There was $75 of PIK interest income activity for the nine months ended September 30, 2018. As of December 31, 2017, we did not have any debt investments which featured PIK interest provisions. There was no PIK interest income activity for the nine months ended September 30, 2017.
The following table presents a summary of our investment portfolio arranged by industry classifications of the portfolio companies as of September 30, 2018 and December 31, 2017:
| September 30, 2018 | December 31, 2017 | |||||||||||||||
| Industry Classification | Fair Value | Percentage of Portfolio |
Fair Value | Percentage of Portfolio |
||||||||||||
| Automobiles & Components |
$ | 1,013 | 0.5% | $ | — | —% | ||||||||||
| Capital Goods |
41,170 | 22.0% | 24,454 | 14.9% | ||||||||||||
| Commercial & Professional Services |
7,279 | 3.9% | 9,573 | 5.9% | ||||||||||||
| Consumer Durables & Apparel |
2,105 | 1.1% | 1,030 | 0.6% | ||||||||||||
| Consumer Services |
13,063 | 7.0% | 9,140 | 5.6% | ||||||||||||
| Diversified Financials |
1,516 | 0.8% | 2,683 | 1.6% | ||||||||||||
| Energy |
2,952 | 1.6% | — | —% | ||||||||||||
| Food & Staples Retailing |
736 | 0.4% | 1,129 | 0.7% | ||||||||||||
| Food, Beverage & Tobacco |
4,846 | 2.6% | 173 | 0.1% | ||||||||||||
| Health Care Equipment & Services |
14,676 | 7.8% | 9,258 | 5.7% | ||||||||||||
| Insurance |
3,903 | 2.1% | 1,291 | 0.8% | ||||||||||||
| Materials |
20,957 | 11.2% | 24,161 | 14.8% | ||||||||||||
| Media |
11,144 | 5.9% | 7,662 | 4.7% | ||||||||||||
| Pharmaceuticals, Biotechnology & Life Sciences |
1,497 | 0.8% | 1,674 | 1.0% | ||||||||||||
| Retailing |
15,011 | 8.0% | 20,890 | 12.7% | ||||||||||||
| Semiconductors & Semiconductor Equipment |
3,281 | 1.8% | 3,325 | 2.0% | ||||||||||||
| Software & Services |
33,458 | 17.8% | 35,940 | 21.9% | ||||||||||||
| Technology Hardware & Equipment |
824 | 0.4% | 1,362 | 0.8% | ||||||||||||
| Telecommunication Services |
487 | 0.3% | — | —% | ||||||||||||
| Transportation |
7,564 | 4.0% | 10,166 | 6.2% | ||||||||||||
|
|
|
|
|
|
|
|
|
|||||||||
| Total |
$ | 187,482 | 100.0% | $ | 163,911 | 100.0% | ||||||||||
|
|
|
|
|
|
|
|
|
|||||||||
All investments held at September 30, 2018 were denominated in U.S. dollars except for six investments, which were denominated in Canadian dollars, Euros and British pound sterling and represented 4.1% of the investment portfolio. All investments held at December 31, 2017 were denominated in U.S. dollars except for one investment, which was denominated in Canadian dollars and represented 2.7% of the investment portfolio.
Capital Resources and Liquidity
Sources and Uses of Capital
On September 29, 2014, we filed our registration statement with the SEC to register our Offering and on October 9, 2015 we commenced our Offering. In connection with the termination of our Offering, we terminated the Managing Dealer Agreement and the Distribution and Shareholder Servicing Plan effective April 30, 2018 as described above in “Overview—Changes to Advisory Structure and Other Agreements.”
58
Table of Contents
As described above in “Overview—Our Common Stock Offering,” our board of trustees suspended our Offering to new investors effective January 10, 2018. On April 30, 2018, we formally terminated our Offering.
Our capital resources and liquidity are primarily derived from (i) cash flows from operations, including sales and repayments, (ii) our distribution reinvestment plan, (iii) borrowings under our credit facility and (iv) prior to the suspension of our Offering on January 10, 2018, from equity capital proceeds from our Offering. Our primary uses of funds include (i) investments in portfolio companies, (ii) distributions to our shareholders, (iii) repurchases under our share repurchase program, (iv) interest payments on borrowings under our credit facility and (v) operating expenses. We expect to use proceeds from the sales and repayments of our investment portfolio and proceeds from borrowings under our credit facility to finance our investment activities at our discretion.
Liquidity
As of September 30, 2018, we had approximately $3,122 in cash and foreign currency.
We raised approximately $4,014 and $54,322 (432,129 and 5,823,271 shares of common stock), including dividends reinvested of $2,744 and $2,091 (296,059 and 224,213 shares of common stock) during the nine months ended September 30, 2018 and 2017, respectively. Distributions reinvested in the Company as a percentage of total distributions declared and distributions reinvested for the nine months ended September 30, 2018 and 2017 was 49% and 52%, respectively. In addition, proceeds from sales of investments and principal payments totaled $59,405 and $54,985, during the nine months ended September 30, 2018 and 2017, respectively. Based on the aggregate principal amount and the collateral in place, we could borrow an additional $6,529 under our Revolving Credit Facility as of September 30, 2018.
From January 2018 through the suspension of our Offering on January 10, 2018, we received additional net proceeds of approximately $1,270 (136,070 shares of common stock) from our Offering. Following the suspension of our Offering, we have and will continue to issue shares pursuant to our distribution reinvestment plan. From the suspension of our Offering through September 30, 2018, we had issued approximately $2,744 (296,059 shares of common stock) through our distribution reinvestment plan. During the period from October 1, 2018 to November 9, 2018, we issued an additional $334 (36,887 shares of common stock) pursuant to our distribution reinvestment plan.
Borrowings
On July 14, 2017, we entered into a senior secured revolving credit agreement (the “Credit Agreement”). The Credit Agreement provides for a revolving credit facility (the “Revolving Credit Facility”) consisting of loans to be made in dollars and other foreign currencies in an initial aggregate principal amount of up to $70,000. Availability under the Revolving Credit Facility will terminate on July 14, 2019 (the “Revolver Termination Date”) and the outstanding loans under the Revolving Credit Facility will mature on July 14, 2020. On June 11, 2018, we entered into an incremental commitment agreement with ING Capital LLC to increase the total borrowing capacity under the Revolving Credit Facility to $82,000.
The Revolving Credit Facility also requires mandatory prepayment of interest and principal upon certain events during the term-out period commencing on the Revolver Termination Date. The stated borrowing rate under the Revolving Credit Facility is based on LIBOR or with respect to borrowings in foreign currencies on a base rate applicable to such currency borrowings plus an applicable spread of 2.75%, or on an “alternate base rate” (as defined in the Credit Agreement). The Revolving Credit Facility includes an “accordion” feature that allows us, under certain circumstances, to increase the size of the facility to a maximum of $200,000. Under the Revolving Credit Facility, we have made certain representations and warranties and are required to comply with various covenants, reporting requirements and other customary requirements for similar revolving credit
59
Table of Contents
facilities. During the nine months ended September 30, 2018, we borrowed approximately $53,068 and repaid approximately $30,398 on our Revolving Credit Facility. We have and will continue to use proceeds from borrowings to make investments in portfolio companies.
Our total all-in cost of financing, including the amortization of fees and expenses, was 5.0% for the nine months ended September 30, 2018, as compared to 10.1% for the nine months ended September 30, 2017.
Share Repurchase Program
Subject to the discretion of our trustees, we intend to conduct tender offers on approximately 10% of our weighted average number of outstanding shares in any 12-month period to allow shareholders to tender shares to us on a quarterly basis at a specific offer price that is determined based upon our net asset value as of the last date of the prior quarter prior to the initiation of each tender offer program. We intend to limit repurchases during any calendar year to the number of shares of common stock we can repurchase with the proceeds we receive under our distribution reinvestment plan. Our share repurchase program includes numerous restrictions that limit your ability to sell your shares.
On October 1, 2018, we repurchased approximately 197,598 shares (representing 65% of the common shares tendered for repurchase) at $9.08 per share for aggregate consideration totaling $1,794.
Commitments and Contingencies
See Note 11. “Commitments and Contingencies” in our unaudited condensed financial statements for information on our commitments and contingencies as of September 30, 2018.
Distributions to Shareholders
We currently declare distributions monthly and pay distributions monthly to our shareholders in the form of cash. Shareholders may elect to reinvest their distributions as additional shares of our common stock under our distribution reinvestment plan. Dividends are taxable to our shareholders even if they are reinvested in additional shares of our common stock. The following table reflects the cash distributions per share and the total amount of distributions that we have declared on our common stock during the nine months ended September 30, 2018 and 2017:
| Quarter Ended: |
Per Share | Amount | ||||||||||||||
| March 31, 2018 |
$ | 0.146250 | $ | 1,868 | ||||||||||||
| June 30, 2018 |
0.146250 | 1,876 | ||||||||||||||
| September 30, 2018 |
0.146250 | 1,839 | ||||||||||||||
|
|
|
|
|
|
| |||||||||||
| $ | 0.438750 | $ | 5,583 | |||||||||||||
|
|
|
|
|
|
| |||||||||||
| Quarter Ended: |
||||||||||||||||
| March 31, 2017 |
$ | 0.146250 | $ | 1,021 | ||||||||||||
| June 30, 2017 |
0.146250 | 1,394 | ||||||||||||||
| September 30, 2017 |
0.146250 | 1,606 | ||||||||||||||
|
|
|
|
|
|
| |||||||||||
| $ | 0.438750 | $ | 4,021 | |||||||||||||
|
|
|
|
|
|
| |||||||||||
Approximately 49% and 52% of the distributions declared during the nine months ended September 30, 2018 and 2017, respectively, were reinvested in shares of our common stock by participants in our distribution reinvestment plan and the reinvested distributions represent an additional source of capital to us. See Note 7. “Distributions” in our unaudited condensed financial statements for additional disclosures on distributions.
60
Table of Contents
We do not expect to use equity capital to pay distributions to shareholders in the future. We routinely disclose the sources of funds used to pay distributions to our shareholders in periodic reports that accompany (i) quarterly account statements and (ii) monthly distribution checks that are prepared and sent directly by our transfer agent to our shareholders. See Note 7. “Distributions” in our unaudited condensed financial statements for a discussion of the sources of funds used to pay distributions on a GAAP basis for the periods presented.
On October 26, 2018, our board of trustees declared distributions for November through December 2018, which have been or will be recorded and paid monthly. Based on our regular monthly cash distribution amount of $0.04875 per share and our distribution reinvestment price of $9.14 as of September 30, 2018, the annualized distribution rate to shareholders as of September 30, 2018 was 6.4%. The annualized distribution rate should not be interpreted to be a measure of our current or future performance. It is anticipated that these distributions, in the aggregate, will be substantially supported by our taxable income and the sources of distributions will be disclosed in our regular financial reports.
Expense Support and Reimbursement Arrangements with Our Former Advisors
The Former Advisors incurred on our behalf organization and offering expenses totaling approximately $5,400 as of March 31, 2018. Under the terms of our Former Advisors Investment Advisory Agreement with our Former Advisors, they were entitled to receive up to 1.5% of gross proceeds raised in our Offering until all organization and offering costs funded by our Former Advisors or their affiliates had been recovered. Offering expenses consisted of costs incurred by our Former Advisors and their affiliates on our behalf for legal, accounting, printing and other offering expenses, including costs associated with technology integration between our systems and those of our participating broker-dealers, permissible due diligence reimbursements, marketing expenses, salaries and direct expenses of our Former Advisors’ employees, employees of their affiliates and others while engaged in registering and marketing the shares, which included development of marketing materials and marketing presentations and training and educational meetings and generally coordinating the marketing process for us. Our Former Advisors were responsible for the payment of our organization and offering expenses to the extent that these expenses exceeded 1.5% of the gross proceeds from the Offering, without recourse against or reimbursement by us.
We terminated our Offering effective April 30, 2018 and in conjunction therewith, the Former Advisors agreed to permanently waive their rights to receive reimbursement of approximately $5,000 of organization and offering expenses that they incurred on our behalf and had not been reimbursed.
We were a party to the Former Advisors Expense Support Agreement with the Former Advisors pursuant to which the Former Advisors jointly and severally agreed to pay to us some or all of our operating expenses (an “Expense Support Payment”) for each month during the Expense Support Payment Period (as defined below) in which our board of trustees declared a distribution to its shareholders. Expense Support Payments were made in accordance with the terms of the Former Advisors Expense Support Agreement. The “Expense Support Payment Period” commenced on March 1, 2016 and terminated effective with the termination of the Former Advisors Expense Support Agreement on April 9, 2018.
As described above in “Overview—Changes to Advisory Structure and Other Agreements,” on April 9, 2018, we entered into a new Joint Advisor Expense Support Agreement with the new Joint Advisor, which replaced the Former Advisors Expense Support Agreement. The Joint Advisor Expense Support Agreement is substantially similar to the Former Advisors Expense Support Agreement. On April 30, 2018, our Former Advisors agreed to permanently waive our obligation to reimburse the Former Advisors approximately $5,400 in Expense Support Payments not previously reimbursed under our Former Advisors Expense Support Agreement.
Results of Operations
As of September 30, 2018, the fair value of our investment portfolio totaled $187,482. The majority of our investments at September 30, 2018 consisted of debt investments. See the section entitled “Portfolio and
61
Table of Contents
Investment Activity” above for a discussion of the general terms and characteristics of our investments, and for information regarding investment activities during the nine months ended September 30, 2018 and 2017.
The following is a summary of our operating results for the three and nine months ended September 30, 2018 and 2017:
| Three Months Ended September 30, |
Nine Months Ended September 30, | |||||||||||||||||||
| 2018 | 2017 | 2018 | 2017 | |||||||||||||||||
| Total investment income |
$ | 4,245 | $ | 2,542 | $ | 11,772 | $ | 5,566 | ||||||||||||
| Net operating expenses(1) |
2,507 | 1,543 | 6,596 | 3,011 | ||||||||||||||||
|
|
|
|
|
|
|
|
|
|
|
|
| |||||||||
| Net investment income |
1,738 | 999 | 5,176 | 2,555 | ||||||||||||||||
|
|
|
|
|
|
|
|
|
|
|
|
| |||||||||
| Net realized gains |
91 | 60 | 300 | 367 | ||||||||||||||||
| Net change in unrealized appreciation (depreciation) |
831 | 487 | (698 | ) | 315 | |||||||||||||||
|
|
|
|
|
|
|
|
|
|
|
|
| |||||||||
| Net increase (decrease) in net assets resulting from operations |
$ | 2,660 | $ | 1,546 | $ | 4,778 | $ | 3,237 | ||||||||||||
|
|
|
|
|
|
|
|
|
|
|
|
| |||||||||
| (1) | Net of expense support of $44 and $606 for the three months ended September 30, 2018 and 2017, respectively, and $625 and $1,866 for the nine months ended September 30, 2018 and 2017, respectively. |
Investment income
Investment income consisted of the following for the three and nine months ended September 30, 2018 and 2017:
| Three Months Ended September 30, |
Nine Months Ended September 30, | |||||||||||||||||||
| 2018 | 2017 | 2018 | 2017 | |||||||||||||||||
| Interest income |
$ | 4,173 | $ | 2,203 | $ | 11,377 | $ | 5,181 | ||||||||||||
| Fee income |
52 | 339 | 348 | 385 | ||||||||||||||||
| Dividend and other income |
20 | — | 47 | — | ||||||||||||||||
|
|
|
|
|
|
|
|
|
|
|
|
| |||||||||
| Total investment income |
$ | 4,245 | $ | 2,542 | $ | 11,772 | $ | 5,566 | ||||||||||||
|
|
|
|
|
|
|
|
|
|
|
|
| |||||||||
As of September 30, 2018, our weighted average annual yield on our accruing debt investments was 8.8% based on amortized cost, as defined above in “Portfolio and Investment Activity.” The weighted average annual yield on debt investments is higher than what our investors will realize because it does not reflect our expenses or any sales load. As of September 30, 2018, approximately 72.6% of our debt investments had floating rate interest; therefore, changes in interest rates could have a material impact on our interest income in the future. The increase in interest income was due primarily to the growth of our portfolio of investments. Our fee income consists of transaction-based fees and is non-recurring.
See Item 3. “Quantitative and Qualitative Disclosures about Market Risk” for further information on the impact interest rate changes could have on our results of operations.
62
Table of Contents
Operating expenses
Our operating expenses for the three and nine months ended September 30, 2018 and 2017 were as follows:
| Three Months Ended September 30, |
Nine Months Ended September 30, | |||||||||||||||
| 2018 | 2017 | 2018 | 2017 | |||||||||||||
| Investment advisory fees |
$ | 724 | $ | 629 | $ | 2,295 | $ | 1,520 | ||||||||
| Professional services |
247 | 65 | 654 | 496 | ||||||||||||
| Administrative services |
128 | 327 | 780 | 720 | ||||||||||||
| Custodian and accounting fees |
84 | 89 | 253 | 243 | ||||||||||||
| Interest expense |
977 | 326 | 2,350 | 326 | ||||||||||||
| Trustee fees and expenses |
72 | 52 | 200 | 155 | ||||||||||||
| Insurance |
41 | 42 | 122 | 123 | ||||||||||||
| Performance-based incentive fees |
185 | 109 | (79 | ) | 136 | |||||||||||
| Distribution and shareholder servicing fees |
— | 252 | 376 | 687 | ||||||||||||
| Offering expense |
— | 91 | 20 | 91 | ||||||||||||
| Organization expenses |
— | 117 | — | 205 | ||||||||||||
| Other |
93 | 50 | 250 | 175 | ||||||||||||
|
|
|
|
|
|
|
|
|
|
|
|
| |||||
| Total operating expenses |
2,551 | 2,149 | 7,221 | 4,877 | ||||||||||||
| Expense support |
(44 | ) | (606 | ) | (625 | ) | (1,866 | ) | ||||||||
|
|
|
|
|
|
|
|
|
|
|
|
| |||||
| Net operating expenses |
$ | 2,507 | $ | 1,543 | $ | 6,596 | $ | 3,011 | ||||||||
|
|
|
|
|
|
|
|
|
|
|
|
| |||||
Organization and offering expenses
Organization expenses and other operating expenses relating to the formation of the Company were expensed on our statements of operations to the extent they are eligible for reimbursement to the Former Advisors, as described above under “Capital Resources and Liquidity—Expense Support and Reimbursement Arrangements with Our Former Advisors.” Offering expenses were capitalized on our statements of assets and liabilities as deferred offering expenses and expensed to our statements of operations over a 12-month period, however, the deferral period did not exceed 12 months from the date our Former Advisors incurred the offering expenses.
Effective April 30, 2018, we terminated the Distribution and Shareholder Servicing Plan, as described above in “Overview—Changes to Advisory Structure and Other Agreements” and will not incur any distribution and shareholder servicing fees subsequent to April 30, 2018. In addition, effective April 30, 2018, we formally terminated our Offering, which we had suspended effective January 10, 2018, and will not incur any offering expenses going forward.
63
Table of Contents
Net realized gains or losses
For the three and nine months ended September 30, 2018 and 2017, net realized gains (losses) consisted of the following:
| Three Months Ended September 30, |
Nine Months Ended September 30, | |||||||||||||||
| 2018 | 2017 | 2018 | 2017 | |||||||||||||
| Net realized gains (losses) on: |
||||||||||||||||
| Investments |
$ | 101 | $ | 57 | $ | 332 | $ | 361 | ||||||||
| Foreign currency forward contracts |
— | — | (1 | ) | — | |||||||||||
| Foreign currency transactions |
(10 | ) | 3 | (31 | ) | 6 | ||||||||||
|
|
|
|
|
|
|
|
|
|
|
|
| |||||
| Total net realized gains (losses) |
$ | 91 | $ | 60 | $ | 300 | $ | 367 | ||||||||
|
|
|
|
|
|
|
|
|
|
|
|
| |||||
Net change in unrealized appreciation or depreciation
For the three and nine months ended September 30, 2018 and 2017, net change in unrealized appreciation (depreciation) consisted of the following:
| Three Months Ended September 30, |
Nine Months Ended September 30, | |||||||||||||||
| 2018 | 2017 | 2018 | 2017 | |||||||||||||
| Net change in unrealized appreciation (depreciation) on: |
||||||||||||||||
| Investments |
$ | 875 | $ | 410 | $ | (1,007 | ) | $ | 233 | |||||||
| Foreign currency forward contracts |
(71 | ) | 77 | 112 | 77 | |||||||||||
| Foreign currency translation |
27 | — | 197 | 5 | ||||||||||||
|
|
|
|
|
|
|
|
|
|
|
|
| |||||
| Total net change in unrealized appreciation (depreciation) |
$ | 831 | $ | 487 | $ | (698 | ) | $ | 315 | |||||||
|
|
|
|
|
|
|
|
|
|
|
|
| |||||
For the three and nine months ended September 30, 2018 and 2017, net change in unrealized appreciation (depreciation) on investments consisted of the following:
| Three Months Ended September 30, |
Nine Months Ended September 30, | |||||||||||||||
| 2018 | 2017 | 2018 | 2017 | |||||||||||||
| Net change in unrealized appreciation (depreciation) on investments: |
||||||||||||||||
| Unrealized appreciation |
$ | 10 | $ | 646 | $ | 285 | $ | 1,048 | ||||||||
| Unrealized depreciation |
865 | (236 | ) | (1,292 | ) | (815 | ) | |||||||||
|
|
|
|
|
|
|
|
|
|
|
|
| |||||
| Total net change in unrealized appreciation (depreciation) |
$ | 875 | $ | 410 | $ | (1,007 | ) | $ | 233 | |||||||
|
|
|
|
|
|
|
|
|
|
|
|
| |||||
Approximately 4.1% of our investment portfolio, measured at fair value, is denominated in foreign currencies. Such investments expose our portfolio to the risk that the value of the investments will be affected by changes in exchange rates between the currency in which the investments are denominated and the currency in which the investments are made. Our practice is to minimize these risks in certain cases by employing hedging techniques, including using foreign exchange forward contracts, to reduce exposure to changes in exchange rates when a meaningful amount of capital has been invested in foreign currencies. We do not, however, hedge our currency exposure in all currencies or all investments.
64
Table of Contents
The success of our hedging transactions will depend on our ability to correctly predict movements in currencies and interest rates. Therefore, while we may enter into such transactions to seek to reduce currency exchange rate and interest rate risks, unanticipated changes in currency exchange rates or interest rates may result in poorer overall investment performance than if we had not engaged in any such hedging transactions. In addition, the degree of correlation between price movements of the instruments used in a hedging strategy and price movements in the portfolio positions being hedged may vary. Moreover, for a variety of reasons, we may not seek to (or be able to) establish a perfect correlation between such hedging instruments and the portfolio holdings being hedged. Any such imperfect correlation may prevent us from achieving the intended hedge and expose us to risk of loss. In addition, it may not be possible to hedge fully or perfectly against currency fluctuations affecting the value of securities denominated in non-U.S. currencies because the value of those securities is likely to fluctuate as a result of factors not related to currency fluctuations.
We are not aware of any material trends or uncertainties, favorable or unfavorable, that may be reasonably anticipated to have a material impact on either capital resources or the revenues or income to be derived from our investments, other than those described above, the risk factors, if any, identified in Part II, Item 1A of this report, and the “Management’s Discussion and Analysis of Financial Condition and Results of Operations.”
Net investment income and adjusted net investment income
Our net investment income totaled $1,738 ($0.14 per share) and $5,176 ($0.41 per share) for the three and nine months ended September 30, 2018, respectively. We accrue estimated performance-based incentive fees with respect to any net realized and unrealized appreciation in our investment portfolio. The performance-based incentive fees are treated as an operating expense and therefore are a deduction in calculating our net investment income on a GAAP basis. However, our net realized and unrealized appreciation on our investment portfolio that partly determines these fees are not included in net investment income. Therefore, in order to evaluate our net investment income without regard to realized and unrealized appreciation in our investment portfolio, including the impact of related accrued performance-based fees, we have developed a supplemental, non-GAAP measure, which we refer to as “adjusted net investment income,” which presents net investment income before the effects of unearned performance-based incentive fees. Adjusted net investment income is also impacted by the Expense Support Payments and reimbursements.
We believe that adjusted net investment income is useful to assess the sustainability of our distributions and operating performance. Adjusted net investment income is not necessarily indicative of cash flows available to fund cash needs and should not be considered as an alternative to net investment income as an indication of our performance, as an alternative to cash flows from operations as an indication of our liquidity, or indicative of funds available to fund our cash needs including our ability to make future distributions to our shareholders. Adjusted net investment income should not be construed as a historic performance measure or as more relevant or accurate than the current GAAP methodology in calculating net investment income and its applicability in evaluating our operating performance.
65
Table of Contents
The following table presents a reconciliation of our net investment income to adjusted net investment income for the three and nine months ended September 30, 2018 and 2017:
| Three Months Ended September 30, |
Nine Months Ended September 30, | |||||||||||||||
| 2018 | 2017 | 2018 | 2017 | |||||||||||||
| Net investment income (GAAP) |
$ | 1,738 | $ | 999 | $ | 5,176 | $ | 2,555 | ||||||||
| Deduct: Expense support |
(44 | ) | (606 | ) | (625 | ) | (1,866 | ) | ||||||||
| Add: Estimated unearned performance-based incentive fees |
185 | 109 | (79 | ) | 136 | |||||||||||
|
|
|
|
|
|
|
|
|
|
|
|
| |||||
| Adjusted net investment income (non-GAAP) |
$ | 1,879 | $ | 502 | $ | 4,472 | $ | 825 | ||||||||
|
|
|
|
|
|
|
|
|
|
|
|
| |||||
| Net investment income per share (GAAP) |
$ | 0.14 | $ | 0.09 | $ | 0.41 | $ | 0.28 | ||||||||
|
|
|
|
|
|
|
|
|
|
|
|
| |||||
| Adjusted net investment income per share (non-GAAP) |
$ | 0.15 | $ | 0.05 | $ | 0.35 | $ | 0.09 | ||||||||
|
|
|
|
|
|
|
|
|
|
|
|
| |||||
Net Assets, Net Asset Value per Share, Annual Investment Return and Total Return Since Inception
Net assets decreased $929 and increased $53,538 during the nine months ended September 30, 2018 and 2017, respectively. During the nine months ended September 30, 2018, the decrease in net assets was attributable to distributions to shareholders of $5,583 and the decrease in capital transactions of $124. Our overall decrease in net assets for the nine months ended September 30, 2018 was partially offset by the increase in net assets resulting from operations of $4,778. During the nine months ended September 30, 2017, the increase in net assets was attributable to capital transactions of $54,322, including net proceeds from the issuance of shares of common stock, and the increase in net assets resulting from operations of $3,237. Our overall increase in net assets for the nine months ended September 30, 2017 was partially offset by distributions to shareholders of $4,021.
Our net asset value per share was $9.14 and $9.23 on September 30, 2018 and 2017, respectively. After considering (i) the overall changes in net asset value per share, (ii) distributions paid of approximately $0.44 and $0.44 per share during the nine months ended September 30, 2018 and 2017, respectively, and (iii) the assumed reinvestment of those distributions at 95.25% of the prevailing offering price per share, the total investment return–net asset value was 4.2% and 4.5% (not annualized) for shareholders who held our shares over the entire nine months ended September 30, 2018 and 2017, respectively.
66
Table of Contents
Initial shareholders who subscribed to our initial offering in March 2016 with an initial investment of $10,000 and an initial purchase price equal to $9.45 per share (public offering price including all sales load and distribution and shareholder servicing fee) have seen the value of their investment grow by 13.90% (see chart below). Initial shareholders who subscribed to the initial offering in March 2016 with an initial investment of $10,000 and an initial purchase price equal to $9.00 per share (the initial public offering price excluding sales load and distribution and shareholder servicing fee) have registered a total investment return of 22.47% (see chart below). The S&P/LSTA Leveraged Loan Index, a primary measure of senior debt covering the U.S. leveraged loan market, which currently consists of approximately 1,100 credit facilities throughout numerous industries, and the Merrill Lynch US High Yield Master II Index, a primary measure of subordinated debt consisting of approximately 2,000 high yield corporate bonds, registered cumulative total returns of approximately 20.65% and 29.85%, respectively, in the period from March 1, 2016 to September 30, 2018.
Growth of $10,000 Initial Investment(1)
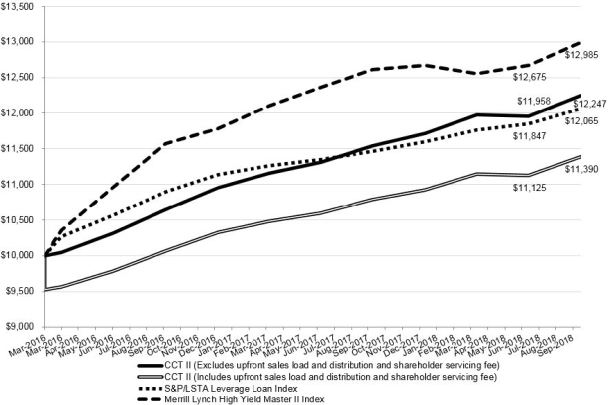
| (1) | Cumulative performance: March 1, 2016 to September 30, 2018 |
The calculations for the Growth of $10,000 Initial Investment in the shares of our common stock are based upon (i) an initial investment of $10,000 in our common stock at the beginning of the period at a share price of $9.45 per share (including sales load and distribution and shareholder servicing fees) and $9.00 per share (excluding sales load and distribution and shareholder servicing fees), (ii) assumed reinvestment of monthly distributions in accordance with our distribution reinvestment plan, (iii) the sale of the entire investment position at the net asset value per share on the last day of the period; and (iv) distributions payable, if any, on the last day of the period.
Our shares are illiquid investments for which there is currently not a secondary market. You should not expect to be able to resell your shares regardless of how we perform. If you are able to sell your shares, you will
67
Table of Contents
likely receive less than your purchase price. Our net asset value and annualized returns – which are based in part upon determinations of fair value of Level 3 investments by our board of trustees, not active market quotations – are inherently uncertain. Past performance is not a guarantee of future results.
Critical Accounting Policies and Estimates
Our discussion and analysis of our financial condition and results of operations are based upon our unaudited condensed financial statements which have been prepared in accordance with GAAP. The preparation of our unaudited condensed financial statements requires management to make estimates and assumptions that affect the reported amounts of assets, liabilities, revenues and expenses. Note 2. “Significant Accounting Policies” to our unaudited condensed financial statements describes the significant accounting policies and methods used in the preparation of our financial statements. We consider the accounting policies listed below to be critical because they involve management judgments and assumptions, require estimates about matters that are inherently uncertain and are important for understanding and evaluating our reported financial results. These judgments affect (i) the reported amounts of assets and liabilities, (ii) our disclosure of contingent assets and liabilities as of the dates of the financial statements and (iii) the reported amounts of revenue and expenses during the reporting periods. With different estimates or assumptions, materially different amounts could be reported in our financial statements. Changes in the economic environment, financial markets and any other parameters used in determining such estimates could cause actual results to differ materially from the amounts reported based on these policies.
Valuation of Investments and Unrealized Gain (Loss) — Our investments consist primarily of investments in senior and subordinated debt of private U.S. companies and are presented in our financial statements at fair value. See Note 3. “Investments,” in our unaudited condensed financial statements for more information on our investments. As described more fully in Note 2. “Significant Accounting Policies” and Note 5. “Fair Value of Financial Instruments” in our unaudited condensed financial statements, a valuation hierarchy based on the level of independent, objective evidence available regarding value is used to measure the fair value of our investments. Investments for which market quotations are readily available are valued using market quotations, which are generally obtained from independent pricing services, broker-dealers or market makers. With respect to our portfolio investments for which market quotations are not readily available, our board of trustees is responsible for determining in good faith the fair value of our portfolio investments in accordance with, and the consistent application of, the valuation policy and procedures approved by the board of trustees, based on, among other things, the input of our Advisors, audit committee and independent third-party valuation firms.
We utilize several valuation techniques that use unobservable inputs and assumptions in determining the fair value of our Level 3 investments. For senior debt, subordinated debt and structured products categorized as Level 3 investments, we initially value the investment at its transaction price and subsequently value using (i) market data for similar instruments (e.g., recent transactions or indicative broker quotes), (ii) comparisons to benchmark derivative indices and/or (iii) valuation models. Valuation models are based on yield analysis and discounted cash flow techniques, where the key inputs are based on relative value analyses and the assignment of risk-adjusted discounted rates derived from the analysis of similar credit investments from similar issuers. In addition, an illiquidity discount is applied where appropriate. The valuation techniques used by us for other types of assets and liabilities that are classified as Level 3 investments are described in Note 2. “Significant Accounting Policies” in our unaudited condensed financial statements. The unobservable inputs and assumptions may differ by asset and in the application of our valuation methodologies. The reported fair value estimates could vary materially if we had chosen to incorporate different unobservable inputs and other assumptions.
We and our board of trustees conduct our fair value determination process on a monthly basis and any other time when a decision regarding the fair value of our portfolio investments is required. A determination of fair value involves subjective judgments and estimates. Due to the inherent uncertainty of determining the fair value of portfolio investments that do not have a readily available market value, the fair value of the our portfolio investments may differ significantly from the values that would have been determined had a readily available
68
Table of Contents
market value existed for such investments, and the differences could be material. Further, such investments are generally less liquid than publicly traded securities. If we were required to liquidate a portfolio investment that does not have a readily available market value in a forced or liquidation sale, we could realize significantly less than the fair value recorded by us.
The table below presents information on investments classified as Level 3 as of September 30, 2018 and December 31, 2017:
| September 30, 2018 | December 31, 2017 | |||||||
| Fair value of investments classified as Level 3 |
$ | 65,848 | $ | 37,521 | ||||
| Total fair value of investments |
$ | 187,482 | $ | 163,911 | ||||
| % of fair value classified as Level 3 |
35.1% | 22.9% | ||||||
| Number of positions classified as Level 3 |
54 | 21 | ||||||
| Total number of positions |
139 | 98 | ||||||
| % of positions classified as Level 3 |
38.8% | 21.4% | ||||||
| Fair value of individual positions classified as Level 3: |
||||||||
| Highest fair value |
$ | 4,654 | $ | 4,567 | ||||
| Lowest fair value |
$ | 30 | $ | 2 | ||||
| Average fair value |
$ | 1,341 | $ | 1,787 | ||||
The ranges of unobservable inputs used in the fair value measurement of our Level 3 investments as of September 30, 2018 and December 31, 2017 are described in Note 5. “Fair Value of Financial Instruments” in our unaudited condensed financial statements, as well as the directional impact to the valuation from an increase in various unobservable inputs.
Off-Balance Sheet Arrangements
We had no off-balance sheet arrangements as of September 30, 2018.
Contractual Obligations
Joint Advisor Investment Advisory Agreement – As of April 9, 2018 – See “Overview—Changes to Advisory Structure and Other Agreements” for additional information.
Pursuant to the new Joint Advisor Investment Advisory Agreement, the Joint Advisor earns a base management fee equal to an annual rate of 1.50% of our average gross assets and incentive fees based on our performance. The incentive fee is comprised of the following two parts:
| • | a subordinated incentive fee on income is calculated and payable quarterly in arrears, equal to 20.0% of the Company’s “pre-incentive fee net investment income” for the immediately preceding quarter and subject to a hurdle rate, expressed as a rate of return on average adjusted capital, equal to 1.75% per quarter, or an annualized hurdle rate of 7.0%. For purposes of the subordinated incentive fee on income, “adjusted capital” means cumulative proceeds generated from sales of the Company’s common shares of beneficial interest (including proceeds from the Company’s distribution reinvestment plan), net of sales commissions and dealer manager fees, reduced for (i) distributions paid to shareholders that represent return of capital on a tax basis and (ii) amounts paid for share repurchases pursuant to the Company’s share repurchase program. As a result, the Joint Advisor will not earn this incentive fee for any quarter until the Company’s pre-incentive fee net investment income |
69
Table of Contents
| for such quarter exceeds the hurdle rate of 1.75%. Once the Company’s pre-incentive fee net investment income in any quarter exceeds the hurdle rate, the Joint Advisor is entitled to a “catch-up” fee equal to the amount of the Company’s pre-incentive fee net investment income in excess of the hurdle rate, until the Company’s pre-incentive fee net investment income for such quarter equals 2.1875%, or 8.75% annually, of average adjusted capital. This “catch-up” feature allows the Joint Advisor to recoup the fees foregone as a result of the existence of the hurdle rate. Thereafter, the Joint Advisor will be entitled to receive 20.0% of the Company’s pre-incentive fee net investment income. |
| • | an incentive fee on capital gains is determined and payable in arrears as of the end of each calendar year (or upon termination of the Joint Advisor Investment Advisory Agreement). Under the Joint Advisor Investment Advisory Agreement, the fee is equal to 20.0% of the Company’s “incentive fee capital gains” (i.e., the Company’s realized capital gains on a cumulative basis from inception, calculated as of the end of the applicable period, computed net of all realized capital losses and unrealized capital depreciation on a cumulative basis), less the aggregate amount of any previously paid incentive fees on capital gains. The Company accrues for the incentive fee on capital gains, which, if earned, is paid annually. The Company accrues for the incentive fee on capital gains based on net realized and unrealized gains; however, under the terms of the Joint Advisor Investment Advisory Agreement, the fee payable to the Joint Advisor is based on realized gains and no such fee is payable with respect to unrealized gains unless and until such gains are actually realized. The incentive fee may or may not be taken in whole or in part at the discretion of the Joint Advisor. All or any part of the incentive fee not taken as to any quarter will be deferred without interest and may be taken in such other quarter as the Joint Advisor shall determine. |
As of September 30, 2018, we had accrued an incentive fee on capital gains of $200. See Note 6. “Related Party Transactions” in our unaudited condensed financial statements and above in “Overview—Changes to Advisory Structure and Other Agreements” for an expanded discussion of the agreements with our Former Advisors until the termination of those agreements and the new agreements entered into with the Joint Advisor on April 9, 2018.
70
Table of Contents
Unfunded Commitments
Unfunded commitments to provide funds to portfolio companies are not recorded on our statements of assets and liabilities. Because these commitments may expire without being drawn upon, the total commitment amount does not necessarily represent future cash requirements. We intend to use cash flow from scheduled and early principal repayments, proceeds from borrowings and proceeds from sales of investments to fund these commitments. As of September 30, 2018, our unfunded commitments were as follows:
| Category / Portfolio Company |
Cost | |||||
| Unfunded Term Loan Commitments: |
||||||
| Access CIG, LLC |
$ | 11 | ||||
| Berner Food & Beverage Inc. |
2,623 | |||||
| Frontline Technologies Group, LLC |
878 | |||||
| GC Agile Intermediate Holdings Limited (GBR) |
86 | |||||
| GC Agile Intermediate Holdings Limited (GBR) |
284 | |||||
| Harrison Gypsum, LLC |
260 | |||||
| ID Verde (FRA)(1) |
333 | |||||
| Patriot Well Solutions LLC |
334 | |||||
| Revere Superior Holdings, Inc. |
382 | |||||
| Wheels Up Partners, LLC |
827 | |||||
| Unfunded Revolving Loan Commitments: |
||||||
| Eagle Family Foods Group LLC |
157 | |||||
| GC Agile Intermediate Holdings Limited (GBR) |
237 | |||||
| Revere Superior Holdings, Inc. |
129 | |||||
| SMART Global Holdings, Inc. |
33 | |||||
| Unfunded Asset Based Finance Commitments: |
||||||
| KKR Zeno Aggregator, LP (IRE) |
2,476 | |||||
| Neos SPV I (NLD)(1) |
935 | |||||
| Unfunded Equity Commitments: |
||||||
| Polyconcept North America, Inc. |
26 | |||||
|
|
|
|||||
| Total Unfunded Commitments |
$ | 10,011 | ||||
|
|
|
|||||
| (1) | Local currency commitment amount is denominated in Euros. As of September 30, 2018, €1 equaled approximately U.S. $1.16. |
We estimate we have sufficient liquidity in the form of cash on hand, borrowing capacity under our revolving credit facilities, scheduled and early principal repayments and proceeds from sales of investments to fund such unfunded commitments when the need arises.
Related Party Transactions
We have entered into agreements with our Joint Advisor, whereby we agree to pay certain fees to, or reimburse certain expenses of, our Joint Advisor for investment and advisory services and reimbursement of administrative and operating costs. See Note 6. “Related Party Transactions” in our unaudited condensed financial statements and above in “Overview—Changes to Advisory Structure and Other Agreements” for an expanded discussion of the various related party transactions, agreements and fees.
71
Table of Contents
Impact of Recent Accounting Pronouncements
See Note 2. “Significant Accounting Policies” in Item 1. “Financial Statements” for a summary of the impact of any recent accounting pronouncements.
Item 3. Quantitative and Qualitative Disclosures About Market Risk
Interest Rate Risk
We are subject to financial market risks, in particular changes in interest rates. Future changes in interest rates will likely have effects on the interest income we earn on our portfolio investments, the fair value of our fixed income investments, the interest rates and interest expense associated with the money we borrow and the fair value of our borrowings.
Subject to the requirements of the 1940 Act, we may hedge against interest rate fluctuations by using standard hedging instruments such as futures, options and forward contracts. Although hedging activities may insulate us against adverse changes in interest rates, they may also limit our ability to participate in the benefits of lower interest rates.
As of September 30, 2018, approximately 72.6% of our portfolio of debt investments, or approximately $131,390 measured at par value, featured floating or variable interest rates. The variable interest rate debt investments usually provide for interest payments based on three-month LIBOR (the base rate) and typically have durations of three months after which the base rates are reset to then prevailing three-month LIBOR. As of September 30, 2018, 87.7% of our portfolio of variable interest rate debt investments, or approximately $115,268 measured at par value, featured minimum base rates, or base rate floors, and the weighted average base rate floor for such investments was 1.0%. Variable interest rate investments that feature a base rate floor generally reset to the then prevailing three-month LIBOR only if the reset base rate exceeds the base rate floor on the applicable interest rate reset date, in which cases we may benefit through an increase in interest income from such interest rate adjustments.
Based on the September 30, 2018 unaudited condensed statement of assets and liabilities, the following table shows the annual impact of base rate changes in interest rates (considering interest rate floors for variable rate instruments) assuming no changes in our investment and borrowing structure:
| As of September 30, 2018 | ||||||||||||
| Basis Point Change |
Interest Income | Interest Expense | Net Investment Income(1) |
|||||||||
| Down 50 basis points |
$ | (614) | $ | 376 | $ | (238) | ||||||
| Up 50 basis points |
$ | 614 | $ | (376) | $ | 238 | ||||||
| Up 100 basis points |
$ | 1,228 | $ | (751) | $ | 477 | ||||||
| Up 150 basis points |
$ | 1,842 | $ | (1,127) | $ | 715 | ||||||
| Up 200 basis points |
$ | 2,455 | $ | (1,503) | $ | 952 | ||||||
| (1) | Excludes the impact of performance-based incentive fees and expense support. See Note 6. “Related Party Transactions” in our unaudited condensed financial statements for more information on performance-based incentive fees and expense support. |
The interest rate sensitivity analysis presented above does not consider the potential impact of the changes in fair value of our debt investments and the net asset value of our common stock in the event of sudden increases in interest rates associated with high yield corporate bonds.
Approximately 27.4% of our debt investment portfolio was invested in fixed interest rate, high yield corporate debt investments as of September 30, 2018. Rising market interest rates will most likely lead to fair
72
Table of Contents
value declines for high yield corporate bonds and a decline in the net asset value of our common stock, while declining market interest rates will most likely lead to an increase in bond values.
As of September 30, 2018, 67.8% of our debt investments had prices that are generally available from third party pricing services. We consider these debt investments to be liquid since these types of assets are generally broadly syndicated and owned by a wide group of institutional investors, business development companies, mutual funds and other investment funds. Additionally, this group of assets is susceptible to revaluation, or changes in bid-ask values, in response to sudden changes in expected rates of return associated with these investments.
We have computed a duration of approximately 4.3 for this liquid/fixed subset of our total portfolio. This implies that a sudden increase in the market’s expected rate of return of 100 basis points for this subset of our Investment Portfolio may result in a reduction in fair value of approximately 4.3%, all other financial and market factors assuming to remain unchanged. A 4.3% decrease in the valuation of this Investment Portfolio subset equates to a decrease of $2,152, or a 1.9% decline in net assets relative to $9.14 net asset value per share as of September 30, 2018.
Foreign Currency Risk
From time to time, we may make investments that are denominated in a foreign currency that are subject to the effects of exchange rate movements between the foreign currency of each such investment and the U.S. dollar, which may affect future fair values and cash flows, as well as amounts translated into U.S. dollars for inclusion in our consolidated financial statements.
The table below presents the effect that a 10% immediate, unfavorable change in the foreign currency exchange rates (i.e. further strengthening U.S. Dollar) would have on the fair value of investments in our Investment Portfolio denominated in foreign currencies as of September 30, 2018, by foreign currency, all other valuation assumptions remaining constant. In addition, the table below presents the par value of our investments denominated in foreign currencies and the notional amount of foreign currency forward contracts in local currency in place as of September 30, 2018, to hedge against foreign currency risks.
| Debt Investments Denominated in Foreign Currencies | Hedges | |||||||||||||||||||||||
| Foreign Currency |
Par Value in Local Currency |
Par Value in U.S. Dollars |
Fair Value | Reduction in Fair Value as of September 30, 2018 if 10% Adverse Change in Exchange Rate(1) |
Net Foreign Currency Hedge Amount in Local Currency |
Net Foreign Currency Hedge Amount in U.S. Dollars |
||||||||||||||||||
| Canadian Dollars |
C$ | 5,942 | $ | 4,807 | $ | 4,654 | $ | 465 | C$ | 5,690 | $ | 4,435 | ||||||||||||
| Euros |
€ | 2,151 | 2,564 | 2,451 | 245 | € | 107 | 143 | ||||||||||||||||
|
|
|
|
|
|
|
|
|
|||||||||||||||||
| Total |
$ | 7,371 | $ | 7,105 | $ | 710 | $ | 4,578 | ||||||||||||||||
|
|
|
|
|
|
|
|
|
|||||||||||||||||
|
|
||||||||||||||||||||||||
(1) Excludes effect, if any, of any foreign currency hedges.
As illustrated in the table above, we use derivative instruments from time to time, including foreign currency forward contracts, to manage the impact of fluctuations in foreign currency exchange rates. In addition, we have the ability to borrow in foreign currencies under our Revolving Credit Facility, which provides a natural hedge with regard to changes in exchange rates between the foreign currencies and U.S. dollar and reduces our exposure to foreign exchange rate differences. We are typically a net receiver of these foreign currencies as related to our international investment positions, and, as a result, our investments denominated in foreign currencies, to the extent not hedged, benefit from a weaker U.S. dollar and are adversely affected by a stronger U.S. dollar.
73
Table of Contents
As of September 30, 2018, the contractual notional balance of our foreign currency forward contracts were approximately €107 and C$5,690, all of which related to hedging of our foreign currency denominated debt investments. As of September 30, 2018, approximately $387, $2,484 and $450 of our outstanding borrowings on our Revolving Credit Facility were denominated in Canadian dollars, Euros and British pound sterling, respectively.
During the nine months ended September 30, 2018, our foreign currency transactions and foreign currency translation adjustment recorded in our unaudited condensed statement of operations resulted in net realized and unrealized losses of approximately $277. Our foreign currency forward contracts, employed for hedging purposes, generated net unrealized gains of approximately $208 during the nine months ended September 30, 2018. We do not isolate that portion of the results of operations resulting from changes in foreign exchange rates on investments from the fluctuations arising from changes in fair values of investments held; therefore, the fluctuations related to foreign exchange rate conversion are included with the net realized gain (loss) and unrealized appreciation (depreciation) on investments. See “Results of Operations—Net Change in Unrealized Appreciation or Depreciation” for additional information on the foreign currency exchange changes.
Item 4. Controls and Procedures
Evaluation of Disclosure Controls and Procedures
Our management, including our principal executive officer and principal financial officer, evaluated the effectiveness of our disclosure controls and procedures as of the end of the period covered by this report. Based upon that evaluation, our management, including our principal executive officer and principal financial officer, concluded that our disclosure controls and procedures are effective as of the end of the period covered by this report to provide reasonable assurance that information required to be disclosed by us in the reports we file under the Securities Exchange Act of 1934, as amended, is recorded, processed, summarized and reported within the time periods specified in the relevant SEC rules and forms.
Changes in Internal Control over Financial Reporting
During the most recent fiscal quarter, there was no change in our internal controls over financial reporting (as defined under Rule 13a-15(f) under the Exchange Act) that has materially affected, or is reasonably likely to materially affect, our internal controls over financial reporting.
74
Table of Contents
PART II—OTHER INFORMATION
Item 1. Legal Proceedings – None
There have been no material changes to the risk factors previously disclosed in response to Item 1A to Part I of our Annual Report on Form 10-K for the fiscal period ended December 31, 2017, other than as described below:
Investing in our common stock involves a number of significant risks. In addition to the other information contained in this quarterly report on Form 10-Q, investors should consider carefully the risk factors set forth in our annual report on Form 10-K for the year ended December 31, 2017 and our additional filings with the SEC before making an investment in our common stock. All of the risk factors identified in Item 1A of our annual report on Form 10-K for the year ended December 31, 2017 that relate to our Former Advisors are applicable to the Joint Advisor, our current investment adviser.
Risks Related to our Investment Adviser and Administrator
On April 9, 2018, we entered into a new advisory relationship with the Joint Advisor. Because the Joint Advisor is a newly-formed investment adviser jointly operated by an affiliate of FS Investments and KKR, the Joint Advisor does not have prior experience acting as an investment adviser to a BDC. The 1940 Act and the Code impose numerous constraints on the operations of BDCs that do not apply to other investment vehicles. While both FS Investments and KKR have individually acted as investment advisers to BDCs previously, the Joint Advisor’s lack of experience in managing a portfolio of assets under the constraints of the 1940 Act and the Code may hinder the Joint Advisor’s ability to take advantage of attractive investment opportunities and, as a result, may adversely affect our ability to achieve our investment objectives. FS Investments and KKR’s individual track records and achievements are not necessarily indicative of the future results they will achieve as a joint investment adviser. Accordingly, we can offer no assurance that we will replicate the historical performance of other investment companies with which FS Investments and KKR have been affiliated, and we caution that our investment returns could be lower than the returns achieved by such other companies.
There may be conflicts of interest related to obligations the Joint Advisor’s senior management and investment teams have to our affiliates and to other clients.
The members of the senior management and investment teams of the Joint Advisor serve or may serve as officers, directors or principals of entities that operate in the same or a related line of business as we do, or of investment vehicles managed by the same personnel. For example, the Joint Advisor is the investment adviser to FS Investment Corporation, FS Investment Corporation II, FS Investment Corporation III, FS Investment Corporation IV and Corporate Capital Trust, Inc., and the officers, managers and other personnel of the Joint Advisor may serve in similar or other capacities for the investment advisers to future investment vehicles affiliated with FS Investments or KKR. In serving in these multiple and other capacities, they may have obligations to other clients or investors in those entities, the fulfillment of which may not be in our best interests or in the best interest of our shareholders. Our investment objectives may overlap with the investment objectives of such investment funds, accounts or other investment vehicles. For example, we rely on the Joint Advisor to manage our day-to-day activities and to implement our investment strategy. The Joint Advisor and certain of its affiliates are presently, and plan in the future to continue to be, involved with activities which are unrelated to us. As a result of these activities, the Joint Advisor, its employees and certain of its affiliates will have conflicts of interest in allocating their time between us and other activities in which they are or may become involved, including the management of other entities affiliated with FS Investments or KKR. The Joint Advisor and its employees will devote only as much of its or their time to our business as the Joint Advisor and its employees, in their judgment, determine is reasonably required, which may be substantially less than their full time.
| Item 2. | Unregistered Sales of Equity Securities and Use of Proceeds – None |
| Item 3. | Defaults Upon Senior Securities – None |
75
Table of Contents
| Item 4. | Mine Safety Disclosures – Not applicable |
| Item 5. | Other Information |
On November 14, 2018, the Joint Advisor announced that for any calendar month ending on or prior to September 30, 2019 it will defer the receipt of base management fees under the Joint Advisor Investment Advisory Agreement if, and to the extent that, the Company’s distributions paid to the Company’s shareholders in the calendar month exceeds the sum of the Company’s investment company taxable income (as defined in Section 852 of the Code), net capital gains (as defined in Section 1222 of the Code) and dividends and other distributions paid to the Company on account of preferred and common equity investments in portfolio companies (to the extent such amounts were not included in net investment company taxable income or net capital gains) in the calendar month, or collectively, the Company’s distributable funds on a tax basis. The Joint Advisor will only receive any deferred fees in a future calendar month if, and to the extent that, the Company’s distributable funds on a tax basis in the future calendar month exceeds the Company’s distributions paid to the Company’s shareholders in such month. Prior to September 30, 2019, the Joint Advisor will evaluate whether to extend this commitment to future periods. In light of this commitment by the Joint Advisor, the Joint Advisor Expense Support Agreement was terminated on November 14, 2018. The Company’s conditional obligation to reimburse the Joint Advisor pursuant to the terms of the Joint Advisor Expense Support Agreement survived the termination of such agreement. No early termination penalties will be incurred by the Company in light of the termination of the Joint Advisor Expense Support Agreement. See Note 6 – Related Party Transactions – Expense Support Agreements in our unaudited consolidated financial statements included herein for a description of the material terms and conditions of the Joint Advisor Expense Support Agreement.
| Item 6. | Exhibits – The exhibits required by this item are set forth in the Exhibit Index attached hereto and are filed or incorporated as part of this report. |
76
Table of Contents
The following exhibits are filed or incorporated as part of this report:
77
Table of Contents
Pursuant to the requirements of the Securities Exchange Act of 1934, the registrant has duly caused this quarterly report to be signed on its behalf by the undersigned, thereunto duly authorized on November 14, 2018.
| CORPORATE CAPITAL TRUST II | ||
| By: | /s/ Michael C. Forman | |
|
| ||
| Michael C. Forman Chief Executive Officer (Principal Executive Officer) | ||
| By: | /s/ William Goebel | |
|
| ||
| William Goebel Chief Financial Officer | ||
78