Attached files
| file | filename |
|---|---|
| 8-K - 8-K - Blue Apron Holdings, Inc. | a18-40049_18k.htm |
FORWARD LOOKING STATEMENTS AND USE OF NON-GAAP FINANCIAL INFORMATION This presentation includes statements concerning Blue Apron Holdings, Inc. and its future expectations, plans and prospects that constitute "forward-looking statements" within the meaning of the Private Securities Litigation Reform Act of 1995. For this purpose, any statements contained herein that are not statements of historical fact may be deemed to be forward-looking statements. In some cases, you can identify forward-looking statements by terms such as "may," "should," "expects," "plans," "anticipates," "could," "intends," "target," "projects," "contemplates," "believes," "estimates," "predicts," "potential," or "continue," or the negative of these terms or other similar expressions. These statements involve known and unknown risks, uncertainties and other important factors that may cause Blue Apron’s actual results, performance or achievements to be materially different from any future results, performance or achievements expressed or implied by the forward-looking statements. These forward-looking statements reflect Blue Apron’s current views about its plans, intentions, expectations, strategies and prospects, which are based on the information currently available to it and on assumptions it has made. Actual results may differ materially from those described in the forward-looking statements and will be affected by a variety of risks and factors that are beyond Blue Apron’s control including, without limitation, Blue Apron’s anticipated growth strategies, including its decision to prioritize customer segments within the direct-to-consumer business; Blue Apron’s ability to achieve the benefits associated with the workforce reduction; risks resulting from the workforce reduction, including, but not limited to, further employee attrition and adverse effects on Blue Apron’s operations; Blue Apron’s ability to execute on its multi-product, multi-channel growth strategy; its expectations regarding competition and its ability to effectively compete; its ability to expand its product offerings and distribution channels; its ability to cost-effectively attract new customers, retain existing customers and increase the number of customers it serves; its amount of indebtedness and ability to fulfill its debt-related obligations; its ability to comply with the covenants in its revolving credit facility; seasonal trends in customer behavior; its expectations regarding, and the stability of, its supply chain; the size and growth of the markets for its product offerings and its ability to serve those markets; federal and state legal and regulatory developments; other anticipated trends and challenges in its business; and other risks more fully described in Blue Apron’s public reports filed with the U.S. Securities and Exchange Commission (the “SEC”), including under the caption “Risk Factors” in Blue Apron’s Quarterly Report on Form 10-Q for the fiscal quarter ended September 30, 2018 to be filed with the SEC and in other filings that Blue Apron may make with the SEC in the future. Blue Apron assumes no obligation to update any forward-looking statements contained in this presentation as a result of new information, future events or otherwise. This presentation also includes adjusted EBITDA, a non-GAAP financial measure, that is not prepared in accordance with, nor an alternative to, financial measures prepared in accordance with U.S. generally accepted accounting principles (“GAAP”). In addition, adjusted EBITDA is not based on any standardized methodology prescribed by GAAP and is not necessarily comparable to similarly-titled measures presented by other companies. A reconciliation of these measures to the most directly comparable GAAP measure is included the Appendix to this presentation. Certain data in this presentation was obtained from various external sources, and neither Blue Apron nor its affiliates, advisors, or representatives make any representation as to the accuracy or completeness of that data or any commitment to update such data after the date of this presentation. Such data involve risks and uncertainties and are subject to change based on various factors.
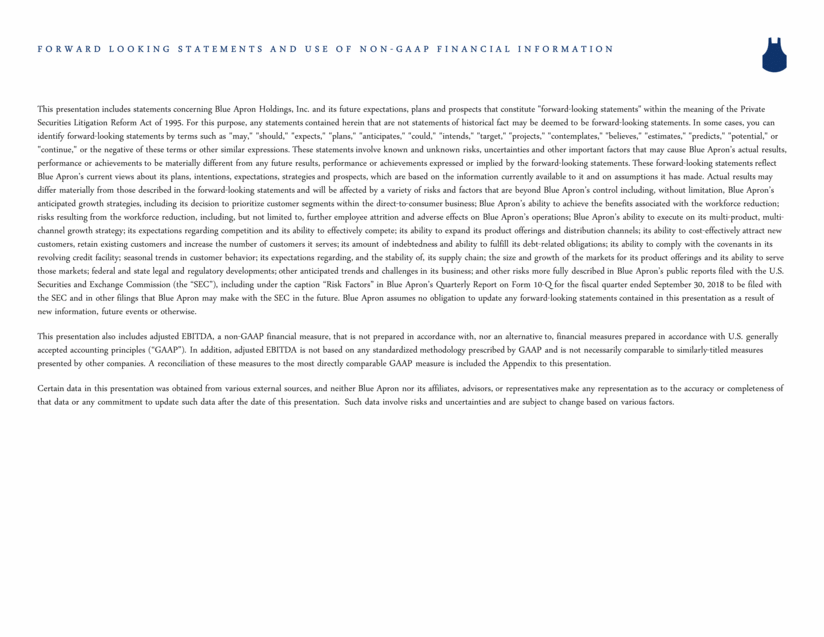
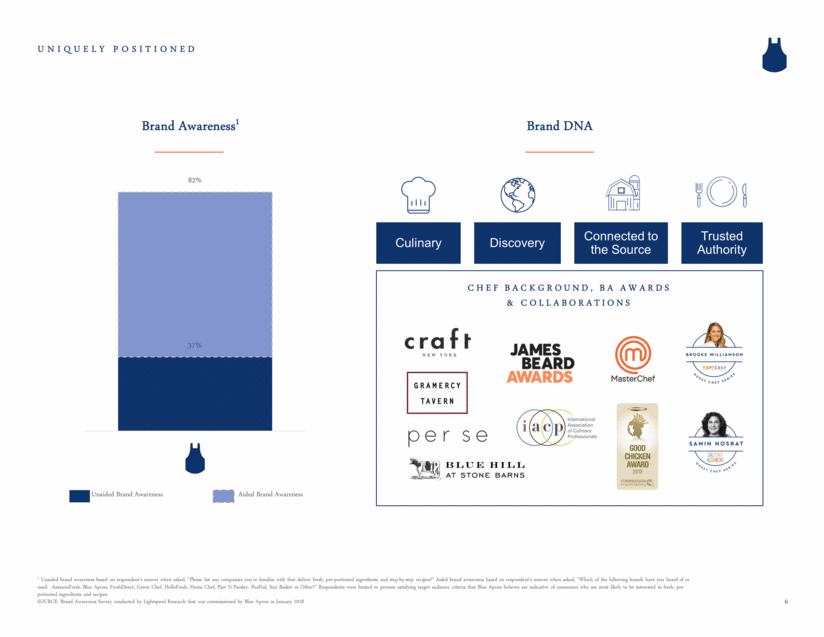
We help households nationwide experience the joy of culinary experiences at home through our meal, wine and marketplace offerings Leader in brand awareness in our category1 550 original recipes and 50 wines created in 2017 through three FDA-regulated fulfillment centers Delivery to over 99% of the U.S. population $715M Q3 2018 TTM Net Revenue2 1Category defined as certain companies specified by Blue Apron that deliver fresh, pre-portioned ingredients and recipes operating in the United States. Unaided brand awareness based on respondent’s answer when asked, “Please list any companies you're familiar with that deliver fresh, pre-portioned ingredients and step-by-step recipes?” Aided brand awareness based on respondent’s answer when asked, “Which of the following brands have you heard of or used: AmazonFresh, Blue Apron, FreshDirect, Green Chef, HelloFresh, Home Chef, Part N Parsley, PeaPod, Sun Basket or Other?” Respondents were limited to persons satisfying target audience criteria that Blue Apron believes are indicative of consumers who are most likely to be interested in fresh, pre-portioned ingredients and recipes. SOURCE: Brand Awareness Survey conducted by Lightspeed Research that was commissioned by Blue Apron in January 2018 2Calculated as cumulative net revenue for the period from October 1, 2017 to September 30, 2018. 3
Our Brand

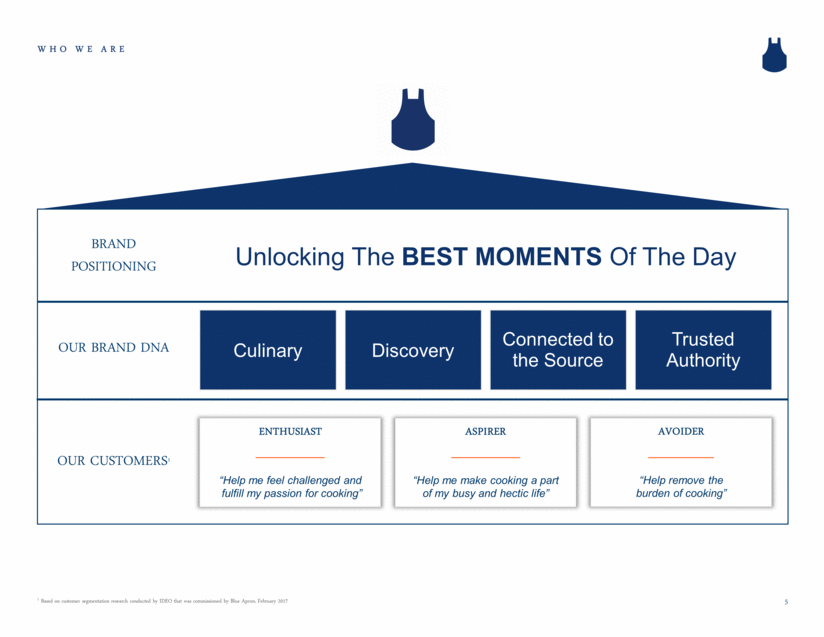
WHO WE ARE Culinary BRAND POSITIONING Unlocking The BEST MOMENTS Of The Day Discovery Connected to the Source Trusted Authority OUR BRAND DNA OUR CUSTOMERS1 ENTHUSIAST “Help me feel challenged and fulfill my passion for cooking” ASPIRER “Help me make cooking a part of my busy and hectic life” AVOIDER “Help remove the burden of cooking” 1 Based on customer segmentation research conducted by IDEO that was commissioned by Blue Apron, February 2017 5
UNIQUELY POSITIONED 1 Unaided brand awareness based on respondent’s answer when asked, “Please list any companies you're familiar with that deliver fresh, pre-portioned ingredients and step-by-step recipes?” Aided brand awareness based on respondent’s answer when asked, “Which of the following brands have you heard of or used: AmazonFresh, Blue Apron, FreshDirect, Green Chef, HelloFresh, Home Chef, Part N Parsley, PeaPod, Sun Basket or Other?” Respondents were limited to persons satisfying target audience criteria that Blue Apron believes are indicative of consumers who are most likely to be interested in fresh, pre-portioned ingredients and recipes. SOURCE: Brand Awareness Survey conducted by Lightspeed Research that was commissioned by Blue Apron in January 2018 Brand Awareness1 Unaided Brand Awareness Aided Brand Awareness Brand DNA Culinary Discovery Connected to the Source Trusted Authority 6 CHEF BACKGROUND, BA AWARDS & COLLABORATIONS 37% 82% BA
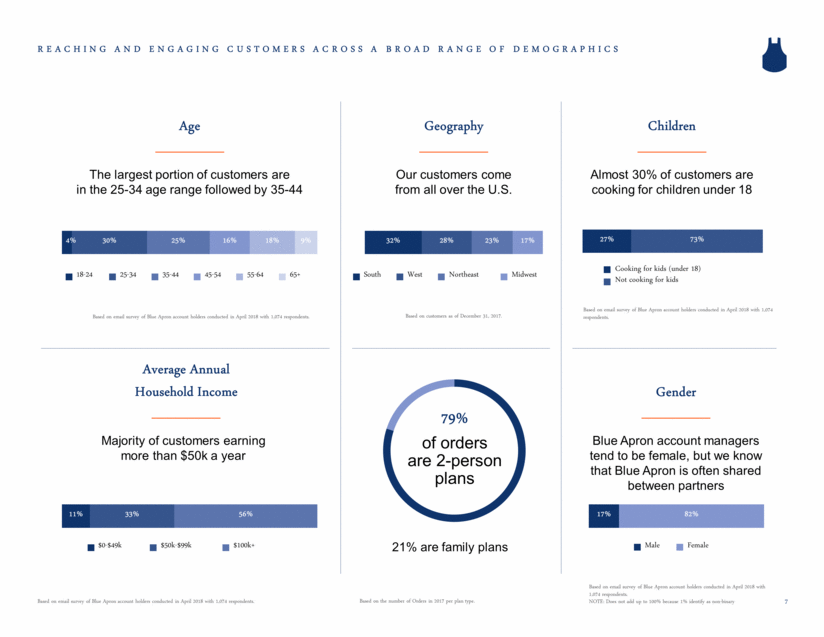
REACHING AND ENGAGING CUSTOMERS ACROSS A BROAD RANGE OF DEMOGRAPHICS Age Geography Children The largest portion of customers are in the 25-34 age range followed by 35-44 Almost 30% of customers are cooking for children under 18 Our customers come from all over the U.S. Cooking for kids (under 18) Not cooking for kids South West Northeast Midwest 18-24 25-34 35-44 45-54 55-64 65+ Based on customers as of December 31, 2017. Based on email survey of Blue Apron account holders conducted in April 2018 with 1,074 respondents. Based on email survey of Blue Apron account holders conducted in April 2018 with 1,074 respondents. Majority of customers earning more than $50k a year $0-$49k $50k-$99k $100k+ Average Annual Household Income Based on email survey of Blue Apron account holders conducted in April 2018 with 1,074 respondents. 21% are family plans 79% of orders are 2-person plans Based on the number of Orders in 2017 per plan type. Gender Blue Apron account managers tend to be female, but we know that Blue Apron is often shared between partners Based on email survey of Blue Apron account holders conducted in April 2018 with 1,074 respondents. NOTE: Does not add up to 100% because 1% identify as non-binary Male Female 7 32% 28% 23% 17% 27% 73% 4% 30% 25% 16% 18% 9% 11% 33% 56% 17% 82%
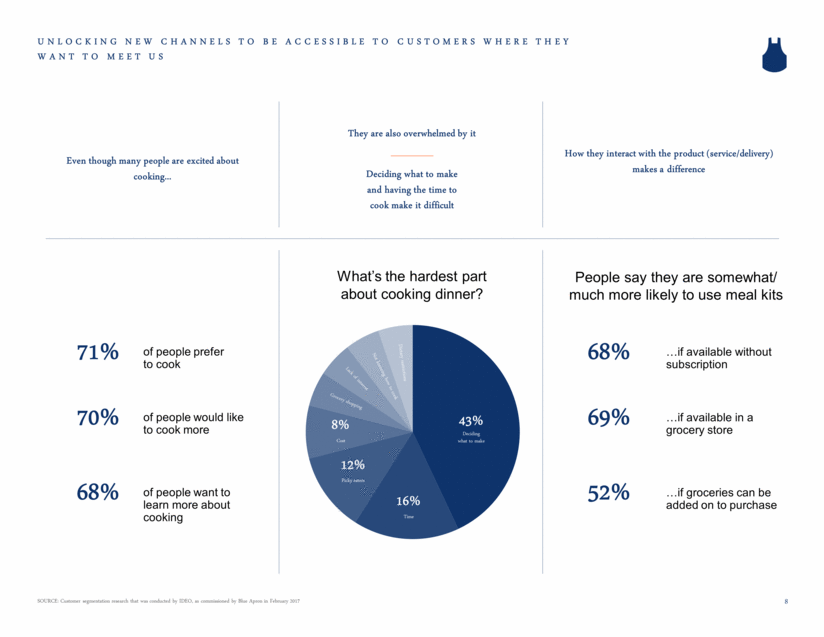
UNLOCKING NEW CHANNELS TO BE ACCESSIBLE TO CUSTOMERS WHERE THEY WANT TO MEET US Even though many people are excited about cooking... How they interact with the product (service/delivery) makes a difference They are also overwhelmed by it Deciding what to make and having the time to cook make it difficult SOURCE: Customer segmentation research that was conducted by IDEO, as commissioned by Blue Apron in February 2017 71% 70% 68% of people prefer to cook of people would like to cook more of people want to learn more about cooking What’s the hardest part about cooking dinner? 68% 69% 52% if available without subscription if available in a grocery store if groceries can be added on to purchase 8 43% 8% 12% 16% Time Picky eaters Cost Deciding what to make Grocery shopping Lack of interest Not knowing how to cook Dietary restrictions People say they are somewhat/ much more likely to use meal kits
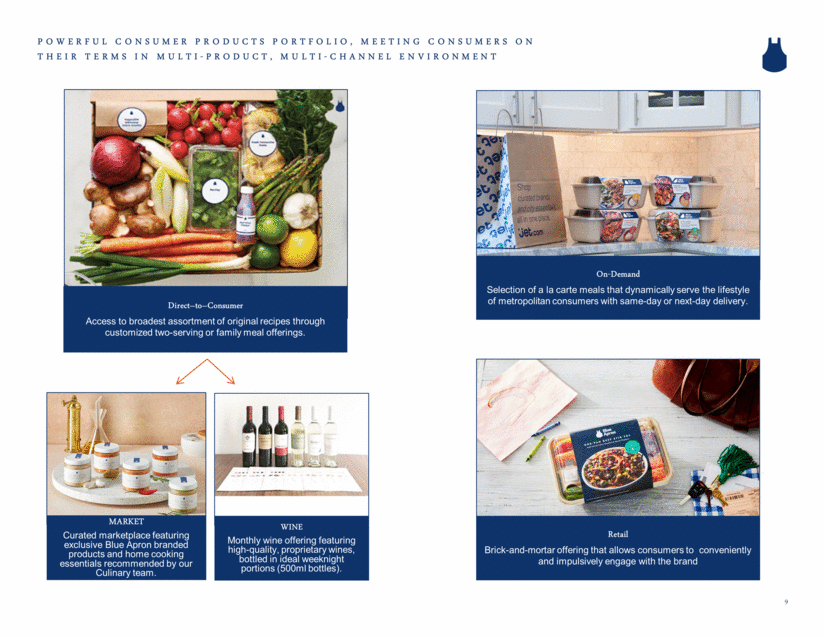
POWERFUL CONSUMER PRODUCTS PORTFOLIO, MEETING CONSUMERS ON THEIR TERMS IN MULTI-PRODUCT, MULTI-CHANNEL ENVIRONMENT Direct–to–Consumer Access to broadest assortment of original recipes through customized two-serving or family meal offerings. WINE Monthly wine offering featuring high-quality, proprietary wines, bottled in ideal weeknight portions (500ml bottles). 9 MARKET Curated marketplace featuring exclusive Blue Apron branded products and home cooking essentials recommended by our Culinary team. On-Demand Selection of a la carte meals that dynamically serve the lifestyle of metropolitan consumers with same-day or next-day delivery. Retail Brick-and-mortar offering that allows consumers to conveniently and impulsively engage with the brand
Our Foundation

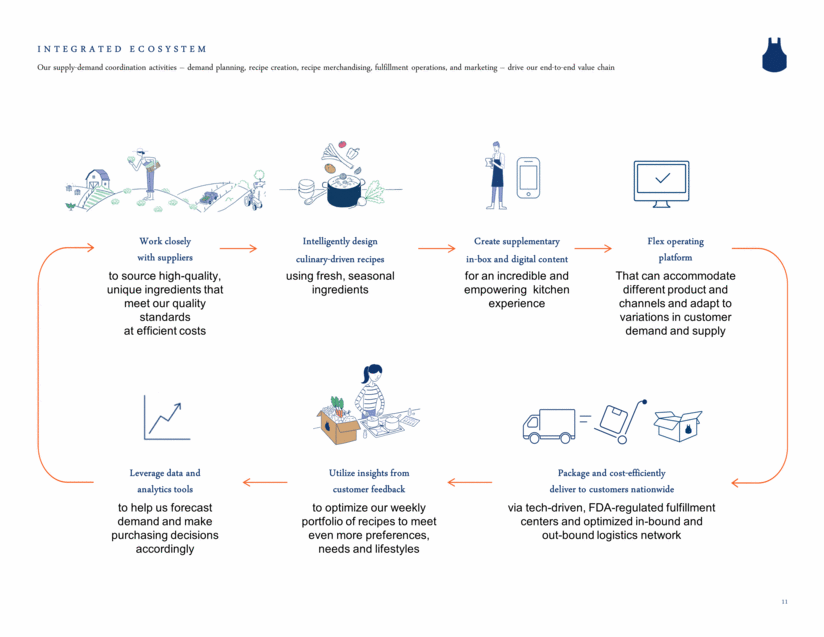
INTEGRATED ECOSYSTEM Our supply-demand coordination activities – demand planning, recipe creation, recipe merchandising, fulfillment operations, and marketing – drive our end-to-end value chain Work closely with suppliers to source high-quality, unique ingredients that meet our quality standards at efficient costs Intelligently design culinary-driven recipes using fresh, seasonal ingredients Flex operating platform That can accommodate different product and channels and adapt to variations in customer demand and supply Create supplementary in-box and digital content for an incredible and empowering kitchen experience Leverage data and analytics tools to help us forecast demand and make purchasing decisions accordingly Utilize insights from customer feedback to optimize our weekly portfolio of recipes to meet even more preferences, needs and lifestyles Package and cost-efficiently deliver to customers nationwide via tech-driven, FDA-regulated fulfillment centers and optimized in-bound and out-bound logistics network 11
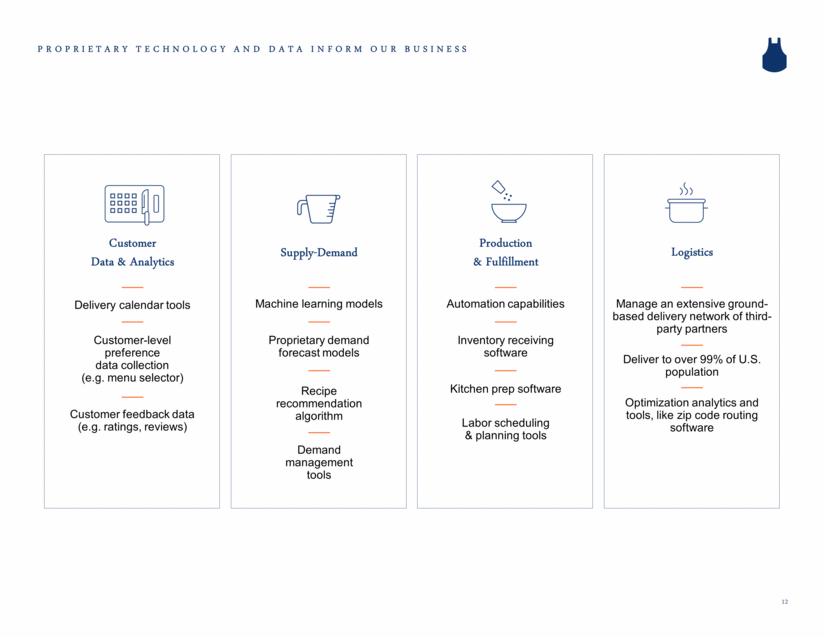
PROPRIETARY TECHNOLOGY AND DATA INFORM OUR BUSINESS Delivery calendar tools Inventory receiving software Customer Data & Analytics Production & Fulfillment Logistics Supply-Demand Customer-level preference data collection (e.g. menu selector) Customer feedback data (e.g. ratings, reviews) Labor scheduling & planning tools Optimization analytics and tools, like zip code routing software Machine learning models Proprietary demand forecast models Recipe recommendation algorithm Demand management tools Automation capabilities Manage an extensive ground-based delivery network of third-party partners Deliver to over 99% of U.S. population Kitchen prep software 12
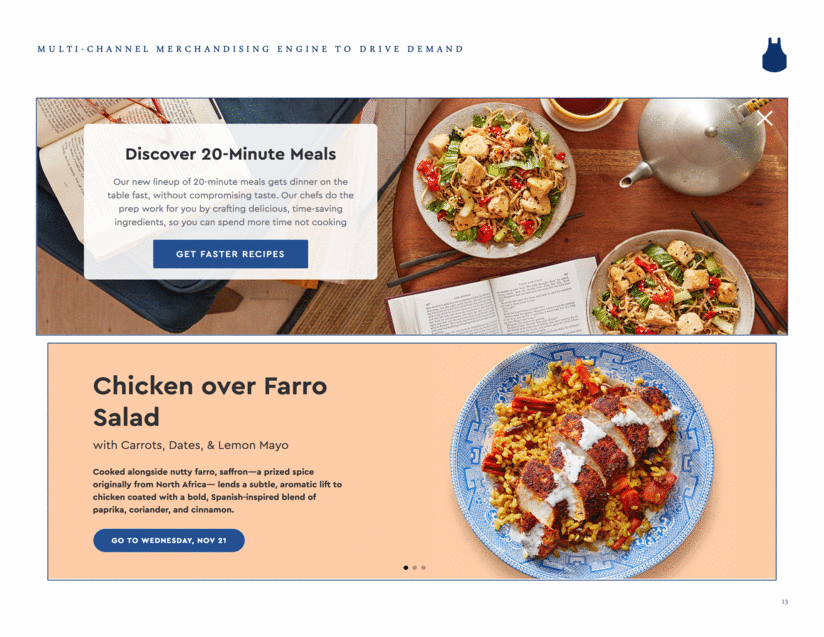
MULTI-CHANNEL MERCHANDISING ENGINE TO DRIVE DEMAND 13
SELECT STRATEGIC BRAND PARTNERS 14
Our Growth Strategy
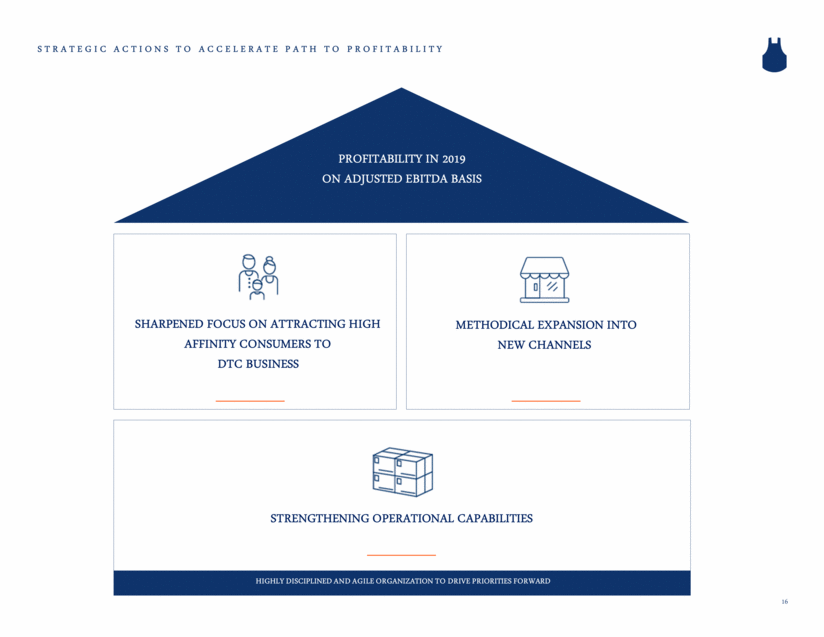
STRATEGIC ACTIONS TO ACCELERATE PATH TO PROFITABILITY PROFITABILITY IN 2019 ON ADJUSTED EBITDA BASIS STRENGTHENING OPERATIONAL CAPABILITIES SHARPENED FOCUS ON ATTRACTING HIGH AFFINITY CONSUMERS TO DTC BUSINESS METHODICAL EXPANSION INTO NEW CHANNELS HIGHLY DISCIPLINED AND AGILE ORGANIZATION TO DRIVE PRIORITIES FORWARD 16
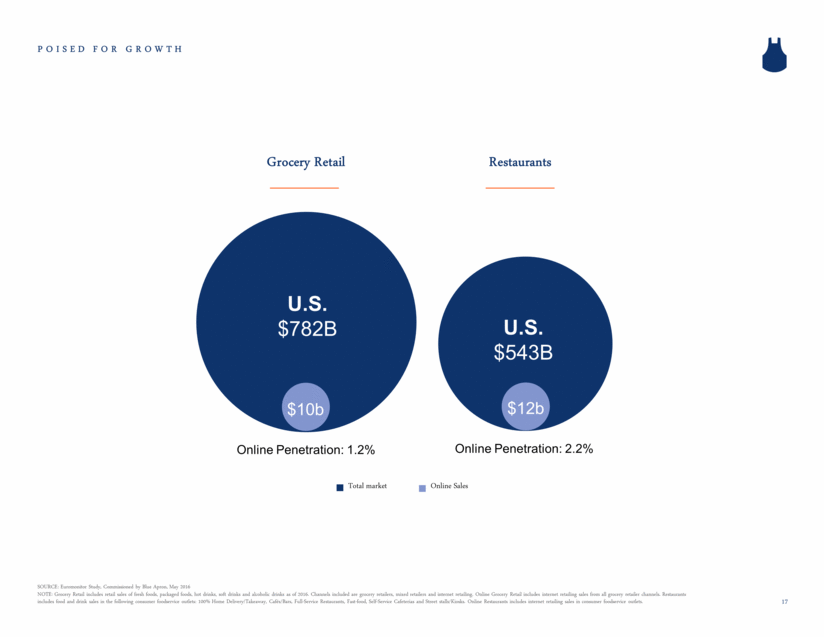
POISED FOR GROWTH SOURCE: Euromonitor Study, Commissioned by Blue Apron, May 2016 NOTE: Grocery Retail includes retail sales of fresh foods, packaged foods, hot drinks, soft drinks and alcoholic drinks as of 2016. Channels included are grocery retailers, mixed retailers and internet retailing. Online Grocery Retail includes internet retailing sales from all grocery retailer channels. Restaurants includes food and drink sales in the following consumer foodservice outlets: 100% Home Delivery/Takeaway, Cafés/Bars, Full-Service Restaurants, Fast-food, Self-Service Cafeterias and Street stalls/Kiosks. Online Restaurants includes internet retailing sales in consumer foodservice outlets. Grocery Retail Restaurants U.S. $782B U.S. $543B $10b $12b Online Penetration: 1.2% Online Penetration: 2.2% Total market Online Sales 17
NEAR-TERM AND LONG-TERM OBJECTIVES Continue to execute on our strategy to be multi-channel and multi-product Create additional value for our customers Optimize our operational and systems platforms Focusing on personalization and meeting customers where they want to be met Leveraging our brand, product expertise and infrastructure flexibility to enter new channels Constantly innovating to design the most unique and special cooking experiences Launching brand partnerships and improving merchandising of weekly recipes Efficiently delivering our products and services, regardless of delivery method Making the customer experience incredible and seamless whether in the digital or physical world 18
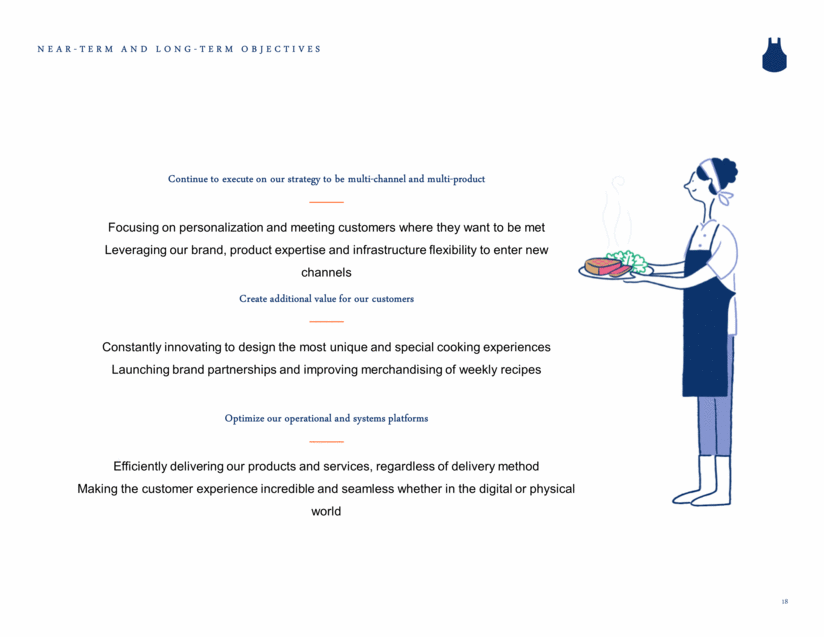
OPPORTUNITIES TO EXPAND INTO NEW PRODUCTS AND CHANNELS INDIRECT DIRECT Retail Core Product On-Demand/ Pickup Core Product Expansion 19
PRODUCTS CUSTOMIZED FOR SPECIFIC LIFESTYLE PREFERENCES 20 Blue Apron and WW are partnering to introduce a WW Freestyle-inspired menu offering consisting of a weekly selection of recipes aligning with the WW SmartPoints system Healthy and delicious selection of meals, created by the Blue Apron culinary team, will be available exclusively on the Blue Apron digital platform, complementing our existing product portfolio Further expands the reach of the Blue Apron brand to a committed base of health- and wellness-conscious consumers while providing WW members with flexible and convenient options for healthy eating
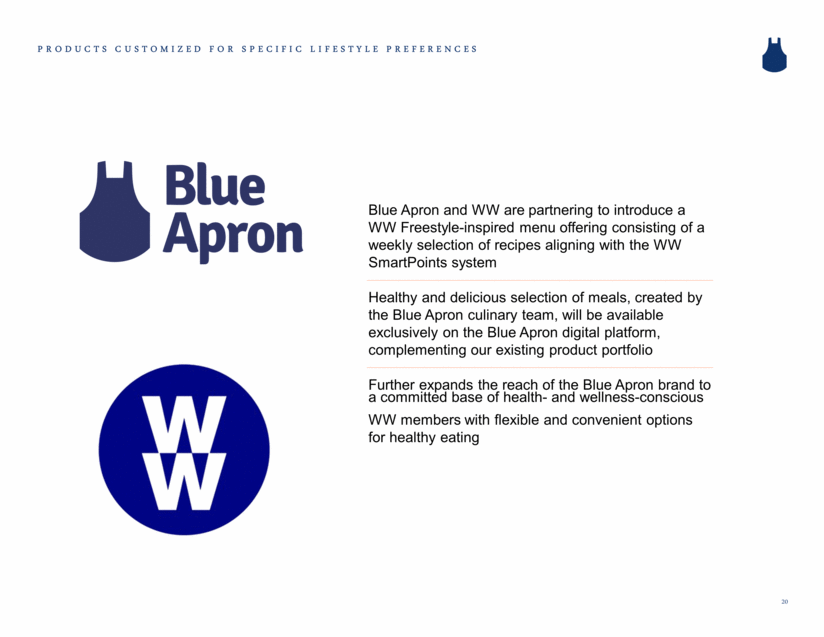
EXPERIENTIAL BRAND ACTIVATIONS WHERE CUSTOMERS MEET THE BRAND 21 Short-Term NYC Retail Pop-Up Create immersive experiences Traveling Mobile Pop-Up Educate consumers about product offerings Community Events Strengthen brand via community-centric events New York Wine and Food Festival Reinforce culinary authority
Our Financials

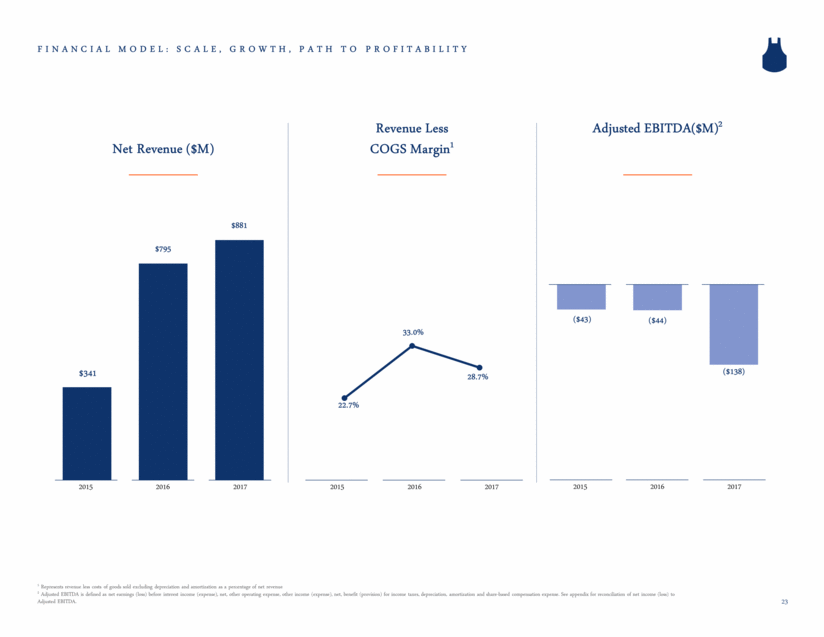
FINANCIAL MODEL: SCALE, GROWTH, PATH TO PROFITABILITY Net Revenue ($M) Revenue Less COGS Margin1 Adjusted EBITDA($M)2 1 Represents revenue less costs of goods sold excluding depreciation and amortization as a percentage of net revenue 2 Adjusted EBITDA is defined as net earnings (loss) before interest income (expense), net, other operating expense, other income (expense), net, benefit (provision) for income taxes, depreciation, amortization and share-based compensation expense. See appendix for reconciliation of net income (loss) to Adjusted EBITDA. 2015 2016 2017 2015 2016 2017 2015 2016 2017 23 ($43) ($44) ($138)
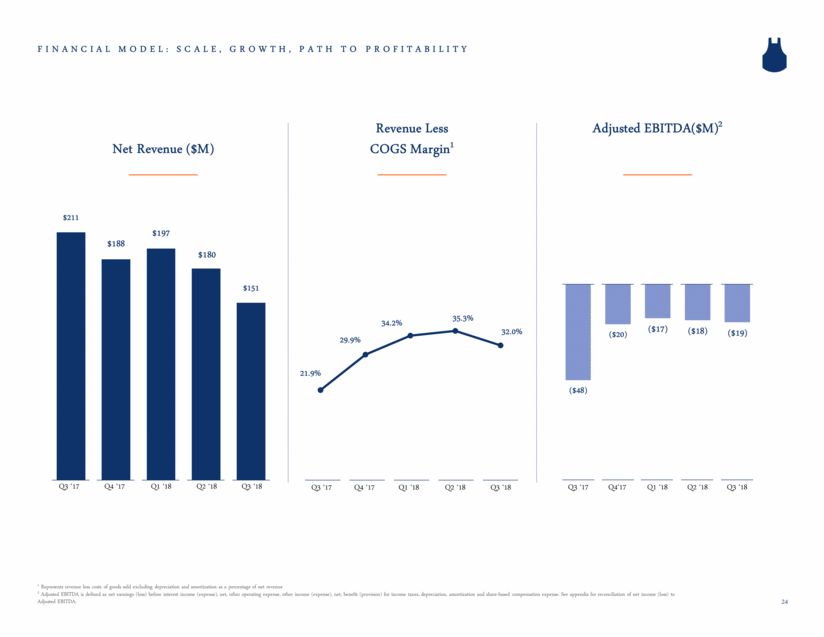
FINANCIAL MODEL: SCALE, GROWTH, PATH TO PROFITABILITY Net Revenue ($M) Revenue Less COGS Margin1 Adjusted EBITDA($M)2 1 Represents revenue less costs of goods sold excluding depreciation and amortization as a percentage of net revenue 2 Adjusted EBITDA is defined as net earnings (loss) before interest income (expense), net, other operating expense, other income (expense), net, benefit (provision) for income taxes, depreciation, amortization and share-based compensation expense. See appendix for reconciliation of net income (loss) to Adjusted EBITDA. Q3 ‘17 Q4 ‘17 Q1 ‘18 Q2 ‘18 Q3 ‘18 Q3 ‘17 Q4 ‘17 Q1 ‘18 Q2 ‘18 Q3 ‘18 Q3 ‘17 Q4‘17 Q1 ‘18 Q2 ‘18 Q3 ‘18 24 $211 $188 $197 $180 $151 21.9% 29.9% 34.2% 35.3% 32.0% ($48) ($20) ($17) ($18) ($19)
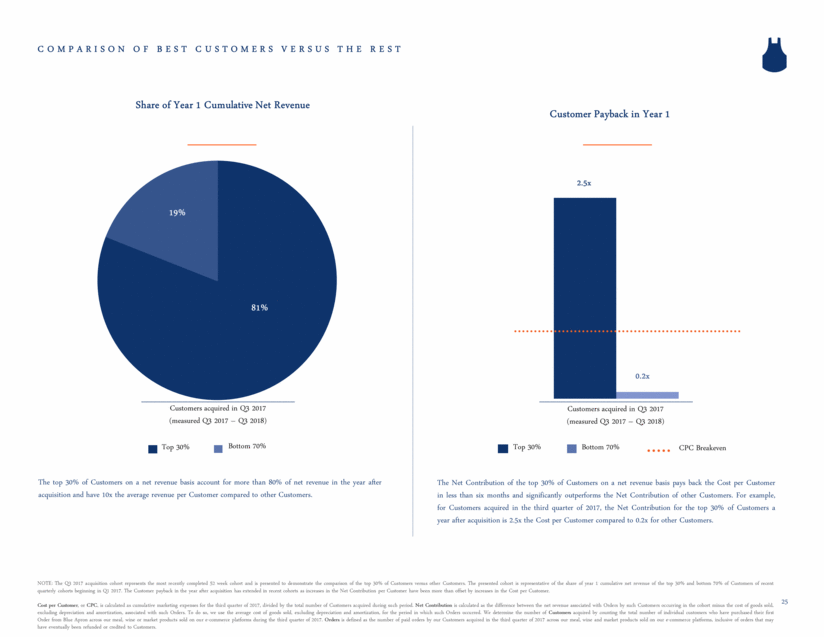
COMPARISON OF BEST CUSTOMERS VERSUS THE REST Top 30% Bottom 70% The top 30% of Customers on a net revenue basis account for more than 80% of net revenue in the year after acquisition and have 10x the average revenue per Customer compared to other Customers. Share of Year 1 Cumulative Net Revenue The Net Contribution of the top 30% of Customers on a net revenue basis pays back the Cost per Customer in less than six months and significantly outperforms the Net Contribution of other Customers. For example, for Customers acquired in the third quarter of 2017, the Net Contribution for the top 30% of Customers a year after acquisition is 2.5x the Cost per Customer compared to 0.2x for other Customers. Customer Payback in Year 1 2.5x 0.2x Top 30% Bottom 70% CPC Breakeven Customers acquired in Q3 2017 (measured Q3 2017 – Q3 2018) NOTE: The Q3 2017 acquisition cohort represents the most recently completed 52 week cohort and is presented to demonstrate the comparison of the top 30% of Customers versus other Customers. The presented cohort is representative of the share of year 1 cumulative net revenue of the top 30% and bottom 70% of Customers of recent quarterly cohorts beginning in Q1 2017. The Customer payback in the year after acquisition has extended in recent cohorts as increases in the Net Contribution per Customer have been more than offset by increases in the Cost per Customer. Cost per Customer, or CPC, is calculated as cumulative marketing expenses for the third quarter of 2017, divided by the total number of Customers acquired during such period. Net Contribution is calculated as the difference between the net revenue associated with Orders by such Customers occurring in the cohort minus the cost of goods sold, excluding depreciation and amortization, associated with such Orders. To do so, we use the average cost of goods sold, excluding depreciation and amortization, for the period in which such Orders occurred. We determine the number of Customers acquired by counting the total number of individual customers who have purchased their first Order from Blue Apron across our meal, wine or market products sold on our e-commerce platforms during the third quarter of 2017. Orders is defined as the number of paid orders by our Customers acquired in the third quarter of 2017 across our meal, wine and market products sold on our e-commerce platforms, inclusive of orders that may have eventually been refunded or credited to Customers. Customers acquired in Q3 2017 (measured Q3 2017 – Q3 2018) 19% 81% 25
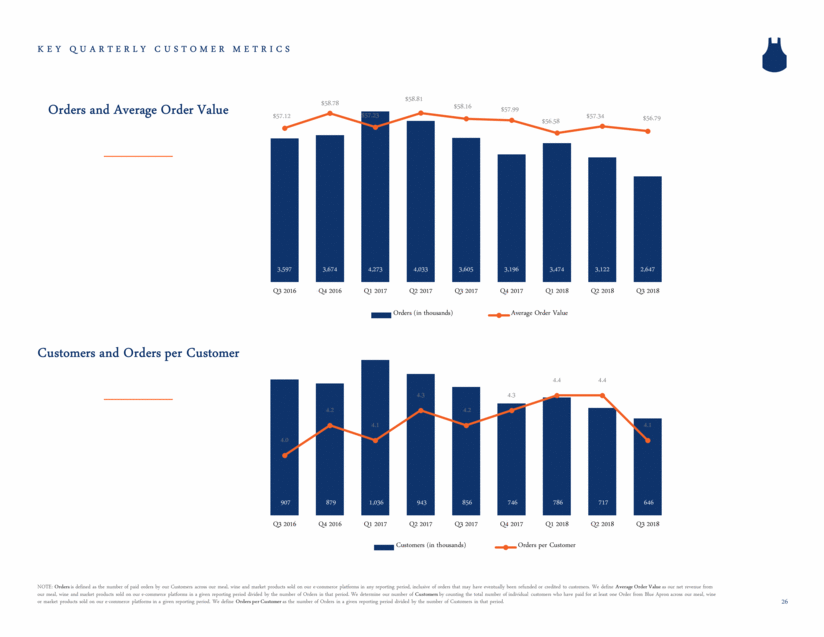
KEY QUARTERLY CUSTOMER METRICS Orders and Average Order Value Customers and Orders per Customer 26 NOTE: Orders is defined as the number of paid orders by our Customers across our meal, wine and market products sold on our e-commerce platforms in any reporting period, inclusive of orders that may have eventually been refunded or credited to customers. We define Average Order Value as our net revenue from our meal, wine and market products sold on our e-commerce platforms in a given reporting period divided by the number of Orders in that period. We determine our number of Customers by counting the total number of individual customers who have paid for at least one Order from Blue Apron across our meal, wine or market products sold on our e-commerce platforms in a given reporting period. We define Orders per Customer as the number of Orders in a given reporting period divided by the number of Customers in that period. 3,597 3,674 4,273 4,033 3,605 3,196 3,474 3,122 2,647 $57.12 $58.78 $57.23 $58.81 $58.16 $57.99 $56.58 $57.34 $56.79 Q3 2016 Q4 2016 Q1 2017 Q2 2017 Q3 2017 Q4 2017 Q1 2018 Q2 2018 Q3 2018 Orders (in thousands) Average Order Value 907 879 1,036 943 856 746 786 717 646 4.0 4.2 4.1 4.3 4.2 4.3 4.4 4.4 4.1 Q3 2016 Q4 2016 Q1 2017 Q2 2017 Q3 2017 Q4 2017 Q1 2018 Q2 2018 Q3 2018 Customers (in thousands) Orders per Customer
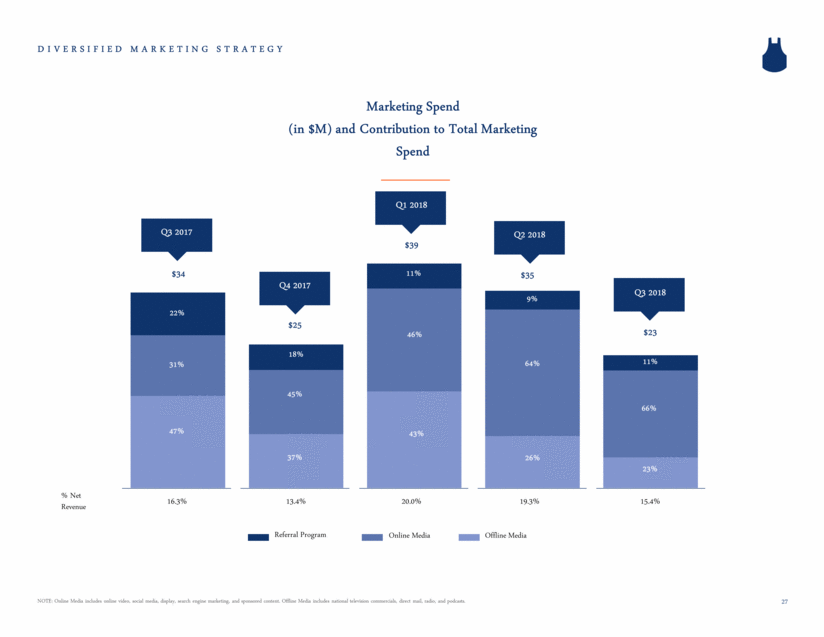
DIVERSIFIED MARKETING STRATEGY Marketing Spend (in $M) and Contribution to Total Marketing Spend 16.3% Q3 2018 % Net Revenue 13.4% 20.0% 19.3% 15.4% Q3 2017 Q4 2017 Q1 2018 Q2 2018 47% 37% 43% 26% 31% 45% 46% 64% 15% 22% 18% 11% 9% $34 $25 $39 $35 27 NOTE: Online Media includes online video, social media, display, search engine marketing, and sponsored content. Offline Media includes national television commercials, direct mail, radio, and podcasts. Referral Program Online Media Offline Media 11% 66% 23% $23
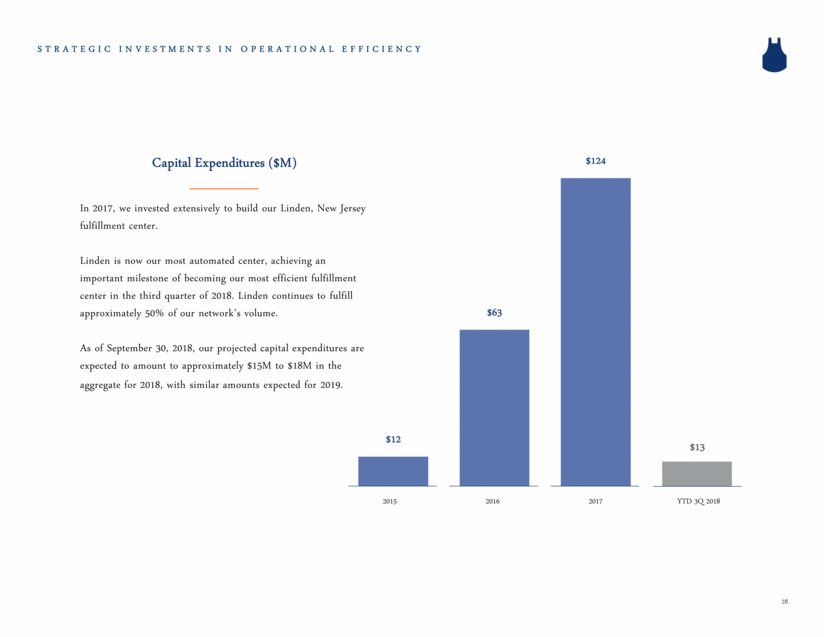
STRATEGIC INVESTMENTS IN OPERATIONAL EFFICIENCY 2015 2016 2017 $13 YTD 3Q 2018 Capital Expenditures ($M) In 2017, we invested extensively to build our Linden, New Jersey fulfillment center. Linden is now our most automated center, achieving an important milestone of becoming our most efficient fulfillment center in the third quarter of 2018. Linden continues to fulfill approximately 50% of our network’s volume. As of September 30, 2018, our projected capital expenditures are expected to amount to approximately $15M to $18M in the aggregate for 2018, with similar amounts expected for 2019. 28 $12 $63 $124
Appendix
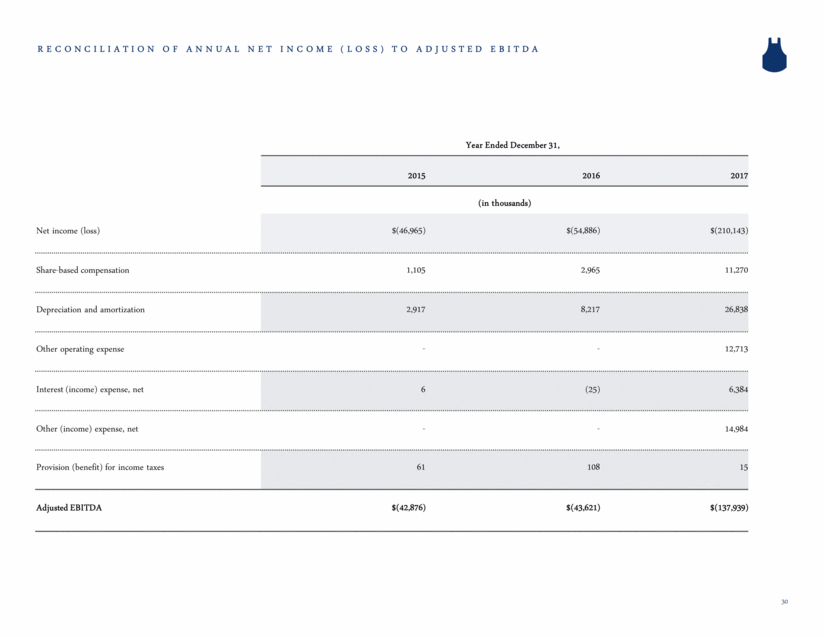
RECONCILIATION OF ANNUAL NET INCOME (LOSS) TO ADJUSTED EBITDA Year Ended December 31, 2015 2016 2017 (in thousands) Net income (loss) $(46,965) $(54,886) $(210,143) Share-based compensation 1,105 2,965 11,270 Depreciation and amortization 2,917 8,217 26,838 Other operating expense - - 12,713 Interest (income) expense, net 6 (25) 6,384 Other (income) expense, net - - 14,984 Provision (benefit) for income taxes 61 108 15 Adjusted EBITDA $(42,876) $(43,621) $(137,939) 30
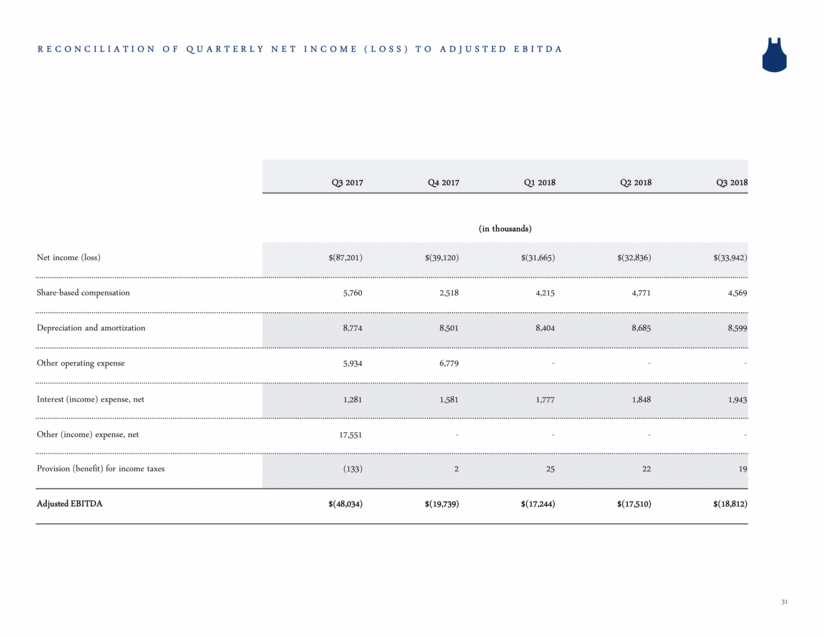
RECONCILIATION OF QUARTERLY NET INCOME (LOSS) TO ADJUSTED EBITDA 31 Q3 2017 Q4 2017 Q1 2018 Q2 2018 Q3 2018 (in thousands) Net income (loss) $(87,201) $(39,120) $(31,665) $(32,836) $(33,942) Share-based compensation 5,760 2,518 4,215 4,771 4,569 Depreciation and amortization 8,774 8,501 8,404 8,685 8,599 Other operating expense 5,934 6,779 - - - Interest (income) expense, net 1,281 1,581 1,777 1,848 1,943 Other (income) expense, net 17,551 - - - - Provision (benefit) for income taxes (133) 2 25 22 19 Adjusted EBITDA $(48,034) $(19,739) $(17,244) $(17,510) $(18,812)
