Attached files
| file | filename |
|---|---|
| EX-32.1 - EXHIBIT 32.1 - RREEF Property Trust, Inc. | rpt-20180930xex32x1.htm |
| EX-31.2 - EXHIBIT 31.2 - RREEF Property Trust, Inc. | rpt-20180930xex31x2.htm |
| EX-31.1 - EXHIBIT 31.1 - RREEF Property Trust, Inc. | rpt-20180930xex31x1.htm |
UNITED STATES
SECURITIES AND EXCHANGE COMMISSION
Washington, D.C. 20549
__________________________________________
Form 10-Q
_________________________________________
x | QUARTERLY REPORT PURSUANT TO SECTION 13 OR 15(d) OF THE SECURITIES EXCHANGE ACT OF 1934 |
For the quarterly period ended September 30, 2018
OR
o | TRANSITION REPORT PURSUANT TO SECTION 13 OR 15(d) OF THE SECURITIES EXCHANGE ACT OF 1934 |
For the transition period from ____ to ____
Commission file number 000-55598
__________________________________________
RREEF Property Trust, Inc.
(Exact name of registrant as specified in its charter)
__________________________________________
Maryland | 45-4478978 |
(State or other jurisdiction of incorporation or organization) | (I.R.S. Employer Identification Number) |
345 Park Avenue, 26th Floor, New York, NY 10154 | (212) 454-6260 |
(Address of principal executive offices; zip code) | (Registrant’s telephone number, including area code) |
Not Applicable
(Former name, former address and former fiscal year, if changed since last report)
________________________________________________________________________
Indicate by check mark whether the registrant (1) has filed all reports required to be filed by Section 13 or 15(d) of the Securities Exchange Act of 1934 during the preceding 12 months (or for such shorter period that the registrant was required to file such reports), and (2) has been subject to such filing requirements for the past 90 days. Yes x No o
Indicate by check mark whether the registrant has submitted electronically every Interactive Data File required to be submitted pursuant to Rule 405 of Regulation S-T (§ 232.405 of this chapter) during the preceding 12 months (or for such shorter period that the registrant was required to submit such files). Yes x No o
Indicate by check mark whether the registrant is a large accelerated filer, an accelerated filer, a non-accelerated filer, smaller reporting company or an emerging growth company. See the definitions of “large accelerated filer,” “accelerated filer,” “smaller reporting company,” and “emerging growth company” in Rule 12b-2 of the Exchange Act.
Large accelerated filer | o | Accelerated filer | o |
Non-accelerated filer | x | Smaller reporting company | x |
Emerging growth company | x | ||
If an emerging growth company, indicate by check mark if the registrant has elected not to use the extended transition period for complying with any new or revised financial accounting standards provided pursuant to Section 13(a) of the Exchange Act. x
Indicate by check mark whether the registrant is a shell company (as defined in Rule 12b-2 of the Exchange Act). Yes o No x
As of November 8, 2018, the registrant had 3,607,335 shares of Class A common stock, $.01 par value, outstanding, 5,770,270 shares of Class I common stock, $.01 par value, outstanding, 564,664 shares of Class T common stock, $.01 par value, outstanding, and no shares of Class D common stock, $.01 par value, or Class N common stock, $.01 par value, outstanding.
RREEF PROPERTY TRUST, INC.
QUARTERLY REPORT ON FORM 10-Q
For the Quarter Ended September 30, 2018
TABLE OF CONTENTS
2
PART I
FINANCIAL INFORMATION
ITEM 1. FINANCIAL STATEMENTS
RREEF PROPERTY TRUST, INC.
CONSOLIDATED BALANCE SHEETS
September 30, 2018 (unaudited) | December 31, 2017 | ||||||
ASSETS | |||||||
Investment in real estate assets: | |||||||
Land | $ | 46,658,955 | $ | 37,238,612 | |||
Buildings and improvements, less accumulated depreciation of $14,740,905 and $11,476,041, respectively | 97,204,810 | 92,160,948 | |||||
Furniture, fixtures and equipment, less accumulated depreciation of $272,423 and $211,727, respectively | 246,802 | 239,225 | |||||
Acquired intangible lease assets, less accumulated amortization of $18,488,151 and $15,510,271, respectively | 22,058,686 | 21,285,063 | |||||
Total investment in real estate assets, net | 166,169,253 | 150,923,848 | |||||
Investment in marketable securities | 15,697,601 | 10,046,177 | |||||
Total investment in real estate assets and marketable securities, net | 181,866,854 | 160,970,025 | |||||
Cash and cash equivalents | 3,521,462 | 2,441,853 | |||||
Receivables, net of allowance for doubtful accounts of $20,526 and $9,586, respectively | 2,473,886 | 2,615,939 | |||||
Deferred leasing costs, net of amortization of $320,947 and $201,108, respectively | 2,169,888 | 1,833,527 | |||||
Prepaid and other assets | 1,537,301 | 1,454,988 | |||||
Total assets | $ | 191,569,391 | $ | 169,316,332 | |||
LIABILITIES AND STOCKHOLDERS' EQUITY | |||||||
Line of credit, net | $ | 66,929,809 | $ | 63,022,061 | |||
Mortgage loans payable, net | 27,280,925 | 27,254,431 | |||||
Accounts payable and accrued expenses | 1,731,432 | 768,049 | |||||
Due to affiliates | 3,971,994 | 4,375,191 | |||||
Note to affiliate, net of unamortized discount of $1,401,165 and $1,509,753, respectively | 7,548,835 | 7,440,247 | |||||
Acquired below market lease intangibles, less accumulated amortization of $3,331,253 and $3,016,239, respectively | 5,807,515 | 5,667,516 | |||||
Distributions payable | 311,496 | 258,542 | |||||
Other liabilities | 1,122,082 | 1,190,779 | |||||
Total liabilities | 114,704,088 | 109,976,816 | |||||
Stockholders' Equity: | |||||||
Preferred stock, $0.01 par value; 50,000,000 shares authorized; none issued | — | — | |||||
Class A common stock, $0.01 par value; 200,000,000 shares authorized; 3,811,496 and 3,666,927 issued and outstanding, respectively | 38,115 | 36,670 | |||||
Class I common stock, $0.01 par value; 200,000,000 shares authorized; 5,620,297 and 4,352,050 issued and outstanding, respectively | 56,203 | 43,521 | |||||
Class T common stock, $0.01 par value; 250,000,000 shares authorized; 540,436 and 71,316 issued and outstanding, respectively | 5,404 | 713 | |||||
Class D common stock, $0.01 par value; 50,000,000 shares authorized; none issued | — | — | |||||
Class N common stock, $0.01 par value; 300,000,000 shares authorized; none issued | — | — | |||||
Additional paid-in capital | 110,644,957 | 86,813,276 | |||||
Deficit | (33,879,376 | ) | (28,290,303 | ) | |||
Accumulated other comprehensive income | — | 735,639 | |||||
Total stockholders' equity | 76,865,303 | 59,339,516 | |||||
Total liabilities and stockholders' equity | $ | 191,569,391 | $ | 169,316,332 | |||
The accompanying notes are an integral part of these consolidated financial statements.
3
RREEF PROPERTY TRUST, INC.
CONSOLIDATED STATEMENTS OF OPERATIONS
(Unaudited)
Three Months Ended September 30, | Nine Months Ended September 30, | ||||||||||||||
2018 | 2017 | 2018 | 2017 | ||||||||||||
Revenues | |||||||||||||||
Rental and other property income | $ | 4,302,433 | $ | 3,819,417 | $ | 11,969,709 | $ | 11,400,901 | |||||||
Tenant reimbursement income | 688,482 | 540,528 | 1,907,590 | 1,608,351 | |||||||||||
Investment income on marketable securities | 136,832 | 84,836 | 345,609 | 205,692 | |||||||||||
Total revenues | 5,127,747 | 4,444,781 | 14,222,908 | 13,214,944 | |||||||||||
Expenses | |||||||||||||||
General and administrative expenses | 434,501 | 407,787 | 1,441,290 | 1,272,533 | |||||||||||
Property operating expenses | 1,597,997 | 1,446,432 | 4,348,090 | 4,093,912 | |||||||||||
Advisory fees | 542,353 | 623,670 | 1,211,569 | 1,128,071 | |||||||||||
Depreciation | 1,162,905 | 1,085,483 | 3,325,560 | 3,253,971 | |||||||||||
Amortization | 1,125,428 | 933,854 | 2,938,390 | 2,794,203 | |||||||||||
Total operating expenses | 4,863,184 | 4,497,226 | 13,264,899 | 12,542,690 | |||||||||||
Net realized gain (loss) upon sale of marketable securities | 201,769 | (25,389 | ) | (206,763 | ) | 22,407 | |||||||||
Net unrealized (loss) gain on investment in marketable securities | (201,223 | ) | — | 280,022 | — | ||||||||||
Operating income (loss) | 265,109 | (77,834 | ) | 1,031,268 | 694,661 | ||||||||||
Interest expense | (1,012,974 | ) | (910,512 | ) | (2,800,888 | ) | (2,622,446 | ) | |||||||
Net loss | $ | (747,865 | ) | $ | (988,346 | ) | $ | (1,769,620 | ) | $ | (1,927,785 | ) | |||
Basic and diluted net loss per share of Class A common stock | $ | (0.08 | ) | $ | (0.12 | ) | $ | (0.20 | ) | $ | (0.24 | ) | |||
Basic and diluted net loss per share of Class I common stock | $ | (0.08 | ) | $ | (0.13 | ) | $ | (0.20 | ) | $ | (0.26 | ) | |||
Basic and diluted net loss per share of Class T common stock | $ | (0.07 | ) | $ | (0.10 | ) | $ | (0.19 | ) | $ | (0.22 | ) | |||
The accompanying notes are an integral part of these consolidated financial statements.
4
RREEF PROPERTY TRUST, INC.
CONSOLIDATED STATEMENTS OF COMPREHENSIVE LOSS
(Unaudited)
Three Months Ended September 30, | Nine Months Ended September 30, | ||||||||||||||
2018 | 2017 | 2018 | 2017 | ||||||||||||
Net loss | $ | (747,865 | ) | $ | (988,346 | ) | $ | (1,769,620 | ) | $ | (1,927,785 | ) | |||
Other comprehensive (loss) gain for the three and nine months ended September 30, 2017: | |||||||||||||||
Reclassification of previous unrealized loss (gain) on marketable securities into net realized loss | — | 25,389 | — | (22,407 | ) | ||||||||||
Unrealized (loss) gain on marketable securities for the three and nine months ended September 30, 2017 | — | (37,393 | ) | — | 24,921 | ||||||||||
Total other comprehensive (loss) gain for the three and nine months ended September 30, 2017 | — | (12,004 | ) | — | 2,514 | ||||||||||
Comprehensive loss | $ | (747,865 | ) | $ | (1,000,350 | ) | $ | (1,769,620 | ) | $ | (1,925,271 | ) | |||
The accompanying notes are an integral part of these consolidated financial statements.
5
RREEF PROPERTY TRUST, INC.
CONSOLIDATED STATEMENT OF STOCKHOLDERS' EQUITY
(Unaudited)
Preferred Stock | Class A Common Stock | Class I Common Stock | Class T Common Stock | Class D Common Stock | Class N Common Stock | Additional Paid-in Capital | Deficit | Accumulated Other Comprehensive Income | Total Stockholders' Equity | ||||||||||||||||||||||||||||||||||||||||||
Number of Shares | Par Value | Number of Shares | Par Value | Number of Shares | Par Value | Number of Shares | Par Value | Number of Shares | Par Value | Number of Shares | Par Value | ||||||||||||||||||||||||||||||||||||||||
Balance, December 31, 2017 | — | $ | — | 3,666,927 | $ | 36,670 | 4,352,050 | $ | 43,521 | 71,316 | $ | 713 | — | $ | — | — | $ | — | $ | 86,813,276 | $ | (28,290,303 | ) | $ | 735,639 | $ | 59,339,516 | ||||||||||||||||||||||||
Cumulative effect adjustment for change in accounting principle (see Note 2) | — | — | — | — | — | — | — | — | — | — | — | — | — | 735,639 | (735,639 | ) | — | ||||||||||||||||||||||||||||||||||
Balance, January 1, 2018, as adjusted | — | — | 3,666,927 | 36,670 | 4,352,050 | 43,521 | 71,316 | 713 | — | — | — | — | 86,813,276 | (27,554,664 | ) | — | 59,339,516 | ||||||||||||||||||||||||||||||||||
Issuance of common stock | — | — | 310,128 | 3,101 | 1,358,532 | 13,585 | 465,918 | 4,659 | — | — | — | — | 30,251,334 | — | — | 30,272,679 | |||||||||||||||||||||||||||||||||||
Issuance of common stock through the distribution reinvestment plan | — | — | 69,115 | 691 | 72,179 | 722 | 3,202 | 32 | — | — | — | — | 2,013,350 | — | — | 2,014,795 | |||||||||||||||||||||||||||||||||||
Redemption of common stock | — | — | (234,674 | ) | (2,347 | ) | (162,464 | ) | (1,625 | ) | — | — | — | — | — | — | (5,512,904 | ) | — | — | (5,516,876 | ) | |||||||||||||||||||||||||||||
Distributions to investors | — | — | — | — | — | — | — | — | — | — | — | — | — | (4,555,092 | ) | — | (4,555,092 | ) | |||||||||||||||||||||||||||||||||
Other offering costs | — | — | — | — | — | — | — | — | — | — | — | — | (2,920,099 | ) | — | — | (2,920,099 | ) | |||||||||||||||||||||||||||||||||
Net loss | — | — | — | — | — | — | — | — | — | — | — | — | — | (1,769,620 | ) | — | (1,769,620 | ) | |||||||||||||||||||||||||||||||||
Balance, September 30, 2018 | — | $ | — | 3,811,496 | $ | 38,115 | 5,620,297 | $ | 56,203 | 540,436 | $ | 5,404 | — | $ | — | — | $ | — | $ | 110,644,957 | $ | (33,879,376 | ) | $ | — | $ | 76,865,303 | ||||||||||||||||||||||||
The accompanying notes are an integral part of these consolidated financial statements.
6
RREEF PROPERTY TRUST, INC.
CONSOLIDATED STATEMENTS OF CASH FLOWS
(Unaudited)
Nine Months Ended September 30, | |||||||
2018 | 2017 | ||||||
Cash flows from operating activities: | |||||||
Net loss | $ | (1,769,620 | ) | $ | (1,927,785 | ) | |
Adjustments to reconcile net loss to net cash provided by operating activities: | |||||||
Depreciation | 3,325,560 | 3,253,971 | |||||
Net realized loss (gain) upon sale of marketable securities | 206,763 | (22,407 | ) | ||||
Net unrealized gain on marketable securities | (280,022 | ) | — | ||||
Amortization of intangible lease assets and liabilities | 2,782,705 | 2,680,086 | |||||
Amortization of deferred financing costs | 216,648 | 358,978 | |||||
Allowance for doubtful accounts | 10,940 | 16,458 | |||||
Straight line rent | 52,691 | (450,710 | ) | ||||
Amortization of discount on note to affiliate | 108,588 | 106,508 | |||||
Changes in assets and liabilities: | |||||||
Receivables | (56,477 | ) | 77,291 | ||||
Deferred leasing costs | (346,169 | ) | (93,211 | ) | |||
Prepaid and other assets | (5,020 | ) | (32,156 | ) | |||
Accounts payable and accrued expenses | 557,347 | (1,164,539 | ) | ||||
Other liabilities | (161,521 | ) | (31,977 | ) | |||
Due to affiliates | (331,611 | ) | 87,094 | ||||
Net cash provided by operating activities | 4,310,802 | 2,857,601 | |||||
Cash flows from investing activities: | |||||||
Investment in real estate and related assets | (20,618,450 | ) | — | ||||
Improvements to real estate assets | (103,163 | ) | (119,755 | ) | |||
Investment in marketable securities | (22,178,430 | ) | (12,161,827 | ) | |||
Proceeds from sale of marketable securities | 16,555,574 | 10,997,483 | |||||
Net cash used in investing activities | (26,344,469 | ) | (1,284,099 | ) | |||
Cash flows from financing activities: | |||||||
Proceeds from line of credit | 19,900,000 | 3,250,000 | |||||
Repayments of line of credit | (15,500,000 | ) | (3,950,000 | ) | |||
Proceeds from issuance of common stock | 30,376,055 | 10,353,815 | |||||
Payment of financing costs | (682,407 | ) | — | ||||
Payment of offering costs | (2,976,153 | ) | (2,305,716 | ) | |||
Distributions to investors | (4,502,138 | ) | (3,862,541 | ) | |||
Redemption of common stock | (5,516,876 | ) | (5,751,172 | ) | |||
Common stock issued through the distribution reinvestment plan | 2,014,795 | 1,638,756 | |||||
Net cash provided by (used in) financing activities | 23,113,276 | (626,858 | ) | ||||
Net increase in cash and cash equivalents | 1,079,609 | 946,644 | |||||
Cash and cash equivalents, beginning of period | 2,441,853 | 1,493,256 | |||||
Cash and cash equivalents, end of period | $ | 3,521,462 | $ | 2,439,900 | |||
The accompanying notes are an integral part of these consolidated financial statements.
7
RREEF PROPERTY TRUST, INC.
CONSOLIDATED STATEMENTS OF CASH FLOWS
(continued)
(Unaudited)
Nine Months Ended September 30, | |||||||
Supplemental Disclosures of Non-Cash Investing and Financing Activities: | 2018 | 2017 | |||||
Distributions declared and unpaid | $ | 311,496 | $ | 248,375 | |||
Net unrealized gain on marketable securities, nine months ended September 30, 2017 | — | 2,514 | |||||
Purchases of marketable securities not yet paid | 26,312 | 60,460 | |||||
Proceeds from sale of marketable securities not yet received | 41,746 | 30,480 | |||||
Proceeds from issuance of common stock not yet received | 118,624 | 189,575 | |||||
Accrued offering costs not yet paid | 1,536,975 | 907,648 | |||||
Capital expenditures not yet paid | 144,850 | — | |||||
Supplemental Cash Flow Disclosures: | |||||||
Interest paid | $ | 2,412,657 | $ | 2,091,318 | |||
In connection with the purchase of investments in real estate and related assets, the Company also assumed certain non-real estate assets and liabilities: | |||||||
Purchase price | $ | 20,842,319 | $ | — | |||
Other liabilities assumed | (223,869 | ) | — | ||||
Investment in real estate and related assets | $ | 20,618,450 | $ | — | |||
The accompanying notes are an integral part of these consolidated financial statements.
8
RREEF PROPERTY TRUST, INC.
NOTES TO CONSOLIDATED FINANCIAL STATEMENTS
September 30, 2018
(Unaudited)
NOTE 1 — ORGANIZATION
RREEF Property Trust, Inc. (the “Company”) was formed on February 7, 2012 as a Maryland corporation and has elected to qualify as a real estate investment trust (“REIT”) for federal income tax purposes. Substantially all of the Company's business is conducted through RREEF Property Operating Partnership, LP, the Company's operating partnership (the “Operating Partnership”). The Company is the sole general partner of the Operating Partnership. RREEF Property OP Holder, LLC (the “OP Holder”), a wholly-owned subsidiary of the Company, is the limited partner of the Operating Partnership. As the Company completes the settlement for purchase orders for shares of its common stock in its continuous public offering, it will continue to transfer substantially all of the proceeds to the Operating Partnership.
The Company was organized to invest primarily in a diversified portfolio consisting primarily of high quality, income-producing commercial real estate located in the United States, including, without limitation, office, industrial, retail and apartment properties (“Real Estate Properties”). Although the Company intends to invest primarily in Real Estate Properties, it also intends to acquire common and preferred stock of REITs and other real estate companies (“Real Estate Equity Securities”) and debt investments backed principally by real estate (“Real Estate Loans” and, together with Real Estate Equity Securities, “Real Estate-Related Assets”).
On January 3, 2013, the Securities and Exchange Commission ("SEC") declared effective the Company's registration statement on Form S-11 (File No. 333-180356), filed under the Securities Act of 1933, as amended (the "Initial Registration Statement"). On May 30, 2013, RREEF America L.L.C., a Delaware limited liability company (“RREEF America”), the Company's sponsor and advisor, purchased $10,000,000 of the Company's Class I common stock, $0.01 par value per share ("Class I Shares"), and the Company’s board of directors authorized the release of the escrowed funds to the Company, thereby allowing the Company to commence operations.
On January 15, 2016, the Company filed articles supplementary to its articles of incorporation to add a newly-designated Class D common stock, $0.01 par value per share ("Class D Shares"). On January 20, 2016, the Company commenced a private offering of up to a maximum of $350,000,000 in Class D Shares (the "Private Offering," and together with the Follow-On Public Offering (defined below), the "Offerings").
On July 12, 2016, the SEC declared effective the Company's registration statement on Form S-11 (File No. 333-208751), filed under the Securities Act of 1933, as amended (the "Registration Statement"). Pursuant to the Registration Statement, the Company is offering for sale up to $2,100,000,000 of shares of its Class A common stock, $0.01 par value per share ("Class A Shares"), Class I Shares, and Class T common stock, $0.01 par value per share ("Class T Shares"), in its primary offering and up to $200,000,000 of Class A Shares, Class I Shares, Class N common stock, $0.01 par value per share ("Class N Shares") and Class T Shares pursuant to its distribution reinvestment plan, to be sold on a "best efforts" basis for the Company's follow-on public offering (the "Follow-On Public Offering"). The Company's initial public offering terminated upon the commencement of the Follow-On Public Offering.
Shares of the Company’s common stock are sold at the Company’s net asset value (“NAV”) per share, plus, for Class A, T and D Shares only, applicable selling commissions. Each class of shares may have a different NAV per share because of certain class-specific fees. NAV per share is calculated by dividing the NAV at the end of each business day for each class by the number of shares outstanding for that class on such day.
The Company's NAV per share for its Class A, Class I and Class T Shares is posted to the Company's website at www.rreefpropertytrust.com after the stock market close each business day. Additionally, the Company's NAV per share for its Class A, Class I and Class T Shares is published daily via NASDAQ's Mutual Fund Quotation System
9
RREEF PROPERTY TRUST, INC.
NOTES TO CONSOLIDATED FINANCIAL STATEMENTS - continued
September 30, 2018
(Unaudited)
under the symbols ZRPTAX, ZRPTIX and ZRPTTX for its Class A Shares, Class I Shares and Class T Shares, respectively.
NOTE 2 — SUMMARY OF SIGNIFICANT ACCOUNTING POLICIES
Basis of Presentation and Principles of Consolidation
The accompanying consolidated financial statements have been prepared in accordance with the Financial Accounting Standards Board (“FASB”) Accounting Standards Codification (“ASC”), the authoritative reference for U.S. generally accepted accounting principles (“GAAP”). There have been no significant changes to the Company's significant accounting policies during the nine months ended September 30, 2018 except for the adoption of Accounting Standards Updates ("ASU") noted below in Note 2. The interim financial data as of September 30, 2018 and for the three and nine months ended September 30, 2018 and 2017 is unaudited. In our opinion, the interim data includes all adjustments, consisting only of normal recurring adjustments, necessary for a fair statement of the results for the interim periods.
Use of Estimates
The preparation of the consolidated financial statements in conformity with GAAP requires management to make estimates and assumptions that affect the amounts reported in the consolidated financial statements and accompanying notes. Actual results could differ from those estimates.
Real Estate Investments and Lease Intangibles
In January 2017, FASB issued ASU 2017-01, Business Combinations (Topic 805): Clarifying the Definition of a Business, the intent of which is to assist entities with evaluating whether transactions should be accounted for as acquisitions (and dispositions) of assets or businesses. Under the previous implementation guidance, real estate was broadly interpreted to be a business, which required, among other things, that acquisition related costs be expensed at the time of acquisition. The amendments in ASU 2017-01 provide a screen to determine when a set of identifiable assets is not a business. The screen requires that when substantially all of the fair value of the gross assets acquired (or disposed of) is concentrated in a single identifiable asset or a group of similar identifiable assets, the set is not a business. Generally, a real estate asset and its related leases will be considered a single identifiable asset and therefore will not meet the definition of a business. If the real estate and related leases in an acquisition are determined to be an asset and not a business, then the acquisition related costs would be capitalized onto the consolidated balance sheet. The Company adopted ASU 2017-01 on its effective date of January 1, 2018, which did not have an impact on the Company's consolidated financial statements. Acquisitions of real estate investments after January 1, 2018 will be evaluated based on ASU 2017-01 and may result in the capitalization of acquisition related costs for those acquisitions deemed to be asset acquisitions.
Investments in Marketable Securities
Effective January 1, 2018, the Company adopted ASU 2016-01, Financial Statements - Overall (Subtopic 825-10) - Recognition and Measurement of Financial Assets and Financial Liabilities, which improves certain aspects of the recognition, measurement, presentation and disclosure of financial instruments. ASU 2016-01 revised the accounting related to the classification and measurement of investments in equity securities and the presentation of certain fair value changes for financial liabilities measured at fair value. Since the Company's inception and prior to adoption of ASU 2016-01, it has accounted for its investments in equity securities as available for sale securities, with unrealized changes in fair value recognized in other comprehensive income or loss. Beginning January 1, 2018, the net unrealized change in the fair value of the Company's investments in marketable securities is recorded in earnings as part of operating income or loss.
The Company adopted ASU 2016-01 using a modified retrospective approach that resulted in recording, on January 1, 2018, a cumulative effect adjustment of $735,639 of net unrealized gain on its investments in marketable securities as of December 31, 2017 into deficit in the accompanying consolidated financial statements.
10
RREEF PROPERTY TRUST, INC.
NOTES TO CONSOLIDATED FINANCIAL STATEMENTS - continued
September 30, 2018
(Unaudited)
The Company has reclassified the $25,389 of net realized loss and $22,407 of net realized gain upon sale of marketable securities on the accompanying consolidated statement of operations for the three and nine months ended September 30, 2017, respectively, to include it in operating income or loss for comparative purposes. This reclassification has not changed the Company's net loss for the three and nine months ended September 30, 2017.
Organization and Offering Costs
Organizational expenses and other expenses which do not qualify as offering costs are expensed as incurred. Offering costs are those costs incurred by the Company, RREEF America and its affiliates on behalf of the Company which relate directly to the Company’s activities of raising capital in the Offerings, preparing for the Offerings, the qualification and registration of the Offerings and the marketing and distribution of the Company’s shares. This includes, but is not limited to, accounting and legal fees, including the legal fees of the dealer manager for the public offerings, costs for registration statement amendments and prospectus supplements, printing, mailing and distribution costs, filing fees, amounts to reimburse RREEF America as the Company’s advisor or its affiliates for the salaries of employees and other costs in connection with preparing supplemental sales literature, amounts to reimburse the dealer manager for amounts that it may pay to reimburse the bona fide due diligence expenses of any participating broker-dealers supported by detailed and itemized invoices, telecommunication costs, fees of the transfer agent, registrars, trustees, depositories and experts, the cost of educational conferences held by the Company (including the travel, meal and lodging costs of registered representatives of any participating broker-dealers) and attendance fees and cost reimbursement for employees of affiliates to attend retail seminars conducted by broker-dealers. Offering costs will be paid from the proceeds of the Offerings. These costs will be treated as a reduction of the total proceeds. Total organization and offering costs incurred by the Company with respect to a particular Offering will not exceed 15% of the gross proceeds from such particular Offering. In addition, the Company will not reimburse RREEF America or the dealer manager for any underwriting compensation (a subset of organization and offering costs) which would cause the Company’s total underwriting compensation to exceed 10% of the gross proceeds from the primary portion of a particular offering.
Included in offering costs are (1) distribution fees paid on a trailing basis at the rate of (a) 0.50% per annum on the NAV of the outstanding Class A Shares, and (b) 1.00% per annum for approximately three years on the NAV of the outstanding Class T Shares, and (2) dealer manager fees paid on a trailing basis at the rate of 0.55% per annum on the NAV of the outstanding Class A and Class I Shares (collectively, the "Trailing Fees"). The Trailing Fees are computed daily based on the respective NAV of each share class as of the beginning of each day and paid monthly. However, at each reporting date, the Company accrues an estimate for the amount of Trailing Fees that ultimately may be paid on the outstanding shares. Such estimate reflects the Company's assumptions for certain variables, including future redemptions, share price appreciation and the total gross proceeds raised or to be raised during each Offering. In addition, the estimated accrual for future Trailing Fees as of a given reporting date may be reduced by the aforementioned limits on total organization and offering costs and total underwriting compensation. Changes in this estimate will be recorded prospectively as an adjustment to additional paid-in capital. As of September 30, 2018 and December 31, 2017, the Company has accrued $2,869,271 and $2,238,576, respectively, in Trailing Fees to be payable in the future, which was included in due to affiliates on the consolidated balance sheets.
Revenue Recognition
In May 2014, the FASB issued ASU 2014-09, Revenue From Contracts With Customers. ASU 2014-09 requires entities to recognize revenue in their financial statements in a manner that depicts the transfer of the promised goods or services to its customers in an amount that reflects the consideration to which the entity is entitled at the time of transfer of those goods or services. As a result, the amount and timing of revenue recognition may be affected. However, certain types of contracts are excluded from the provisions of ASU 2014-09, including leases. Other types of real estate related contracts, such as for dispositions or development of real estate, will be impacted by ASU 2014-09. In addition, ASU 2014-09 requires additional disclosures regarding revenue recognition. The Company adopted ASU 2014-09, as amended, on its effective of January 1, 2018, using the cumulative effect adjustment
11
RREEF PROPERTY TRUST, INC.
NOTES TO CONSOLIDATED FINANCIAL STATEMENTS - continued
September 30, 2018
(Unaudited)
method in the period of adoption. The adoption of ASU 2014-09 did not have a material impact on the Company's consolidated financial statements.
Net Earnings or Loss Per Share
Net earnings or loss per share is calculated using the two-class method. The two-class method is utilized when an entity (1) has different classes of common stock that participate differently in net earnings or loss, or (2) has issued participating securities, which are securities that participate in distributions separately from the entity’s common stock. Pursuant to the advisory agreement between the Company and its advisor (see Note 8), the advisor may earn a performance component of the advisory fee which is calculated separately for each class of common stock which therefore may result in a different allocation of net earnings or loss to each class of common stock. Since the Company’s inception, the Company has not issued any participating securities.
Concentration of Credit Risk
As of September 30, 2018 and December 31, 2017, the Company had cash on deposit at multiple financial institutions which were in excess of federally insured levels. The Company limits significant cash holdings to accounts held by financial institutions with a high credit standing. Therefore, the Company believes it is not exposed to any significant credit risk on its cash deposits.
Recent Accounting Pronouncements
In February 2016, FASB issued ASU 2016-02, Leases (Topic 842), which sets out the principles for the recognition, measurement, presentation and disclosure of leases for both lessees and lessors. ASU 2016-02 requires lessors to identify the lease and non-lease components contained within each lease. Common area maintenance reimbursements within a real estate lease under ASU 2016-02 are considered a non-lease component and as such, would have to be evaluated under the revenue recognition guidance of ASU 2014-09. However, in July 2018, FASB issued ASU 2018-11, Leases (Topic 842) - Targeted Improvements. Under ASU 2018-11, a lessor may elect a practical expedient to not separate lease and non-lease components of a lease and instead account for them as a single component if two criteria are met: (1) the timing and pattern of transfer of the non-lease component(s) and associated lease component are the same, and (2) the lease component, if accounted for separately, would be classified as an operating lease. Furthermore, the combined component will be accounted for under the new revenue recognition guidance of ASU 2014-09 if the non-lease components are the predominant component of the combined component. Otherwise, the combined component will be accounted for under the lease guidance of ASU 2016-02.
ASU 2016-02 requires lessees to apply a dual approach, classifying leases as either finance or operating leases based on the principle of whether or not the lease is effectively a financed purchase by the lessee. This classification will determine whether lease expense is recognized based on an effective interest method or on a straight line basis over the term of the lease. A lessee is also required to record a right-of-use asset and a lease liability for all leases with a term of greater than 12 months regardless of their classification. Leases with a term of 12 months or less will be accounted for similar to existing guidance for operating leases today. As of September 30, 2018, the Company is not a lessee under any lease contracts. As of September 30, 2018, all of the Company's leases are classified as operating leases, and it is expected that such leases will continue to be classified as operating leases under ASU 2016-02. The Company intends to adopt ASU 2016-02 when it is effective on January 1, 2019. The Company is still evaluating the impact of ASU 2016-02 and subsequent amendments on its consolidated financial statements but currently does not expect adoption of ASU 2016-02 to have a material impact.
In August 2018, FASB issued ASU 2018-13, Fair Value Measurement (Topic 820) - Disclosure Framework - Changes to Disclosure Requirements for Fair Value Measurement. ASU 2018-13 changes the fair value measurement disclosure requirements of ASC 820 by eliminating, modifying or adding certain disclosure requirements for fair value measurements. ASU 2018-13 is effective for fiscal years beginning after December 15, 2019, including interim periods therein. However, ASU 2018-13 allows an entity to early adopt the provisions regarding eliminating or modifying certain disclosures while not adopting the provisions regarding additional
12
RREEF PROPERTY TRUST, INC.
NOTES TO CONSOLIDATED FINANCIAL STATEMENTS - continued
September 30, 2018
(Unaudited)
disclosures until the effective date of the ASU. The Company is evaluating the impact of ASU 2018-13 but does not expect a material change to its fair value disclosures.
NOTE 3 — FAIR VALUE MEASUREMENTS
Fair value measurements are determined based on the assumptions that market participants would use in pricing an asset or liability. As a basis for considering market participant assumptions in fair value measurements, FASB ASC 820, Fair Value Measurement and Disclosures, establishes a fair value hierarchy that distinguishes between market participant assumptions based on market data obtained from sources independent of the reporting entity (observable inputs that are classified within Levels 1 and 2 of the hierarchy) and the reporting entity's own assumptions about market participant assumptions (unobservable inputs classified within Level 3 of the hierarchy).
Level 1 inputs utilize quoted prices (unadjusted) in active markets for identical assets or liabilities that the Company has the ability to access. Level 2 inputs are inputs other than quoted prices included in Level 1 that are observable for the asset or liability, either directly or indirectly. Level 2 inputs may include quoted prices for similar assets and liabilities in active markets, as well as inputs that are observable for the asset or liability (other than quoted prices), such as interest rates and yield curves that are observable at commonly quoted intervals. Level 3 inputs are the unobservable inputs for the asset or liability, which are typically based on an entity's own assumption, as there is little, if any, related market activity. In instances where the determination of the fair value measurement is based on input from different levels of the fair value hierarchy, the level in the fair value hierarchy within which the entire fair value measurement falls is based on the lowest level input that is significant to the fair value measurement in its entirety. The Company's assessment of the significance of a particular input to the fair value measurement in its entirety requires judgment and considers factors specific to the asset or liability.
The Company's investments in marketable securities are valued using Level 1 inputs as the securities are publicly traded on major stock exchanges.
FASB ASC 825-10-65-1 requires the Company to disclose fair value information for all financial instruments for which it is practicable to estimate fair value, whether or not recognized in the consolidated balance sheets. Fair value of lines of credit and mortgage loans payable is determined using Level 2 inputs and a discounted cash flow approach with an interest rate and other assumptions that approximate current market conditions. The carrying amount of the Company's line of credit, exclusive of deferred financing costs, approximated its fair value of $67,500,000 and $63,100,000 at September 30, 2018 and December 31, 2017, respectively. The Company estimated the fair value of the Company's mortgage loans payable at $25,985,182 and $26,610,378 as of September 30, 2018 and December 31, 2017, respectively.
The fair value of the Company's note to affiliate is determined using Level 3 inputs and a discounted cash flow approach with an interest rate and other assumptions that estimate current market conditions. The Company has estimated the fair value of its note to affiliate at approximately $2,600,000 and $2,400,000 as of September 30, 2018 and December 31, 2017, respectively.
The Company's financial instruments, other than those referred to above, are generally short-term in nature and contain minimal credit risk. These instruments consist of cash and cash equivalents, accounts and other receivables and accounts payable. The carrying amounts of these assets and liabilities in the consolidated balance sheets approximate their fair value.
NOTE 4 — REAL ESTATE INVESTMENTS
The Company acquired three real estate properties during the three and nine months ended September 30, 2018 and no real estate property during the three and nine months ended September 30, 2017.
On July 17, 2018, the Company acquired three industrial properties located in Miami, Florida ("Miami Industrial") for a purchase price of $20,700,000 (excluding closing costs). The acquisition was funded with proceeds from the Offering and by borrowing $19,900,000 under the Company's line of credit. Miami Industrial consists of
13
RREEF PROPERTY TRUST, INC.
NOTES TO CONSOLIDATED FINANCIAL STATEMENTS - continued
September 30, 2018
(Unaudited)
three warehouse distribution buildings totaling 289,919 square feet fully leased to three tenants, with one tenant per building.
All leases at Miami Industrial have been classified as operating leases. Under ASU 2017-01, the transaction was determined to be an asset acquisition, resulting in the Company's capitalization of $142,319 of acquisition related costs. The Company's allocation of the purchase price (including acquisition related costs) of Miami Industrial is as follows:
Miami Industrial | |||
Land | $ | 9,420,343 | |
Building and improvements | 8,125,485 | ||
Acquired in-place leases | 3,751,504 | ||
Acquired below-market leases | (455,013 | ) | |
Total purchase price | $ | 20,842,319 | |
The Company recorded revenues and net loss related to Miami Industrial, acquired during the three and nine months ended September 30, 2018 as follows:
Three and Nine Months Ended September 30, 2018 | |||
Revenues | $ | 416,727 | |
Net loss | (117,213 | ) | |
The Company’s estimated revenues and net loss, on a pro forma basis (as if the acquisition of Miami Industrial was completed on January 1, 2017), for the three and nine months ended September 30, 2018 are as follows:
Three Months Ended September 30, 2018 | Nine Months Ended September 30, 2018 | |||||
Revenues | $ | 5,207,968 | $ | 15,210,628 | ||
Net loss | (777,281 | ) | (2,131,800 | ) | ||
Basic and diluted net loss per share of Class A common stock | $ | (0.08 | ) | $ | (0.24 | ) |
Basic and diluted net loss per share of Class I common stock | $ | (0.08 | ) | $ | (0.25 | ) |
Basic and diluted net loss per share of Class T common stock | $ | (0.07 | ) | $ | (0.23 | ) |
The pro forma information is presented for informational purposes only and may not be indicative of what actual results of operations would have been had the transactions occurred at the beginning of period presented, nor does it purport to represent the results of future operations.
NOTE 5 — RENTALS UNDER OPERATING LEASES
As of September 30, 2018, the Company owned four office properties (including one medical office property), two retail properties and four industrial properties with a total of twenty-one tenants, and one student housing property with 316 beds. As of September 30, 2017, the Company owned four office properties (including one medical office property), two retail properties and one industrial property with a total of nineteen tenants, and one student housing property with 316 beds. All leases at the Company's properties have been classified as operating
14
RREEF PROPERTY TRUST, INC.
NOTES TO CONSOLIDATED FINANCIAL STATEMENTS - continued
September 30, 2018
(Unaudited)
leases. The Company's rental and other property income from its real estate investments for the three and nine months ended September 30, 2018 and 2017 is comprised of the following:
Three Months Ended September 30, | Nine Months Ended September 30, | ||||||||||||||
2018 | 2017 | 2018 | 2017 | ||||||||||||
Rental revenue | $ | 3,979,066 | $ | 3,714,023 | $ | 11,866,716 | $ | 10,836,073 | |||||||
Straight-line revenue | 257,840 | 67,638 | (52,691 | ) | 450,710 | ||||||||||
Above- and below-market lease amortization, net | 91,650 | 63,878 | 233,200 | 191,634 | |||||||||||
Lease incentive amortization | (26,123 | ) | (26,122 | ) | (77,516 | ) | (77,516 | ) | |||||||
Rental and other property income | $ | 4,302,433 | $ | 3,819,417 | $ | 11,969,709 | $ | 11,400,901 | |||||||
Percentages of gross rental revenues by property and tenant representing more than 10% of the Company's total gross rental revenues (rental and other property income and tenant reimbursement income) for the three and nine months ended September 30, 2018 and 2017 are shown below.
Percent of actual gross rental revenues | ||||||
Property | Three Months Ended September 30, 2018 | Nine Months Ended September 30, 2018 | ||||
Flats at Carrs Hill, Athens, GA | 16.2 | % | 16.7 | % | ||
Loudoun Gateway, Sterling, VA | 14.8 | 16.2 | ||||
Allied Drive, Dedham, MA | 14.6 | 15.9 | ||||
Anaheim Hills Office Plaza, Anaheim, CA | 11.7 | 12.5 | ||||
Terra Nova Plaza, Chula Vista, CA | 11.1 | 11.9 | ||||
Commerce Corner, Logan Township, NJ | 10.5 | 10.4 | ||||
Total | 78.9 | % | 83.6 | % | ||
Percent of actual gross rental revenues | ||||||
Tenant | Three Months Ended September 30, 2018 | Nine Months Ended September 30, 2018 | ||||
Orbital ATK Inc. - Loudoun Gateway | 14.8 | % | 16.2 | % | ||
New England Baptist Hospital - Allied Drive | 12.6 | 13.5 | ||||
Total | 27.4 | % | 29.7 | % | ||
15
RREEF PROPERTY TRUST, INC.
NOTES TO CONSOLIDATED FINANCIAL STATEMENTS - continued
September 30, 2018
(Unaudited)
Percent of actual gross rental revenues | ||||||
Property | Three Months Ended September 30, 2017 | Nine Months Ended September 30, 2017 | ||||
Flats at Carrs Hill, Athens, GA | 17.7 | % | 17.4 | % | ||
Loudoun Gateway, Sterling, VA | 16.7 | 17.3 | ||||
Allied Drive, Dedham, MA | 15.7 | 16.2 | ||||
Terra Nova Plaza, Chula Vista, CA | 13.0 | 12.5 | ||||
Anaheim Hills Office Plaza, Anaheim, CA | 12.9 | 12.6 | ||||
Commerce Corner, Logan Township, NJ | 10.6 | 10.4 | ||||
Total | 86.6 | % | 86.4 | % | ||
Percent of actual gross rental revenues | ||||||
Tenant | Three Months Ended September 30, 2017 | Nine Months Ended September 30, 2017 | ||||
Orbital ATK Inc. - Loudoun Gateway | 16.7 | % | 17.3 | % | ||
New England Baptist Hospital - Allied Drive | 13.4 | 13.7 | ||||
Total | 30.1 | % | 31.0 | % | ||
The Company's tenants representing more than 10% of in-place annualized base rental revenues as of September 30, 2018 and 2017 were as follows:
Percent of in-place annualized base rental revenues as of | ||||||
Property | September 30, 2018 | September 30, 2017 | ||||
Orbital ATK Inc. - Loudoun Gateway | 17.5 | % | 18.7 | % | ||
New England Baptist Hospital - Allied Drive | 9.9 | 10.7 | ||||
Total | 27.4 | % | 29.4 | % | ||
NOTE 6 — MARKETABLE SECURITIES
The following is a summary of the Company's marketable securities held as of September 30, 2018 and December 31, 2017, which consisted entirely of publicly-traded shares of common stock in REITs as of each date. All marketable securities held as of December 31, 2017 were available-for-sale securities and none were considered impaired on an other-than-temporary basis. Pursuant to ASU 2016-01 adopted by the Company (see Note 2), beginning on January 1, 2018, changes in fair value of the Company's investments in marketable securities are recorded in earnings.
September 30, 2018 | December 31, 2017 | ||||||
Marketable securities—cost | $ | 14,681,940 | $ | 9,310,538 | |||
Unrealized gains | 1,091,409 | 832,651 | |||||
Unrealized losses | (75,748 | ) | (97,012 | ) | |||
Net unrealized gain | 1,015,661 | 735,639 | |||||
Marketable securities—fair value | $ | 15,697,601 | $ | 10,046,177 | |||
Upon the sale of a particular security, the realized net gain or loss is computed assuming the shares with the highest cost are sold first. During the three months ended September 30, 2018 and 2017, marketable securities sold
16
RREEF PROPERTY TRUST, INC.
NOTES TO CONSOLIDATED FINANCIAL STATEMENTS - continued
September 30, 2018
(Unaudited)
generated proceeds of $5,468,743 and $3,030,317, respectively, resulting in gross realized gains of $297,496 and $110,632, respectively, and gross realized losses of $95,727 and $136,021, respectively. During the nine months ended September 30, 2018 and 2017, marketable securities sold generated proceeds of $16,524,051 and $10,943,630, respectively, resulting in gross realized gains of $508,338 and $480,574, respectively, and gross realized losses of $715,101 and $458,167, respectively.
NOTE 7 — NOTES PAYABLE
Wells Fargo Line of Credit
On March 6, 2015, the Company, as guarantor, and the wholly-owned subsidiaries of the Operating Partnership, as co-borrowers, entered into a secured revolving line of credit arrangement (the “Wells Fargo Line of Credit”) pursuant to a credit agreement with Wells Fargo Bank, National Association, as administrative agent, and other lending institutions that may become parties to the credit agreement. The Wells Fargo Line of Credit had a three-year term set to mature on March 6, 2018 with two one-year extension options exercisable by the Company upon satisfaction of certain conditions and payment of applicable extension fees. As of December 31, 2017, the outstanding balance was $63,100,000 and the weighted average interest rate was 3.16%. As of December 31, 2017, the maximum borrowing capacity was $69,900,795, and the Company was in compliance with all covenants.
On February 27, 2018, the Company, as guarantor, and certain of the wholly-owned subsidiaries of the Operating Partnership, as co-borrowers, entered into an amended and restated secured revolving credit facility (the “Revised Wells Fargo Line of Credit”) with Wells Fargo Bank, National Association, as administrative agent, and other lending institutions that may become parties to the credit agreement. The Revised Wells Fargo Line of Credit has a three-year term maturing February 27, 2021. The Company has two one-year extension options following the initial term subject to satisfaction of certain conditions and payment of applicable extension fees.
The interest rate under the Revised Wells Fargo Line of Credit is based on the 1-month London Inter-bank Offered Rate ("LIBOR") with a spread of 160 to 180 basis points depending on the debt yield as defined in the agreement. In addition, the Revised Wells Fargo Line of Credit has a maximum capacity of $100,000,000 and is expandable by the Company up to a maximum capacity of $200,000,000 upon satisfaction of specified conditions. Each requested expansion must be for at least $25,000,000 and may result in the Revised Wells Fargo Line of Credit being syndicated. As of September 30, 2018, the outstanding balance was $67,500,000 and the weighted average interest rate was 3.76%.
At any time, the borrowing capacity under the Revised Wells Fargo Line of Credit is based on the lesser of (1) an amount equal to 65% of the aggregate value of the properties in the collateral pool as determined by lender appraisals, (2) an amount that results in a minimum debt yield of 10% based on the in-place net operating income of the collateral pool as defined, or (3) the maximum capacity of the Revised Wells Fargo Line of Credit. Proceeds from the Revised Wells Fargo Line of Credit can be used to fund acquisitions, redeem shares pursuant to the Company's redemption plan and for any other corporate purpose. As of September 30, 2018, the Company's maximum borrowing capacity was $95,510,154.
The Revised Wells Fargo Line of Credit agreement contains customary representations, warranties, borrowing conditions and affirmative, negative and financial covenants, including that there must be at least five properties in the collateral pool at all times and that the collateral pool must also meet specified concentration provisions, unless waived by the lender. In addition, the Company, as guarantor, must meet tangible net worth hurdles. The Company was in compliance with all financial covenants as of September 30, 2018.
Nationwide Life Insurance Loan
17
RREEF PROPERTY TRUST, INC.
NOTES TO CONSOLIDATED FINANCIAL STATEMENTS - continued
September 30, 2018
(Unaudited)
On March 1, 2016, RPT Flats at Carrs Hill, LLC, a wholly-owned subsidiary of the Operating Partnership, entered into a credit agreement with Nationwide Life Insurance Company (the "Nationwide Loan"). Proceeds of $14,500,000 obtained from the Nationwide Loan were used to repay outstanding balances under the Wells Fargo Line of Credit, thereby releasing The Flats at Carrs Hill from the Wells Fargo Line of Credit. The Nationwide Loan is a secured, fully non-recourse loan with a term of ten years with no extension options. The Nationwide Loan carries a fixed interest rate of 3.63% and requires monthly interest-only payments of $43,862 during the entire term.
Hartford Life Insurance Loan
On December 1, 2016, RPT 1109 Commerce Boulevard, LLC, a wholly-owned subsidiary of the Operating Partnership, entered into a credit agreement with Hartford Life Insurance Company (the "Hartford Loan"). Proceeds of $13,000,000 obtained from the Hartford Loan were used to repay outstanding balances under the Wells Fargo Line of Credit, thereby releasing Commerce Corner from the Wells Fargo Line of Credit. The Hartford Loan is a secured, fully non-recourse loan with a term of seven years with no extension options. The Hartford Loan carries a fixed interest rate of 3.41% with interest-only payments for the first 24 months of the term, then principal and interest payments for the remainder of the term based upon a 30-year amortization schedule.
The following is a reconciliation of the carrying amount of the of the line of credit and mortgage loans payable as of September 30, 2018 and December 31, 2017:
September 30, 2018 | December 31, 2017 | ||||||
Line of credit | $ | 67,500,000 | $ | 63,100,000 | |||
Deduct: Deferred financing costs, less accumulated amortization | (570,191 | ) | (77,939 | ) | |||
Line of credit, net | $ | 66,929,809 | $ | 63,022,061 | |||
Mortgage loans payable | $ | 27,500,000 | $ | 27,500,000 | |||
Deduct: Deferred financing costs, less accumulated amortization | (219,075 | ) | (245,569 | ) | |||
Mortgage loans payable, net | $ | 27,280,925 | $ | 27,254,431 | |||
Aggregate future principal payments of mortgage loans payable as of September 30, 2018 are as follows:
Year | Amount | |||
Remainder of 2018 | $ | — | ||
2019 | 253,331 | |||
2020 | 262,106 | |||
2021 | 271,185 | |||
2022 | 280,578 | |||
Thereafter | 26,432,800 | |||
Total | $ | 27,500,000 | ||
NOTE 8 — RELATED PARTY ARRANGEMENTS
Advisory Agreement
RREEF America is entitled to compensation and reimbursements in connection with the management of the Company's investments in accordance with an advisory agreement between RREEF America and the Company (the "Advisory Agreement"). The Advisory Agreement has a one-year term and is renewable annually upon the review and approval of the Company's board of directors, including the approval of a majority of the Company's
18
RREEF PROPERTY TRUST, INC.
NOTES TO CONSOLIDATED FINANCIAL STATEMENTS - continued
September 30, 2018
(Unaudited)
independent directors. The Advisory Agreement has a current expiration date of January 20, 2020. There is no limit to the number of terms for which the Advisory Agreement can be renewed.
Fees
Under the Advisory Agreement, RREEF America can earn an advisory fee comprised of two components as described below.
1. | The fixed component accrues daily in an amount equal to 1/365th of 1.0% of the NAV of the outstanding shares of each class of common stock for such day. The fixed component of the advisory fee is payable monthly in arrears. |
2. | The performance component is calculated for each class of common stock on the basis of the total return to stockholders and is measured by the total distributions per share declared to such class plus the change in the NAV per share for such class. For any calendar year in which the total return per share allocable to a class exceeds 6% per annum (the “Hurdle Amount”), RREEF America will receive up to 10% of the aggregate total return allocable to such class with a Catch-Up (defined below) calculated as follows: first, if the total return for the applicable period exceeds the Hurdle Amount, 25% of such total return in excess of the Hurdle Amount (the “Excess Profits”) until the total return reaches 10% (commonly referred to as a “Catch-Up”); and second, to the extent there are remaining Excess Profits, 10% of such remaining Excess Profits. The performance component earned by RREEF America for each class is subject to certain other adjustments which do not apply unless the NAV per share is below $12.00 per share. The performance component is payable annually in arrears. |
The performance component is calculated daily on a year-to-date basis by reference to a proration of the per annum hurdle as of the date of calculation. Any resulting performance component as of a given date is deducted from the published NAV per share for such date. At each interim balance sheet date, the Company considers the estimated performance component that is probable to be due as of the end of the current calendar year in assessing whether the calculated performance component as of the interim balance sheet date meets the threshold for recognition in accordance with GAAP in the Company's consolidated financial statements. The ultimate amount of the performance component as of the end of the current calendar year, if any, may be more or less than the amount recognized by the Company as of any interim date and will depend on a variety of factors, including but not limited to, the performance of the Company's investments, interest rates, capital raise and redemptions. The Company considers the estimated performance component as of September 30, 2018 to be sufficiently probable to warrant recognition of a performance component as of September 30, 2018 in the Company's consolidated financial statements. The fixed component earned by RREEF America, and the performance component recognized by the Company, for the three and nine months ended September 30, 2018 and 2017, are shown below.
Three Months Ended September 30, | Nine Months Ended September 30, | ||||||||||||||
2018 | 2017 | 2018 | 2017 | ||||||||||||
Fixed component | $ | 332,353 | $ | 270,369 | $ | 911,568 | $ | 774,770 | |||||||
Performance component | 210,000 | 353,301 | 300,000 | 353,301 | |||||||||||
$ | 542,353 | $ | 623,670 | $ | 1,211,568 | $ | 1,128,071 | ||||||||
Expense Reimbursements
Under the Advisory Agreement, RREEF America is entitled to reimbursement of certain costs incurred by RREEF America or its affiliates that were not incurred under the Expense Support Agreement, as described below. Costs eligible for reimbursement, if they were not incurred under the Expense Support Agreement, include most third-party operating expenses, salaries and related costs of RREEF America's employees who perform services for the Company (but not those employees for which RREEF America earns a separate fee or those employees who are executive officers of the Company) and travel related costs for RREEF America's employees who incur such costs
19
RREEF PROPERTY TRUST, INC.
NOTES TO CONSOLIDATED FINANCIAL STATEMENTS - continued
September 30, 2018
(Unaudited)
on behalf of the Company. Reimbursement payments to RREEF America are subject to the limitations described below under "Reimbursement Limitations."
For the three months ended September 30, 2018 and 2017, RREEF America incurred $69,742 and $63,329 of reimbursable operating expenses and offering costs, respectively, that were subject to reimbursement under the Advisory Agreement. For the nine months ended September 30, 2018 and 2017, RREEF America incurred $233,940 and $204,819 of reimbursable operating expenses and offering costs, respectively, that were subject to reimbursement under the Advisory Agreement. As of September 30, 2018 and December 31, 2017, the Company had a payable to RREEF America of $76,525 and $58,874, respectively, of operating expenses and offering costs reimbursable under the Advisory Agreement.
Organization and Offering Costs
Under the Advisory Agreement, RREEF America agreed to pay all of the Company’s organization and offering costs incurred through January 3, 2013. In addition, RREEF America agreed to pay certain of the Company’s organization and offering costs from January 3, 2013 through January 3, 2014 that were incurred in connection with certain offering related activities. In total, RREEF America incurred $4,618,318 of these costs (the “Deferred O&O”) on behalf of the Company from the Company’s inception through January 3, 2014. Pursuant to the Advisory Agreement, the Company began reimbursing RREEF America monthly for the Deferred O&O on a pro rata basis over 60 months beginning in January 2014. However, if the Advisory Agreement is terminated by RREEF America, then the unpaid balance of the Deferred O&O is payable to RREEF America within 30 days. For the three months ended September 30, 2018 and 2017, the Company reimbursed RREEF America $232,686 and $232,686, respectively. For the nine months ended September 30, 2018 and 2017, the Company reimbursed RREEF America $690,471 and $690,473, respectively.
The amount of Deferred O&O payable to RREEF America is shown below.
September 30, 2018 | December 31, 2017 | |||||||
Total Deferred O&O | $ | 4,618,318 | $ | 4,618,318 | ||||
Cumulative reimbursements made to RREEF America | (4,380,573 | ) | (3,690,102 | ) | ||||
Remaining Deferred O&O reimbursable to RREEF America | $ | 237,745 | $ | 928,216 | ||||
Expense Support Agreement
Pursuant to the terms of the expense support agreement, as most recently amended on January 20, 2016 (the "Expense Support Agreement"), RREEF America agreed to defer reimbursement of certain expenses related to the Company's operations that RREEF America has incurred that are not part of the Deferred O&O described above and, therefore, are in addition to the Deferred O&O amount (the “Expense Payments”). The Expense Payments include organization and offering costs and operating expenses as described above under the Advisory Agreement. RREEF America incurred these expenses until the date upon which the aggregate Expense Payments by RREEF America reached $9,200,000. As of December 31, 2015, the Company had incurred a total of $9,200,000 in Expense Payments in addition to the $4,618,318 of Deferred O&O noted above. The balance of $9,200,000 in Expense Payments consisted of $3,775,369 in organization and offering costs related to the Company's initial public offering, $195,450 of offering costs for the Private Offering and $5,229,181 in operating expenses. The Company has not received any Expense Payments since December 31, 2015.
In accordance with the Expense Support Agreement, the Company was to reimburse RREEF America $250,000 per quarter (the "Quarterly Reimbursement"), representing a non-interest bearing note due to RREEF America ("Note to Affiliate") which was subject to the imputation of interest. In accordance therewith, on January 1, 2016, the Company recorded a discount on the Note to Affiliate in the amount of $1,861,880 which was to be amortized to interest expense over the contractual reimbursement period using the effective interest method.
20
RREEF PROPERTY TRUST, INC.
NOTES TO CONSOLIDATED FINANCIAL STATEMENTS - continued
September 30, 2018
(Unaudited)
On April 25, 2016, the Company and RREEF America entered into a letter agreement that amended certain provisions of the Advisory Agreement and the Expense Support Agreement (the "Letter Agreement"). The Letter Agreement provides, in part, that the Company's obligations to reimburse RREEF America for Expense Payments under the Expense Support Agreement are suspended until the first calendar month following the month in which the Company has reached $500,000,000 in offering proceeds from the offerings (the "ESA Commencement Date"). The Company currently owes $8,950,000 to RREEF America under the Expense Support Agreement in the form of the Note to Affiliate. Beginning the month following the ESA Commencement Date, the Company will make monthly reimbursement payments to RREEF America in the amount of $416,667 for the first 12 months and $329,166 for the second 12 months, subject to monthly reimbursement payment limitations described in the Letter Agreement. The execution of the Letter Agreement represented a modification of the Note to Affiliate, and as such, the unamortized discount on the Note to Affiliate as of April 25, 2016 is instead being amortized over the estimated repayment period pursuant to the Letter Agreement. In accordance therewith, the Company is amortizing the remaining discount using an interest rate of 1.93%. For the three months ended September 30, 2018 and 2017, the Company amortized $36,371 and $35,675, respectively, of the discount on the Note to Affiliate into interest expense. For the nine months ended September 30, 2018 and 2017, the Company amortized $108,588 and $106,508, respectively, of the discount on the Note to Affiliate into interest expense.
In addition, pursuant to the Letter Agreement, if RREEF America is serving as the Company's advisor at the time that the Company or the Operating Partnership undertakes a liquidation, the Company's remaining obligations to reimburse RREEF America for the unpaid Deferred O&O under the Advisory Agreement and the unreimbursed Expense Payments under the Expense Support Agreement shall be waived.
Dealer Manager Agreement
On July 1, 2016, the Company and its Operating Partnership entered into a new dealer manager agreement (the "Dealer Manager Agreement") with DWS Distributors, Inc. (formerly known as Deutsche Distributors, Inc.), an affiliate of the Company's sponsor and advisor (the "Dealer Manager"). The Dealer Manager Agreement governs the distribution by the Dealer Manager of the Company’s Class A Shares, Class I Shares, Class N Shares and Class T Shares in the Follow-On Public Offering and any subsequent registered public offering. In connection with the ongoing Trailing Fees to be paid in the future, the Company and the Dealer Manager entered into an agreement whereby the Company will pay to the Dealer Manager the Trailing Fees that are attributable to the Company's shares issued in the Company's initial public offering that remain outstanding. In addition, the Company is obligated to pay to the Dealer Manager Trailing Fees that are attributable to the Company's shares issued in the Follow-On Public Offering. As of September 30, 2018 and December 31, 2017, the Company has accrued $80,554 and $67,279, respectively, in Trailing Fees currently payable to the Dealer Manager, and $2,869,271 and $2,238,576, respectively, in Trailing Fees estimated to become payable in the future to the Dealer Manager, both of which are included in due to affiliates on the consolidated balance sheets. The Company also pays the Dealer Manager upfront selling commissions and upfront dealer manager fees in connection with its Offerings, as applicable. For the three months ended September 30, 2018 and 2017, the Dealer Manager earned upfront selling commissions and upfront dealer manager fees totaling $277,077 and $41,466, respectively. For the nine months ended September 30, 2018 and 2017, the Dealer Manager earned upfront selling commissions and upfront dealer manager fees totaling $441,406 and $76,700, respectively.
Under the Dealer Manager Agreement, the Company is obligated to reimburse the Dealer Manager for certain offering costs incurred by the Dealer Manager on the Company's behalf, including but not limited to broker-dealer sponsorships, attendance fees for retail seminars conducted by broker-dealers or the Dealer Manager, and travel costs for certain personnel of the Dealer Manager who are dedicated to the distribution of the Company's shares of common stock. For the three months ended September 30, 2018 and 2017, the Dealer Manager incurred $67,000 and $80,000, respectively, in such costs on behalf of the Company. For the nine months ended September 30, 2018 and 2017, the Dealer Manager incurred $287,823 and $228,203, respectively, in such costs on behalf of the Company. As of September 30, 2018 and December 31, 2017, the Company had payable to the Dealer Manager $295,343 and $315,622, respectively, of such costs which was included in due to affiliates on the consolidated balance sheets.
21
RREEF PROPERTY TRUST, INC.
NOTES TO CONSOLIDATED FINANCIAL STATEMENTS - continued
September 30, 2018
(Unaudited)
Reimbursement Limitations
Organization and Offering Costs
The Company will not reimburse RREEF America under the Advisory Agreement or the Expense Support Agreement and will not reimburse the Dealer Manager under the Dealer Manager Agreement for any organization and offering costs which would cause the Company's total organization and offering costs with respect to a public offering to exceed 15% of the gross proceeds from such public offering. Further, the Company will not reimburse RREEF America or the Dealer Manager for any underwriting compensation (a subset of organization and offering costs) which would cause the Company's total underwriting compensation with respect to a public offering to exceed 10% of the gross proceeds from the primary portion of such public offering. The Company raised $102,831,442 in gross proceeds from its initial public offering that ended on June 30, 2016. A summary of the Company's total organization and offering costs for its initial public offering is shown below.
Deferred O&O - RREEF America | Expense Payments - O&O Portion | Other organization and offering costs (1) | Total organization and offering costs | ||||||||||||
Balance, September 30, 2018 and December 31, 2017 | $ | 4,618,318 | $ | 3,775,369 | $ | 7,031,029 | $ | 15,424,716 | |||||||
(1) Includes $913,132 and $1,355,890 of estimated accrued Trailing Fees payable in the future as of September 30, 2018 and December 31, 2017, respectively. | |||||||||||||||
As of September 30, 2018, in the Follow-On Public Offering, the Company had raised $57,800,338 in gross proceeds and incurred total organization and offering costs of $6,090,879, including estimated accrued Trailing Fees payable in the future of $1,956,139.
Operating Expenses
Pursuant to the Company’s charter, the Company may reimburse RREEF America, at the end of each fiscal quarter, for total operating expenses incurred by RREEF America, whether under the Expense Support Agreement or otherwise. However, the Company may not reimburse RREEF America at the end of any fiscal quarter for total operating expenses (as defined in the Company’s charter) that, in the four consecutive fiscal quarters then ended, exceed the greater of 2% of average invested assets or 25% of net income determined without reduction for any additions to reserves for depreciation, bad debts or other similar non-cash reserves and excluding any gain from the sale of the Company's assets for that period (the “2%/25% Guidelines”). Notwithstanding the foregoing, the Company may reimburse RREEF America for expenses in excess of the 2%/25% Guidelines if a majority of the Company’s independent directors determines that such excess expenses are justified based on unusual and non-recurring factors. For the four fiscal quarters ended September 30, 2018, total operating expenses of the Company were $3,604,820 which did not exceed the amount prescribed by the 2%/25% Guidelines.
Due to Affiliates and Note to Affiliate
In accordance with all the above, as of September 30, 2018 and December 31, 2017, the Company owed its affiliates the following amounts:
22
RREEF PROPERTY TRUST, INC.
NOTES TO CONSOLIDATED FINANCIAL STATEMENTS - continued
September 30, 2018
(Unaudited)
September 30, 2018 | December 31, 2017 | ||||||
Deferred O&O | $ | 237,745 | $ | 928,216 | |||
Reimbursable under the Advisory Agreement | 76,525 | 58,874 | |||||
Reimbursable under the Dealer Manager Agreement | 295,343 | 315,622 | |||||
Advisory fees | 412,555 | 766,624 | |||||
Accrued Trailing Fees | 2,949,826 | 2,305,855 | |||||
Due to affiliates | $ | 3,971,994 | $ | 4,375,191 | |||
Note to Affiliate | $ | 8,950,000 | $ | 8,950,000 | |||
Unamortized discount | (1,401,165 | ) | (1,509,753 | ) | |||
Note to Affiliate, net of unamortized discount | $ | 7,548,835 | $ | 7,440,247 | |||
NOTE 9 — CAPITALIZATION
Under the Company's charter, as most recently amended on February 16, 2017, the Company has the authority to issue 1,000,000,000 shares of common stock and 50,000,000 shares of preferred stock. All shares of such stock have a par value of $0.01 per share. The Company's board of directors is authorized to amend its charter from time to time, without the approval of the stockholders, to increase or decrease the aggregate number of authorized shares of capital stock or the number of shares of any class or series that the Company has authority to issue. The Company's authorized shares of common stock are allocated between classes as follows:
Common Stock | No. of Authorized Shares | ||
Class A Shares | 200,000,000 | ||
Class I Shares | 200,000,000 | ||
Class T Shares | 250,000,000 | ||
Class D Shares | 50,000,000 | ||
Class N Shares | 300,000,000 | ||
1,000,000,000 | |||
Class A Shares are subject to selling commissions of up to 3% of the purchase price, and annual dealer manager fees of 0.55% and distribution fees of 0.50% of NAV, both paid on a trailing basis. Class I Shares are subject to annual dealer manager fees of 0.55% of NAV paid in a trailing basis, but are not subject to any selling commissions or distribution fees. Class T Shares are subject to selling commissions of up to 3% of the purchase price, an up-front dealer manager fee of 2.50% of the purchase price, and annual distribution fees of 1.0% of NAV paid on a trailing basis for approximately three years. Class D shares sold in the Private Offering are subject to selling commissions of up to 1.0% of the purchase price, but do not incur any dealer manager or distribution fees.
Class N Shares are not sold in the primary Follow-On Public Offering, but will be issued upon conversion of an investor's Class T Shares once (i) the investor's Class T Share account for a given offering has incurred a maximum of 8.5% of commissions, dealer manager fees and distribution fees; (ii) the total underwriting compensation from whatever source with respect to the Follow-On Public Offering exceeds 10% of the gross proceeds from the primary portion of the Follow-On Public Offering; (iii) a listing of the Class N Shares; or (iv) the Company's merger or consolidation with or into another entity or the sale or other disposition of all or substantially all of the Company's assets.
23
RREEF PROPERTY TRUST, INC.
NOTES TO CONSOLIDATED FINANCIAL STATEMENTS - continued
September 30, 2018
(Unaudited)
Distribution Reinvestment Plan
The Company has adopted a distribution reinvestment plan that allows stockholders to have the cash distributions attributable to the class of shares that the stockholder owns automatically invested in additional shares of the same class. Shares are offered pursuant to the Company's distribution reinvestment plan at the NAV per share applicable to that class, calculated as of the distribution date and after giving effect to all distributions. Stockholders who elect to participate in the distribution reinvestment plan, and who are subject to U.S. federal income taxation laws, will incur a tax liability on an amount equal to the fair value on the relevant distribution date of the shares of the Company's common stock purchased with reinvested distributions, even though such stockholders have elected not to receive the distributions used to purchase those shares of the Company's common stock in cash.
Redemption Plan
In an effort to provide the Company's stockholders with liquidity in respect of their investment in shares of the Company's common stock, the Company has adopted a redemption plan whereby on a daily basis stockholders may request the redemption of all or any portion of their shares. The redemption price per share is equal to the Company's NAV per share of the class of shares being redeemed on the date of redemption, subject to a short-term trading discount, if applicable. The total amount of redemptions in any calendar quarter will be limited to shares whose aggregate value (based on the redemption price per share on the date of the redemption) is equal to 5% of the Company's combined NAV for all classes of shares as of the last day of the previous calendar quarter. In addition, if redemptions do not reach the 5% limit in a calendar quarter, the unused portion generally will be carried over to the next quarter and not any subsequent quarter, except that the maximum amount of redemptions during any quarter may never exceed 10% of the combined NAV for all classes of shares as of the last day of the previous calendar quarter. If the quarterly volume limitation is reached on or before the third business day of a calendar quarter, redemption requests during the next quarter will be satisfied on a stockholder by stockholder basis, which the Company refers to as a per stockholder allocation, instead of a first-come, first-served basis. Pursuant to the per stockholder allocation, each stockholder would be allowed to request redemption at any time during such quarter of a total number of shares not to exceed 5% of the shares of common stock the stockholder held as of the end of the prior quarter. The per stockholder allocation requirement will remain in effect for each succeeding quarter for which the total redemptions for the immediately preceding quarter exceeded 4% of the Company's NAV on the last business day of such preceding quarter. If total redemptions during a quarter for which the per stockholder allocation applies are equal to or less than 4% of the Company's NAV on the last business day of such preceding quarter, then redemptions will again be satisfied on a first-come, first-served basis for the next succeeding quarter and each quarter thereafter.
Each redemption request will be evaluated by the Company in consideration of rules and regulations promulgated by the Internal Revenue Service with respect to dividend equivalent redemptions. Redemptions that may be considered dividend equivalent redemptions may adversely affect the Company or its stockholders. Accordingly, the Company may reject any redemption request that it reasonably believes may be treated as a dividend equivalent redemption.
While there is no minimum holding period, shares redeemed within 365 days of the date of the investor's initial purchase of the Company's shares will be redeemed at the Company's NAV per share of the class of shares being redeemed on the date of redemption less a short-term trading discount equal to 2% of the gross proceeds otherwise payable with respect to the redemption.
In the event that any stockholder fails to maintain a minimum balance of $500 worth of shares of common stock, the Company may redeem all of the shares held by that stockholder at the redemption price per share in effect on the date it is determined that the stockholder has failed to meet the minimum balance, less the short-term trading discount of 2%, if applicable. Minimum account redemptions will apply even in the event that the failure to meet the minimum balance is caused solely by a decline in the Company's NAV.
24
RREEF PROPERTY TRUST, INC.
NOTES TO CONSOLIDATED FINANCIAL STATEMENTS - continued
September 30, 2018
(Unaudited)
During the three and nine months ended September 30, 2018 and 2017, redemptions were as shown below. The Company funded these redemptions with cash flow from operations, proceeds from its public offerings or borrowings on the line of credit. The weighted average redemption prices are shown before allowing for any applicable 2% short-term trading discounts.
Three Months Ended September 30, 2018 | Shares | Weighted Average Share Price | Amount | ||||||||
Class A | 95,496 | $ | 13.98 | $ | 1,334,534 | ||||||
Class I | 44,865 | 14.08 | 631,873 | ||||||||
Class T | — | — | — | ||||||||
Nine Months Ended September 30, 2018 | Shares | Weighted Average Share Price | Amount | ||||||||
Class A | 234,674 | $ | 13.87 | $ | 3,254,765 | ||||||
Class I | 162,464 | 13.96 | 2,262,111 | ||||||||
Class T | — | — | — | ||||||||
Three Months Ended September 30, 2017 | Shares | Weighted Average Share Price | Amount | ||||||||
Class A | 89,747 | $ | 13.48 | $ | 1,209,895 | ||||||
Class I | 179,284 | 13.59 | 2,435,188 | ||||||||
Class T | — | — | — | ||||||||
Nine Months Ended September 30, 2017 | Shares | Weighted Average Share Price | Amount | ||||||||
Class A | 180,196 | $ | 13.40 | $ | 2,414,334 | ||||||
Class I | 241,808 | 13.54 | 3,275,020 | ||||||||
Class T | 4,043 | * | 15.29 | 61,818 | |||||||
* Repurchased in private transactions.
The Company's board of directors has the discretion to suspend or modify the redemption plan at any time, including in circumstances in which it (1) determines that such action is in the best interest of the Company's stockholders, (2) determines that it is necessary due to regulatory changes or changes in law or (3) becomes aware of undisclosed material information that it believes should be publicly disclosed before shares are redeemed. In addition, the Company's board of directors may suspend the Offerings and the redemption plan, if it determines that the calculation of NAV is materially incorrect or there is a condition that restricts the valuation of a material portion of the Company's assets. If the board of directors materially amends (including any reduction of the quarterly limit) or suspends the redemption plan during any quarter, other than any temporary suspension to address certain external events unrelated to the Company's business, any unused portion of that quarter’s 5% limit will not be carried forward to the next quarter or any subsequent quarter.
NOTE 10 - NET INCOME (LOSS) PER SHARE
The Company computes net income (loss) per share of Class A, Class I and Class T common stock using the two-class method. RREEF America may earn a performance component of the advisory fee (see Note 8) which may impact the net income (loss) of each class of common stock differently. The performance component for three and nine months ended September 30, 2018 and 2017, and the impact on each class of common stock, are shown below.
25
RREEF PROPERTY TRUST, INC.
NOTES TO CONSOLIDATED FINANCIAL STATEMENTS - continued
September 30, 2018
(Unaudited)
In periods where no performance component of the advisory fee is recognized in the Company’s consolidated statement of operations, the net income (loss) per share will be the same for each class of common stock.
Basic and diluted net income (loss) per share for each class of common stock is computed using the weighted-average number of common shares outstanding during the period for each class of common stock. The Company has not issued any dilutive or potentially dilutive securities, and thus the basic and diluted net income (loss) per share for a given class of common stock is the same for each period presented.
The following table sets forth the computation of basic and diluted net income (loss) per share for each of the Company’s Class A, Class I and Class T common stock.
Three Months Ended September 30, 2018 | |||||||||||||
Class A | Class I | Class T | |||||||||||
Basic and diluted net loss per share: | |||||||||||||
Allocation of net loss before performance fee | $ | (216,006 | ) | $ | (297,490 | ) | $ | (24,369 | ) | ||||
Allocation of performance fees | (81,961 | ) | (124,068 | ) | (3,971 | ) | |||||||
Total numerator | $ | (297,967 | ) | $ | (421,558 | ) | $ | (28,340 | ) | ||||
Denominator - weighted average number of common shares outstanding | 3,777,836 | 5,202,959 | 426,209 | ||||||||||
Basic and diluted net loss per share: | $ | (0.08 | ) | $ | (0.08 | ) | $ | (0.07 | ) | ||||
Nine Months Ended September 30, 2018 | |||||||||||||
Class A | Class I | Class T | |||||||||||
Basic and diluted net loss per share: | |||||||||||||
Allocation of net loss before performance fee | $ | (623,732 | ) | $ | (808,987 | ) | $ | (36,901 | ) | ||||
Allocation of performance fees | (117,087 | ) | (177,240 | ) | (5,673 | ) | |||||||
Total numerator | $ | (740,819 | ) | $ | (986,227 | ) | $ | (42,574 | ) | ||||
Denominator - weighted average number of common shares outstanding | 3,719,098 | 4,823,708 | 220,030 | ||||||||||
Basic and diluted net loss per share: | $ | (0.20 | ) | $ | (0.20 | ) | $ | (0.19 | ) | ||||
26
RREEF PROPERTY TRUST, INC.
NOTES TO CONSOLIDATED FINANCIAL STATEMENTS - continued
September 30, 2018
(Unaudited)
Three Months Ended September 30, 2017 | |||||||||||||
Class A | Class I | Class T | |||||||||||
Basic and diluted net loss per share: | |||||||||||||
Allocation of net loss before performance fee | $ | (294,674 | ) | $ | (339,812 | ) | $ | (559 | ) | ||||
Allocation of performance fees | (132,219 | ) | (220,958 | ) | (124 | ) | |||||||
Total numerator | $ | (426,893 | ) | $ | (560,770 | ) | $ | (683 | ) | ||||
Denominator - weighted average number of common shares outstanding | 3,677,266 | 4,240,550 | 6,982 | ||||||||||
Basic and diluted net loss per share: | $ | (0.12 | ) | $ | (0.13 | ) | $ | (0.10 | ) | ||||
Nine Months Ended September 30, 2017 | |||||||||||||
Class A | Class I | Class T | |||||||||||
Basic and diluted net loss per share: | |||||||||||||
Allocation of net loss before performance fee | $ | (750,645 | ) | $ | (822,413 | ) | $ | (1,426 | ) | ||||
Allocation of performance fees | (132,219 | ) | (220,958 | ) | (124 | ) | |||||||
Total numerator | $ | (882,864 | ) | $ | (1,043,371 | ) | $ | (1,550 | ) | ||||
Denominator - weighted average number of common shares outstanding | 3,675,618 | 4,027,040 | 6,982 | ||||||||||
Basic and diluted net loss per share: | $ | (0.24 | ) | $ | (0.26 | ) | $ | (0.22 | ) | ||||
NOTE 11 — DISTRIBUTIONS
In order to qualify as a REIT, the Company is required, among other things, to make distributions each taxable year of at least 90% of its taxable income determined without regard to the dividends-paid deduction and excluding net capital gains, and to meet certain tests regarding the nature of the Company's income and assets. The Company expects that its board of directors will continue to declare distributions with a daily record date, payable monthly in arrears. Any distributions the Company makes will be at the discretion of its board of directors, considering factors such as its earnings, cash flow, capital needs and general financial condition and the requirements of Maryland law. The Company commenced operations on May 30, 2013 and elected taxation as a REIT for the year ended December 31, 2013. Distributions for each month are payable on or before the first business day of the following month. However, any distributions reinvested by the stockholders in accordance with the Company's dividend reinvestment plan are reinvested at the per share NAV of the same class determined at the close of business on the last business day of the month in which the distributions were accrued.
Shown below are details of the Company's distributions for the first three quarters of 2018 and 2017 and for the nine months ended September 30, 2018 and 2017.
27
RREEF PROPERTY TRUST, INC.
NOTES TO CONSOLIDATED FINANCIAL STATEMENTS - continued
September 30, 2018
(Unaudited)
Three Months Ended | Nine Months Ended September 30, 2018 | ||||||||||||||
March 31, 2018 | June 30, 2018 | September 30, 2018 | |||||||||||||
Declared daily distribution rate, before adjustment for class-specific fees | $ | 0.00189004 | $ | 0.00190140 | $ | 0.00192261 | |||||||||
Distributions paid or payable in cash | $ | 780,511 | $ | 831,391 | $ | 928,395 | $ | 2,540,297 | |||||||
Distributions reinvested | 619,468 | 661,799 | 733,528 | 2,014,795 | |||||||||||
Distributions declared | $ | 1,399,979 | $ | 1,493,190 | $ | 1,661,923 | $ | 4,555,092 | |||||||
Class A Shares issued upon reinvestment | 22,714 | 22,901 | 23,500 | 69,115 | |||||||||||
Class I Shares issued upon reinvestment | 21,479 | 23,520 | 27,180 | 72,179 | |||||||||||
Class T Shares issued upon reinvestment | 678 | 976 | 1,548 | 3,202 | |||||||||||
Three Months Ended | Nine Months Ended September 30, 2017 | ||||||||||||||
March 31, 2017 | June 30, 2017 | September 30, 2017 | |||||||||||||
Declared daily distribution rate, before adjustment for class-specific fees | $ | 0.00183555 | $ | 0.00183207 | $ | 0.00185445 | |||||||||
Distributions paid or payable in cash | $ | 716,755 | $ | 742,522 | $ | 772,986 | $ | 2,232,263 | |||||||
Distributions reinvested | 518,614 | 541,538 | 578,604 | 1,638,756 | |||||||||||
Distributions declared | $ | 1,235,369 | $ | 1,284,060 | $ | 1,351,590 | $ | 3,871,019 | |||||||
Class A Shares issued upon reinvestment | 23,567 | 23,806 | 23,649 | 71,022 | |||||||||||
Class I Shares issued upon reinvestment | 15,152 | 16,611 | 18,986 | 50,749 | |||||||||||
Class T Shares issued upon reinvestment | — | — | 17 | 17 | |||||||||||
Shown below are details by share class of the Company's distributions for each of the first three quarters of 2018 and 2017 and for the nine months ended September 30, 2018 and 2017.
Three Months Ended | Nine Months Ended September 30, 2018 | ||||||||||||||
March 31, 2018 | June 30, 2018 | September 30, 2018 | |||||||||||||
Class A | $ | 593,300 | $ | 603,263 | $ | 631,342 | $ | 1,827,905 | |||||||
Class I | 794,033 | 865,555 | 960,012 | 2,619,600 | |||||||||||
Class T | 12,646 | 24,372 | 70,569 | 107,587 | |||||||||||
Distributions declared | $ | 1,399,979 | $ | 1,493,190 | $ | 1,661,923 | $ | 4,555,092 | |||||||
28
RREEF PROPERTY TRUST, INC.
NOTES TO CONSOLIDATED FINANCIAL STATEMENTS - continued
September 30, 2018
(Unaudited)
Three Months Ended | Nine Months Ended September 30, 2017 | ||||||||||||||
March 31, 2017 | June 30, 2017 | September 30, 2017 | |||||||||||||
Class A | $ | 572,184 | $ | 584,416 | $ | 594,252 | $ | 1,750,852 | |||||||
Class I | 662,918 | 699,644 | 756,964 | 2,119,526 | |||||||||||
Class T | 267 | — | 374 | 641 | |||||||||||
Distributions declared | $ | 1,235,369 | $ | 1,284,060 | $ | 1,351,590 | $ | 3,871,019 | |||||||
NOTE 12 — INCOME TAXES
The Company believes that it has operated in such a manner to qualify to be taxed as a REIT for federal income tax purposes beginning with the taxable year ended December 31, 2013, when it first elected REIT status. In each calendar year that the Company qualifies for taxation as a REIT, the Company generally will not be subject to federal income tax to the extent it meets certain criteria and distributes its REIT taxable income to its stockholders. Distributions declared and paid by the Company may consist of ordinary income, qualifying dividends, return of capital, capital gains or a combination thereof. The characterization of the distributions into these various components will impact how the distributions are taxable to the stockholder who received them. Distributions that constitute a return of capital generally are non-taxable and will reduce the stockholder's basis in the shares. The characterization of the distributions is generally determined during the month of January following the close of the tax year.
Net worth and similar taxes paid to certain states where the Company owns real estate properties were $88 and $14,209 for the three months ended September 30, 2018 and 2017, respectively. The net worth and similar taxes paid to certain states where the Company owns real estate properties were $23,338 and $36,415 for the nine months ended September 30, 2018 and 2017, respectively.
29
RREEF PROPERTY TRUST, INC.
NOTES TO CONSOLIDATED FINANCIAL STATEMENTS - continued
September 30, 2018
(Unaudited)
NOTE 13 — SEGMENT INFORMATION
For the nine months ended September 30, 2018 and 2017, the Company had two segments with reportable information: Real Estate Properties and Real Estate Equity Securities. The Company organizes and analyzes the operations and results of each of these segments independently, due to inherently different considerations for each segment. Such considerations include, but are not limited to, the nature and characteristics of the investment and investment strategies and objectives. The following tables set forth the carrying value, revenue and the components of operating income of the Company's segments reconciled to total assets as of September 30, 2018 and December 31, 2017 and net income (loss) for the three and nine months ended September 30, 2018 and 2017.
Real Estate Properties | Real Estate Equity Securities | Total | ||||||||||
Carrying value as of September 30, 2018 | $ | 166,169,253 | $ | 15,697,601 | $ | 181,866,854 | ||||||
Reconciliation to total assets of September 30 , 2018 | ||||||||||||
Carrying value per reportable segments | $ | 181,866,854 | ||||||||||
Corporate level assets | 9,702,537 | |||||||||||
Total assets | $ | 191,569,391 | ||||||||||
Carrying value as of December 31, 2017 | $ | 150,923,848 | $ | 10,046,177 | $ | 160,970,025 | ||||||
Reconciliation to total assets of December 31, 2017 | ||||||||||||
Carrying value per reportable segments | $ | 160,970,025 | ||||||||||
Corporate level assets | 8,346,307 | |||||||||||
Total assets | $ | 169,316,332 | ||||||||||
30
RREEF PROPERTY TRUST, INC.
NOTES TO CONSOLIDATED FINANCIAL STATEMENTS - continued
September 30, 2018
(Unaudited)
Three Months Ended September 30, 2018 | Real Estate Properties | Real Estate Equity Securities | Total | ||||||||
Rental and other property income | $ | 4,302,433 | $ | — | $ | 4,302,433 | |||||
Tenant reimbursement income | 688,482 | — | 688,482 | ||||||||
Investment income on marketable securities | 136,832 | 136,832 | |||||||||
Total revenues | 4,990,915 | 136,832 | 5,127,747 | ||||||||
Segment operating expenses | 1,597,996 | 14,319 | 1,612,315 | ||||||||
Net realized gain upon sale of marketable securities | — | 201,769 | 201,769 | ||||||||
Net unrealized loss on investment in marketable securities(1) | — | (201,223 | ) | (201,223 | ) | ||||||
Operating income - segments | $ | 3,392,919 | $ | 123,059 | $ | 3,515,978 | |||||
(1) Net unrealized gain or loss on investment in marketable securities included pursuant to adoption of ASU 2016-01. See Note 2. | |||||||||||
Three Months Ended September 30, 2017 | |||||||||||
Rental and other property income | $ | 3,819,417 | $ | — | $ | 3,819,417 | |||||
Tenant reimbursement income | 540,528 | — | 540,528 | ||||||||
Investment income on marketable securities | — | 84,836 | 84,836 | ||||||||
Total revenues | 4,359,945 | 84,836 | 4,444,781 | ||||||||
Segment operating expenses | 1,446,432 | 12,341 | 1,458,773 | ||||||||
Net realized loss upon sale of marketable securities | — | (25,389 | ) | (25,389 | ) | ||||||
Operating income - segments | $ | 2,913,513 | $ | 47,106 | $ | 2,960,619 | |||||
Three Months Ended September 30, | |||||||||||
Reconciliation to net loss | 2018 | 2017 | |||||||||
Operating income - segments | $ | 3,515,978 | $ | 2,960,619 | |||||||
General and administrative expenses | (420,183 | ) | (395,446 | ) | |||||||
Advisory expenses | (542,353 | ) | (623,670 | ) | |||||||
Depreciation | (1,162,905 | ) | (1,085,483 | ) | |||||||
Amortization | (1,125,428 | ) | (933,854 | ) | |||||||
Operating income (loss) | 265,109 | (77,834 | ) | ||||||||
Interest expense | (1,012,974 | ) | (910,512 | ) | |||||||
Net loss | $ | (747,865 | ) | $ | (988,346 | ) | |||||
31
RREEF PROPERTY TRUST, INC.
NOTES TO CONSOLIDATED FINANCIAL STATEMENTS - continued
September 30, 2018
(Unaudited)
Nine Months Ended September 30, 2018 | Real Estate Properties | Real Estate Equity Securities | Total | |||||||||
Rental and other property income | $ | 11,969,709 | $ | — | $ | 11,969,709 | ||||||
Tenant reimbursement income | 1,907,590 | — | 1,907,590 | |||||||||
Investment income on marketable securities | — | 345,609 | 345,609 | |||||||||
Total revenues | 13,877,299 | 345,609 | 14,222,908 | |||||||||
Segment operating expenses | 4,348,090 | 37,198 | 4,385,288 | |||||||||
Net realized loss upon sale of marketable securities | (206,763 | ) | (206,763 | ) | ||||||||
Net unrealized gain on investment in marketable securities | 280,022 | 280,022 | ||||||||||
Operating income - segments | $ | 9,529,209 | $ | 381,670 | $ | 9,910,879 | ||||||
Nine Months Ended September 30, 2017 | ||||||||||||
Rental and other property income | $ | 11,400,901 | $ | — | $ | 11,400,901 | ||||||
Tenant reimbursement income | 1,608,351 | — | 1,608,351 | |||||||||
Investment income on marketable securities | — | 205,692 | 205,692 | |||||||||
Total revenues | 13,009,252 | 205,692 | 13,214,944 | |||||||||
Segment operating expenses | 4,093,912 | 27,673 | 4,121,585 | |||||||||
Net realized gain upon sale of marketable securities | 22,407 | 22,407 | ||||||||||
Operating income - segments | $ | 8,915,340 | $ | 200,426 | $ | 9,115,766 | ||||||
Nine Months Ended September 30, | ||||||||||||
Reconciliation to net loss | 2018 | 2017 | ||||||||||
Operating income - segments | $ | 9,910,879 | $ | 9,115,766 | ||||||||
General and administrative expenses | (1,404,092 | ) | (1,244,860 | ) | ||||||||
Advisory expenses | (1,211,569 | ) | (1,128,071 | ) | ||||||||
Depreciation | (3,325,560 | ) | (3,253,971 | ) | ||||||||
Amortization | (2,938,390 | ) | (2,794,203 | ) | ||||||||
Operating income | 1,031,268 | 694,661 | ||||||||||
Interest expense | (2,800,888 | ) | (2,622,446 | ) | ||||||||
Net loss | $ | (1,769,620 | ) | $ | (1,927,785 | ) | ||||||
NOTE 14 — ECONOMIC DEPENDENCY
The Company depends on RREEF America and the Dealer Manager for certain services that are essential to the Company, including the sale of the Company's shares of common stock, asset acquisition and disposition decisions and other general and administrative responsibilities. In the event that RREEF America or the Dealer Manager is unable to provide such services, the Company would be required to find alternative service providers.
32
RREEF PROPERTY TRUST, INC.
NOTES TO CONSOLIDATED FINANCIAL STATEMENTS - continued
September 30, 2018
(Unaudited)
NOTE 15 — COMMITMENTS AND CONTINGENCIES
In the normal course of business, from time to time, the Company may be involved in legal actions relating to the ownership and operations of real estate investments. In the Company's opinion, the liabilities, if any, that may ultimately result from such legal actions are not expected to have a material adverse effect on the Company's consolidated financial position, results of operations or liquidity.
The Company, as an owner of real estate, is subject to various environmental laws of federal and local governments. All of the Company's properties were subject to assessments, involving visual inspections of the properties and their neighborhoods. The Company carries environmental liability insurance on its properties that provides coverage for remediation liability and pollution liability for third-party bodily injury and property damage claims. The Company does not believe such environmental assessments will have a material adverse impact on the Company's consolidated financial position or results of operations in the future.
NOTE 16 — SUBSEQUENT EVENTS
On October 1, 2018, the Company disclosed that its board of directors declared a daily cash distribution equal to $0.00192836 per share of common stock (before adjustment for applicable class-specific fees) for all such shares of record on each day from October 1, 2018 through December 31, 2018. As of October 1, 2018, there were no Class D Shares or Class N Shares outstanding.
On November 8, 2018, the board of directors of the Company, including a majority of the independent directors, approved the renewal of the Advisory Agreement by and among the Company, the Operating Partnership and RREEF America effective as of January 20, 2019 for an additional one-year term expiring January 20, 2020. The terms of the Advisory Agreement otherwise remain unchanged.
33
ITEM 2. MANAGEMENT'S DISCUSSION AND ANALYSIS OF FINANCIAL CONDITION AND RESULTS OF OPERATIONS
The following discussion and analysis of our financial condition and results of operations should be read in conjunction with our unaudited consolidated financial statements, the notes thereto and the other unaudited financial data included in this Quarterly Report on Form 10-Q, or this Quarterly Report. The following discussion should also be read in conjunction with our audited consolidated financial statements and the notes thereto, included in our Annual Report on Form 10-K for the year ended December 31, 2017. We further invite you to visit our website, www.rreefpropertytrust.com, where we routinely post additional information about our Company, such as, without limitation, our daily net asset value, or NAV, per share. The contents of our website are not incorporated by reference. The terms “we,” “us,” “our” and the “Company” refer to RREEF Property Trust, Inc. and its subsidiaries.
The NAV per share is published daily via NASDAQ's Mutual Fund Quotation System under the symbols ZRPTAX, ZRPTIX and ZRPTTX for our Class A shares, Class I shares and Class T shares, respectively.
Forward-Looking Statements
Certain statements contained in this Quarterly Report on Form 10-Q, other than historical facts, may be considered forward-looking statements within the meaning of Section 27A of the Securities Act of 1933, as amended, or the Securities Act, or Section 21E of the Securities Exchange Act of 1934, as amended, or the Exchange Act. We intend for all such forward-looking statements to be covered by the safe harbor provisions for forward-looking statements contained in Section 27A of the Securities Act and Section 21E of the Exchange Act, as applicable by law. Such statements include, in particular, statements about our plans, strategies and prospects and are subject to certain risks and uncertainties, as well as known and unknown risks, which could cause actual results to differ materially from those projected or anticipated. Therefore, such statements are not intended to be a guaranty of our performance in future periods. Such forward-looking statements can generally be identified by our use of forward-looking terminology such as “may,” “will,” “would,” “could,” “should,” “expect,” “intend,” “anticipate,” “estimate,” “believe,” “continue,” “plan,” “potential,” “predict” or other similar words.
The forward-looking statements included herein are based upon our current expectations, plans, estimates, assumptions and beliefs that involve numerous risks and uncertainties. Assumptions relating to the foregoing involve judgments with respect to, among other things, future economic, competitive and market conditions and future business decisions, all of which are difficult or impossible to predict accurately and many of which are beyond our control. Although we believe that the expectations reflected in such forward-looking statements are based on reasonable assumptions, our actual results and performance could differ materially from those set forth in the forward-looking statements. Factors which could have a material adverse effect on our operations and future prospects include, but are not limited to:
• | our ability to raise and effectively deploy the proceeds raised in our public offering; |
• | changes in economic conditions generally and the real estate and securities markets specifically; |
• | legislative or regulatory changes (including changes to the laws governing the taxation of REITs); |
• | the effect of financial leverage, including changes in interest rates, availability of credit, loss of flexibility due to negative and affirmative covenants, refinancing risk at maturity and generally the increased risk of loss if our investments fail to perform as expected; |
• | our ability to access sources of liquidity when we have the need to fund redemptions of common stock in excess of the proceeds from the sales of shares of our common stock in our continuous offering and the consequential risk that we may not have the resources to satisfy redemption requests; and |
• | changes to accounting principles generally accepted in the United States of America, or GAAP. |
Forward-looking statements that were true at the time made may ultimately prove to be incorrect or false. We caution readers not to place undue reliance on forward-looking statements, which reflect our management’s view only as of the date this Quarterly Report on Form 10-Q is filed with the Securities and Exchange Commission, or the SEC. We make no representation or warranty (express or implied) about the accuracy of any such forward-looking statements contained in this Quarterly Report on Form 10-Q. Additionally, we undertake no obligation to update or
34
revise forward-looking statements to reflect changed assumptions, the occurrence of unanticipated events or changes to future operating results. The forward-looking statements should be read in light of the risk factors identified in “Risk Factors” of this Quarterly Report on Form 10-Q and our Annual Report on Form 10-K for the year ended December 31, 2017.
Overview
We are a Maryland corporation formed on February 7, 2012, our inception date, to invest in a diversified portfolio of high quality, income-producing commercial real estate properties and other real estate-related assets. We are an externally advised, perpetual-life corporation that believes that it has operated in such a manner to qualify to be taxed as a REIT for federal income tax purposes beginning with the taxable year ended December 31, 2013, when we first elected REIT status. We invest primarily in the office, industrial, retail and apartment sectors of the commercial real estate industry in the United States. We may also invest in real estate-related assets, which include common and preferred stock of publicly-traded REITs and other real estate companies, which we refer to as “real estate equity securities,” and debt investments backed by real estate, which we refer to as “real estate loans.” We hold our properties, real estate-related assets and other investments through RREEF Property Operating Partnership, LP, or our operating partnership, of which we are the sole general partner.
Our board of directors will at all times have ultimate oversight and policy-making authority over us, including responsibility for governance, financial controls, compliance and disclosure. Pursuant to our advisory agreement, our board has delegated to RREEF America L.L.C., or our advisor, authority to manage our day-to-day business in accordance with our investment objectives, strategy, guidelines, policies and limitations. Our advisory agreement is renewable annually upon approval by our board of directors, including a majority of the independent board members. The current term expires January 20, 2020.
Our initial public offering commenced on January 3, 2013, pursuant to our Registration Statement on Form S-11 (File No. 333-180356) under which we offered up to $2,500,000,000 of shares of our common stock in any combination of Class A and Class I shares, which we refer to as the initial offering. On May 30, 2013, upon receipt of purchase orders from our sponsor for $10,000,000 of Class I shares of our common stock and the release to us of funds in the escrow account, we commenced operations. Our initial offering terminated on July 1, 2016. We raised a total of $102,831,442 in proceeds from our initial offering.
On January 15, 2016, we filed articles supplementary to our articles of incorporation to add a newly-designated Class D common stock, $0.01 par value per share, or our Class D shares. On January 20, 2016, we commenced a private offering of up to a maximum of $350,000,000 in Class D shares.
On July 12, 2016, the SEC declared effective our Registration Statement on Form S-11 (File No. 333-208751) for our follow-on public offering for up to $2,300,000,000 of shares of our common stock in any combination of our Class A, Class I, Class T and Class N shares, which we refer to as our follow-on offering. Our follow-on offering includes up to $2,100,000,000 in shares in our primary offering and up to $200,000,000 in shares in our distribution reinvestment plan. Class T shares contain a conversion feature whereby upon the occurrence of a specified event (generally related to a Class T stockholder's account having incurred a maximum of 8.5% of underwriting compensation), Class T shares owned in a stockholder's account will automatically convert to Class N shares.
We have engaged DWS Distributors, Inc. (formerly known as Deutsche Distributors, Inc.), an affiliate of our advisor, to serve as our dealer manager for our follow-on offering pursuant to our dealer manager agreement. Our initial offering and our follow-on offering are each referred to as an offering.
Portfolio Information
Real Estate Property Portfolio
On July 17, 2018, we acquired, through our direct and indirect wholly-owned subsidiaries, fee-simple interests in three warehouse distribution buildings across three separate sites located in Hialeah and Miami Lakes, Florida,
35
which we refer to collectively as Miami Industrial, for a purchase price of $20,700,000, exclusive of closing costs. We funded this acquisition with existing capital and by borrowing $19,900,000 pursuant to an amended and restated secured revolving line of credit with Wells Fargo Bank, National Association, which we refer to as the Wells Fargo line of credit. Of the $19,900,000 borrowed, approximately $10,258,000 was allocated to Miami Industrial while approximately $9,642,000 was from existing borrowing capacity on previously acquired properties. Miami Industrial consists of three warehouse distribution buildings: one 182,919 square foot industrial property located in Miami Lakes, or Palmetto Lakes Distribution, and two industrial properties that are 57,000 square feet and 50,000 square feet located in Hialeah, a submarket of Miami, referred to as Hialeah I and Hialeah II, respectively. All three properties have urban, in-fill locations within established industrial submarkets in Miami. Palmetto Lakes Distribution is located just north of the Miami-Opa Locka Executive Airport and less than one mile from the Palmetto Expressway, allowing for connectivity to the rest of Miami-Dade County to the south and Broward County to the north. Hialeah I and Hialeah II are located approximately five miles from Miami International Airport and approximately eight miles from Port Miami, providing tenants with access to these major port and air cargo hubs. Each property is fully occupied by one tenant, with a weighted average lease term remaining across the three buildings of approximately four years.
As of September 30, 2018, we owned eleven properties diversified across geography and sector, including one medical office property and one student housing property (a subset of apartment). Excluding The Flats at Carrs Hill, our apartment property with leases that roll over every year, as of September 30, 2018, our weighted average remaining lease term for active leases was 5.3 years. The following table sets forth certain additional information about the properties we owned as of September 30, 2018:
Property | Location | Rentable Square Feet | Number of Leases/Units | Leased(1) | |||||||
Office Property | |||||||||||
Heritage Parkway | Woodridge, IL | 94,233 | 1 | 100.0 | % | ||||||
Anaheim Hills Office Plaza(2) | Anaheim, CA | 73,892 | 4 | 83.5 | |||||||
Loudoun Gateway | Sterling, VA | 102,015 | 1 | 100.0 | |||||||
Allied Drive | Dedham, MA | 64,127 | 4 | 100.0 | |||||||
Office Total | 334,267 | 10 | 96.2 | ||||||||
Retail Property | |||||||||||
Wallingford Plaza(3) | Seattle, WA | 30,761 | 5 | 100.0 | |||||||
Terra Nova Plaza | Chula Vista, CA | 96,114 | 2 | 100.0 | |||||||
Retail Total | 126,875 | 7 | 100.0 | ||||||||
Industrial Property | |||||||||||
Commerce Corner | Logan Township, NJ | 259,910 | 2 | 100.0 | |||||||
Miami Industrial | |||||||||||
Palmetto Lakes | Miami Lakes, FL | 182,919 | 1 | 100.0 | |||||||
Hialeah I | Miami, FL | 57,000 | 1 | 100.0 | |||||||
Hialeah II | Miami, FL | 50,000 | 1 | 100.0 | |||||||
Industrial Total | 549,829 | 5 | 100.0 | ||||||||
Apartment Property | |||||||||||
The Flats at Carrs Hill | Athens, GA | 135,864 | 138 | 100.0 | |||||||
Apartment Total | 135,864 | 138 | 100.0 | ||||||||
Grand total | 1,146,835 | 22/138 | 98.3 | % | |||||||
(1) Leased percentage is based on executed leases as of September 30, 2018, is calculated based on square footage for a single property, and is weighted by relative property value when calculated for more than one property together.
36
(2) At Anaheim Hills Office Plaza, in September 2018, we executed a lease for 12,812 square feet which will commence upon completion of specified improvements, currently anticipated for first quarter 2019. This lease is included in the leased percentages shown. In October 2018, we executed a lease for 8,000 square feet which will commence after Gateway One Lending and Finance vacates the first floor and completion of specified improvements, currently anticipated for second quarter 2019. This is not included in the leased percentages shown above as it was executed after quarter end.
(3) Wallingford Plaza is ground floor retail plus two floors of office space. The retail portion comprises the majority of the rental revenue for the property.
Real Estate Equity Securities Portfolio
As of September 30, 2018, our real estate equity securities portfolio consisted of publicly-traded common stock of 34 REITs with a value of $15,697,601. We believe that investing a portion of our proceeds from our offerings into a diversified portfolio of common and preferred shares of REITs and other real estate operating companies will provide the overall portfolio some flexibility with near-term liquidity as well as potentially enhance our NAV over a longer period. The portfolio is regularly reviewed and evaluated to determine whether the marketable securities held at any time continue to serve their original intended purposes.
The following chart summarizes our marketable securities by property type as of September 30, 2018:
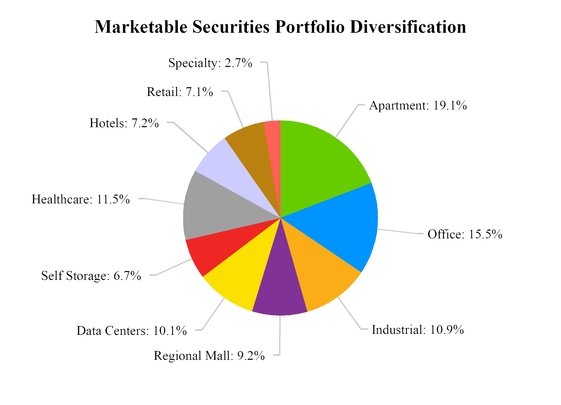
As of September 30, 2018, our top ten holdings in our real estate equity securities portfolio were as follows:
37
Security | Percent of Securities Portfolio | ||
Prologis, Inc. | 8.6 | % | |
Simon Property Group, Inc. | 8.4 | ||
Equity Residential | 6.4 | ||
Equinix, Inc. | 6.0 | ||
Welltower, Inc. | 4.8 | ||
Alexandria Real Estate Equity | 4.6 | ||
Mid America Apartment Comm. | 4.5 | ||
Equity Lifestyle Properties, Inc. | 4.3 | ||
Camden Property Trust | 4.1 | ||
Boston Properties, Inc. | 3.8 | ||
Total | 55.5 | % | |
Market Outlook
By almost any measure, 2018 has been a good year for core U.S. real estate. According to the National Council of Real Estate Investment Fiduciaries, or NCREIF, as of September 2018, the all-property core vacancy rate slipped to 5.8% in the third quarter of 2018, its lowest level in nearly 18 years, and net operating incomes were up 4.2% year-over-year, based on a four-quarter moving average. Despite three Federal Reserve rate hikes, as measured by NCREIF as of September 2018, capitalization rates remained broadly stable and total returns to unlevered core real estate inched up to 7.2% for the trailing four quarters ended September 2018 from 7% in 2017.
While overall performance has appeared solid, a few cracks have formed beneath the surface, including in malls and New York property. As interest rates have increased, the broader financial backdrop has become more turbulent. A key question for investors, therefore, is whether pockets of weakness and macroeconomic uncertainty herald a more difficult future for the asset class.
In our view, the outlook remains positive, albeit with certain caveats. We believe a strong pace of economic growth, fueled by positive momentum and fiscal stimulus, should propel occupational demand. We further believe that supply should remain manageable, constrained by labor shortages and rising construction costs. With vacancy rates already low, we believe this environment should be conducive to healthy rental income growth. At the same time, we believe rising interest rates will likely exert a headwind to valuations.
Absent the broad-based tailwind of falling yields / capitalization rates, we expect that returns will vary widely across sectors and cities, driven by differences in income growth. In particular, we anticipate the industrial sector, supported by the relentless growth of e-commerce, should handily outperform other sectors. Geographically, while supply-constrained coastal cities should perform well over the long term, we believe there is significant tactical opportunity in Texas, Florida, and several other southern locations (e.g., Phoenix, Atlanta, and Nashville), which benefit from burgeoning populations, dynamic economies, and attractive valuations.
Results of Operations
Through September 30, 2018, we have acquired eleven properties and invested in real estate equity securities as described above under "Portfolio Information." We expect to continue to raise additional capital, increase our borrowings and make future investments in our targeted segments of real estate properties, real estate equity securities and real estate loans, which we believe will have a significant impact on our future results of operations.
We review our stabilized operating results, measured by contractual rental revenue, including tenant reimbursement income, less property operating expenses, which we refer to as net operating income, for properties that we owned for the entirety of both the current and prior year reporting periods, which we refer to as “same store”
38
properties. We believe that net operating income, a non-GAAP financial measure, in combination with net loss and cash flows from operating activities, as defined by GAAP, is a useful supplemental performance measure that helps us evaluate our operating performance. We believe this metric is useful to our stockholders and other users of our reports because it provides additional information regarding our property acquisitions and their impact on our portfolio. Net operating income should not be considered as an alternative to net income or loss or to cash flows from operating activities (both as defined by GAAP) as an indication of our performance and is not intended to be used as a liquidity measure indicative of cash flow available to fund our cash needs, including our ability to make distributions to our stockholders. No single measure can provide users of financial information with sufficient information, and only our disclosures read as a whole can be relied upon to adequately portray our financial position, liquidity and results of operations.
Three and Nine Months Ended September 30, 2018 and 2017
The following table illustrates the changes in property operating revenues, property operating expenses, and net operating income for the three and nine months ended September 30, 2018 and 2017. "Non-same store," as reflected in the table below, includes properties acquired after January 1, 2017 which for the three and nine months ended September 30, 2018 and 2017 is only the Miami Industrial Properties. For purposes of comparative analysis, the table below reconciles the net operating income to net income or loss determined in accordance with GAAP for the three and nine months ended September 30, 2018 and 2017.
Three Months Ended September 30, | Nine Months Ended September 30, | ||||||||||||||||||||||
2018 | 2017 | Change | 2018 | 2017 | Change | ||||||||||||||||||
Property operating revenue | |||||||||||||||||||||||
Contractual rental revenue and other property income | $ | 3,620,720 | $ | 3,714,023 | $ | (93,303 | ) | $ | 11,508,370 | $ | 10,836,073 | $ | 672,297 | ||||||||||
Tenant reimbursement income | 672,010 | 540,528 | 131,482 | 1,891,118 | 1,608,351 | 282,767 | |||||||||||||||||
Property operating revenue - same store portfolio | 4,292,730 | 4,254,551 | 38,179 | 13,399,488 | 12,444,424 | 955,064 | |||||||||||||||||
Property operating revenue - non-same store portfolio | 374,818 | — | 374,818 | 374,818 | — | 374,818 | |||||||||||||||||
Total property operating revenue | 4,667,548 | 4,254,551 | 412,997 | 13,774,306 | 12,444,424 | 1,329,882 | |||||||||||||||||
Property operating expenses | |||||||||||||||||||||||
Same-store portfolio | 1,485,990 | 1,446,432 | 39,558 | 4,236,083 | 4,093,912 | 142,171 | |||||||||||||||||
Non-same-store portfolio | 112,007 | — | 112,007 | 112,007 | — | 112,007 | |||||||||||||||||
Total property operating expenses | 1,597,997 | 1,446,432 | 151,565 | 4,348,090 | 4,093,912 | 254,178 | |||||||||||||||||
Net operating income | |||||||||||||||||||||||
Same-store portfolio | 2,806,740 | 2,808,119 | (1,379 | ) | 9,163,405 | 8,350,512 | 812,893 | ||||||||||||||||
Non-same-store portfolio | 262,811 | — | 262,811 | 262,811 | — | 262,811 | |||||||||||||||||
Total net operating income | 3,069,551 | 2,808,119 | 261,432 | 9,426,216 | 8,350,512 | 1,075,704 | |||||||||||||||||
Adjustments to property operating revenue | |||||||||||||||||||||||
Straight line adjustment | 257,840 | 67,638 | 190,202 | (52,691 | ) | 450,710 | (503,401 | ) | |||||||||||||||
39
Amortization of above- and below-market lease intangibles, net | 91,650 | 63,878 | 27,772 | 233,200 | 191,634 | 41,566 | |||||||||||||||||
Amortization of lease incentive | (26,123 | ) | (26,122 | ) | (1 | ) | (77,516 | ) | (77,516 | ) | — | ||||||||||||
Depreciation | (1,162,905 | ) | (1,085,483 | ) | (77,422 | ) | (3,325,560 | ) | (3,253,971 | ) | (71,589 | ) | |||||||||||
Amortization | (1,125,428 | ) | (933,854 | ) | (191,574 | ) | (2,938,390 | ) | (2,794,203 | ) | (144,187 | ) | |||||||||||
General and administrative expenses | (434,501 | ) | (407,787 | ) | (26,714 | ) | (1,441,290 | ) | (1,272,533 | ) | (168,757 | ) | |||||||||||
Advisory fees | (542,353 | ) | (623,670 | ) | 81,317 | (1,211,569 | ) | (1,128,071 | ) | (83,498 | ) | ||||||||||||
Interest expense | (1,012,974 | ) | (910,512 | ) | (102,462 | ) | (2,800,888 | ) | (2,622,446 | ) | (178,442 | ) | |||||||||||
Marketable securities | |||||||||||||||||||||||
Investment income on marketable securities | 136,832 | 84,836 | 51,996 | 345,609 | 205,692 | 139,917 | |||||||||||||||||
Net realized gain (loss) on marketable securities | 201,769 | (25,389 | ) | 227,158 | (206,763 | ) | 22,407 | (229,170 | ) | ||||||||||||||
Net unrealized (loss) gain on marketable securities | (201,223 | ) | — | (201,223 | ) | 280,022 | — | 280,022 | |||||||||||||||
Net loss | $ | (747,865 | ) | $ | (988,346 | ) | $ | 240,481 | $ | (1,769,620 | ) | $ | (1,927,785 | ) | $ | 158,165 | |||||||
Property Operations
Our total same store net operating income for the three and nine months ended September 30, 2018 and 2017 reflects eight of the eleven properties in the portfolio. Property operating revenue for the nine months ended September 30, 2018 increased from the same period in 2017 primarily due to lease modification income of $742,000 related to the modification of the lease with Gateway One Lending and Finance at our Anaheim Hills Office Plaza property. In this modification, Gateway One Lending and Finance reduced their occupied space from 50,000 square feet to 25,000 square feet. Similarly, the property operating revenue for the three months ended September 30, 2018 decreased from the same period in 2017 primarily due to this reduction of space by Gateway One Lending and Finance. Tenant reimbursement income for the three and nine months ended September 30, 2018 was higher than the three and nine months ended September 30, 2017 due to higher operating expenses in 2018 being reimbursed by tenants at Terra Nova Plaza, Commerce Corner, and Allied Drive. Generally, certain of our leases will obligate the tenants to pay all operating costs (as in a triple net lease) or pay operating costs over a specified base year amount, and therefore increased operating costs will likely lead to increased tenant reimbursement income.
Property operating expenses for the three and nine months ended September 30, 2018 increased from the same period in 2017 primarily due to increased real estate taxes at Commerce Corner, increased snow removal expenses at Commerce Corner, increase in prior year common area maintenance at Terra Nova, and higher administrative costs at Allied Drive.
Our non-same store property operating revenues and operating expenses for the three and nine months ended September 30, 2018 relates to the July 17, 2018 acquisition of the Miami Industrial Properties.
Straight Line Adjustment
The change in the straight line rent adjustment for the three and nine months ended September 30, 2018 compared to the 2017 periods was due to the aforementioned $742,000 of lease modification income received from Gateway One Lending and Finance in the first quarter of 2018 which is being recognized on a straight line basis over the 13-month period from January 2018 through January 2019.
40
Lease Intangible Amortization
During the three and nine months ended September 30, 2018, the net amount of above- and below-market lease amortization is higher than the same period in 2017 primarily due to the acquisition of the Miami Industrial Properties in July 2018 and the rollover of an acquired above-market lease at Anaheim Hills Office Plaza into a renewal period. Lease incentive amortization represents amortization of the lease incentive paid to Dick's Sporting Goods, Inc. which is being amortized over the approximate 10-year term of that lease.
Depreciation and Amortization
The depreciation and amortization on properties increased in the 2018 period as a result of the acquisition of the Miami Industrial properties in July 2018.
General and Administrative
Our general and administrative expenses include a variety of corporate expenses, the largest of which were directors and officers insurance, audit fees, legal fees, professional fees and independent director compensation. The amount for the nine months ended September 30, 2018 increased from the same periods in 2017 primarily due to the 2017 reimbursement by RREEF America of approximately $149,000 for total operating expenses, as defined in our charter, that were in excess of the 2%/25% guidelines for the four fiscal quarters ended December 31, 2016. Excluding the reimbursement, general and administrative expenses increased due to higher costs including tax, audit, and professional fees, slightly offset by a decrease in legal fees. For the three months ended September 30, 2018, the increase from the same period in 2017 is due to higher audit, and marketing expenses.
Advisory Fees
The fixed component of the advisory fee pursuant to the advisory agreement is equal to 1% per annum of the NAV for each share class and is calculated and accrued daily and reflected in our NAV per share. For the three and nine months ended September 30, 2018 and 2017, the advisory fee was comprised of the fixed and performance components. The fixed component of the advisory fee was higher in the 2018 period compared to the 2017 period which is commensurate with the overall increase in our NAV, as we continue to raise and invest capital.
In accordance with our advisory agreement, our advisor can earn the performance component of the advisory fee when the total return to stockholders exceeds a required 6% per annum hurdle. The performance component is calculated separately for each share class and is comprised of the distributions paid to stockholders in each share class combined with the change in price of each share class. For any calendar year in which the total return per share allocable to a class exceeds 6% per annum (the “Hurdle Amount”), RREEF America will receive up to 10% of the aggregate total return allocable to such class with a Catch-Up (defined below) calculated as follows: first, if the total return for the applicable period exceeds the Hurdle Amount, 25% of such total return in excess of the Hurdle Amount (the “Excess Profits”) until the total return reaches 10% (commonly referred to as a “Catch-Up”); and second, to the extent there are remaining Excess Profits, 10% of such remaining Excess Profits. The performance component of the advisory fee is payable annually based on the results for the entire calendar year. The actual performance component that our advisor could earn in the current calendar year depends on several factors, including but not limited to the performance of our investments, our expenses and interest rates. For the three and nine months ended September 30, 2018 and 2017, the total return of each share class exceeded the required 6% per annum hurdle, applied on a pro rated basis. In accordance with GAAP, at each interim period end, we consider the estimated performance component that is probable to be due to our advisor as of the end of the current calendar year in assessing whether the calculated performance component as of the interim balance sheet date meets the threshold for recognition. We accrued a performance component of $210,000 and $300,000 for the three and nine months ended September 30, 2018, respectively, and $353,301 for the three and nine months ended September 30, 2017.
Interest Expense
The increase in interest expense in the three and nine months ended September 30, 2018 over the same period in
41
2017 was primarily due to higher LIBOR rates in the 2018 period. The weighted average outstanding aggregate balances on our line of credit were approximately $64,400,000 and $64,500,000 for the nine months ended September 30, 2018 and 2017, respectively. The 1-month LIBOR rate increased approximately 103 basis points in the past 12 months which increased the interest expense on the Wells Fargo line of credit. The all-in interest rates on the Wells Fargo line of credit averaged approximately 3.49% and 2.83% for the nine months ended September 30, 2018 and 2017, respectively. The overall increase in the line of credit interest expense was partially offset by decreased amortization of loan financing costs. We expect our interest expense to increase in future periods because we anticipate acquiring additional properties with borrowings in the future, both by utilizing additional property-specific debt as a form of permanent financing along with continuing to use the line of credit.
Marketable Securities
During the nine months ended September 30, 2018, we invested an additional $5,300,000 into our real estate securities portfolio, which increased our cost basis for the nine months ended September 30, 2018 by approximately 57% when compared to the nine months ended September 30, 2017. The increase in investment income for the nine months ended September 30, 2018 compared to the 2017 period is primarily due to the larger investment basis. Our portfolio of investments in publicly-traded REIT securities is actively managed and thus is regularly adjusted by increasing and decreasing specific holdings primarily based upon changes in sector allocations and to a lesser degree based upon performance of specific securities. These continual portfolio refinements generate realized gains and losses by using the highest cost method whereby a sale of any particular security is first attributed to the shares of that security with the highest cost basis. Our marketable securities portfolio generally rose during the second quarter of 2018 and continued through the first part of the third quarter of 2018, leading to net realized gains for the three months ended September 30, 2018. This was followed by a decline during September driven by interest rate pressures, resulting in a net unrealized loss for the three months ended September 30, 2018.
Pursuant to the adoption of Accounting Standards Update 2016-01, net unrealized gains and losses on our investments in marketable securities are now recognized in the consolidated statement of operations beginning January 1, 2018. Previously, such amounts were recognized as part of other comprehensive loss. The net unrealized gain for the nine months ended September 30, 2018 was significantly larger than the net unrealized loss for the nine months ended September 30, 2017 due to the aforementioned general market appreciation during the middle of the 2018 period.
Inflation
In our view, the real estate property sector has not been affected significantly by inflation in the past several years due to the relatively low inflation rate. With the exception of leases with tenants in apartment properties, we will seek to include provisions in our tenant leases designed to protect us from the impact of inflation. These provisions will include reimbursement billings for operating expense pass-through charges, real estate tax and insurance reimbursements, or in some cases, annual reimbursement of operating expenses above a certain allowance. Due to the generally long-term nature of these leases, annual rent increases may not be sufficient to cover inflation and rent may be below market. Leases in apartment properties generally turn over on an annual basis and do not typically present the same concerns regarding inflation protection due to their short-term nature.
NAV per Share
Our NAV per share is calculated in accordance with the valuation guidelines approved by our board of directors for the purposes of establishing a price for shares sold in our public offering as well as establishing a redemption price. The following table provides a breakdown of the major components of our total NAV and NAV per share as of September 30, 2018:
42
Components of NAV | Total NAV | Per Class A Share | Per Class I Share | Per Class T Share | ||||||||||||
Investments in real estate (1) | $ | 217,708,500 | $ | 21.75 | $ | 21.89 | $ | 21.79 | ||||||||
Investments in real estate equity securities (2) | 15,697,601 | 1.57 | 1.58 | 1.57 | ||||||||||||
Other assets, net | 6,231,101 | 0.62 | 0.64 | 0.61 | ||||||||||||
Line of credit | (67,500,000 | ) | (6.74 | ) | (6.79 | ) | (6.76 | ) | ||||||||
Mortgage loans payable | (27,500,000 | ) | (2.75 | ) | (2.77 | ) | (2.75 | ) | ||||||||
Other liabilities, net | (4,263,769 | ) | (0.43 | ) | (0.43 | ) | (0.40 | ) | ||||||||
Net asset value | $ | 140,373,433 | $ | 14.02 | $ | 14.12 | $ | 14.06 | ||||||||
Note: No Class D or Class N shares were outstanding as of September 30, 2018. | ||||||||||||||||
(1) | The value of our investments in real estate was approximately 12.8% more than their historical cost. |
(2) | The value of our investments in real estate securities was approximately 6.9% more than their historical cost. |
The table below sets forth a reconciliation of our stockholders' equity to our NAV, which we calculate for the purpose of establishing the purchase and redemption price for our shares, as of September 30, 2018.
Total NAV | Per Class A Share | Per Class I Share | Per Class T Share | ||||||||||||
Total stockholders' equity | $ | 76,865,303 | $ | 7.67 | $ | 7.74 | $ | 7.67 | |||||||
Plus: | |||||||||||||||
Unrealized gain on real estate investments | 24,685,702 | 2.47 | 2.48 | 2.47 | |||||||||||
Accumulated depreciation | 15,013,328 | 1.50 | 1.51 | 1.50 | |||||||||||
Accumulated amortization | 15,477,845 | 1.55 | 1.56 | 1.55 | |||||||||||
Deferred costs and expenses | 10,226,621 | 1.02 | 1.02 | 1.06 | |||||||||||
Less: | |||||||||||||||
Deferred rent receivable | (1,895,366 | ) | (0.19 | ) | (0.19 | ) | (0.19 | ) | |||||||
Net asset value | $ | 140,373,433 | $ | 14.02 | $ | 14.12 | $ | 14.06 | |||||||
Note: No Class D or Class N shares were outstanding as of September 30, 2018. | |||||||||||||||
With respect to the unrealized gain on real estate investments reflected above, as of September 30, 2018, all properties except the three Miami Industrial properties had been appraised by a third-party appraisal firm in addition to our independent valuation advisor. Set forth below are the weighted averages of the key assumptions used in the appraisals of the office and retail properties as of September 30, 2018. Once we own more than one property for each of the industrial and apartment property types, and they have been appraised by a third-party appraisal firm, we will include the key assumptions for these property types.
Discount Rate | Exit Capitalization Rate | ||
Office properties | 7.41% | 6.55% | |
Retail properties | 6.50% | 6.16% | |
These assumptions are determined by our independent valuation advisor or by separate third-party appraisers. A change in these assumptions would impact the calculation of the value of our property investments. For example, assuming all other factors remain unchanged, an increase in the weighted-average discount rate used as of September 30, 2018 of 0.25% would yield a decrease in the total office property investment value of 1.8% and a decrease in the retail property investment value of 1.8%. Similarly, an increase in the weighted-average exit capitalization rate used as of September 30, 2018 of 0.25% would yield a decrease in the total office property
43
investment value of 2.2% and would yield a decrease in the total retail property investment value of 2.2%.
The deferred costs and expenses of $10,226,621 includes amounts that are initially excluded from the NAV calculation. This includes $7,591,130 payable to our advisor, which is less than the total amount payable to our advisor as reflected on our consolidated balance sheet, because (1) certain amounts payable to our advisor as of September 30, 2018 were recorded as assets and as such have no impact on our NAV as of September 30, 2018, and (2) the amount payable to our advisor as reflected in due to affiliates and note to affiliate on our consolidated balance sheet includes accrued advisory fees and other amounts due under the advisory agreement. The deferred amounts will be included in the NAV calculation as such costs are reimbursed to our advisor, in accordance with the advisory agreement, the expense support agreement and the ESA letter agreement dated April 25, 2016 amending the advisory agreement and expense support agreement (defined below). Through September 30, 2018, we reimbursed our advisor for $4,380,573 of deferred offering costs and expenses, which have been included as a deduction to our NAV calculation in a pro rata amount on a daily basis since these reimbursements began in January 2014. The deferred costs and expenses above additionally includes $2,869,271 in estimated trailing fees that will be deducted from the NAV on a daily basis as and when they become payable to DWS Distributors, Inc., or the dealer manager. Lastly, the deferred cost and expenses above is net of the portion of the performance component of the advisory fee that is reflected in the NAV calculation but does not yet meet the threshold for accrual under GAAP.
Limitations and Risks
As with any valuation methodology, our methodology is based upon a number of estimates and assumptions that may not be accurate or complete. Different parties with different assumptions and estimates could derive a different NAV per share. Accordingly, with respect to our NAV per share, we can provide no assurance that:
• | a stockholder would be able to realize this NAV per share upon attempting to resell his or her shares; |
• | we would be able to achieve, for our stockholders, the NAV per share, upon a listing of our shares of common stock on a national securities exchange, selling our real estate portfolio, or merging with another company; or |
• | the NAV per share, or the methodologies relied upon to estimate the NAV per share, will be found by any regulatory authority to comply with any regulatory requirements. |
Furthermore, the NAV per share was calculated as of a particular point in time. The NAV per share will fluctuate over time in response to, among other things, changes in real estate market fundamentals, capital markets activities, and attributes specific to the properties and leases within our portfolio.
Funds from Operations and Modified Funds from Operations
We believe that funds from operations, or FFO, FFO as adjusted and modified funds from operations, or MFFO, in combination with net loss and cash flows from operating activities, as defined by GAAP, are useful supplemental performance measures that we use to evaluate our operating performance. However, these supplemental, non-GAAP measures should not be considered as an alternative to net income or loss or to cash flows from operating activities, both as determined by GAAP, as an indication of our performance and are not intended to be used as a liquidity measure indicative of cash flow available to fund our cash needs, including our ability to make distributions to our stockholders. No single measure can provide users of financial information with sufficient information, and only our disclosures read as a whole can be relied upon to adequately portray our financial position, liquidity and results of operations. In addition, other REITs may define FFO and similar measures differently and thus choose to treat certain accounting line items in a manner different from us due to differences in investment and operating strategy or for other reasons.
As defined by the National Association of Real Estate Investment Trusts, or NAREIT, FFO is a non-GAAP supplemental financial performance measure that excludes certain items such as real estate-related depreciation and amortization and the impact of certain non-recurring items such as realized gains and losses on sales of real estate. We believe FFO is a meaningful supplemental financial performance measure of our operating performance that is useful to investors because depreciation and amortization in accordance with GAAP implicitly assume that the value
44
of real estate assets diminishes predictably over time. Additionally, realized gains and losses on sales of real estate generally occur infrequently. As a result, excluding these items from FFO aids our analysis of our ongoing operations. We use FFO as an indication of our operating performance and as a guide to making decisions about future investments.
As defined by the Institute for Portfolio Alternatives, or IPA, MFFO is a non-GAAP supplemental financial performance measure used to assist us in evaluating our operating performance. We believe that MFFO is helpful as a measure of ongoing operating performance because it excludes costs that management considers more reflective of investing activities and other non-operating items included in FFO. Compared to FFO, MFFO additionally excludes items such as acquisition-related costs (if expensed in accordance with GAAP), non-cash amounts related to straight-line rent, amortization of above- and below-market lease intangibles and mark to market valuation adjustments on securities. In addition, there are certain other MFFO adjustments as defined by the IPA that are not applicable to us at this time and are not included in our presentation of MFFO. We believe that excluding acquisition costs from MFFO, if such costs were expensed in accordance with GAAP, provides investors with supplemental performance information that is consistent with our analysis of the operating performance of our portfolio over time, including periods after our acquisition stage.
Effective January 1, 2018, we adopted Financial Accounting Standards Board Accounting Standard Update 2016-01, Financial Statements - Overall (Subtopic 825-10) - Recognition and Measurement of Financial Assets and Financial Liabilities (ASU 2016-01), which revised the accounting related to the classification and measurement of investments in equity securities. Since our inception and prior to adoption of ASU 2016-01, we accounted for our investments in equity securities as available for sale securities, with unrealized changes in fair value recognized in other comprehensive income or loss. Beginning January 1, 2018, under ASU 2016-01 the net unrealized change in the fair value of our investments in marketable securities for the period presented is recorded in earnings as part of operating income or loss. As a result, under the current NAREIT definition of FFO, the net unrealized change in the fair value of our investments in marketable securities is included in our FFO. Our investment objective with our investments in marketable securities is to generate consistent income while providing an opportunity for long term price appreciation. Additionally, we believe that investing a portion of our proceeds from our offerings into a diversified portfolio of common and preferred shares of REITs and other real estate operating companies will provide our overall investment portfolio some flexibility with near-term liquidity as well as potentially enhance our NAV over a longer period. The securities portfolio is regularly reviewed and evaluated to determine whether the marketable securities held at any time continue to serve their original intended purposes. In accordance with our objectives, it is our view that providing FFO as adjusted for the net unrealized change in the fair value of our securities portfolio will enhance an investor's understanding of the impact of our securities portfolio on our ongoing operations. The IPA definition of MFFO includes an adjustment for mark to market valuations on marketable securities, and as such the adoption of ASU 2016-01 had no impact on our MFFO.
We use FFO, MFFO and FFO as adjusted, among other things: (i) to evaluate and compare the potential performance of the portfolio after the acquisition phase is complete, and (ii) as metrics in evaluating our ongoing distribution policy. We believe investors are best served if the information that is made available to them allows them to align their analyses and evaluation with these same performance metrics used by us in planning and executing our business strategy. We believe that these performance metrics will assist investors in evaluating the potential performance of the portfolio after the completion of the acquisition phase. However, these supplemental, non-GAAP measures are not necessarily indicative of future performance and should not be considered as an alternative to net income or loss or to cash flows from operating activities, both as determined by GAAP, and are not intended to be used as a liquidity measure indicative of cash flow available to fund our cash needs, including our ability to make distributions to our stockholders. Neither the SEC, NAREIT, nor any regulatory body has passed judgment on the acceptability of the adjustments used to calculate FFO as adjusted or MFFO. In the future, the SEC, NAREIT, or a regulatory body may decide to standardize the allowable adjustments across the non-listed REIT industry at which point we may adjust our calculation and characterization of FFO as adjusted or MFFO.
The following unaudited table presents a reconciliation of net loss to FFO, FFO as adjusted, and MFFO. For comparative purposes, the prior period information is presented both as originally reported, and on a pro forma basis as if ASU 2016-01 was effective in those prior periods.
45
Three Months Ended September 30, | Nine Months Ended September 30, | ||||||||||||||||||||||
2018 | 2017 As reported | 2017, Pro forma for ASU 2016-01 | 2018 | 2017 As reported | 2017, Pro forma for ASU 2016-01 | ||||||||||||||||||
Net loss | $ | (747,865 | ) | $ | (988,346 | ) | $ | (1,000,350 | ) | $ | (1,769,620 | ) | $ | (1,927,785 | ) | $ | (1,925,271 | ) | |||||
Real estate related depreciation | 1,162,905 | 1,085,483 | 1,085,483 | 3,325,560 | 3,253,971 | 3,253,971 | |||||||||||||||||
Real estate related amortization | 1,125,428 | 933,854 | 933,854 | 2,938,390 | 2,794,203 | 2,794,203 | |||||||||||||||||
NAREIT defined FFO | 1,540,468 | 1,030,991 | 1,018,987 | 4,494,330 | 4,120,389 | 4,122,903 | |||||||||||||||||
Net unrealized loss (gain) on investments in marketable securities | 201,223 | — | 12,004 | (280,022 | ) | — | (2,514 | ) | |||||||||||||||
FFO as adjusted | 1,741,691 | 1,030,991 | 1,030,991 | 4,214,308 | 4,120,389 | 4,120,389 | |||||||||||||||||
Additional adjustments: | |||||||||||||||||||||||
Straight line rents, net | (257,840 | ) | (67,638 | ) | (67,638 | ) | 52,691 | (450,710 | ) | (450,710 | ) | ||||||||||||
Amortization of above- and below-market lease intangibles, net | (91,650 | ) | (63,878 | ) | (63,878 | ) | (233,200 | ) | (191,634 | ) | (191,634 | ) | |||||||||||
Amortization of lease incentive | 26,123 | 26,122 | 26,122 | 77,516 | 77,516 | 77,516 | |||||||||||||||||
IPA defined MFFO | $ | 1,418,324 | $ | 925,597 | $ | 925,597 | $ | 4,111,315 | $ | 3,555,561 | $ | 3,555,561 | |||||||||||
Liquidity and Capital Resources
Our primary needs for liquidity and capital resources are to fund our investments in accordance with our investment strategy and policies, make distributions to our stockholders, redeem shares of our common stock pursuant to our redemption plan, pay our offering and operating fees and expenses and pay interest on any outstanding indebtedness.
Over time, we generally intend to fund our cash needs for items, other than asset acquisitions and material capital improvements, from operations. Our cash needs for acquisitions and material capital improvements will be funded primarily from the sale of shares of our common stock in our offerings, and the amount we may raise in such offerings is uncertain. We commenced our follow-on offering on July 12, 2016. We intend to contribute any additional net proceeds from our offerings that are not used or retained to pay the fees and expenses attributable to our operations to our operating partnership. Since our inception through September 30, 2018, we raised $151,763,679 from the sale of shares of our common stock, of which $10,200,000 of our Class I shares were purchased by RREEF America.
We may also satisfy our cash needs for acquisitions and material capital improvements through the assumption or incurrence of debt. On February 27, 2018, we entered into an amended and restated secured revolving line of credit with Wells Fargo Bank, National Association. The Wells Fargo line of credit has a three-year term with two one-year extension options exercisable by us upon satisfaction of certain conditions and payment of applicable extension fees. The first extension option becomes exercisable in November 2020. The interest rate under the Wells Fargo line of credit is based on the 1-month LIBOR with a spread of 160 to 180 basis points depending on the debt yield as defined in the agreement. The Wells Fargo line of credit has a current maximum capacity of $100,000,000, and we have the option to expand the Wells Fargo line of credit up to a maximum capacity of $200 million upon satisfaction of specified conditions. Each requested expansion must be for at least $25 million and may result in the
46
Wells Fargo line of credit being syndicated. As of September 30, 2018, the outstanding balance and weighted average interest rate were $67,500,000 and 3.76%, respectively.
The Wells Fargo line of credit has as co-borrowers certain of the wholly-owned subsidiaries of our operating partnership, with the Company serving as the guarantor. At any time, the borrowing capacity under the Wells Fargo line of credit is based on the lesser of (1) an amount equal to 65% of the aggregate value of the properties in the collateral pool as determined by lender appraisals, (2) an amount that results in a minimum debt yield of 10% based on the in-place net operating income of the collateral pool as defined or (3) the maximum capacity of the Wells Fargo line of credit. Proceeds from the Wells Fargo line of credit can be used to fund acquisitions, redeem shares pursuant to our redemption plan and for any other corporate purpose. As of September 30, 2018, our maximum borrowing capacity was $95,510,154. The Wells Fargo line of credit agreement contains customary representations, warranties, borrowing conditions and affirmative, negative and financial covenants, including that there must be at least five properties in the collateral pool at all times, and the collateral pool must also meet specified concentration provisions, unless waived by the lender. In addition, the guarantor must meet tangible net worth hurdles. As of September 30, 2018, we were in compliance with all covenants.
On March 1, 2016, we, through an indirect wholly-owned subsidiary as borrower, entered into a credit agreement providing for a $14,500,000 secured, fully non-recourse loan with Nationwide Life Insurance Company, or Nationwide. The Nationwide loan is secured by The Flats at Carrs Hill, our 138 unit student housing apartment property in Athens, Georgia. The interest rate for the Nationwide loan is fixed at 3.63% with interest-only payments for the full term of the loan. The maturity date of the Nationwide loan is March 1, 2026 with no extension options. The Nationwide loan permits voluntary prepayment of the full amount of the loan at any time subject to payment of the applicable prepayment premium, which is (a) the greater of a yield maintenance calculation or 1.0% of the principal amount outstanding for prepayments occurring up to and including the 96th month of the term, (b) 2.0% of the principal amount outstanding for prepayments occurring during months 97 through 102 of the term, or (c) 1.0% of the principal amount outstanding for prepayments occurring during months 103 through 114 of the term. The Nationwide loan is prepayable at par during the last six months of the term. Additionally, the Nationwide loan contains a one-time option to be assumed by a new borrower subject to satisfaction, in Nationwide's sole discretion, of specified conditions and payment of a fee equal to 1.0% of the outstanding balance of the loan. Proceeds of $14,500,000 were applied to our initial Wells Fargo line of credit that was originated in March 2015. Prior to closing of the Nationwide loan, The Flats at Carrs Hill served as additional collateral under the initial Wells Fargo line of credit.
On December 1, 2016, we, through an indirect wholly-owned subsidiary as borrower, entered into a credit agreement with Hartford Life Insurance Company, or Hartford. Proceeds of $13,000,000 obtained from Hartford were used to repay outstanding balances under the initial Wells Fargo line of credit, thereby releasing Commerce Corner from the initial Wells Fargo line of credit. The Hartford loan is a secured, fully non-recourse loan with a term of seven years and no extension options. The Hartford loan carries a fixed interest rate of 3.41% with interest-only payments for the first 24 months of the term, followed by principal and interest payments for the remainder of the term, based upon a 30-year amortization schedule.
In the future, as our assets increase, it may not be commercially feasible or we may not be able to secure an adequate line of credit to fund acquisitions, redemptions or other needs. Moreover, actual availability may be reduced at any given time if the values of our real estate or our marketable securities portfolio decline.
Expense Payments by Our Advisor
In connection with our advisory agreement, RREEF America agreed to pay all of our organization and offering costs through January 3, 2013, and certain of our organization and offering costs through January 3, 2014, all of which were incurred on our behalf and which we refer to as the Deferred O&O. These costs amounted to $4,618,318. The total of the Deferred O&O is being reimbursed to RREEF America on a pro rata basis over a 60-month period that began January 3, 2014 and with the final payment scheduled for December 2018. However, such reimbursements will be limited to a cumulative amount that does not cause our total organization and offering costs to exceed 15% of the gross proceeds raised from our initial offering at any time. As of September 30, 2018, the total
47
Deferred O&O paid by our advisor did not cause us to exceed the foregoing 15% limit. During the nine months ended September 30, 2018, we reimbursed RREEF America for $690,471 of Deferred O&O, and we have made total reimbursements to RREEF America of $4,380,573 against the Deferred O&O through September 30, 2018.
Also pursuant to the advisory agreement, RREEF America is entitled to reimbursement of certain costs incurred by RREEF America or its affiliates. Costs eligible for reimbursement include most third-party operating expenses, salaries and related costs of its employees who perform services for us (but not those employees for which RREEF America earns a separate fee or those employees who are our executive officers) and travel related costs for its employees who incur such costs on our behalf. We will reimburse our advisor for all expenses paid or incurred by our advisor in connection with the services provided to us, subject to the limitations described below regarding the 2%/25% guidelines as defined in our advisory agreement. As of September 30, 2018, we owed $76,525 to our advisor for such costs.
On May 29, 2013, we entered into an expense support agreement with our advisor, which was amended and restated most recently on January 20, 2016, which we refer to as the expense support agreement. Pursuant to the terms of the expense support agreement, our advisor incurred expenses related to our operations in addition to the Deferred O&O, which we refer to as expense payments. As of December 31, 2015, our advisor had incurred $9,200,000 in expense payments, which was the maximum amount of expense payments allowed under the expense support agreement.
As the expense payment limit had been reached, pursuant to the expense support agreement, in January 2016 the reimbursement provisions were triggered. During the first quarter of 2016, we reimbursed $250,000 to our advisor under the expense support agreement. On April 25, 2016, we and our advisor entered into a letter agreement that amended certain provisions of the advisory agreement and the expense support agreement, which we refer to as the ESA letter agreement. The ESA letter agreement provides, in part, that our obligations to reimburse our advisor for expense payments under the expense support agreement are suspended until the first calendar month following the month in which we have reached $500 million in offering proceeds from our offerings, which we refer to as the ESA commencement date. We currently owe $8,950,000 to our advisor under the expense support agreement. Beginning the month following the ESA commencement date, we will make monthly reimbursement payments to our advisor in the amount of $416,667 for the first 12 months and $329,166 for the second 12 months, subject to monthly reimbursement payment limitations described in the ESA letter agreement. In addition, pursuant to the ESA letter agreement, if RREEF America is serving as our advisor at the time that we or our operating partnership undertakes a liquidation, our remaining obligations to reimburse our advisor for the unpaid Deferred O&O under the advisory agreement and the unpaid monthly reimbursements under the expense support agreement shall be waived.
Limits on Expense Reimbursement
In all cases, reimbursement payments to our advisor will be subject to reduction as necessary in order to ensure that such reimbursement payment will not cause the aggregate organization and offering costs paid by us for an offering to exceed 15% of the gross proceeds from the sale of shares in such offering as of the date of the reimbursement payment, and such reimbursement payment will not adversely affect our ability to maintain our status as a REIT for federal tax purposes.
In addition to the reimbursement limitations for organization and offering costs, we are also limited in the amount of operating expenses that we may reimburse our advisor. Pursuant to our charter, we may reimburse our advisor, at the end of each fiscal quarter, for total operating expenses incurred by our advisor; provided, however, that we may not reimburse our advisor at the end of any fiscal quarter for total operating expenses (as defined in our charter) that, in the four consecutive fiscal quarters then ended, exceed the greater of 2% of our average invested assets or 25% of our net income determined without reduction for any additions to reserves for depreciation, bad debts or other similar non-cash reserves and excluding any gain from the sale of our assets for that period (which we refer to as the 2%/25% guidelines) for such four-quarter period. Notwithstanding the foregoing, we may reimburse our advisor for expenses in excess of the 2%/25% guidelines if a majority of our independent directors determine that such excess expenses, which we refer to as an excess amount, are justified based on unusual and non-recurring factors. For the four fiscal quarters ended September 30, 2018, our total operating expenses (as defined in our
48
charter) were $3,604,820, which did not exceed the amount prescribed by the 2%/25% guidelines.
Pursuant to the expense support agreement, the amount of the reimbursement payment paid in any calendar quarter will not be aggregated with our cumulative operating expenses for any four consecutive calendar quarters that includes the calendar quarter in which such reimbursement payment is paid, and instead the amount of the unreimbursed expense payments comprising such reimbursement payment will have previously been aggregated with our total operating expenses for the four calendar quarter periods ending with the calendar quarter in which such expense payment was originally incurred, which we refer to as prior 2%/25% periods. If an unreimbursed expense payment incurred during a prior 2%/25% period exceeded the 2%/25% guidelines for such prior 2%/25% period, the amount of such excess will only be reimbursed pursuant to the expense support agreement to the extent that our independent directors previously approved such excess with respect to the applicable prior 2%/25% period. Our independent directors approved the excess amount for every period of four consecutive quarters since we were first subject to this limitation for the four consecutive quarters ended June 30, 2014 through September 30, 2016. During the fiscal quarter ended March 31, 2017, our advisor reimbursed us for the excess amount related to the four fiscal quarters ended December 31, 2016. Our total operating expenses have not exceeded the 2%/25% guidelines for any four-quarter period ending after December 31, 2016.
We anticipate our offering and operating fees and expenses will include, among other things, the advisory fee that we pay to our advisor, the selling commissions, dealer manager and distribution fees we pay to the dealer manager, legal and audit expenses, federal and state filing fees, printing expenses, transfer agent fees, marketing and distribution expenses and fees related to appraising and managing our properties. We will not have any office or personnel expenses as we do not have any employees. Our advisor will incur certain of these expenses and fees, for which we may reimburse our advisor, subject to certain limitations. Additionally, our advisor may allocate to us out-of-pocket expenses in connection with providing services to us, including our allocable share of our advisor’s overhead, such as rent, utilities and personnel costs for personnel who are directly involved in the performance of services to us and are not our executive officers. Furthermore, our former dealer manager incurred certain bona fide offering expenses in connection with the distribution of our shares for which our former dealer manager was fully repaid in July 2016. Ultimately, total organization and offering costs incurred in a given offering will not exceed 15% of the gross proceeds from such offering. During our initial offering, our advisor paid on our behalf or reimbursed us for $8,589,137 in organization and offering costs and $5,229,181 in operating expenses. The total organization and offering costs paid by our advisor and the former dealer manager did not cause us to exceed the 15% limitation as of September 30, 2018 with respect to the initial offering. If, in future periods, the total organization and offering costs paid by our advisor and the dealer manager cause us to exceed the 15% limitation with respect to the initial offering, the excess would not be reflected on our consolidated balance sheet as of the end of such period. A similar limitation will apply to the total organization and offering costs incurred with respect to the follow-on offering. In such event, we may become obligated to reimburse all or a portion of this excess as we raise additional proceeds from our follow-on offering.
Other potential future sources of capital include secured or unsecured financings from banks or other lenders and proceeds from the sale of assets. If necessary, we may use financings or other sources of capital in the event of unforeseen significant capital expenditures.
Cash Flow Analysis
Cash flow provided by operating activities during the nine months ended September 30, 2018 and 2017 was $4,310,802 and $2,857,601, respectively. The increase in cash flow from operating activities for the nine months ended September 30, 2018 compared to the nine months ended September 30, 2017 is primarily due to lower deferred leasing cost payments in the 2018 period versus the 2017 period. In the 2017 period, we paid $1,600,000 in tenant improvement costs to Dick's Sporting Goods, Inc. that were treated under GAAP as a tenant inducement requiring such payment to be classified as an operating cash flow instead of an investing cash flow. For the nine months ended September 30, 2018, deferred leasing costs of $346,169 were paid, $342,600 of which was paid in connection with an early renewal of the Allstate lease in our Heritage Parkway property. Additionally, in the 2018 period, we received a $742,000 payment for buyout of a portion of the Gateway One Lending and Finance lease at Anaheim Hills Office Plaza, which was mostly offset by the payment of the 2017 performance component of the
49
advisory fee to our advisor. The operating cash flow increases were further offset by decreases due to higher debt service costs as a result of a higher LIBOR rates on our line of credit. Cash interest expense was approximately $321,000 greater for the nine months ended September 30, 2018 than the nine months ended September 30, 2017.
Cash flow used in investing activities during the nine months ended September 30, 2018 and 2017 was $26,344,469 and $1,284,099, respectively. During 2018, we acquired the Miami Industrial Properties for $20,842,319 less prorations of $223,689 (see Portfolio Information - Real Estate Property Portfolio, above), and invested an additional $5,300,000 into our real estate securities portfolio.
Cash flow provided by financing activities was $23,113,276 for the nine months ended September 30, 2018. We received proceeds of $30,376,055 in our offerings and paid $2,976,153 in offering costs. Cash distributions to stockholders paid during the nine months ended September 30, 2018 were $4,502,138. Of the total distributions declared for the nine months ended September 30, 2018, $2,014,795 was reinvested via our distribution reinvestment plan. Additionally, we processed redemptions during the nine months ended September 30, 2018 that resulted in payments by us of $5,516,876, after deductions for any applicable 2% short-term trading discounts. We also borrowed $19,900,000 from our Wells Fargo line of credit to acquire the Miami Industrial Properties, and we made net repayments of $15,500,000 against our outstanding balance on the Wells Fargo line of credit. Lastly, we amended and restated the Wells Fargo line of credit and added Miami Industrial Properties to the Wells Fargo line of credit, and in relation thereto paid $682,407 in financing costs.
For the nine months ended September 30, 2017, cash flow used in financing activities was $626,858. We received proceeds of $10,353,815 in our offering, and paid $2,305,716 in offering costs. Cash distributions to stockholders paid during the nine months ended September 30, 2017 were $3,862,541. Of the total distributions declared for the nine months ended September 30, 2017, $1,638,756 was reinvested via our distribution reinvestment plan. Additionally, we processed redemptions during the nine months ended September 30, 2017 that resulted in payments by us of $5,751,172, after deductions for any applicable 2% short term trading discounts. Lastly, we had net repayments of $700,000 of our outstanding balance on the Wells Fargo line of credit.
Distributions
Our board of directors authorized and declared daily cash distributions for each quarter which were payable monthly for each share of Class A, Class I and Class T common stock outstanding. Shown below are details of the distributions:
Three Months Ended | Nine Months Ended September 30, 2018 | ||||||||||||||
March 31, 2018 | June 30, 2018 | September 30, 2018 | |||||||||||||
Distributions: | |||||||||||||||
Declared daily distribution rate, before adjustment for class-specific fees | $ | 0.00189004 | $ | 0.00190140 | $ | 0.00192261 | |||||||||
Distributions paid or payable in cash | $ | 780,511 | $ | 831,391 | $ | 928,395 | $ | 2,540,297 | |||||||
Distributions reinvested | 619,468 | 661,799 | 733,528 | 2,014,795 | |||||||||||
Distributions declared | $ | 1,399,979 | $ | 1,493,190 | $ | 1,661,923 | $ | 4,555,092 | |||||||
Net Cash Provided by Operating Activities: | $ | 1,319,630 | $ | 1,029,724 | $ | 1,961,448 | $ | 4,310,802 | |||||||
Funds From Operations(1): | $ | 731,871 | 2,221,991 | $ | 1,540,468 | $ | 4,494,330 | ||||||||
(1) See below for the impact of adopting ASU 2016-01 on FFO.
50
For the three months ended March 31, 2018, we had one lease in a free rent period and relatively more tenants paid their rent early in the fourth quarter of 2017, both of which negatively impacted cash flow from operations for the three months ended March 31, 2018. For the three months ended June 30, 2018, we paid $342,600 in lease commissions related to an early renewal of the Allstate lease at Heritage Parkway, which negatively impacted cash flow from operations for the three months ended June 30, 2018. As a result, for the nine months ended September 30, 2018, our distributions were covered 94.6% by cash flow from operations and 5.4% by offering proceeds. We expect that we will continue to pay distributions monthly in arrears. Any distributions not reinvested will be payable in cash, and there can be no assurances regarding the portion of the distributions that will be reinvested. We intend to fund distributions from cash generated by operations. However, we may fund distributions from borrowings under our line of credit, from the proceeds of our offering or any other source.
As discussed above under "Funds from Operations and Modified Funds from Operations," we adopted ASU 2016-01 effective January 1, 2018 which impacted our FFO by including within FFO, as defined by NAREIT, the net unrealized gain or loss on our investments in marketable securities. For each of the three month periods ended March 31, 2018, June 30, 2018 and September 30, 2018, the net unrealized (loss) gain on our investments in marketable securities was ($500,518), $981,763 and ($201,223), respectively. Without this net unrealized (loss) gain, our FFO for each of the three month periods ended March 31, 2018, June 30, 2018 and September 30, 2018 would have been $1,232,389, $1,240,228 and $1,741,691, respectively, which we refer to as FFO as adjusted, and which is presented above under "Funds from Operations and Modified Funds from Operations" for the three and nine months ended September 30, 2018.
The payment of distributions from sources other than cash flow from operations or FFO may be dilutive to our NAV per share because it may reduce the amount of proceeds available for investment and operations or cause us to incur additional interest expense as a result of borrowed funds.
Redemptions
For details on our redemptions, please see Note 9 to our consolidated financial statements contained within this Form 10-Q.
Critical Accounting Policies
Our accounting policies have been established to conform with GAAP. The preparation of financial statements in conformity with GAAP requires management to use judgment in the application of accounting policies, including making estimates and assumptions. These judgments affect the reported amounts of assets and liabilities and disclosure of contingent assets and liabilities at the dates of the financial statements and the reported amounts of revenue and expenses during the reporting periods. If management’s judgment or interpretation of the facts and circumstances relating to various transactions had been different, it is possible that different accounting policies would have been applied, thus resulting in a different presentation of the financial statements. Additionally, other companies may utilize different estimates that may impact the comparability of our results of operations to those of companies in similar businesses. We consider our critical accounting policies to be the policies that relate to the following concepts:
•Real Estate Investments and Lease Intangibles
•Investments in Marketable Securities
•Revenue Recognition
•Organization and Offering Expenses
A complete description of such policies and our considerations is contained in Note 2 ("Summary of Significant Accounting Policies") to our consolidated financial statements included in our Annual Report on Form 10-K for the year ended December 31, 2017, as supplemented by the most recent quarterly report on Form 10-Q. For the nine months ended September 30, 2018, certain of our critical accounting policies were updated pursuant to adoption of certain Accounting Standards Updates, as further described in Note 2, Summary of Significant Accounting Policies, to this quarterly report on Form 10-Q.
51
Certain Accounting Pronouncements Effective in the Future
We refer you to Note 2, Summary of Significant Accounting Policies, in our consolidated financial statements for a discussion of the potential impact on us from certain accounting pronouncements that become effective in the future.
REIT Compliance and Income Taxes
We elected to be taxed as a REIT under Sections 856 through 860 of the Internal Revenue Code beginning with the year ended December 31, 2013, and we believe that we have operated in such a manner to continue to be taxed as a REIT for federal income tax purposes. In order to maintain our qualification as a REIT, we are required to, among other things, distribute as dividends at least 90% of our REIT taxable income, determined without regard to the dividends-paid deduction and excluding net capital gains, to our stockholders and meet certain tests regarding the nature of our income and assets. If we qualify for taxation as a REIT, we generally will not be subject to federal income tax to the extent our income meets certain criteria and we distribute our REIT taxable income to our stockholders. Even if we qualify for taxation as a REIT, we may be subject to (1) certain state and local taxes on our income, property or net worth and (2) federal income and excise taxes on undistributed income, if any income remains undistributed. Many of these requirements are highly technical and complex. We will monitor the business and transactions that may potentially impact our REIT status. If we were to fail to meet these requirements, we could be subject to federal income tax on our taxable income at regular corporate rates. We would not be able to deduct distributions paid to stockholders in any year in which we fail to qualify as a REIT. We will also be disqualified for the four taxable years following the year during which qualification was lost unless we are entitled to relief under specific statutory provisions.
Off Balance Sheet Arrangements
As of September 30, 2018, we had no material off-balance sheet arrangements that had or are reasonably likely to have a current or future effect on our financial condition, results of operations, liquidity or capital resources.
ITEM 3. QUANTITATIVE AND QUALITATIVE DISCLOSURES ABOUT MARKET RISK
In connection with our line of credit, which has a variable interest rate, we are subject to market risk associated with changes in LIBOR. As of September 30, 2018, we had $67,500,000 outstanding under our Wells Fargo line of credit bearing interest at approximately 3.8%, representing approximately a 46.2% loan-to-cost ratio. At this balance, a change in the interest rate of 0.50% would result in a change in our interest expense of $337,500 per annum. In the future, we may be exposed to additional market risk associated with interest rate changes as a result of additional short-term debt, such as additional borrowings under our line of credit, and long-term debt, which, in either case, may be used to maintain liquidity, fund capital expenditures and expand our investment portfolio. Market fluctuations in real estate financing may affect the availability and cost of funds needed to expand our investment portfolio. In addition, restrictions upon the availability of real estate financing or high interest rates for real estate loans could adversely affect our ability to dispose of real estate in the future. We will seek to limit the impact of interest rate changes on earnings and cash flows and to lower our overall borrowing costs. We intend to manage market risk associated with our variable-rate financing by assessing our interest rate cash flow risk through continually identifying and monitoring changes in interest rate exposures that may adversely impact expected future cash flows and by evaluating hedging opportunities. We may use derivative financial instruments to hedge exposures to changes in interest rates on loans secured by our assets.
We may be exposed to credit risk, which is the risk that the counterparty will fail to perform under the terms of the derivative contract. If the fair value of a derivative contract is positive, the counterparty will owe us, which creates credit risk for us. If the fair value of a derivative contract is negative, we will owe the counterparty and, therefore, do not have credit risk. We will seek to minimize the credit risk in derivative instruments by entering into transactions with high-quality counterparties. We are not currently a party to any such derivative contracts.
52
We will be exposed to financial market risk with respect to our marketable securities portfolio. Financial market risk is the risk that we will incur economic losses due to adverse changes in equity security prices. Our exposure to changes in equity security prices is a result of our investment in these types of securities. Market prices are subject to fluctuation and, therefore, the amount realized in the subsequent sale of an investment may significantly differ from the reported market value. Fluctuation in the market prices of a security may result from any number of factors, including perceived changes in the underlying fundamental characteristics of the issuer, the relative price of alternative investments, interest rates, default rates and general market conditions. In addition, amounts realized in the sale of a particular security may be affected by the relative quantity of the security being sold. We do not currently engage in derivative or other hedging transactions to manage our security price risk. As of September 30, 2018, we owned marketable securities with a value of $15,697,601. While it is difficult to project what factors may affect the prices of equity securities and how much the effect might be, a 10% change in the value of the marketable securities we owned as of September 30, 2018 would result in a change of $1,569,760 to the unrealized gain on marketable securities.
ITEM 4. CONTROLS AND PROCEDURES
Evaluation of Disclosure Controls and Procedures
As required by Rules 13a-15(b) and 15d-15(b) of the Exchange Act, we, under the supervision and with the participation of our chief executive officer and chief financial officer, carried out an evaluation of the effectiveness of our disclosure controls and procedures (as defined in Rules 13a-15(e) and 15d-15(e) of the Exchange Act) as of the end of the period covered by this Quarterly Report on Form 10-Q. Based on that evaluation, our chief executive officer and chief financial officer concluded that our disclosure controls and procedures, as of September 30, 2018, were effective to ensure that information required to be disclosed by us in this Quarterly Report is recorded, processed, summarized and reported within the time periods specified by the rules and forms promulgated under the Exchange Act and is accumulated and communicated to management, including our chief executive officer and chief financial officer, as appropriate to allow timely decisions regarding required disclosures.
Internal Control over Financial Reporting
No change occurred in our internal control over financial reporting (as defined in Rules 13a-15(f) and 15d -15(f) of the Exchange Act) during the three months ended September 30, 2018 that has materially affected, or is reasonably likely to materially affect, our internal control over financial reporting.
53
PART II
OTHER INFORMATION
ITEM 1. LEGAL PROCEEDINGS
As of September 30, 2018, there were no material pending legal proceedings.
ITEM 1A. RISK FACTORS
We refer you to the risk factors contained in Part I, Item 1A of our Annual Report on Form 10-K for the year ended December 31, 2017, filed with the SEC on March 7, 2018, and in Part II, Item 1A of our Quarterly Report on Form 10-Q for the quarter ended June 30, 2018, filed with the SEC on August 13, 2018. Since those filings, there have been no material changes to our risk factors.
ITEM 2. UNREGISTERED SALES OF EQUITY SECURITIES AND USE OF PROCEEDS
Unregistered Sales of Equity Securities
During the period covered by this Quarterly Report, we did not sell any equity securities that were not registered under the Securities Act.
Share Redemption Plan
On November 27, 2012 we adopted a share redemption plan whereby on a daily basis stockholders may request that we repurchase all or a portion of their shares of common stock. The redemption price per share is equal to our NAV per share of the class of shares being redeemed on the date of redemption. The total amount of redemptions in any calendar quarter will be limited to shares whose aggregate value (based on the redemption price per share on the date of the redemption) is equal to 5% of our combined NAV for all classes of shares as of the last day of the previous calendar quarter. In addition, if redemptions do not reach the 5% limit in a calendar quarter, the unused portion generally will be carried over to the next quarter and not any subsequent quarter, except that the maximum amount of redemptions during any quarter may never exceed 10% of the combined NAV for all classes of shares as of the last day of the previous calendar quarter. While there is no minimum holding period, shares redeemed within 365 days of an investor's initial date of purchase will be redeemed at our NAV per share of the class of shares being redeemed on the date of redemption, less a short-term trading discount equal to 2% of the gross proceeds otherwise payable with respect to the redemption. Our board of directors has the discretion to suspend or modify the share redemption plan at any time.
The following tables set forth information regarding our redemption of shares of our common stock during the three months ended September 30, 2018. The weighted average redemption prices are shown before allowing for any applicable 2% short-term trading discounts.
Three Months Ended September 30, 2018 | Shares | Weighted Average Share Price | |||||
Class A | 95,496 | $ | 13.98 | ||||
Class I | 44,865 | 14.08 | |||||
Class T | — | — | |||||
We funded these redemptions with cash flow from operations, proceeds from our offerings or borrowings on our line of credit.
The following table sets forth information regarding redemptions of shares of our common stock during the three months ended September 30, 2018. As of September 30, 2018, we had no unfulfilled redemption requests.
54
Period | Total Number of Shares Redeemed | Average Price Paid per Share | Total Number of Shares Purchased as Part of Publicly Announced Plans or Programs | Maximum Number of Shares that May Yet Be Purchased Pursuant to the Program (1) | ||||
July 1 - July 31, 2018 | 6,936 | $13.99 | 6,936 | (1) | ||||
August 1 - August 31, 2018 | 11,273 | $13.98 | 11,273 | (1) | ||||
September 1 - September 30, 2018 | 122,152 | $14.02 | 122,152 | (1) | ||||
(1) Redemptions are limited as described above. | ||||||||
ITEM 3. DEFAULTS UPON SENIOR SECURITIES
Not applicable.
ITEM 4. MINE SAFETY DISCLOSURES
Not applicable.
ITEM 5. OTHER INFORMATION
We previously entered into that certain Amended and Restated Advisory Agreement dated as of January 20, 2016 (the “Advisory Agreement”) with RREEF Property Operating Partnership, LP, our operating partnership, and RREEF America L.L.C., our affiliated external advisor. On November 8, 2018, our board of directors approved the renewal of the Advisory Agreement effective as of January 20, 2019 for an additional one-year term expiring January 20, 2020. The terms of the Advisory Agreement otherwise remain unchanged.
ITEM 6. EXHIBITS
Exhibit No. | Description | |
31.1* | ||
31.2* | ||
32.1* | ||
101.INS | XBRL Instance Document | |
101.SCH | XBRL Taxonomy Extension Schema Document | |
101.CAL | XBRL Taxonomy Extension Calculation Linkbase Document | |
101.DEF | XBRL Taxonomy Extension Definition Linkbase Document | |
101.LAB | XBRL Taxonomy Extension Label Linkbase Document | |
101.PRE | XBRL Taxonomy Extension Presentation Linkbase Document | |
* | Filed herewith |
55
SIGNATURES
Pursuant to the requirements of the Securities Exchange Act of 1934, as amended, the registrant has duly caused this report to be signed on its behalf by the undersigned thereunto duly authorized.
RREEF Property Trust, Inc. | |
By: | /s/ W. Todd Henderson |
Name: | W. Todd Henderson |
Title: | Chief Executive Officer (Principal Executive Officer) |
By: | /s/ Eric M. Russell |
Name: | Eric M. Russell |
Title: | Chief Financial Officer (Principal Financial and Accounting Officer) |
Date: November 13, 2018
56