Attached files
| file | filename |
|---|---|
| EX-99.1 - EX-99.1 - HollyFrontier Corp | d653151dex991.htm |
| EX-2.1 - EX-2.1 - HollyFrontier Corp | d653151dex21.htm |
| 8-K - FORM 8-K - HollyFrontier Corp | d653151d8k.htm |
Exhibit 99.2
Disclosure Statement 2 Statements made during the course of this presentation that are not historical facts are “forward looking statements” within the meaning of the U.S. Private Securities Litigation Reform Act of 1995. Forward-looking statements are inherently uncertain and necessarily involve risks that may affect the business prospects and performance of HollyFrontier Corporation, and actual results may differ materially from those discussed during the presentation. Such risks and uncertainties include but are not limited to HollyFrontier Corporation’s failure to successfully close the transactions with Sonneborn, or, once closed, integrate the operation of Sonneborn with HollyFrontier Corporation’s existing operations, failure to receive required governmental approvals to close the Sonneborn acquisition, the actions of actual or potential competitive suppliers and transporters of refined petroleum or lubricant products in HollyFrontier’s and Sonneborn’s markets, the demand for and supply of crude oil, refined products and lubricant products, the spread between market prices for refined products and market prices for crude oil, the possibility of constraints on the transportation of refined products, the possibility of inefficiencies, curtailments or shutdowns in refinery operations or pipelines, effects of governmental regulations and policies, the availability and cost of financing to HollyFrontier, the effectiveness of HollyFrontier’s capital investments and marketing strategies, HollyFrontier's efficiency in carrying out construction projects, the ability of HollyFrontier to acquire refined product operations or pipeline and terminal operations on acceptable terms and to integrate any future acquired operations, the possibility of terrorist attacks and the consequences of any such attacks, general economic conditions, and other financial, operational and legal risks and uncertainties detailed from time to time in HollyFrontier's SEC filings. All forward-looking statements included in this presentation are expressly qualified in their entirety by the foregoing cautionary statements. The forward-looking statements speak only as of the date hereof and, other than as required by law, HollyFrontier undertakes no obligation to publicly update or revise any forward-looking statements, whether as a result of new information, future events or otherwise. Our pending acquisition of Sonneborn may not be consummated. The Sonneborn acquisition is subject to closing conditions and regulatory approvals. If these conditions are not satisfied or waived, the Sonneborn acquisition will not be consummated. If the closing of the Sonneborn acquisition is substantially delayed or does not occur at all, or if the terms of the Sonneborn acquisition are required to be modified substantially due to regulatory concerns, we may not realize the anticipated benefits of the Sonneborn acquisition fully or at all. Certain of the conditions to be satisfied include the absence of a law or order prohibiting the transactions contemplated by the equity purchase agreement, termination or expiration of any applicable waiting periods under the Hart-Scott Rodino Act, as amended and authorizations under the applicable competition laws of Germany and the United Kingdom.
Sonneborn Transaction Overview Financial Details $655mm purchase price $583mm purchase price net of approximately $72mm in working capital Purchase expected to be funded entirely with cash on hand Immediately accretive to earnings and cash flow per share Expect to capture ~$20mm in annual synergies Expect to generate ~$85mm of annual EBITDA, including synergies Transaction expected to close in 2019 7x EBITDA multiple net of working capital and synergies GD
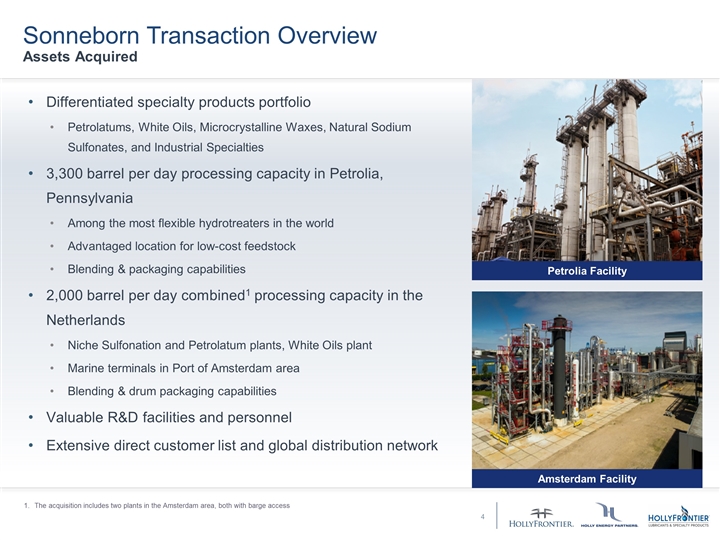
Sonneborn Transaction Overview Assets Acquired Differentiated specialty products portfolio Petrolatums, White Oils, Microcrystalline Waxes, Natural Sodium Sulfonates, and Industrial Specialties 3,300 barrel per day processing capacity in Petrolia, Pennsylvania Among the most flexible hydrotreaters in the world Advantaged location for low-cost feedstock Blending & packaging capabilities 2,000 barrel per day combined1 processing capacity in the Netherlands Niche Sulfonation and Petrolatum plants, White Oils plant Marine terminals in Port of Amsterdam area Blending & drum packaging capabilities Valuable R&D facilities and personnel Extensive direct customer list and global distribution network Petrolia Facility Amsterdam Facility The acquisition includes two plants in the Amsterdam area, both with barge access GD
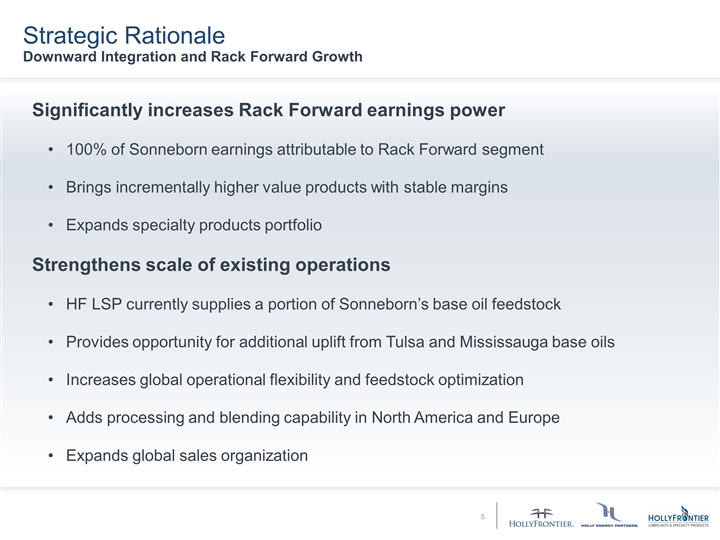
Strategic Rationale Downward Integration and Rack Forward Growth 5 Significantly increases Rack Forward earnings power 100% of Sonneborn earnings attributable to Rack Forward segment Brings incrementally higher value products with stable margins Expands specialty products portfolio Strengthens scale of existing operations HF LSP currently supplies a portion of Sonneborn’s base oil feedstock Provides opportunity for additional uplift from Tulsa and Mississauga base oils Increases global operational flexibility and feedstock optimization Adds processing and blending capability in North America and Europe Expands global sales organization GD
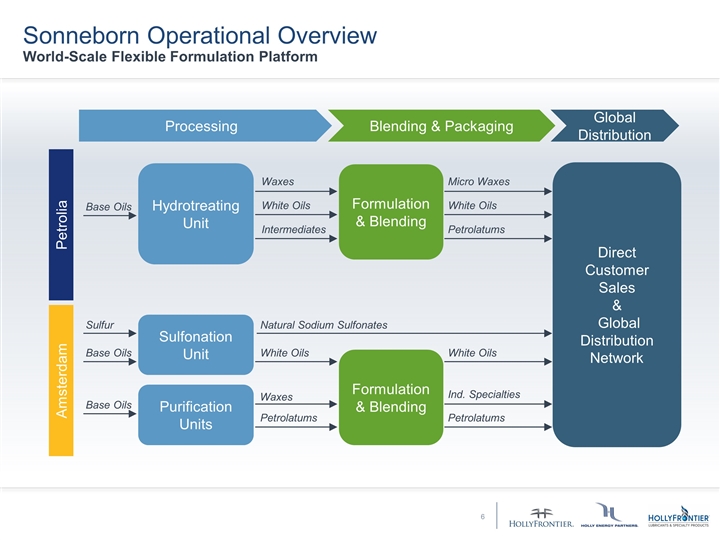
Sonneborn Operational Overview World-Scale Flexible Formulation Platform Petrolia Amsterdam Processing Blending & Packaging Global Distribution Hydrotreating Unit Sulfonation Unit Purification Units Base Oils Sulfur Formulation & Blending Direct Customer Sales & Global Distribution Network Natural Sodium Sulfonates White Oils Waxes Petrolatums Ind. Specialties White Oils Waxes White Oils Intermediates Micro Waxes White Oils Petrolatums Petrolatums Base Oils Base Oils Formulation & Blending MP
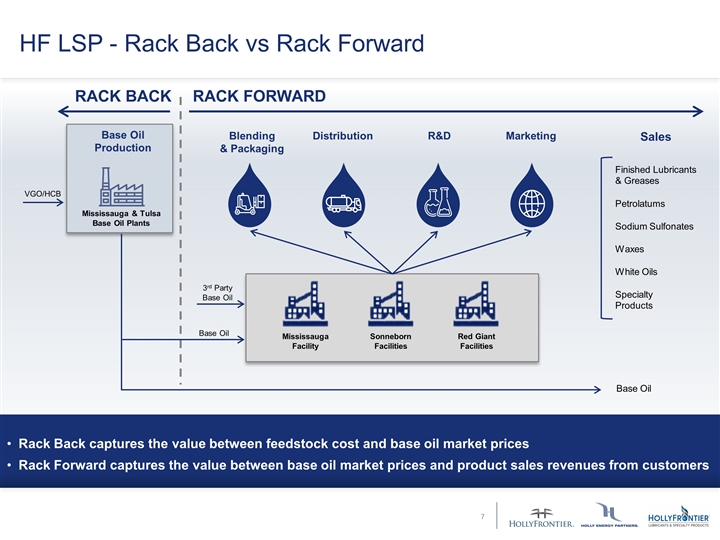
Mississauga & Tulsa Base Oil Plants Base Oil Production Blending & Packaging RACK BACK Marketing Distribution R&D RACK FORWARD VGO/HCB HF LSP - Rack Back vs Rack Forward Base Oil White Oils Specialty Products Waxes Finished Lubricants & Greases Rack Back captures the value between feedstock cost and base oil market prices Rack Forward captures the value between base oil market prices and product sales revenues from customers Sales Base Oil Petrolatums Sodium Sulfonates 3rd Party Base Oil Red Giant Facilities Sonneborn Facilities Mississauga Facility RV
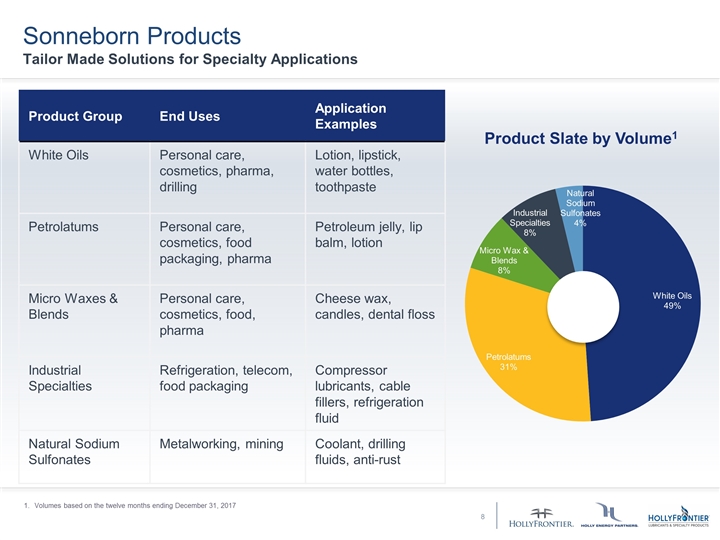
Product Slate by Volume1 Sonneborn Products Tailor Made Solutions for Specialty Applications 8 Product Group End Uses Application Examples White Oils Personal care, cosmetics, pharma, drilling Lotion, lipstick, water bottles, toothpaste Petrolatums Personal care, cosmetics, food packaging, pharma Petroleum jelly, lip balm, lotion Micro Waxes & Blends Personal care, cosmetics, food, pharma Cheese wax, candles, dental floss Industrial Specialties Refrigeration, telecom, food packaging Compressor lubricants, cable fillers, refrigeration fluid Natural Sodium Sulfonates Metalworking, mining Coolant, drilling fluids, anti-rust Volumes based on the twelve months ending December 31, 2017 MP
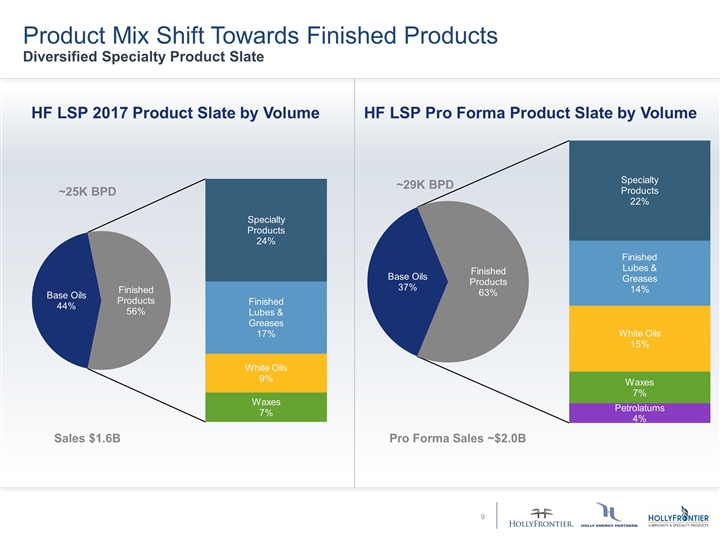
Product Mix Shift Towards Finished Products Diversified Specialty Product Slate HF LSP 2017 Product Slate by Volume HF LSP Pro Forma Product Slate by Volume ~25K BPD ~29K BPD MP 9 Sales $1.6B Pro Forma Sales ~$2.0B
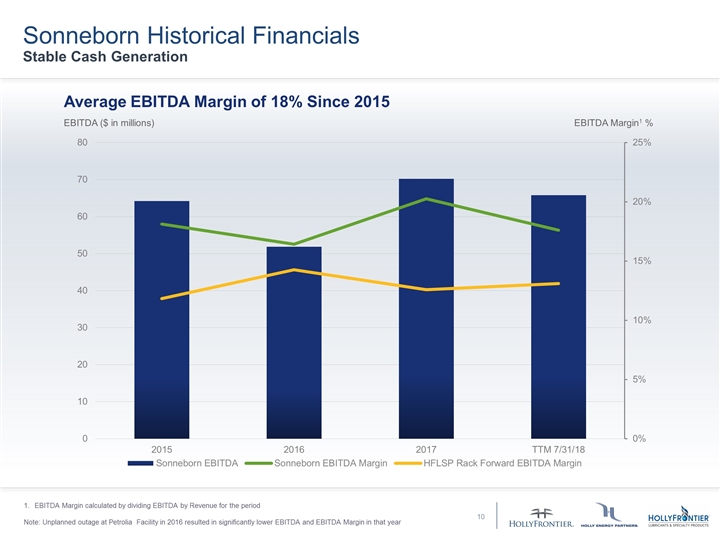
Sonneborn Historical Financials Stable Cash Generation EBITDA Margin calculated by dividing EBITDA by Revenue for the period Note: Unplanned outage at Petrolia Facility in 2016 resulted in significantly lower EBITDA and EBITDA Margin in that year EBITDA Margin1 % EBITDA ($ in millions) Average EBITDA Margin of 18% Since 2015 RV
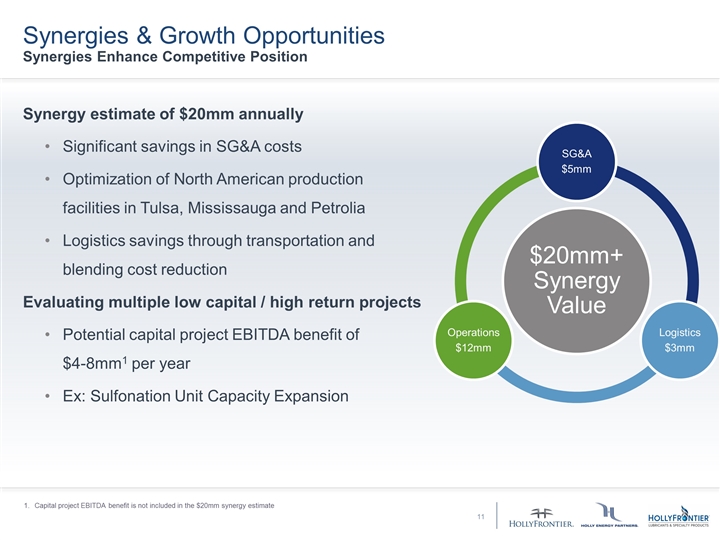
Synergies & Growth Opportunities Synergies Enhance Competitive Position Synergy estimate of $20mm annually Significant savings in SG&A costs Optimization of North American production facilities in Tulsa, Mississauga and Petrolia Logistics savings through transportation and blending cost reduction Evaluating multiple low capital / high return projects Potential capital project EBITDA benefit of $4-8mm1 per year Ex: Sulfonation Unit Capacity Expansion Capital project EBITDA benefit is not included in the $20mm synergy estimate RV $20mm + Synergy Value SG&A $5mm Logistics $3mm Operations $12mm
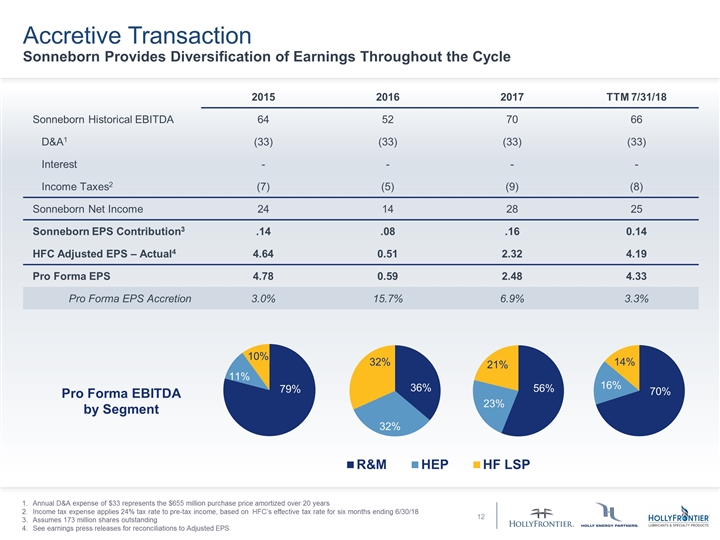
12 Accretive Transaction Sonneborn Provides Diversification of Earnings Throughout the Cycle 2015 2016 2017 TTM 7/31/18 Sonneborn Historical EBITDA 64 52 70 66 D&A1 (33) (33) (33) (33) Interest - - - - Income Taxes2 (7) (5) (9) (8) Sonneborn Net Income 24 14 28 25 Sonneborn EPS Contribution3 .14 .08 .16 0.14 HFC Adjusted EPS – Actual4 4.64 0.51 2.32 4.19 Pro Forma EPS 4.78 0.59 2.48 4.33 Pro Forma EPS Accretion 3.0% 15.7% 6.9% 3.3% Annual D&A expense of $33 represents the $655 million purchase price amortized over 20 years Income tax expense applies 24% tax rate to pre-tax income, based on HFC’s effective tax rate for six months ending 6/30/18 Assumes 173 million shares outstanding See earnings press releases for reconciliations to Adjusted EPS RV Pro Forma EBITDA by Segment
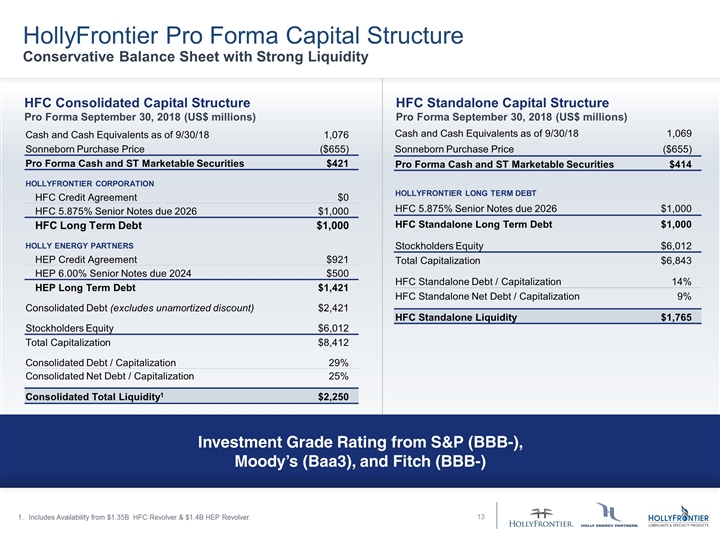
Investment Grade Rating from S&P (BBB-), Moody’s (Baa3), and Fitch (BBB-) Cash and Cash Equivalents as of 9/30/18 1,076 Sonneborn Purchase Price ($655) Pro Forma Cash and ST Marketable Securities $421 HOLLYFRONTIER CORPORATION HFC Credit Agreement $0 HFC 5.875% Senior Notes due 2026 $1,000 HFC Long Term Debt $1,000 HOLLY ENERGY PARTNERS HEP Credit Agreement $921 HEP 6.00% Senior Notes due 2024 $500 HEP Long Term Debt $1,421 Consolidated Debt (excludes unamortized discount) $2,421 Stockholders Equity $6,012 Total Capitalization $8,412 Consolidated Debt / Capitalization 29% Consolidated Net Debt / Capitalization 25% Consolidated Total Liquidity1 $2,250 HFC Consolidated Capital Structure Pro Forma September 30, 2018 (US$ millions) Cash and Cash Equivalents as of 9/30/18 1,069 Sonneborn Purchase Price ($655) Pro Forma Cash and ST Marketable Securities $414 HOLLYFRONTIER LONG TERM DEBT HFC 5.875% Senior Notes due 2026 $1,000 HFC Standalone Long Term Debt $1,000 Stockholders Equity $6,012 Total Capitalization $6,843 HFC Standalone Debt / Capitalization 14% HFC Standalone Net Debt / Capitalization 9% HFC Standalone Liquidity $1,765 HFC Standalone Capital Structure Pro Forma September 30, 2018 (US$ millions) Includes Availability from $1.35B HFC Revolver & $1.4B HEP Revolver. HollyFrontier Pro Forma Capital Structure Conservative Balance Sheet with Strong Liquidity RV
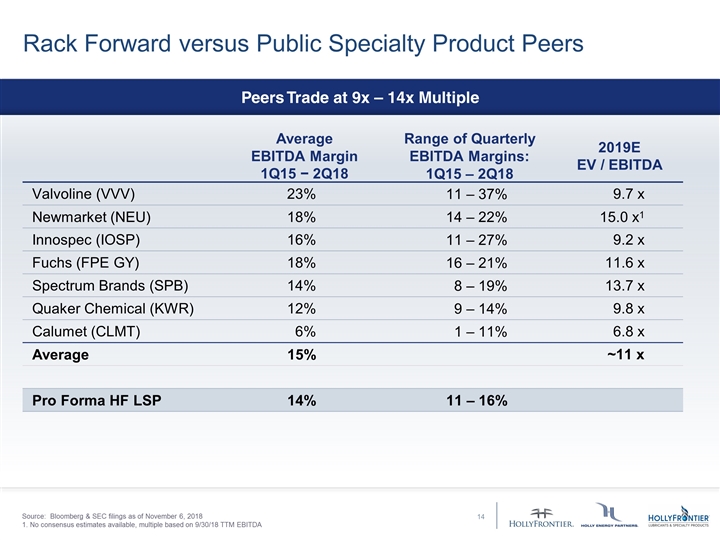
Rack Forward versus Public Specialty Product Peers Average EBITDA Margin 1Q15 − 2Q18 Range of Quarterly EBITDA Margins: 1Q15 – 2Q18 2019E EV / EBITDA Valvoline (VVV) 23% 11 – 37% 9.7 x Newmarket (NEU) 18% 14 – 22% 15.0 x1 Innospec (IOSP) 16% 11 – 27% 9.2 x Fuchs (FPE GY) 18% 16 – 21% 11.6 x Spectrum Brands (SPB) 14% 8 – 19% 13.7 x Quaker Chemical (KWR) 12% 9 – 14% 9.8 x Calumet (CLMT) 6% 1 – 11% 6.8 x Average 15% ~11 x Pro Forma HF LSP 14% 11 – 16% Source: Bloomberg & SEC filings as of November 6, 2018 1. No consensus estimates available, multiple based on 9/30/18 TTM EBITDA Peers Trade at 9x – 14x Multiple RV
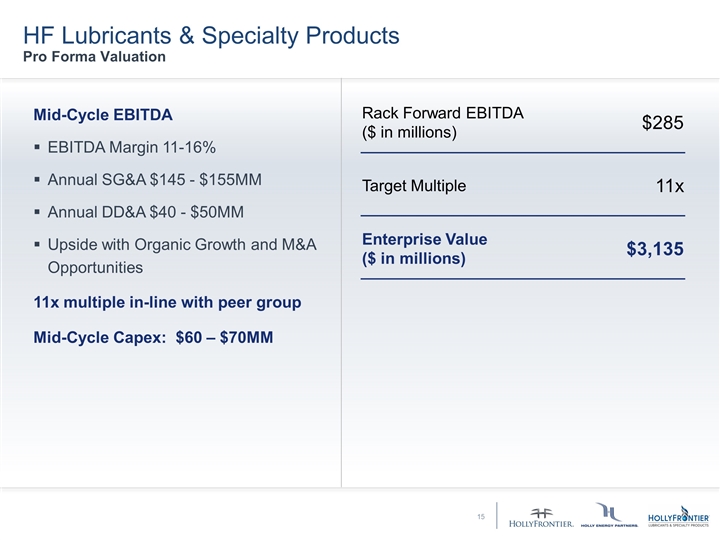
Rack Forward EBITDA ($ in millions) $285 Target Multiple 11x Enterprise Value ($ in millions) $3,135 Mid-Cycle EBITDA EBITDA Margin 11-16% Annual SG&A $145 - $155MM Annual DD&A $40 - $50MM Upside with Organic Growth and M&A Opportunities 11x multiple in-line with peer group Mid-Cycle Capex: $60 – $70MM RV HF Lubricants & Specialty Products Pro Forma Valuation
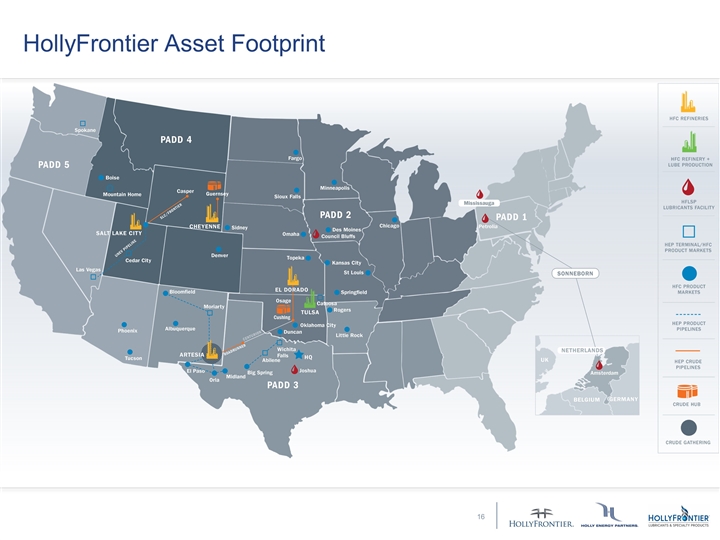
HollyFrontier Asset Footprint GD
Definitions Lubricant : A solvent neutral paraffinic product used in commercial heavy duty engine oils, passenger car oils and specialty products for industrial applications such as heat transfer, metalworking, rubber and other general process oil. Non GAAP measurements: We report certain financial measures that are not prescribed or authorized by U. S. generally accepted accounting principles ("GAAP"). We discuss management's reasons for reporting these non-GAAP measures above. Although management evaluates and presents these non-GAAP measures for the reasons described above, please be aware that these non-GAAP measures are not alternatives to revenue, operating income, income from continuing operations, net income, or any other comparable operating measure prescribed by GAAP. In addition, these non-GAAP financial measures may be calculated and/or presented differently than measures with the same or similar names that are reported by other companies, and as a result, the non-GAAP measures we report may not be comparable to those reported by others. Rack Backward: business segment of HF LSP that captures the value between feedstock cost and base oil market prices (transfer prices to rack forward). Rack Forward: business segment of HF LSP that captures the value between base oil market prices and product sales revenue from customers. BPD: the number of barrels per calendar day of crude oil or petroleum products. Debt-To-Capital: A measurement of a company's financial leverage, calculated as the company's long term debt divided by its total capital. Debt includes all long-term obligations. Total capital includes the company's debt and shareholders' equity. EBITDA: Earnings before interest, taxes, depreciation and amortization, which we refer to as EBITDA, is calculated as net income plus (i) interest expense net of interest income, (ii) income tax provision, and (iii) depreciation, depletion and amortization. EBITDA is not a calculation provided for under GAAP; however, the amounts included in the EBITDA calculation are derived from amounts included in our consolidated financial statements. EBITDA should not be considered as an alternative to net income or operating income as an indication of our operating performance or as an alternative to operating cash flow as a measure of liquidity. EBITDA is not necessarily comparable to similarly titled measures of other companies. EBITDA is presented here because it is a widely used financial indicator used by investors and analysts to measure performance. EBITDA is also used by our management for internal analysis and as a basis for financial covenants. Our historical EBITDA is reconciled to net income under the section entitled “Reconciliation to Amounts Reported Under Generally Accepted Accounting Principles” in HollyFrontier Corporation’s 2017 10-K filed February 21, 2018. Expected EBITDA: is based on HollyFrontier Corporation’s projections for the newly acquired Sonneborn. Projections are based on historical EBITDA performance as reported by Sonneborn combined with the expectation of future potential synergy and optimization opportunites. We cannot provide a reconciliation of estimated EBITDA to estimated GAAP net income, which is the GAAP financial measure most directly comparable to estimated EBITDA, without unreasonable efforts due to the inherent difficulty and impracticality of quantifying certain amounts that would be required to calculate projected GAAP net income, such as non-recurring items, foreign currency gains/losses, other non-cash adjustments and corporate expenses not allocated to business segments, such as taxes and financing costs. These amounts that would require unreasonable effort to quantify could be significant, such that the amount of projected GAAP net income would vary substantially from the amount of projected EBITDA. Free Cash Flow: Calculated by taking operating cash flow and subtracting capital expenditures.
HollyFrontier Corporation (NYSE: HFC) 2828 N. Harwood, Suite 1300 Dallas, Texas 75201 (214) 954-6510 www.hollyfrontier.com Craig Biery | Director, Investor Relations investors@hollyfrontier.com 214-954-6510 Jared Harding | Investor Relations investors@hollyfrontier.com 214-954-6510
