Attached files
| file | filename |
|---|---|
| 8-K - 8-K - COMSCORE, INC. | form8-kinvestorday2018.htm |

Comscore Investor Day 2018: Financial Overview November 13, 2018

Cautionary Note • This presentation contains forward-looking statements within the meaning of the Private Securities Litigation Reform Act of 1995. Forward- looking statements are those which are not historical facts and include, without limitation, comments about our expectations, forecasts, plans and opinions, including with respect to financial and operational performance. These and other statements that relate to future results and events are based on our expectations as of today, November 13, 2018. Our actual results in future periods may differ materially from those currently expected because of a number of risks and uncertainties. These risks and uncertainties include those described in our most recent 10-K and 10-Q filings, which you can find on ir.comscore.com or www.sec.gov. Please review these documents for a more complete understanding of these risks and uncertainties. • Investors are cautioned not to place undue reliance on forward-looking statements, which speak only as of the date they are made. We disclaim any duty or obligation to update or revise any forward-looking statements, whether as a result of new information, future events or otherwise, except as may be required by law. • This presentation contains information regarding adjusted EBITDA, adjusted EBITDA margin, and non-GAAP operating expense, which are non-GAAP financial measures used by our management to understand and evaluate our core operating performance and trends. We believe that these non-GAAP measures provide useful information to investors and others in understanding and evaluating our operating results, as they permit investors to view our core business performance using the same metrics that management uses. • Our use of these non-GAAP measures has limitations as an analytical tool, and investors should not consider these measures in isolation or as a substitute for analysis of our results as reported under GAAP. Instead, you should consider these measures alongside GAAP- based financial performance measures, net income (loss), various cash flow metrics, and our other GAAP financial results. See the appendix to this presentation for additional information regarding our use of non-GAAP financial measures. 2

Financial Highlights Significant Growth Opportunities • New revenue unlocked from Cross-Platform and Advanced TV • National TV syndicated revenue scales with currency gains • Momentum and measurable market expansion in Local TV Highly Recurring Revenue Model • Significant annual revenue is typically locked down by January 1 • Revenue is highly recurring and provides enhanced visibility Long-Term Relationships with Blue Chip Customers • Major content providers and buy-side agencies use Comscore products with significant opportunity to expand the breadth and depth of those relationships • Revenue from enterprise customers should continue to grow as share of wallet increases Continued Progress to Optimize Cost Structure • Cost of Sales: Modest increase expected from new data sources (mobile, smart TV, etc.) • Operating Expenses: • $20M of operating cost reductions expected in 2018 • Ongoing progress to establish efficient cost structure that will support growth while increasing operating leverage • Ongoing reductions in professional fees and Travel and Expense due to increased discipline over these expenditures • Continuing to rationalize global office space footprint which should result in lower costs 3

Financial Forecast Metric 2019 2019-2021 Revenue • Mid single digit growth • CAGR 8-12% Gross Margin • Slightly improved over 2018 • Expand by 200 to 400 basis points • Revenue growth exceeds increased cost Non-GAAP Operating Expense* • Flat to 2018 levels • Mid single digit growth Adjusted EBITDA Margin* • Mid single digit, improving throughout the year • Achieve high teens • Operating costs to remain relatively flat • Operating costs to increase modestly • Plan to self-fund product development through • Improvement in technology efficiency increased efficiency and cost initiatives Operating Cash • Neutral for the year, may be impacted by • Significant cash generation interest rate reset and SEC legal costs • Positive in second half of 2019 Capital Expenditures • Approximately $20 million-$30 million annually • Plan driven by more productive technology resources (internally capitalized costs) Tax Benefits • Significant net operating loss carryforwards • Cash taxes expected to be low over the period *Non-GAAP financial measure 4
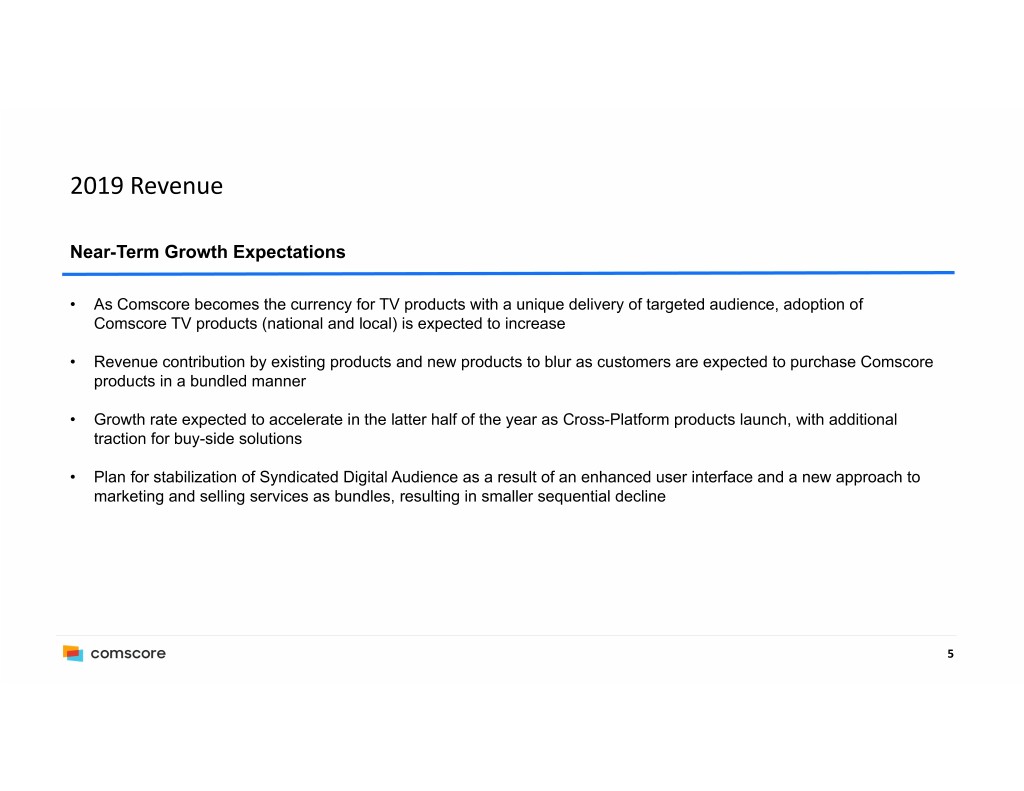
2019 Revenue Near-Term Growth Expectations • As Comscore becomes the currency for TV products with a unique delivery of targeted audience, adoption of Comscore TV products (national and local) is expected to increase • Revenue contribution by existing products and new products to blur as customers are expected to purchase Comscore products in a bundled manner • Growth rate expected to accelerate in the latter half of the year as Cross-Platform products launch, with additional traction for buy-side solutions • Plan for stabilization of Syndicated Digital Audience as a result of an enhanced user interface and a new approach to marketing and selling services as bundles, resulting in smaller sequential decline 5

2019 Operating Expenses Disciplined Spending • Full year of headcount reductions in 2018 to be realized in 2019 • Lease rationalization program expected to reduce overall facilities expense; full year of impact to be realized in 2019 at approximately 10% lower than 2018 • Continued discipline over spending on SG&A expected to improve in comparison to 2018 Technology Optimization • Reducing Complexity: Simplifying the architecture, creation of the One Comscore platform, migration to the cloud • Staff Optimization: Moving from a maintenance focus to product development – bringing in best in class engineers and increasing use of automation and outsourcing • Innovative Agility: Increasing Comscore’s ability to innovate and respond to market opportunities Gross Margin • Expected to improve slightly in 2019 with larger improvement annually through 2021 • Improvement primarily driven by increased revenue 6
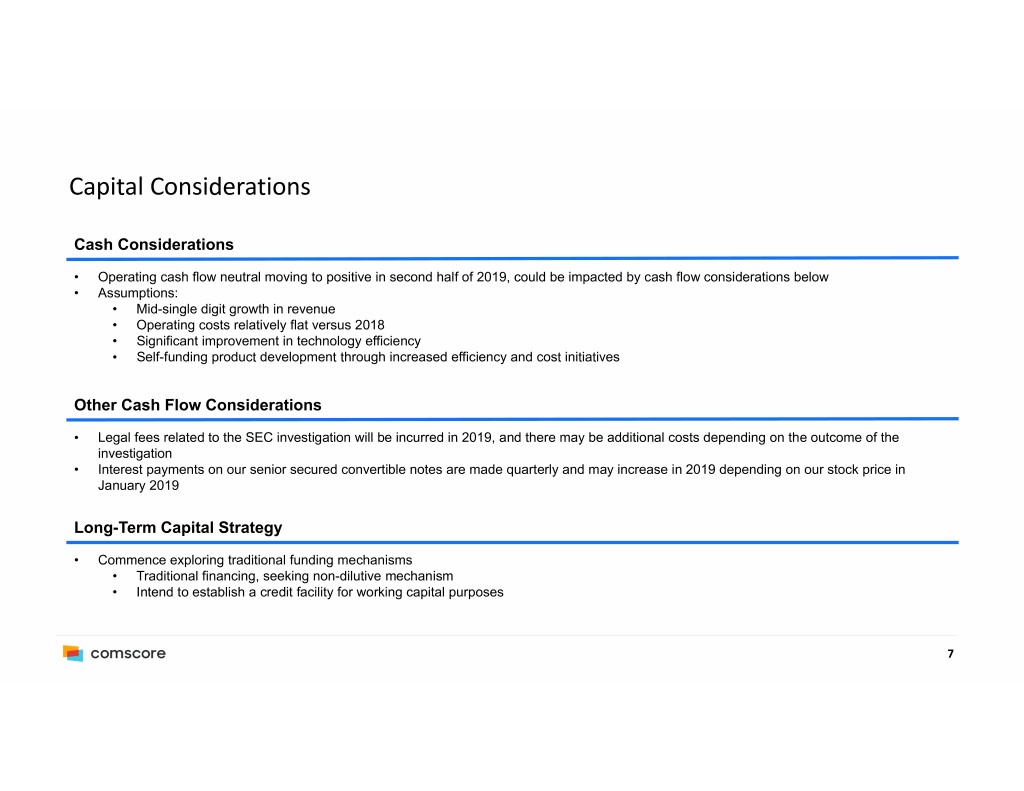
Capital Considerations Cash Considerations • Operating cash flow neutral moving to positive in second half of 2019, could be impacted by cash flow considerations below • Assumptions: • Mid-single digit growth in revenue • Operating costs relatively flat versus 2018 • Significant improvement in technology efficiency • Self-funding product development through increased efficiency and cost initiatives Other Cash Flow Considerations • Legal fees related to the SEC investigation will be incurred in 2019, and there may be additional costs depending on the outcome of the investigation • Interest payments on our senior secured convertible notes are made quarterly and may increase in 2019 depending on our stock price in January 2019 Long-Term Capital Strategy • Commence exploring traditional funding mechanisms • Traditional financing, seeking non-dilutive mechanism • Intend to establish a credit facility for working capital purposes 7
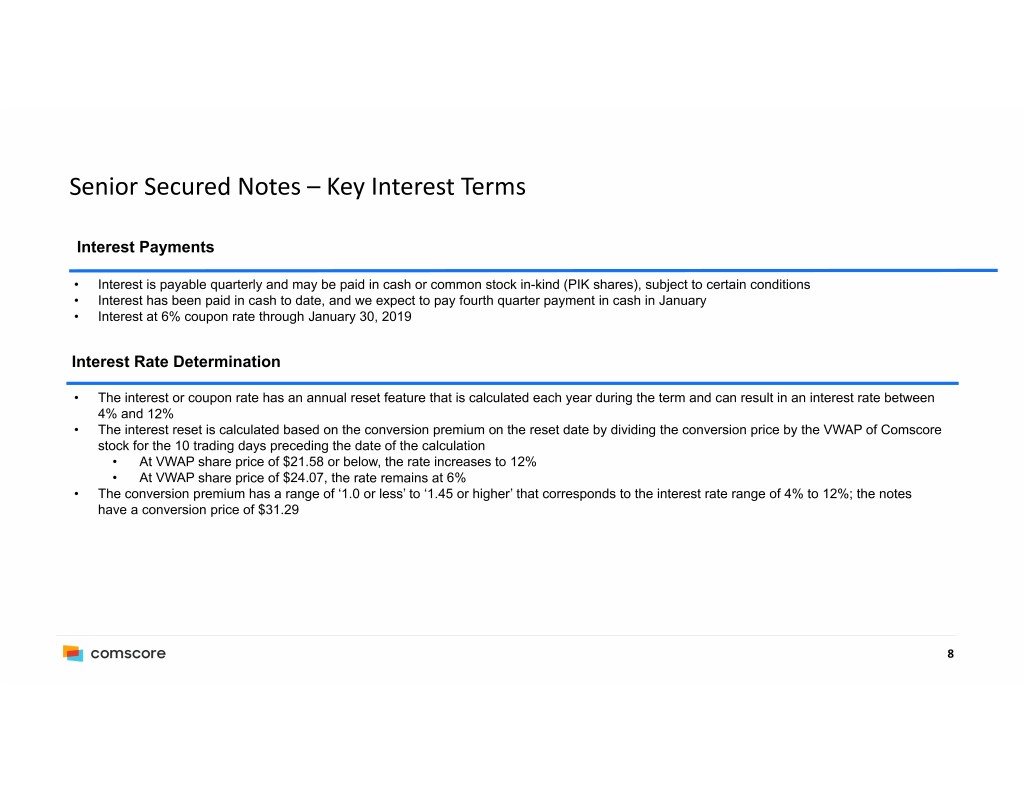
Senior Secured Notes – Key Interest Terms Interest Payments • Interest is payable quarterly and may be paid in cash or common stock in-kind (PIK shares), subject to certain conditions • Interest has been paid in cash to date, and we expect to pay fourth quarter payment in cash in January • Interest at 6% coupon rate through January 30, 2019 Interest Rate Determination • The interest or coupon rate has an annual reset feature that is calculated each year during the term and can result in an interest rate between 4% and 12% • The interest reset is calculated based on the conversion premium on the reset date by dividing the conversion price by the VWAP of Comscore stock for the 10 trading days preceding the date of the calculation • At VWAP share price of $21.58 or below, the rate increases to 12% • At VWAP share price of $24.07, the rate remains at 6% • The conversion premium has a range of ‘1.0 or less’ to ‘1.45 or higher’ that corresponds to the interest rate range of 4% to 12%; the notes have a conversion price of $31.29 8
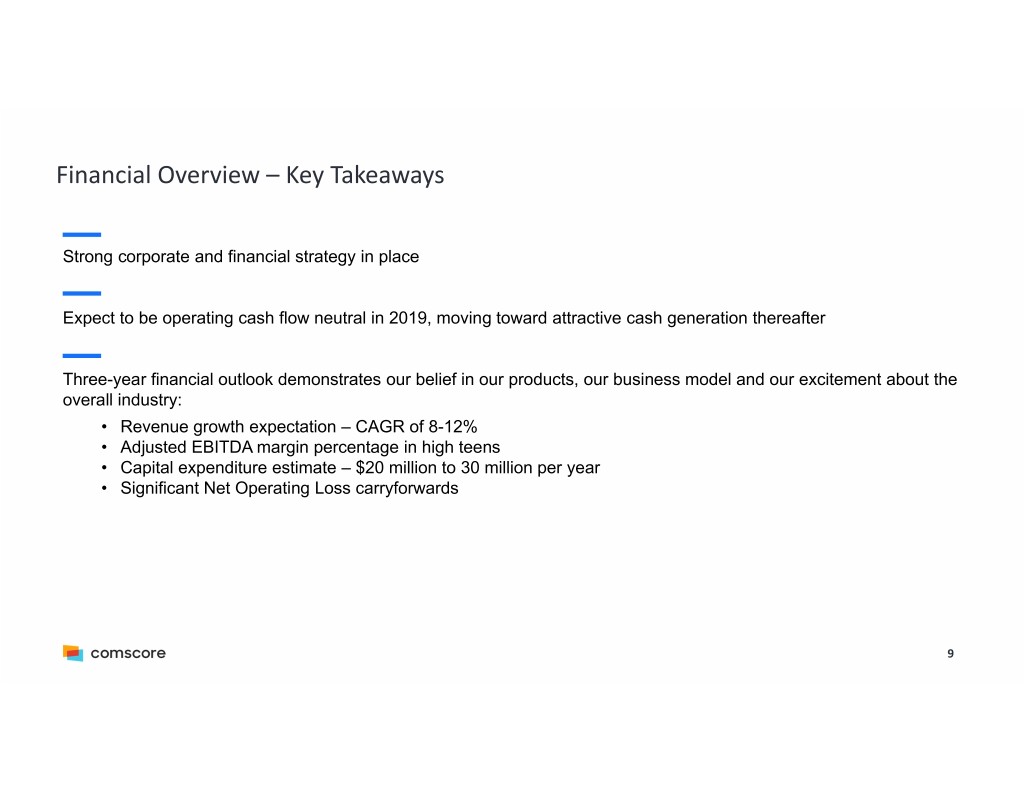
Financial Overview – Key Takeaways Strong corporate and financial strategy in place Expect to be operating cash flow neutral in 2019, moving toward attractive cash generation thereafter Three-year financial outlook demonstrates our belief in our products, our business model and our excitement about the overall industry: • Revenue growth expectation – CAGR of 8-12% • Adjusted EBITDA margin percentage in high teens • Capital expenditure estimate – $20 million to 30 million per year • Significant Net Operating Loss carryforwards 9

Appendix: Non‐GAAP Financial Measures

Adjusted EBITDA and Adjusted EBITDA Margin • EBITDA is defined as GAAP net income (loss) plus or minus interest, taxes, depreciation and amortization of intangible assets. We define adjusted EBITDA as EBITDA plus or minus stock-based compensation expense as well as other items and amounts that we view as not indicative of our core operating performance, specifically: • Charges for matters relating to the Audit Committee investigation described in our 2017 Annual Report on Form 10-K, including litigation and investigation-related costs, costs associated with tax projects, prior-year audits and other professional, consulting or other fees; • Settlement of certain litigation; • Restructuring costs; and • Non-cash changes in the fair value of financing derivatives and investments in equity securities. • We define adjusted EBITDA margin as adjusted EBITDA divided by revenue. • We do not provide GAAP net income (loss) on a forward-looking basis because we are unable to predict with reasonable certainty our future stock-based compensation expense, investigation, audit-related and litigation expense, fair value adjustments for financing derivatives, variable interest expense for outstanding senior secured convertible notes, and any unusual gains and losses without unreasonable effort. These items are uncertain, depend on various factors, and could be material to results computed in accordance with GAAP. For this reason, we are unable without unreasonable effort to provide a reconciliation of adjusted EBITDA to the most directly comparable GAAP financial measure, GAAP net income (loss), on a forward-looking basis. 11
Non‐GAAP Operating Expense • We define non-GAAP operating expense as cost of revenues, selling and marketing, research and development, and general and administrative expense (each as reported on a GAAP basis) plus or minus stock-based compensation expense. • We do not provide GAAP cost of revenues, selling and marketing, research and development, and general and administrative expense on a forward-looking basis because we are unable to predict with reasonable certainty our future stock-based compensation expense without unreasonable effort. Stock-based compensation expense is uncertain, depends on various factors, and could be material to results computed in accordance with GAAP. For this reason, we are unable without unreasonable effort to provide a reconciliation of non-GAAP operating expense to the most directly comparable GAAP financial measure on a forward-looking basis. 12
