Attached files
| file | filename |
|---|---|
| EX-99.1 - EX-99.1 - Williams Industrial Services Group Inc. | ex-99d1.htm |
| 8-K - 8-K - Williams Industrial Services Group Inc. | f8-k.htm |
Exhibit 99.2
| Q3 2018 Financial Results Tracy Pagliara President and CEO Tim Howsman Chief Financial Officer |
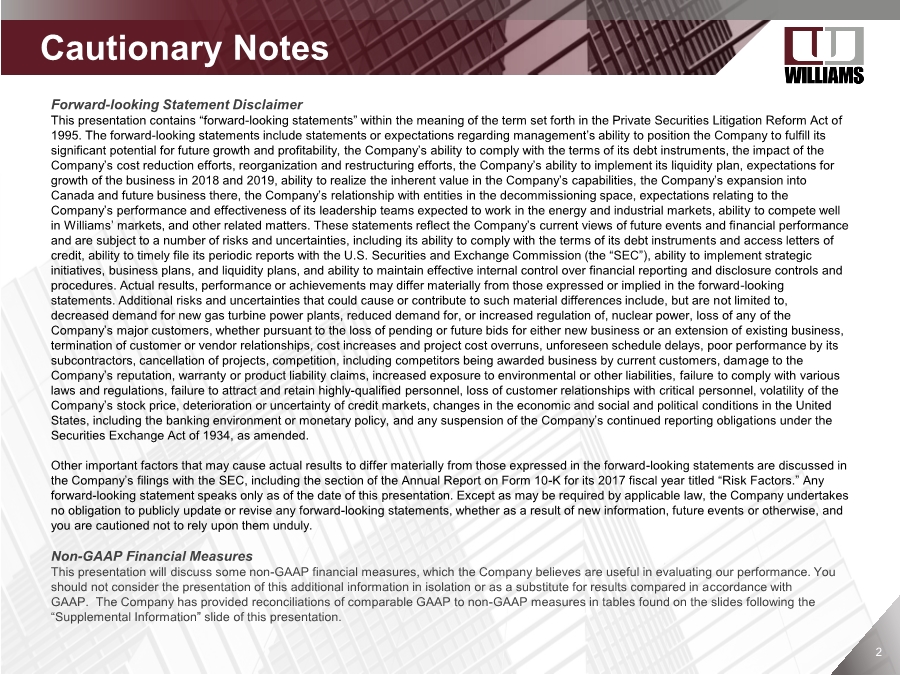
| 2 Forward-looking Statement Disclaimer This presentation contains “forward-looking statements” within the meaning of the term set forth in the Private Securities Litigation Reform Act of 1995. The forward-looking statements include statements or expectations regarding management’s ability to position the Company to fulfill its significant potential for future growth and profitability, the Company’s ability to comply with the terms of its debt instruments, the impact of the Company’s cost reduction efforts, reorganization and restructuring efforts, the Company’s ability to implement its liquidity plan, expectations for growth of the business in 2018 and 2019, ability to realize the inherent value in the Company’s capabilities, the Company’s expansion into Canada and future business there, the Company’s relationship with entities in the decommissioning space, expectations relating to the Company’s performance and effectiveness of its leadership teams expected to work in the energy and industrial markets, ability to compete well in Williams’ markets, and other related matters. These statements reflect the Company’s current views of future events and financial performance and are subject to a number of risks and uncertainties, including its ability to comply with the terms of its debt instruments and access letters of credit, ability to timely file its periodic reports with the U.S. Securities and Exchange Commission (the “SEC”), ability to implement strategic initiatives, business plans, and liquidity plans, and ability to maintain effective internal control over financial reporting and disclosure controls and procedures. Actual results, performance or achievements may differ materially from those expressed or implied in the forward-looking statements. Additional risks and uncertainties that could cause or contribute to such material differences include, but are not limited to, decreased demand for new gas turbine power plants, reduced demand for, or increased regulation of, nuclear power, loss of any of the Company’s major customers, whether pursuant to the loss of pending or future bids for either new business or an extension of existing business, termination of customer or vendor relationships, cost increases and project cost overruns, unforeseen schedule delays, poor performance by its subcontractors, cancellation of projects, competition, including competitors being awarded business by current customers, damage to the Company’s reputation, warranty or product liability claims, increased exposure to environmental or other liabilities, failure to comply with various laws and regulations, failure to attract and retain highly-qualified personnel, loss of customer relationships with critical personnel, volatility of the Company’s stock price, deterioration or uncertainty of credit markets, changes in the economic and social and political conditions in the United States, including the banking environment or monetary policy, and any suspension of the Company’s continued reporting obligations under the Securities Exchange Act of 1934, as amended. Other important factors that may cause actual results to differ materially from those expressed in the forward-looking statements are discussed in the Company’s filings with the SEC, including the section of the Annual Report on Form 10-K for its 2017 fiscal year titled “Risk Factors.” Any forward-looking statement speaks only as of the date of this presentation. Except as may be required by applicable law, the Company undertakes no obligation to publicly update or revise any forward-looking statements, whether as a result of new information, future events or otherwise, and you are cautioned not to rely upon them unduly. Non-GAAP Financial Measures This presentation will discuss some non-GAAP financial measures, which the Company believes are useful in evaluating our performance. You should not consider the presentation of this additional information in isolation or as a substitute for results compared in accordance with GAAP. The Company has provided reconciliations of comparable GAAP to non-GAAP measures in tables found on the slides following the “Supplemental Information” slide of this presentation. Cautionary Notes |
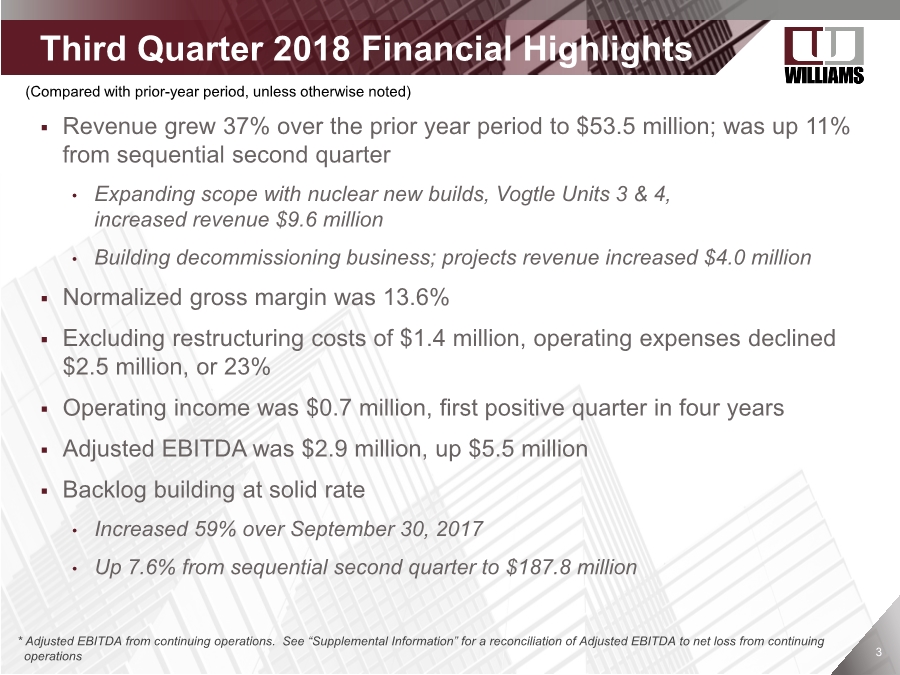
| 3 . Revenue grew 37% over the prior year period to $53.5 million; was up 11% from sequential second quarter • Expanding scope with nuclear new builds, Vogtle Units 3 & 4, increased revenue $9.6 million • Building decommissioning business; projects revenue increased $4.0 million . Normalized gross margin was 13.6% . Excluding restructuring costs of $1.4 million, operating expenses declined $2.5 million, or 23% . Operating income was $0.7 million, first positive quarter in four years . Adjusted EBITDA was $2.9 million, up $5.5 million . Backlog building at solid rate • Increased 59% over September 30, 2017 • Up 7.6% from sequential second quarter to $187.8 million Third Quarter 2018 Financial Highlights (Compared with prior-year period, unless otherwise noted) * Adjusted EBITDA from continuing operations. See “Supplemental Information” for a reconciliation of Adjusted EBITDA to net loss from continuing operations |
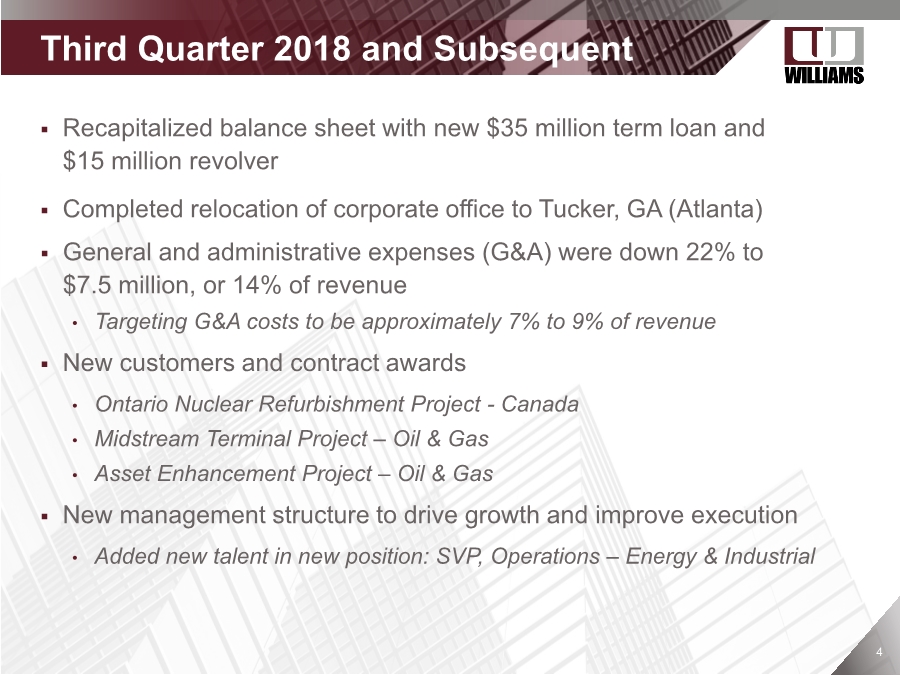
| Company Confidential 44 Third Quarter 2018 and Subsequent Progress . Recapitalized balance sheet with new $35 million term loan and $15 million revolver . Completed relocation of corporate office to Tucker, GA (Atlanta) . General and administrative expenses (G&A) were down 22% to $7.5 million, or 14% of revenue • Targeting G&A costs to be approximately 7% to 9% of revenue . New customers and contract awards • Ontario Nuclear Refurbishment Project - Canada • Midstream Terminal Project – Oil & Gas • Asset Enhancement Project – Oil & Gas . New management structure to drive growth and improve execution • Added new talent in new position: SVP, Operations – Energy & Industrial |
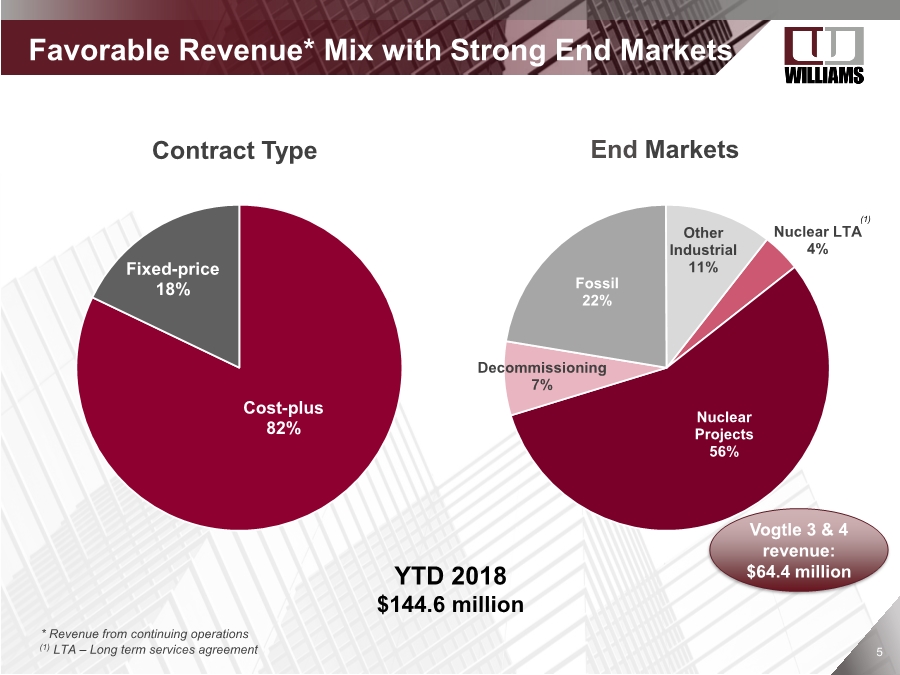
| Company Confidential 55 . Favorable Revenue* Mix with Strong End Markets Cost-plus 82% Fixed-price 18% * Revenue from continuing operations YTD 2018 $144.6 million Nuclear LTA 4% Nuclear Projects 56% Decommissioning 7% Fossil 22% Other Industrial 11% Contract Type End Markets Vogtle 3 & 4 revenue: $64.4 million (1) (1) LTA – Long term services agreement |
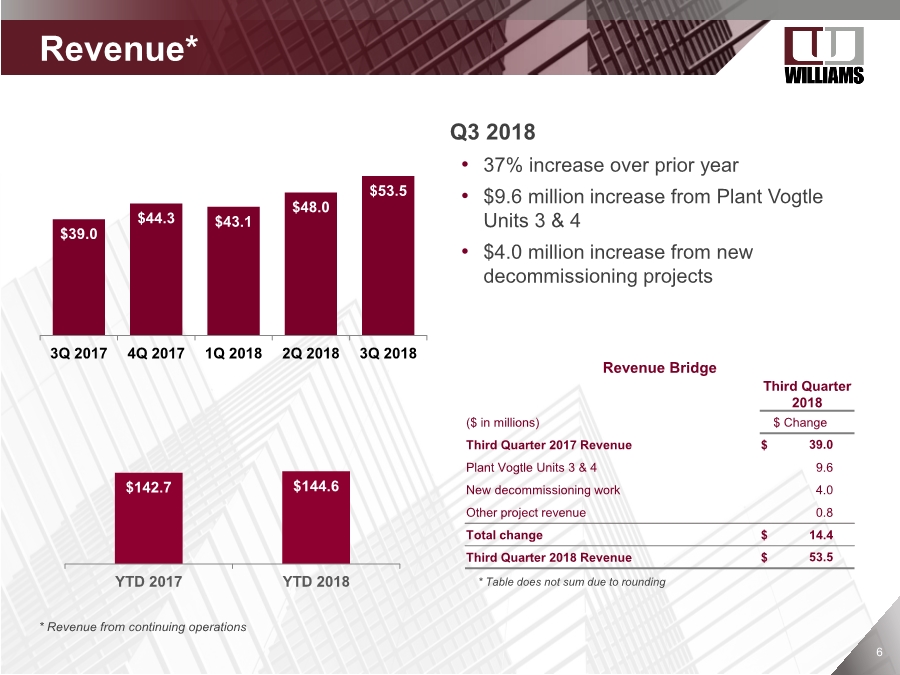
| Company Confidential 66 Q3 2018 • 37% increase over prior year • $9.6 million increase from Plant Vogtle Units 3 & 4 • $4.0 million increase from new decommissioning projects $39.0 $44.3 $43.1 $48.0 $53.5 3Q 2017 4Q 2017 1Q 2018 2Q 2018 3Q 2018 * Revenue from continuing operations Revenue Bridge Third Quarter 2018 ($ in millions) $ Change Third Quarter 2017 Revenue $ 39.0 Plant Vogtle Units 3 & 4 9.6 New decommissioning work 4.0 Other project revenue 0.8 Total change $ 14.4 Third Quarter 2018 Revenue $ 53.5 Revenue* $142.7 $144.6 YTD 2017 YTD 2018 * Table does not sum due to rounding |
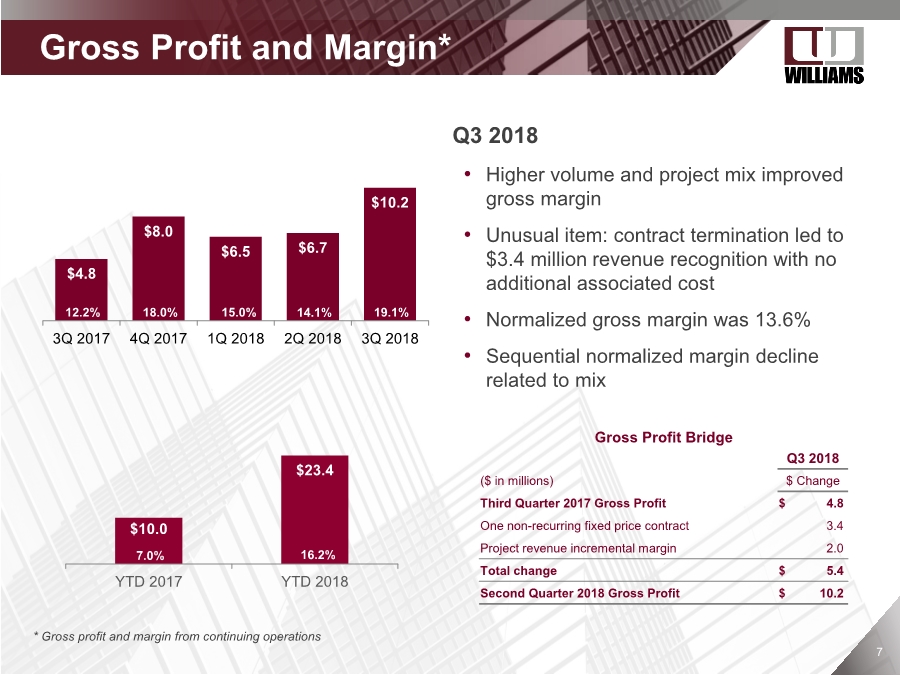
| Company Confidential 77 Gross Profit and Margin* Q3 2018 • Higher volume and project mix improved gross margin • Unusual item: contract termination led to $3.4 million revenue recognition with no additional associated cost • Normalized gross margin was 13.6% • Sequential normalized margin decline related to mix * Gross profit and margin from continuing operations Gross Profit Bridge Q3 2018 ($ in millions) $ Change Third Quarter 2017 Gross Profit $ 4.8 One non-recurring fixed price contract 3.4 Project revenue incremental margin 2.0 Total change $ 5.4 Second Quarter 2018 Gross Profit $ 10.2 $4.8 $8.0 $6.5 $6.7 $10.2 3Q 2017 4Q 2017 1Q 2018 2Q 2018 3Q 2018 15.0% 14.1% 19.1%18.0% $10.0 $23.4 YTD 2017 YTD 2018 7.0% 16.2% 12.2% |
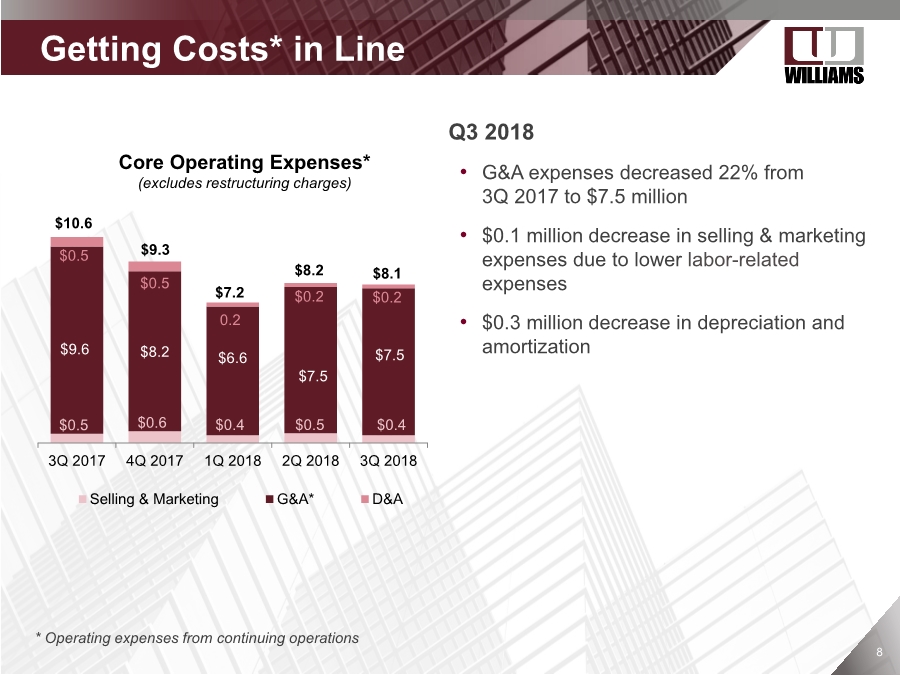
| Company Confidential 88 Getting Costs* in Line Q3 2018 • G&A expenses decreased 22% from 3Q 2017 to $7.5 million • $0.1 million decrease in selling & marketing expenses due to lower labor-related expenses • $0.3 million decrease in depreciation and amortization * Operating expenses from continuing operations $10.6 $9.3 $8.1 $7.2 $8.2 $9.6 $8.2 $6.6 $7.5 $7.5 $0.5 $0.5 0.2 $0.2 $0.2 3Q 2017 4Q 2017 1Q 2018 2Q 2018 3Q 2018 Selling & Marketing G&A* D&A $0.4$0.5 $0.6 $0.4 $0.5 Core Operating Expenses* (excludes restructuring charges) |
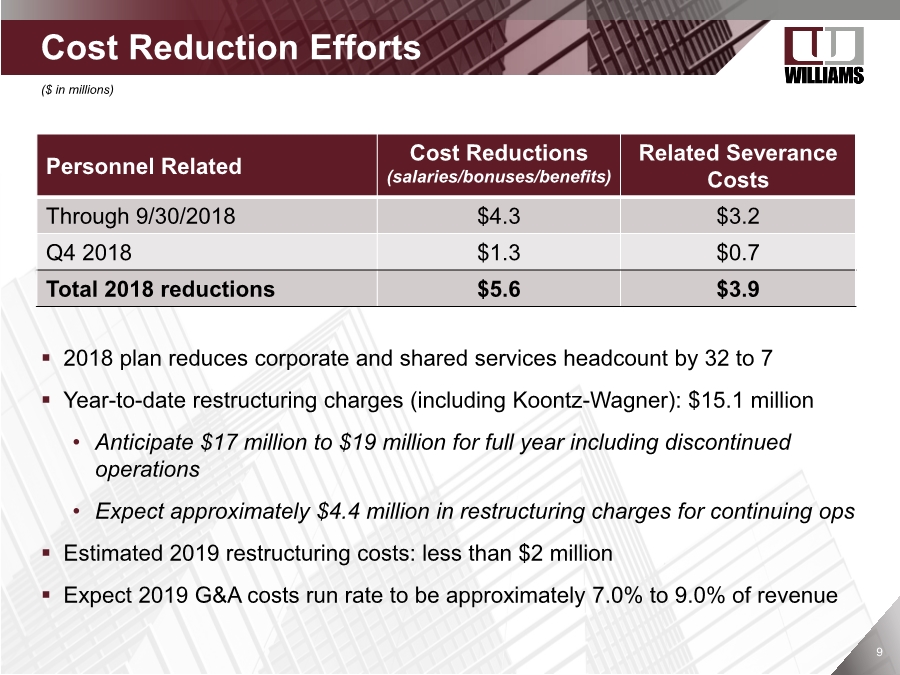
| Company Confidential 99 Personnel Related Cost Reductions (salaries/bonuses/benefits) Related Severance Costs Through 9/30/2018 $4.3 $3.2 Q4 2018 $1.3 $0.7 Total 2018 reductions $5.6 $3.9 . Cost Reduction Efforts ($ in millions) . 2018 plan reduces corporate and shared services headcount by 32 to 7 . Year-to-date restructuring charges (including Koontz-Wagner): $15.1 million • Anticipate $17 million to $19 million for full year including discontinued operations • Expect approximately $4.4 million in restructuring charges for continuing ops . Estimated 2019 restructuring costs: less than $2 million . Expect 2019 G&A costs run rate to be approximately 7.0% to 9.0% of revenue |
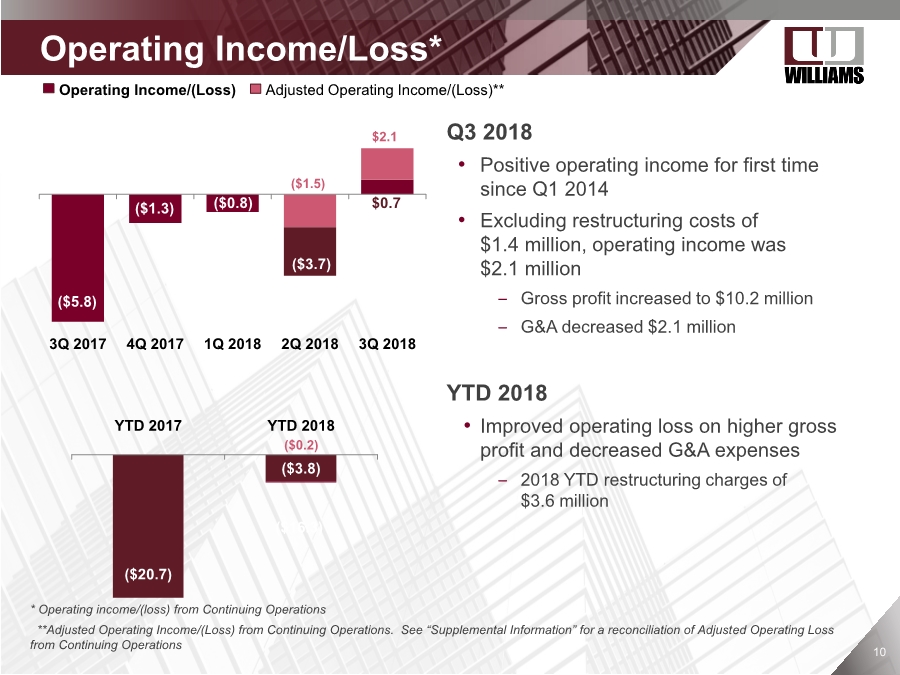
| Company Confidential 1010 Operating Income/Loss* Q3 2018 • Positive operating income for first time since Q1 2014 • Excluding restructuring costs of $1.4 million, operating income was $2.1 million – Gross profit increased to $10.2 million – G&A decreased $2.1 million YTD 2018 • Improved operating loss on higher gross profit and decreased G&A expenses – 2018 YTD restructuring charges of $3.6 million * Operating income/(loss) from Continuing Operations ($20.7) ($3.8) ($16.3) YTD 2017 YTD 2018 ($0.2) ($5.8) ($1.3) 3Q 2017 4Q 2017 1Q 2018 2Q 2018 3Q 2018 $2.1 $0.7($0.8) ($1.5) ($3.7) Operating Income/(Loss) Adjusted Operating Income/(Loss)** **Adjusted Operating Income/(Loss) from Continuing Operations. See “Supplemental Information” for a reconciliation of Adjusted Operating Loss from Continuing Operations |
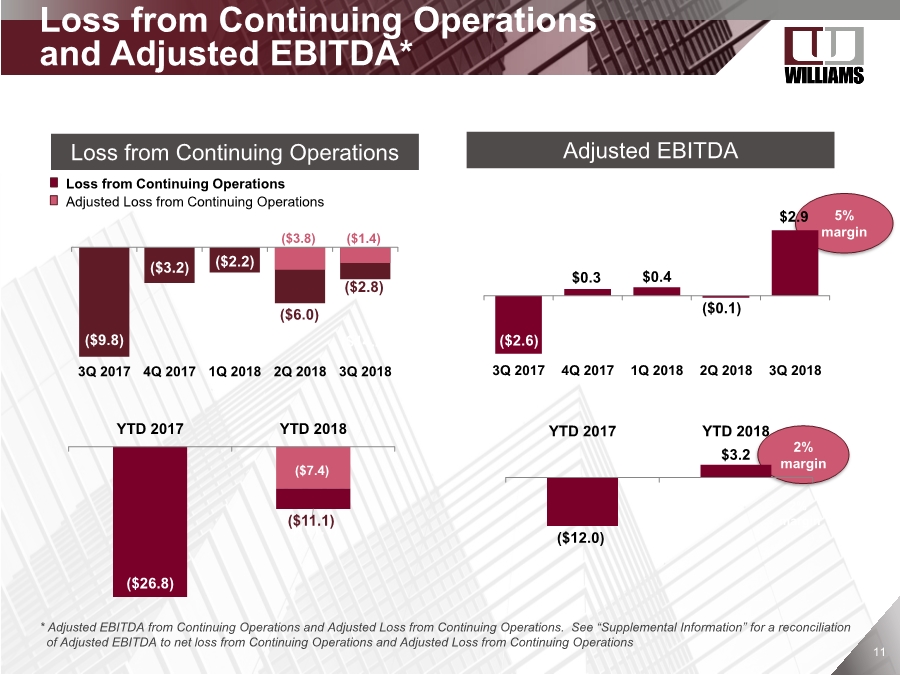
| Company Confidential 1111 5% margin ($2.6) $0.3 $0.4 ($0.1) $2.9 3Q 2017 4Q 2017 1Q 2018 2Q 2018 3Q 2018 2% margin ($9.8) ($3.2) ($2.2) ($6.0) ($2.8) 3Q 2017 4Q 2017 1Q 2018 2Q 2018 3Q 2018 ($14.2) * Adjusted EBITDA from Continuing Operations and Adjusted Loss from Continuing Operations. See “Supplemental Information” for a reconciliation of Adjusted EBITDA to net loss from Continuing Operations and Adjusted Loss from Continuing Operations ($26.8) ($7.4) $(11.1) YTD 2017 YTD 2018 Loss from Continuing Operations Loss from Continuing Operations and Adjusted EBITDA* ($12.0) $3.2 YTD 2017 YTD 2018 Adjusted EBITDA Loss from Continuing Operations Adjusted Loss from Continuing Operations 2% margin ($1.4) ($11.1) ($3.8) |
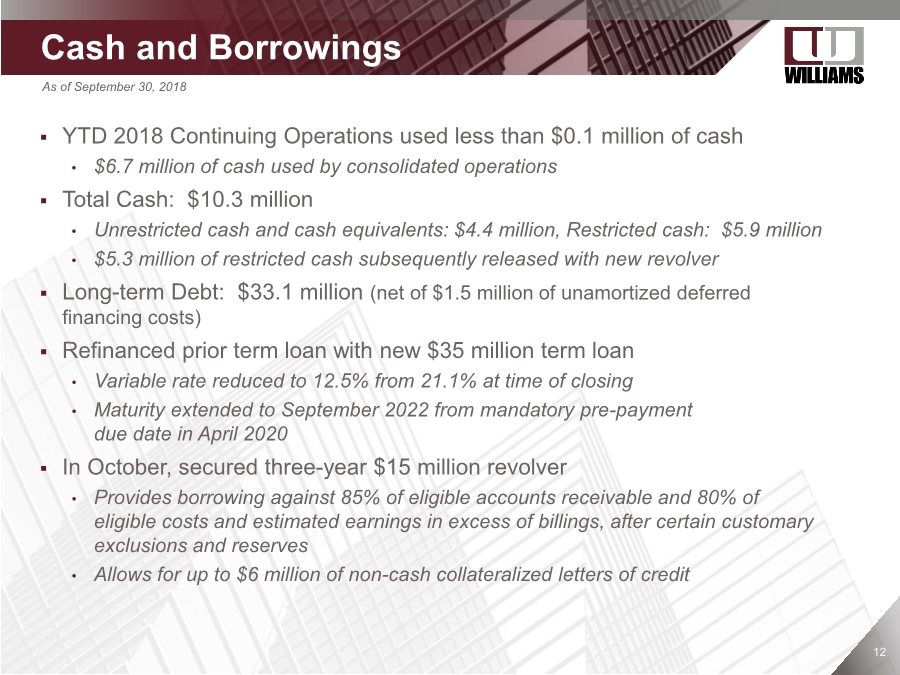
| Company Confidential 1212 . YTD 2018 Continuing Operations used less than $0.1 million of cash • $6.7 million of cash used by consolidated operations . Total Cash: $10.3 million • Unrestricted cash and cash equivalents: $4.4 million, Restricted cash: $5.9 million • $5.3 million of restricted cash subsequently released with new revolver . Long-term Debt: $33.1 million (net of $1.5 million of unamortized deferred financing costs) . Refinanced prior term loan with new $35 million term loan • Variable rate reduced to 12.5% from 21.1% at time of closing • Maturity extended to September 2022 from mandatory pre-payment due date in April 2020 . In October, secured three-year $15 million revolver • Provides borrowing against 85% of eligible accounts receivable and 80% of eligible costs and estimated earnings in excess of billings, after certain customary exclusions and reserves • Allows for up to $6 million of non-cash collateralized letters of credit . Cash and Borrowings As of September 30, 2018 |
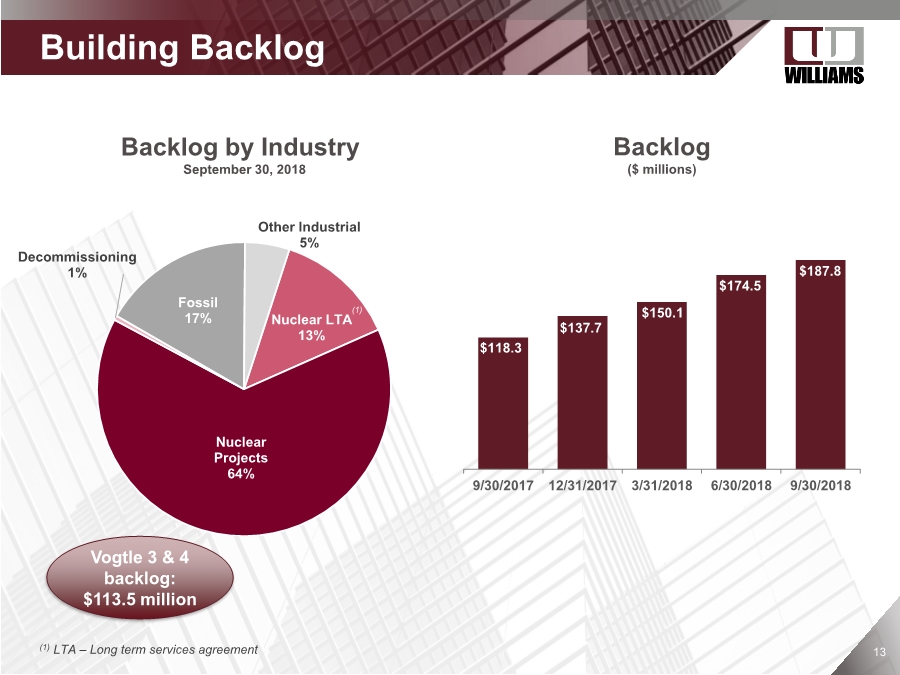
| Company Confidential 1313 $118.3 $137.7 $150.1 $174.5 $187.8 9/30/2017 12/31/2017 3/31/2018 6/30/2018 9/30/2018 . Building Backlog Nuclear LTA 13% Nuclear Projects 64% Decommissioning 1% Fossil 17% Other Industrial 5% Backlog by Industry September 30, 2018 Backlog ($ millions) Vogtle 3 & 4 backlog: $113.5 million (1) LTA – Long term services agreement (1) |
| Company Confidential 1414 Focus on Growth . Grow Core Business Vogtle Units 3 & 4 backlog is strong and continuing to grow GUBMK and TVA Nuclear provide numerous project opportunities Positioning to win new LTAs Expanding Specialty Services business Leveraging analog to digital conversion experience and expertise . Decommissioning Building relationship with Holtec, leader in decommissioning space Twenty U.S. nuclear reactors currently in varying stages of decommissioning . Canada Bruce Power and Ontario Power Generation nuclear facilities refurbishment plans call for ≈$20 billion in facility refurbishments and upgrades over 10 years Awarded initial project . Energy and Industrial Awarded multiple midstream oil and gas projects and expect additional scope Added new executive with deep experience in energy and industrial markets Significant opportunities in wastewater end market |
| Company Confidential Supplemental Information |

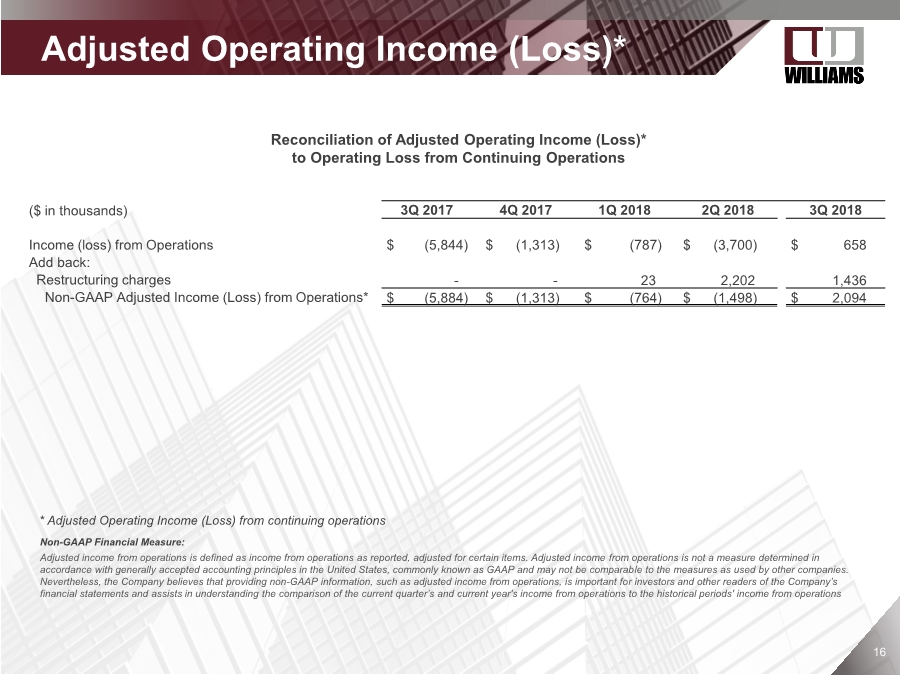
| Company Confidential 1616 Adjusted Operating Income (Loss)* Reconciliation of Adjusted Operating Income (Loss)* to Operating Loss from Continuing Operations ($ in thousands) 3Q 2017 4Q 2017 1Q 2018 2Q 2018 3Q 2018 Income (loss) from Operations $ (5,844) $ (1,313) $ (787) $ (3,700) $ 658 Add back: Restructuring charges -- 23 2,202 1,436 Non-GAAP Adjusted Income (Loss) from Operations* $ (5,884) $ (1,313) $ (764) $ (1,498) $ 2,094 Non-GAAP Financial Measure: Adjusted income from operations is defined as income from operations as reported, adjusted for certain items. Adjusted income from operations is not a measure determined in accordance with generally accepted accounting principles in the United States, commonly known as GAAP and may not be comparable to the measures as used by other companies. Nevertheless, the Company believes that providing non-GAAP information, such as adjusted income from operations, is important for investors and other readers of the Company’s financial statements and assists in understanding the comparison of the current quarter’s and current year's income from operations to the historical periods' income from operations * Adjusted Operating Income (Loss) from continuing operations |
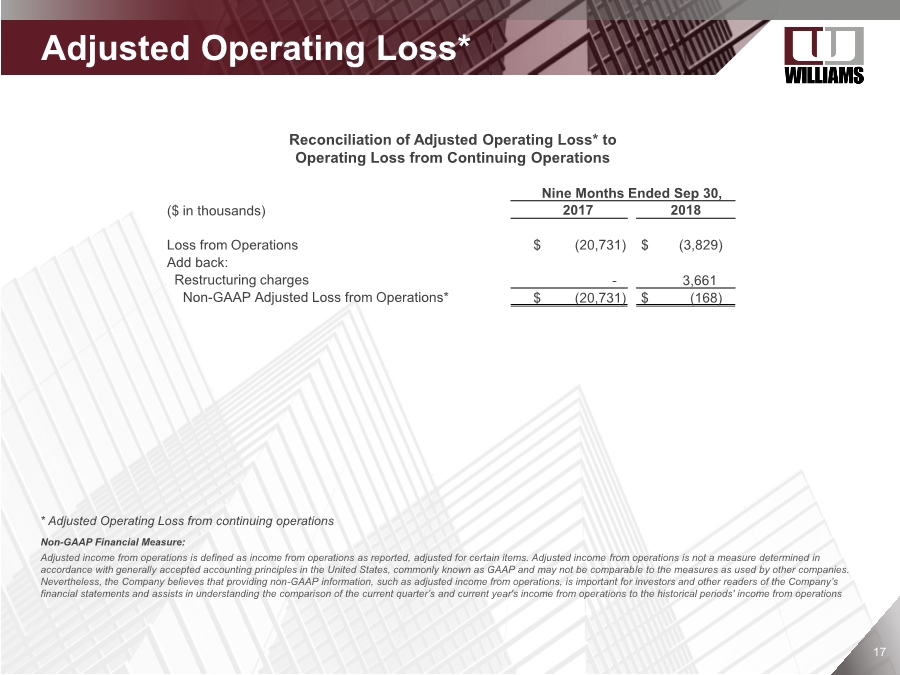
| Company Confidential 1717 Non-GAAP Financial Measure: Adjusted income from operations is defined as income from operations as reported, adjusted for certain items. Adjusted income from operations is not a measure determined in accordance with generally accepted accounting principles in the United States, commonly known as GAAP and may not be comparable to the measures as used by other companies. Nevertheless, the Company believes that providing non-GAAP information, such as adjusted income from operations, is important for investors and other readers of the Company’s financial statements and assists in understanding the comparison of the current quarter’s and current year's income from operations to the historical periods' income from operations Adjusted Operating Loss* Reconciliation of Adjusted Operating Loss* to Operating Loss from Continuing Operations Nine Months Ended Sep 30, ($ in thousands) 2017 2018 Loss from Operations $ (20,731) $ (3,829) Add back: Restructuring charges - 3,661 Non-GAAP Adjusted Loss from Operations* $ (20,731) $ (168) * Adjusted Operating Loss from continuing operations |
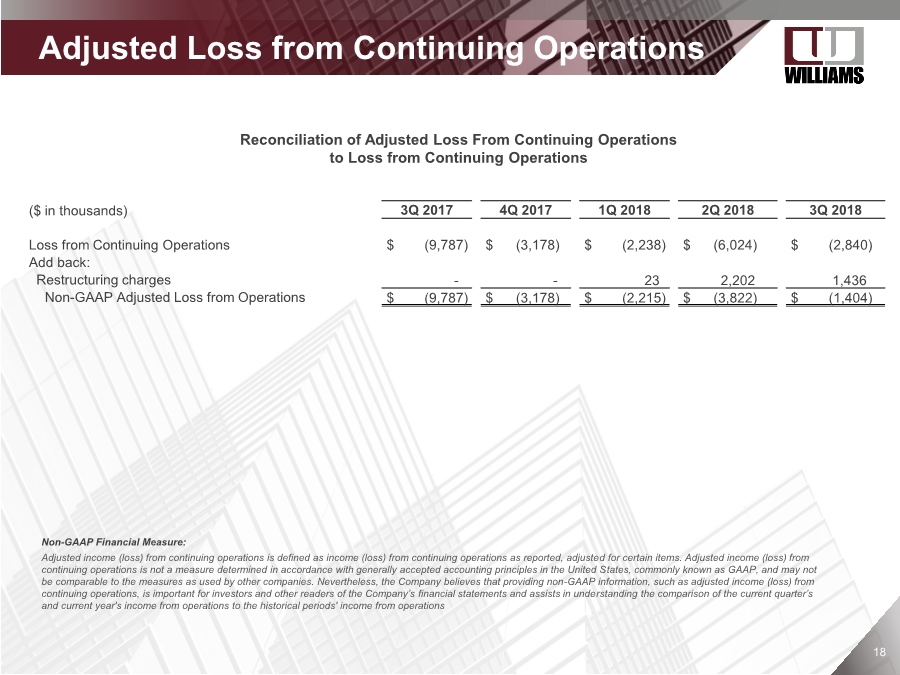
| Company Confidential 1818 Adjusted Loss from Continuing Operations Reconciliation of Adjusted Loss From Continuing Operations to Loss from Continuing Operations ($ in thousands) 3Q 2017 4Q 2017 1Q 2018 2Q 2018 3Q 2018 Loss from Continuing Operations $ (9,787) $ (3,178) $ (2,238) $ (6,024) $ (2,840) Add back: Restructuring charges -- 23 2,202 1,436 Non-GAAP Adjusted Loss from Operations $ (9,787) $ (3,178) $ (2,215) $ (3,822) $ (1,404) Non-GAAP Financial Measure: Adjusted income (loss) from continuing operations is defined as income (loss) from continuing operations as reported, adjusted for certain items. Adjusted income (loss) from continuing operations is not a measure determined in accordance with generally accepted accounting principles in the United States, commonly known as GAAP, and may not be comparable to the measures as used by other companies. Nevertheless, the Company believes that providing non-GAAP information, such as adjusted income (loss) from continuing operations, is important for investors and other readers of the Company’s financial statements and assists in understanding the comparison of the current quarter’s and current year's income from operations to the historical periods' income from operations |
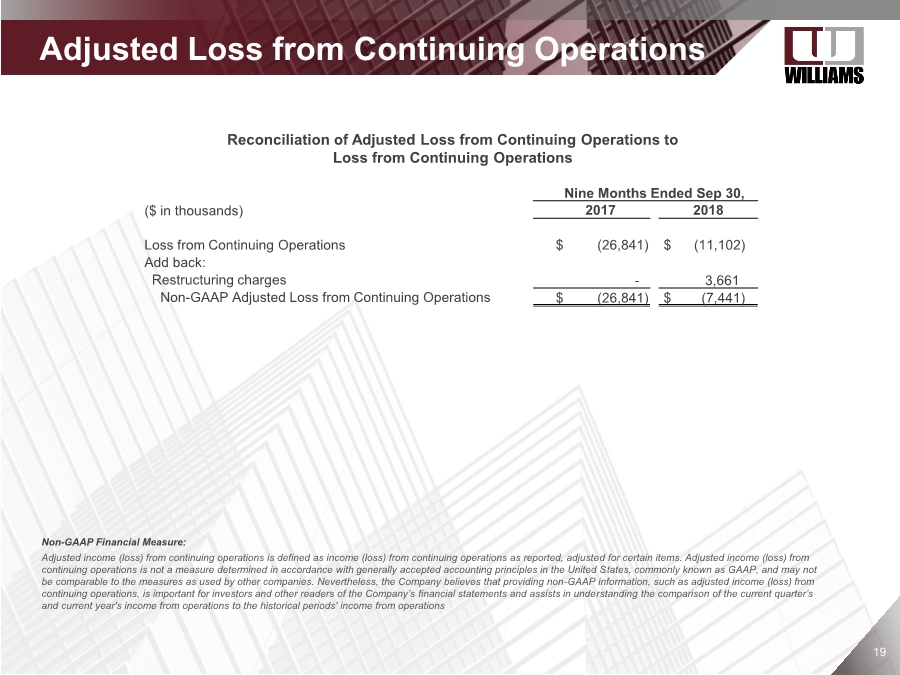
| Company Confidential 1919 Adjusted Loss from Continuing Operations Reconciliation of Adjusted Loss from Continuing Operations to Loss from Continuing Operations Nine Months Ended Sep 30, ($ in thousands) 2017 2018 Loss from Continuing Operations $ (26,841) $ (11,102) Add back: Restructuring charges - 3,661 Non-GAAP Adjusted Loss from Continuing Operations $ (26,841) $ (7,441) Non-GAAP Financial Measure: Adjusted income (loss) from continuing operations is defined as income (loss) from continuing operations as reported, adjusted for certain items. Adjusted income (loss) from continuing operations is not a measure determined in accordance with generally accepted accounting principles in the United States, commonly known as GAAP, and may not be comparable to the measures as used by other companies. Nevertheless, the Company believes that providing non-GAAP information, such as adjusted income (loss) from continuing operations, is important for investors and other readers of the Company’s financial statements and assists in understanding the comparison of the current quarter’s and current year's income from operations to the historical periods' income from operations |
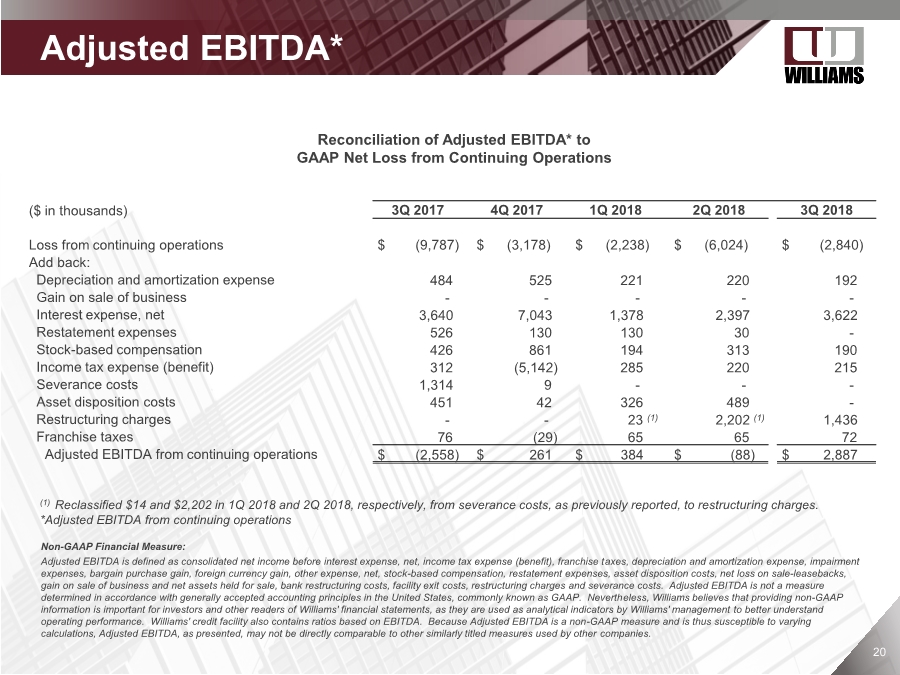
| Company Confidential 2020 Adjusted EBITDA* Reconciliation of Adjusted EBITDA* to GAAP Net Loss from Continuing Operations ($ in thousands) 3Q 2017 4Q 2017 1Q 2018 2Q 2018 3Q 2018 Loss from continuing operations $ (9,787) $ (3,178) $ (2,238) $ (6,024) $ (2,840) Add back: Depreciation and amortization expense 484 525 221 220 192 Gain on sale of business ----- Interest expense, net 3,640 7,043 1,378 2,397 3,622 Restatement expenses 526 130 130 30 - Stock-based compensation 426 861 194 313 190 Income tax expense (benefit) 312 (5,142) 285 220 215 Severance costs 1,314 9 --- Asset disposition costs 451 42 326 489 - Restructuring charges -- 23 (1) 2,202 (1) 1,436 Franchise taxes 76 (29) 65 65 72 Adjusted EBITDA from continuing operations $ (2,558) $ 261 $ 384 $ (88) $ 2,887 Non-GAAP Financial Measure: Adjusted EBITDA is defined as consolidated net income before interest expense, net, income tax expense (benefit), franchise taxes, depreciation and amortization expense, impairment expenses, bargain purchase gain, foreign currency gain, other expense, net, stock-based compensation, restatement expenses, asset disposition costs, net loss on sale-leasebacks, gain on sale of business and net assets held for sale, bank restructuring costs, facility exit costs, restructuring charges and severance costs. Adjusted EBITDA is not a measure determined in accordance with generally accepted accounting principles in the United States, commonly known as GAAP. Nevertheless, Williams believes that providing non-GAAP information is important for investors and other readers of Williams' financial statements, as they are used as analytical indicators by Williams' management to better understand operating performance. Williams' credit facility also contains ratios based on EBITDA. Because Adjusted EBITDA is a non-GAAP measure and is thus susceptible to varying calculations, Adjusted EBITDA, as presented, may not be directly comparable to other similarly titled measures used by other companies. (1) Reclassified $14 and $2,202 in 1Q 2018 and 2Q 2018, respectively, from severance costs, as previously reported, to restructuring charges. *Adjusted EBITDA from continuing operations |
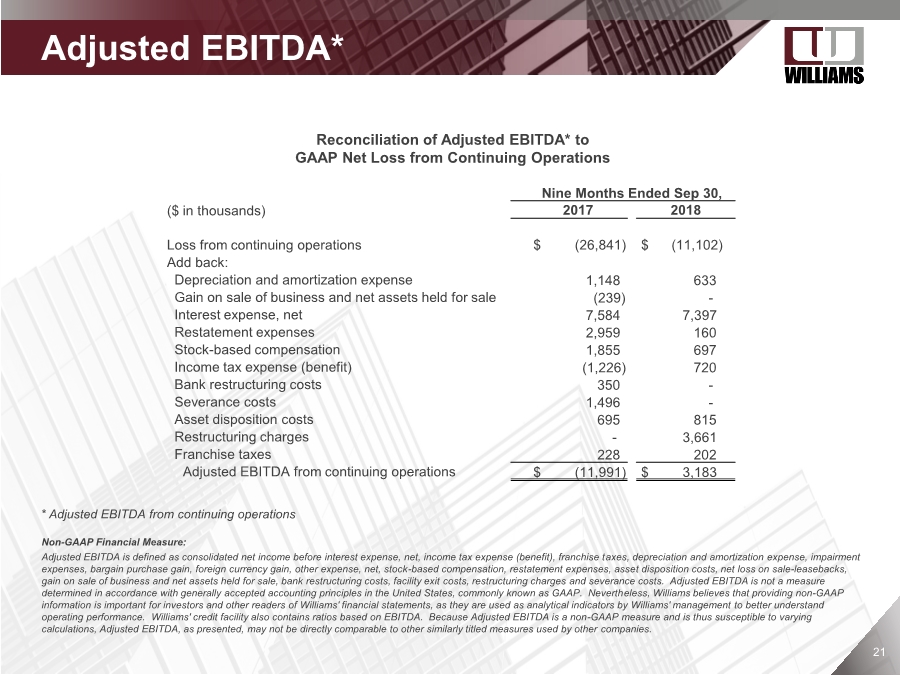
| Company Confidential 2121 Adjusted EBITDA* Reconciliation of Adjusted EBITDA* to GAAP Net Loss from Continuing Operations Nine Months Ended Sep 30, ($ in thousands) 2017 2018 Loss from continuing operations $ (26,841) $ (11,102) Add back: Depreciation and amortization expense 1,148 633 Gain on sale of business and net assets held for sale (239) - Interest expense, net 7,584 7,397 Restatement expenses 2,959 160 Stock-based compensation 1,855 697 Income tax expense (benefit) (1,226) 720 Bank restructuring costs 350 - Severance costs 1,496 - Asset disposition costs 695 815 Restructuring charges - 3,661 Franchise taxes 228 202 Adjusted EBITDA from continuing operations $ (11,991) $ 3,183 Non-GAAP Financial Measure: Adjusted EBITDA is defined as consolidated net income before interest expense, net, income tax expense (benefit), franchise taxes, depreciation and amortization expense, impairment expenses, bargain purchase gain, foreign currency gain, other expense, net, stock-based compensation, restatement expenses, asset disposition costs, net loss on sale-leasebacks, gain on sale of business and net assets held for sale, bank restructuring costs, facility exit costs, restructuring charges and severance costs. Adjusted EBITDA is not a measure determined in accordance with generally accepted accounting principles in the United States, commonly known as GAAP. Nevertheless, Williams believes that providing non-GAAP information is important for investors and other readers of Williams' financial statements, as they are used as analytical indicators by Williams' management to better understand operating performance. Williams' credit facility also contains ratios based on EBITDA. Because Adjusted EBITDA is a non-GAAP measure and is thus susceptible to varying calculations, Adjusted EBITDA, as presented, may not be directly comparable to other similarly titled measures used by other companies. * Adjusted EBITDA from continuing operations |