Attached files
| file | filename |
|---|---|
| 8-K - FORM 8K ON INVESTOR PRESENTATION - WESBANCO INC | fin8k100918.htm |
| EX-99.1 - INVESTOR PRESENTATION IN PDF - WESBANCO INC | ex991.pdf |
John IannoneVice President, Investor Relations304-905-7021 Investor Presentation (Q4 2018)(WSBC financials as of Q3 2018)
Forward-looking statements in this report relating to WesBanco’s (“WSBC”) plans, strategies, objectives, expectations, intentions and adequacy of resources, are made pursuant to the safe harbor provisions of the Private Securities Litigation Reform Act of 1995. The information contained in this report should be read in conjunction with WSBC’s Form 10-K for the year ended December 31, 2017 and documents subsequently filed by WSBC with the Securities and Exchange Commission (“SEC”), including WSBC’s Form 10-Q for the quarters ended March 31, June 30, and September 30, 2018, which are available at the SEC’s website, www.sec.gov, or at WSBC’s website, www.wesbanco.com. Investors are cautioned that forward-looking statements, which are not historical fact, involve risks and uncertainties, including those detailed in WSBC’s most recent Annual Report on Form 10-K filed with the SEC under “Risk Factors” in Part I, Item 1A. Such statements are subject to important factors that could cause actual results to differ materially from those contemplated by such statements, including, without limitation, that the businesses of WSBC and Farmers Capital Bank (“FFKT”) may not be integrated successfully or such integration may take longer to accomplish than excepted; the expected cost savings and any revenue synergies from the merger of WSBC and FFKT may not be fully realized within the expected timeframes; disruption from the merger of WSBC and FFKT may make it more difficult to maintain relationships with clients, associates, or suppliers; the effects of changing regional and national economic conditions; changes in interest rates, spreads on earning assets and interest-bearing liabilities, and associated interest rate sensitivity; sources of liquidity available to WSBC and its related subsidiary operations; potential future credit losses and the credit risk of commercial, real estate, and consumer loan customers and their borrowing activities; actions of the Federal Reserve Board, the Federal Deposit Insurance Corporation, the SEC, the Financial Institution Regulatory Authority, the Municipal Securities Rulemaking Board, the Securities Investors Protection Corporation, and other regulatory bodies; potential legislative and federal and state regulatory actions and reform, including, without limitation, the impact of the implementation of the Dodd-Frank Act; adverse decisions of federal and state courts; fraud, scams and schemes of third parties; internet hacking; competitive conditions in the financial services industry; rapidly changing technology affecting financial services; marketability of debt instruments and corresponding impact on fair value adjustments; and/or other external developments materially impacting WSBC’s operational and financial performance. WSBC does not assume any duty to update forward-looking statements. Forward-Looking Statements 1
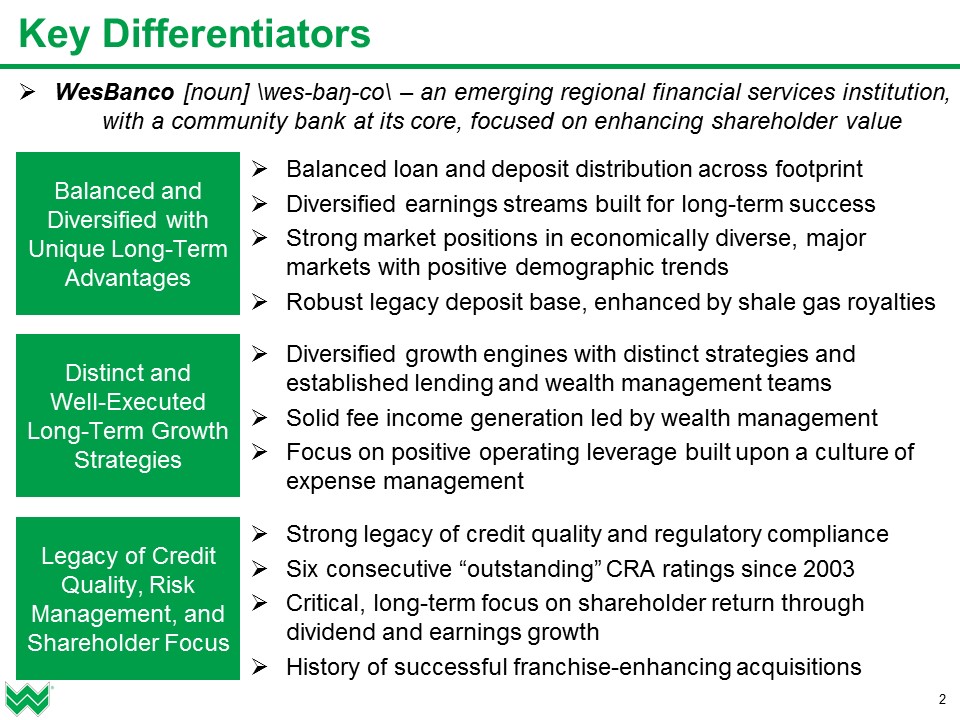
2 Key Differentiators Balanced loan and deposit distribution across footprintDiversified earnings streams built for long-term successStrong market positions in economically diverse, major markets with positive demographic trendsRobust legacy deposit base, enhanced by shale gas royalties Balanced and Diversified with Unique Long-Term Advantages Distinct andWell-Executed Long-Term Growth Strategies Legacy of Credit Quality, Risk Management, and Shareholder Focus Diversified growth engines with distinct strategies and established lending and wealth management teamsSolid fee income generation led by wealth managementFocus on positive operating leverage built upon a culture of expense management Strong legacy of credit quality and regulatory complianceSix consecutive “outstanding” CRA ratings since 2003Critical, long-term focus on shareholder return through dividend and earnings growthHistory of successful franchise-enhancing acquisitions WesBanco [noun] \wes-baŋ-co\ – an emerging regional financial services institution, with a community bank at its core, focused on enhancing shareholder value
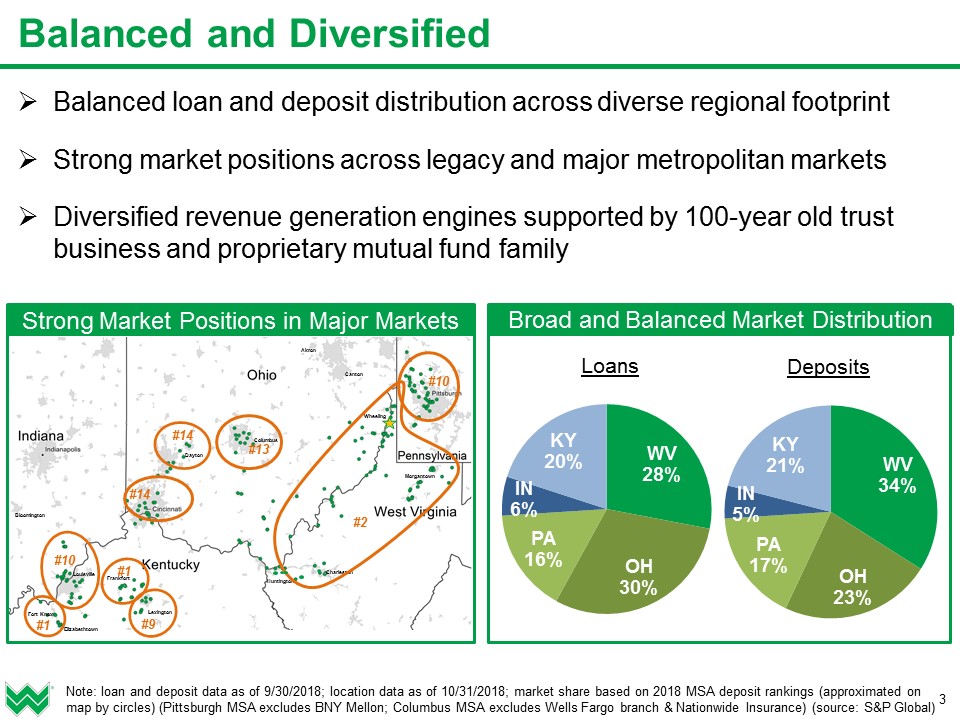
3 Balanced and Diversified Balanced loan and deposit distribution across diverse regional footprintStrong market positions across legacy and major metropolitan marketsDiversified revenue generation engines supported by 100-year old trust business and proprietary mutual fund family Note: loan and deposit data as of 9/30/2018; location data as of 10/31/2018; market share based on 2018 MSA deposit rankings (approximated on map by circles) (Pittsburgh MSA excludes BNY Mellon; Columbus MSA excludes Wells Fargo branch & Nationwide Insurance) (source: S&P Global) Broad and Balanced Market Distribution Louisville Lexington Dayton Columbus Bloomington Akron Canton Charleston Wheeling Morgantown Huntington Fort Knox Elizabethtown #14 #13 #14 #1 #10 #10 #2 Strong Market Positions in Major Markets Frankfort #9 #1
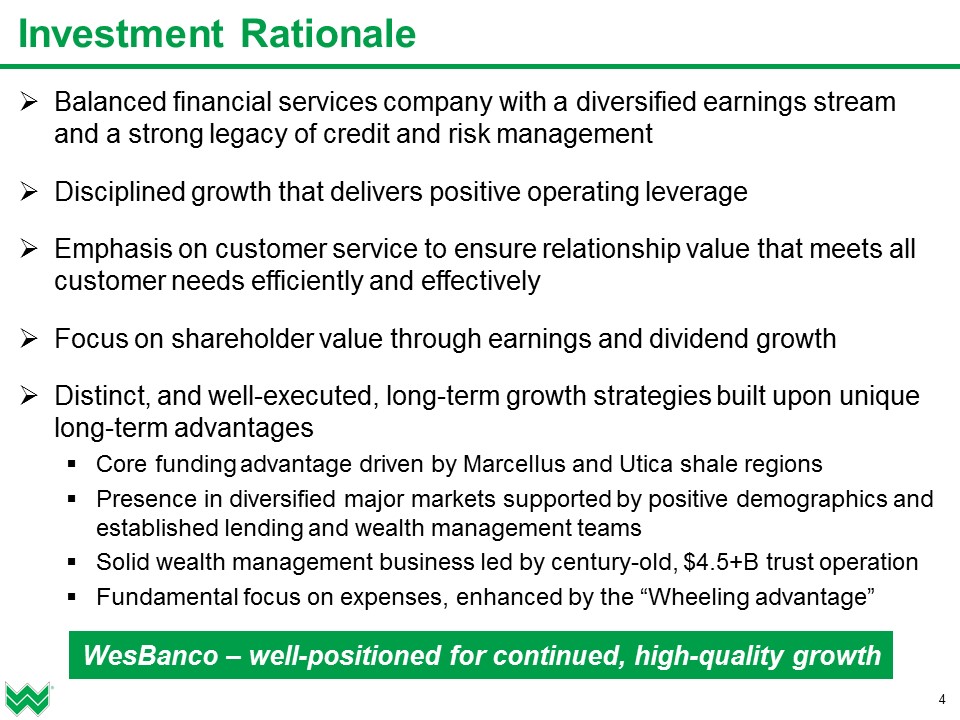
4 Investment Rationale Balanced financial services company with a diversified earnings stream and a strong legacy of credit and risk managementDisciplined growth that delivers positive operating leverageEmphasis on customer service to ensure relationship value that meets all customer needs efficiently and effectivelyFocus on shareholder value through earnings and dividend growthDistinct, and well-executed, long-term growth strategies built upon unique long-term advantagesCore funding advantage driven by Marcellus and Utica shale regionsPresence in diversified major markets supported by positive demographics and established lending and wealth management teamsSolid wealth management business led by century-old, $4.5+B trust operationFundamental focus on expenses, enhanced by the “Wheeling advantage” WesBanco – well-positioned for continued, high-quality growth
Strategies for Long-Term Success

6 Long-Term Growth Strategies Focus on Delivering Positive Operating Leverage Strong Legacy of Credit Quality, Risk Management, and Compliance Diversified Loan Portfolio with C&I and Home Equity Lending Focus Long History of Strong Wealth Management Capabilities Retail Banking Service Strategies & Core Deposit Advantage Franchise-Enhancing Expansion within Contiguous Markets
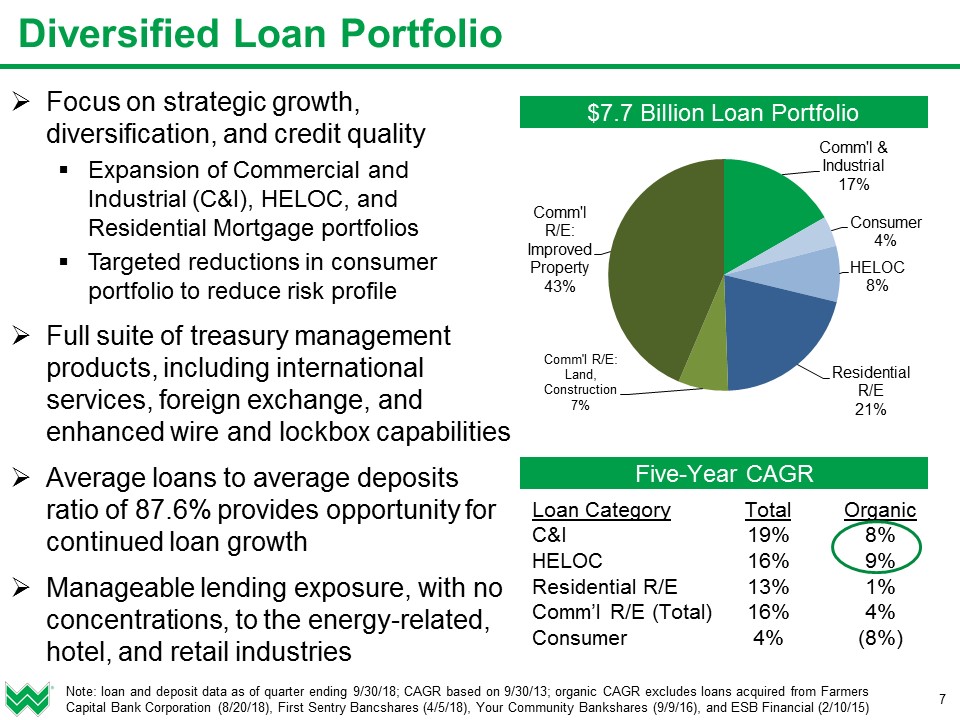
7 Diversified Loan Portfolio Focus on strategic growth, diversification, and credit qualityExpansion of Commercial and Industrial (C&I), HELOC, and Residential Mortgage portfoliosTargeted reductions in consumer portfolio to reduce risk profileFull suite of treasury management products, including international services, foreign exchange, and enhanced wire and lockbox capabilitiesAverage loans to average deposits ratio of 87.6% provides opportunity for continued loan growthManageable lending exposure, with no concentrations, to the energy-related, hotel, and retail industries $7.7 Billion Loan Portfolio Note: loan and deposit data as of quarter ending 9/30/18; CAGR based on 9/30/13; organic CAGR excludes loans acquired from Farmers Capital Bank Corporation (8/20/18), First Sentry Bancshares (4/5/18), Your Community Bankshares (9/9/16), and ESB Financial (2/10/15) Five-Year CAGR Loan CategoryC&IHELOCResidential R/EComm’l R/E (Total)Consumer Total19%16%13%16%4% Organic8%9%1%4%(8%)
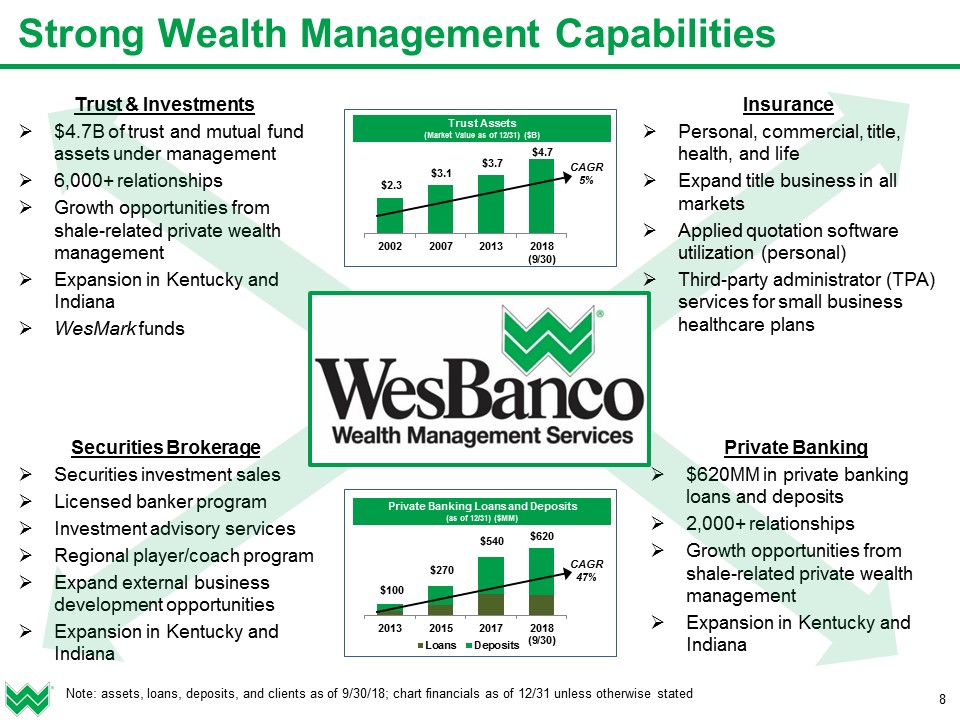
Private Banking$620MM in private banking loans and deposits2,000+ relationships Growth opportunities from shale-related private wealth managementExpansion in Kentucky and Indiana 8 Strong Wealth Management Capabilities Note: assets, loans, deposits, and clients as of 9/30/18; chart financials as of 12/31 unless otherwise stated Private Banking Loans and Deposits(as of 12/31) ($MM) Trust & Investments$4.7B of trust and mutual fund assets under management6,000+ relationshipsGrowth opportunities from shale-related private wealth managementExpansion in Kentucky and IndianaWesMark funds Securities BrokerageSecurities investment salesLicensed banker programInvestment advisory servicesRegional player/coach programExpand external business development opportunitiesExpansion in Kentucky and Indiana CAGR47% InsurancePersonal, commercial, title, health, and lifeExpand title business in all marketsApplied quotation software utilization (personal)Third-party administrator (TPA) services for small business healthcare plans Trust Assets(Market Value as of 12/31) ($B) CAGR5%
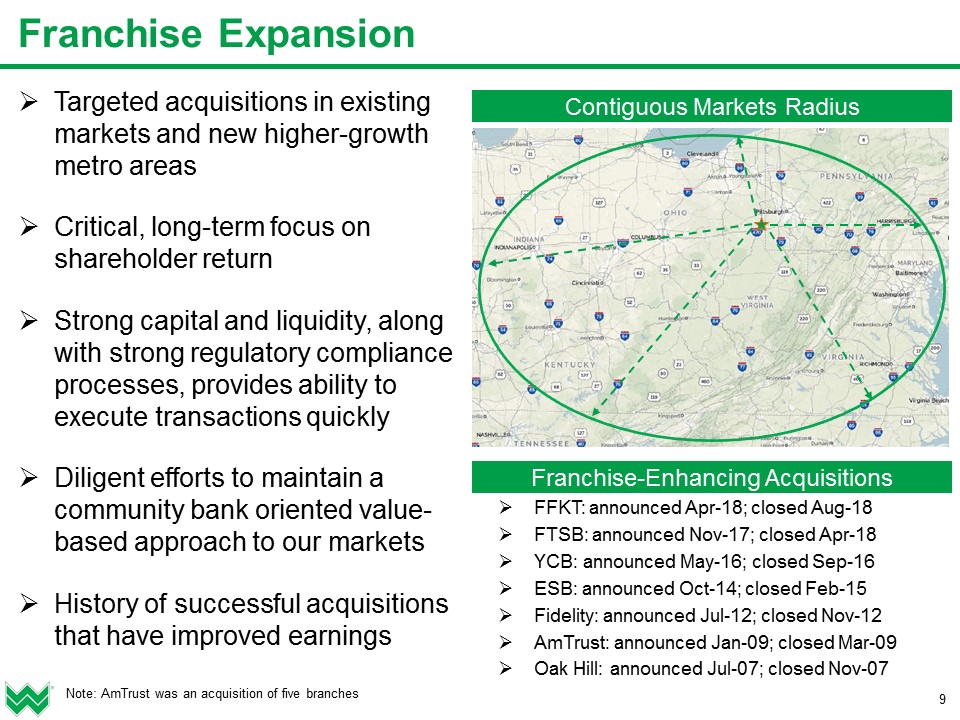
9 Franchise Expansion Targeted acquisitions in existing markets and new higher-growth metro areasCritical, long-term focus on shareholder returnStrong capital and liquidity, along with strong regulatory compliance processes, provides ability to execute transactions quickly Diligent efforts to maintain a community bank oriented value-based approach to our marketsHistory of successful acquisitions that have improved earnings Contiguous Markets Radius Franchise-Enhancing Acquisitions FFKT: announced Apr-18; closed Aug-18FTSB: announced Nov-17; closed Apr-18YCB: announced May-16; closed Sep-16ESB: announced Oct-14; closed Feb-15Fidelity: announced Jul-12; closed Nov-12AmTrust: announced Jan-09; closed Mar-09Oak Hill: announced Jul-07; closed Nov-07 Note: AmTrust was an acquisition of five branches
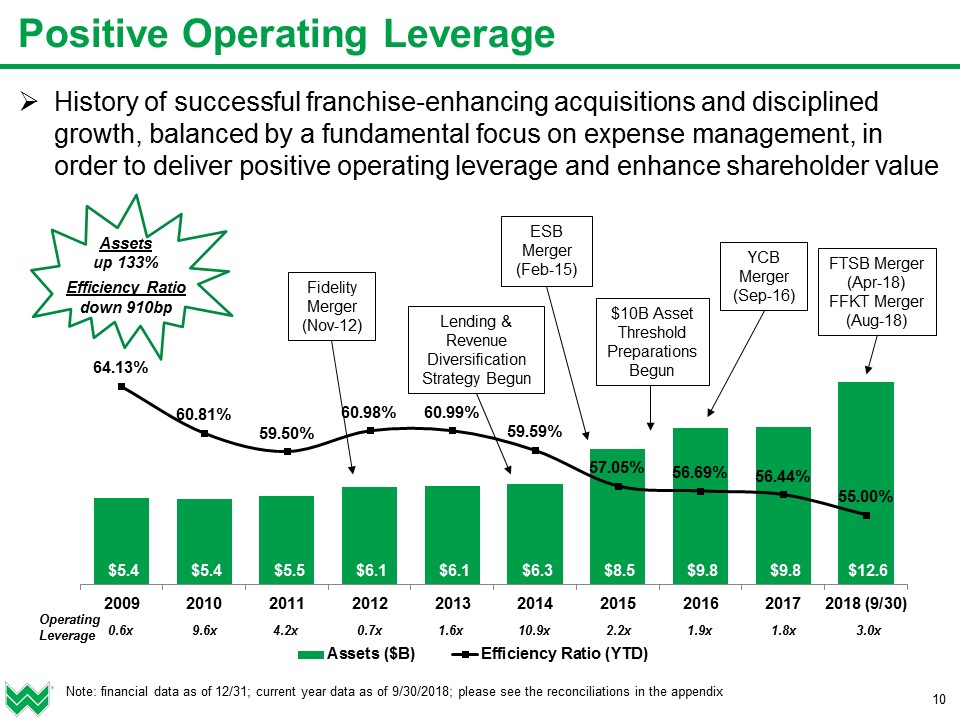
10 Positive Operating Leverage History of successful franchise-enhancing acquisitions and disciplined growth, balanced by a fundamental focus on expense management, in order to deliver positive operating leverage and enhance shareholder value Note: financial data as of 12/31; current year data as of 9/30/2018; please see the reconciliations in the appendix YCB Merger (Sep-16) ESB Merger (Feb-15) Fidelity Merger (Nov-12) $10B Asset Threshold Preparations Begun Lending & Revenue Diversification Strategy Begun Assetsup 133%Efficiency Ratiodown 910bp FTSB Merger (Apr-18)FFKT Merger (Aug-18)
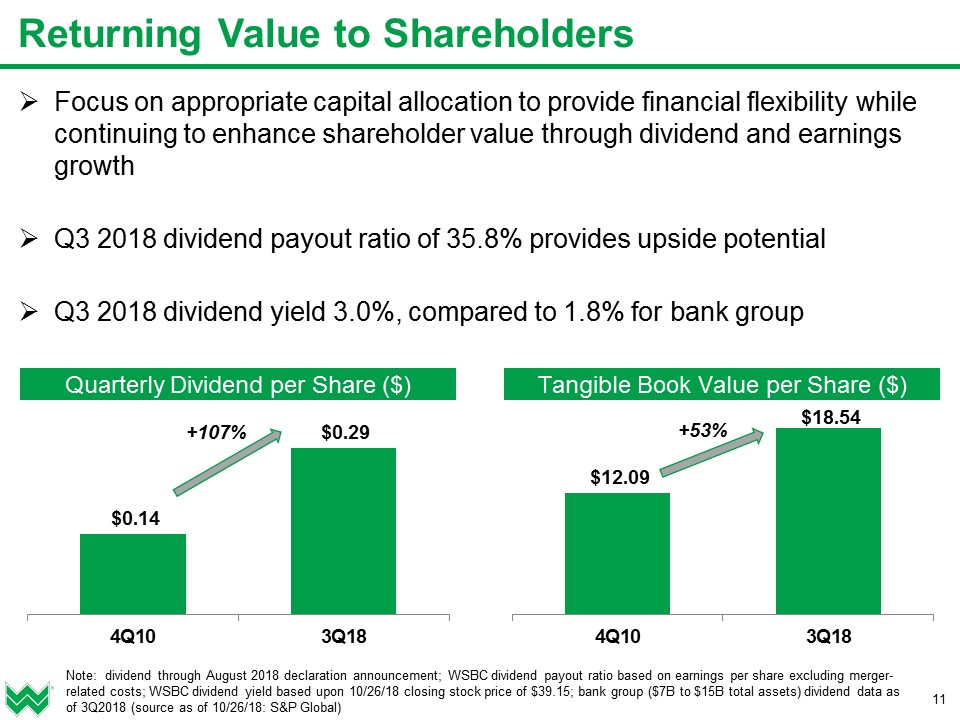
Returning Value to Shareholders Focus on appropriate capital allocation to provide financial flexibility while continuing to enhance shareholder value through dividend and earnings growthQ3 2018 dividend payout ratio of 35.8% provides upside potentialQ3 2018 dividend yield 3.0%, compared to 1.8% for bank group 11 Note: dividend through August 2018 declaration announcement; WSBC dividend payout ratio based on earnings per share excluding merger-related costs; WSBC dividend yield based upon 10/26/18 closing stock price of $39.15; bank group ($7B to $15B total assets) dividend data as of 3Q2018 (source as of 10/26/18: S&P Global) Tangible Book Value per Share ($) Quarterly Dividend per Share ($) +107% +53%
Financial Overview
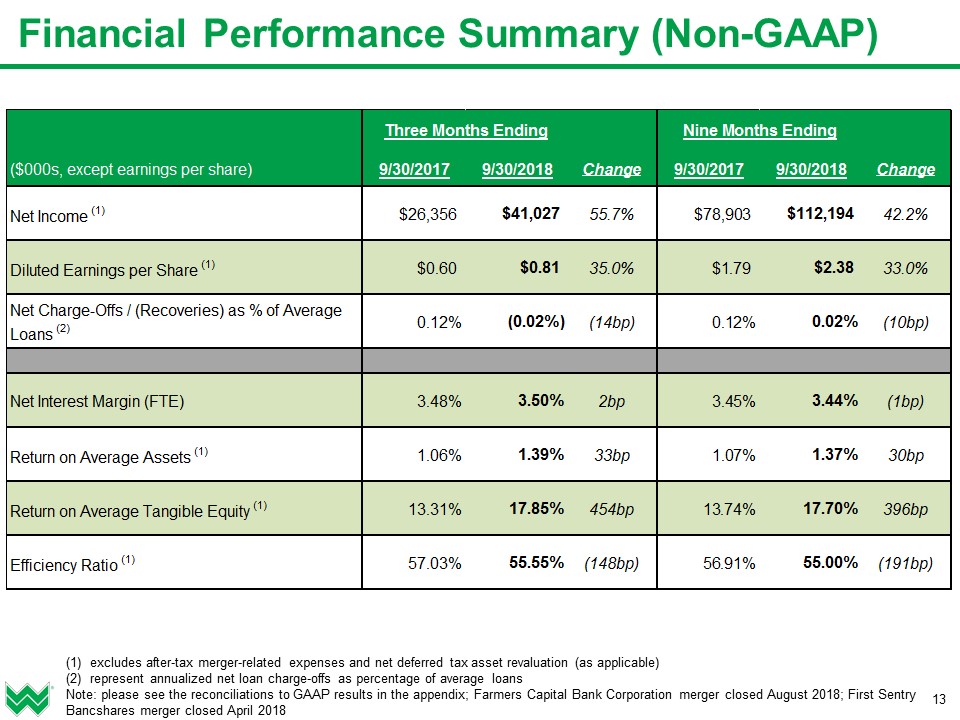
Financial Performance Summary (Non-GAAP) 13 excludes after-tax merger-related expenses and net deferred tax asset revaluation (as applicable)represent annualized net loan charge-offs as percentage of average loansNote: please see the reconciliations to GAAP results in the appendix; Farmers Capital Bank Corporation merger closed August 2018; First Sentry Bancshares merger closed April 2018
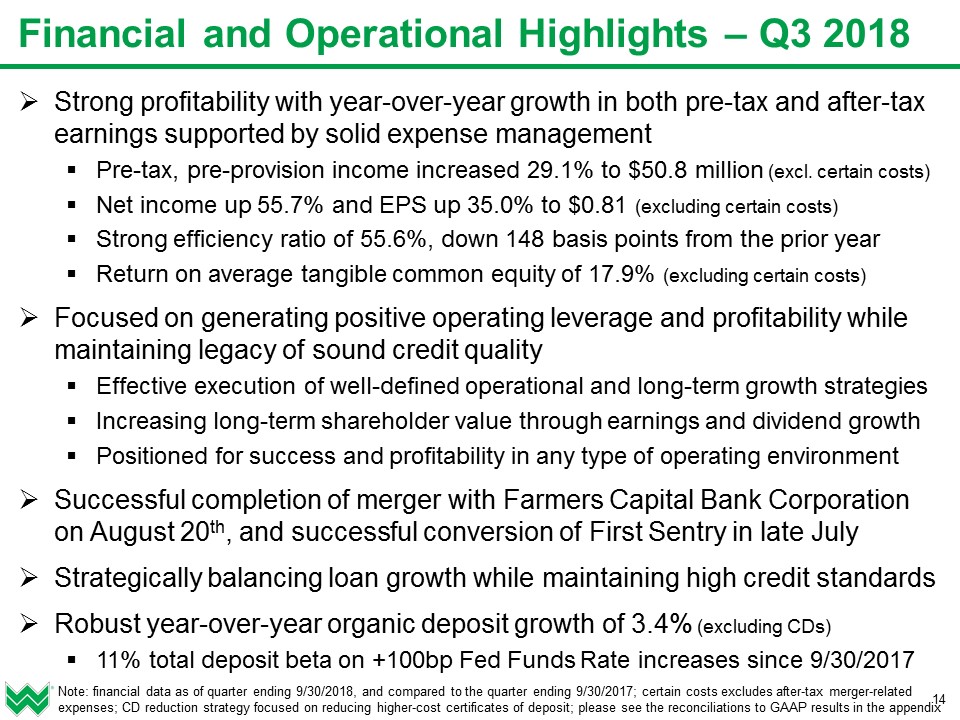
14 Financial and Operational Highlights – Q3 2018 Strong profitability with year-over-year growth in both pre-tax and after-tax earnings supported by solid expense managementPre-tax, pre-provision income increased 29.1% to $50.8 million (excl. certain costs)Net income up 55.7% and EPS up 35.0% to $0.81 (excluding certain costs)Strong efficiency ratio of 55.6%, down 148 basis points from the prior yearReturn on average tangible common equity of 17.9% (excluding certain costs)Focused on generating positive operating leverage and profitability while maintaining legacy of sound credit qualityEffective execution of well-defined operational and long-term growth strategiesIncreasing long-term shareholder value through earnings and dividend growthPositioned for success and profitability in any type of operating environmentSuccessful completion of merger with Farmers Capital Bank Corporation on August 20th, and successful conversion of First Sentry in late JulyStrategically balancing loan growth while maintaining high credit standardsRobust year-over-year organic deposit growth of 3.4% (excluding CDs)11% total deposit beta on +100bp Fed Funds Rate increases since 9/30/2017 Note: financial data as of quarter ending 9/30/2018, and compared to the quarter ending 9/30/2017; certain costs excludes after-tax merger-related expenses; CD reduction strategy focused on reducing higher-cost certificates of deposit; please see the reconciliations to GAAP results in the appendix
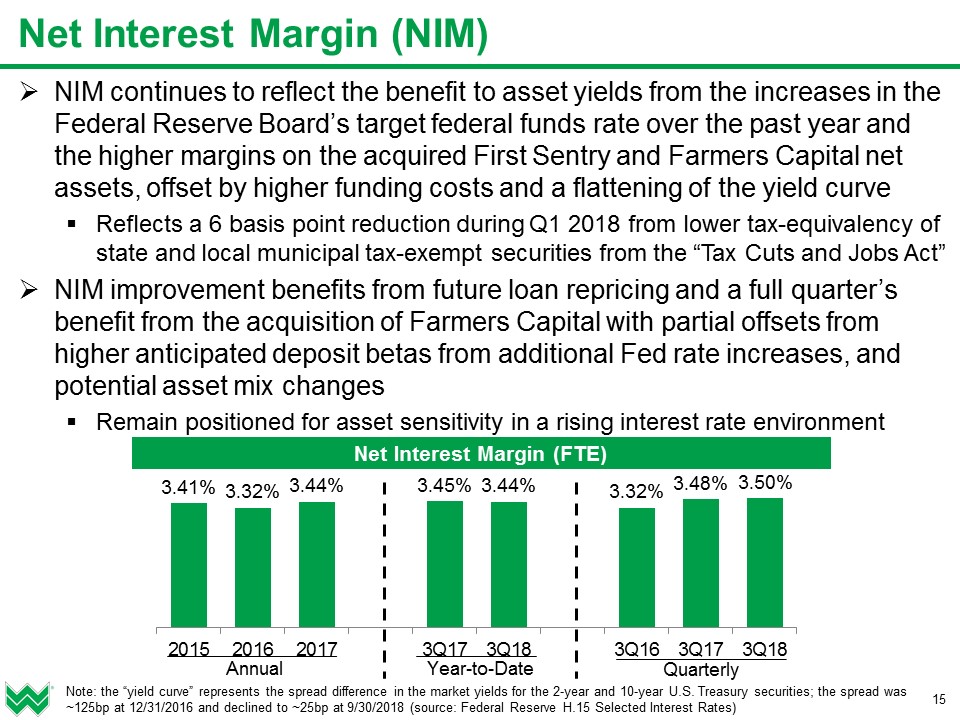
Net Interest Margin (NIM) NIM continues to reflect the benefit to asset yields from the increases in the Federal Reserve Board’s target federal funds rate over the past year and the higher margins on the acquired First Sentry and Farmers Capital net assets, offset by higher funding costs and a flattening of the yield curveReflects a 6 basis point reduction during Q1 2018 from lower tax-equivalency of state and local municipal tax-exempt securities from the “Tax Cuts and Jobs Act”NIM improvement benefits from future loan repricing and a full quarter’s benefit from the acquisition of Farmers Capital with partial offsets from higher anticipated deposit betas from additional Fed rate increases, and potential asset mix changesRemain positioned for asset sensitivity in a rising interest rate environment 15 Net Interest Margin (FTE) Note: the “yield curve” represents the spread difference in the market yields for the 2-year and 10-year U.S. Treasury securities; the spread was ~125bp at 12/31/2016 and declined to ~25bp at 9/30/2018 (source: Federal Reserve H.15 Selected Interest Rates)
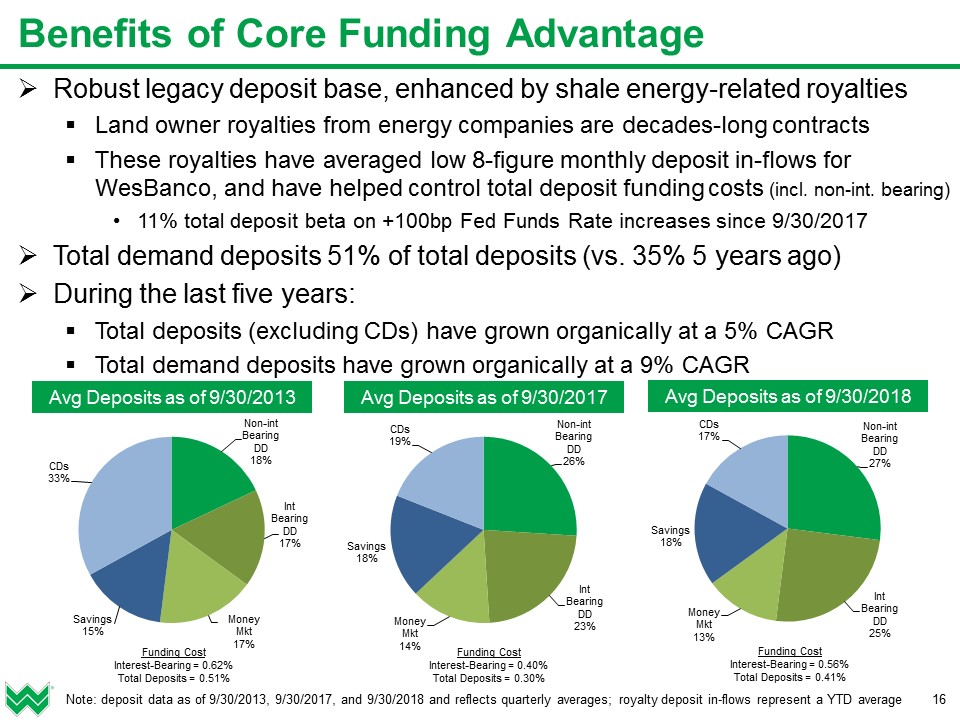
16 Benefits of Core Funding Advantage Robust legacy deposit base, enhanced by shale energy-related royaltiesLand owner royalties from energy companies are decades-long contractsThese royalties have averaged low 8-figure monthly deposit in-flows for WesBanco, and have helped control total deposit funding costs (incl. non-int. bearing) 11% total deposit beta on +100bp Fed Funds Rate increases since 9/30/2017Total demand deposits 51% of total deposits (vs. 35% 5 years ago)During the last five years:Total deposits (excluding CDs) have grown organically at a 5% CAGRTotal demand deposits have grown organically at a 9% CAGR Note: deposit data as of 9/30/2013, 9/30/2017, and 9/30/2018 and reflects quarterly averages; royalty deposit in-flows represent a YTD average Avg Deposits as of 9/30/2018 Funding CostInterest-Bearing = 0.56%Total Deposits = 0.41% Avg Deposits as of 9/30/2017 Funding CostInterest-Bearing = 0.40%Total Deposits = 0.30% Avg Deposits as of 9/30/2013 Funding CostInterest-Bearing = 0.62%Total Deposits = 0.51%
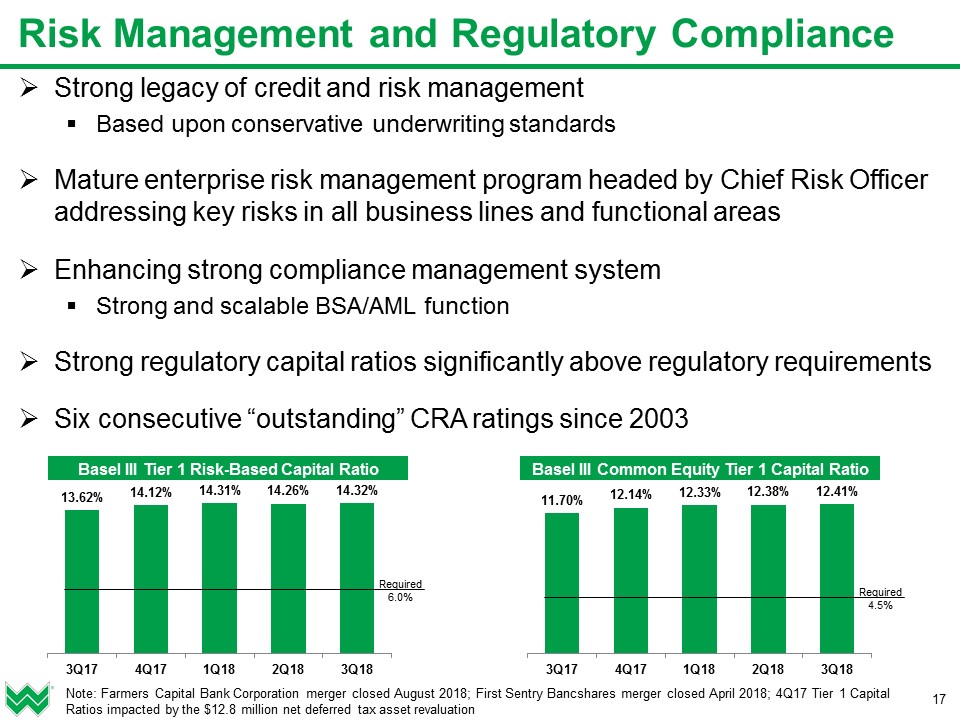
Strong legacy of credit and risk managementBased upon conservative underwriting standardsMature enterprise risk management program headed by Chief Risk Officer addressing key risks in all business lines and functional areasEnhancing strong compliance management systemStrong and scalable BSA/AML functionStrong regulatory capital ratios significantly above regulatory requirementsSix consecutive “outstanding” CRA ratings since 2003 Risk Management and Regulatory Compliance 17 Basel III Tier 1 Risk-Based Capital Ratio Basel III Common Equity Tier 1 Capital Ratio Note: Farmers Capital Bank Corporation merger closed August 2018; First Sentry Bancshares merger closed April 2018; 4Q17 Tier 1 Capital Ratios impacted by the $12.8 million net deferred tax asset revaluation
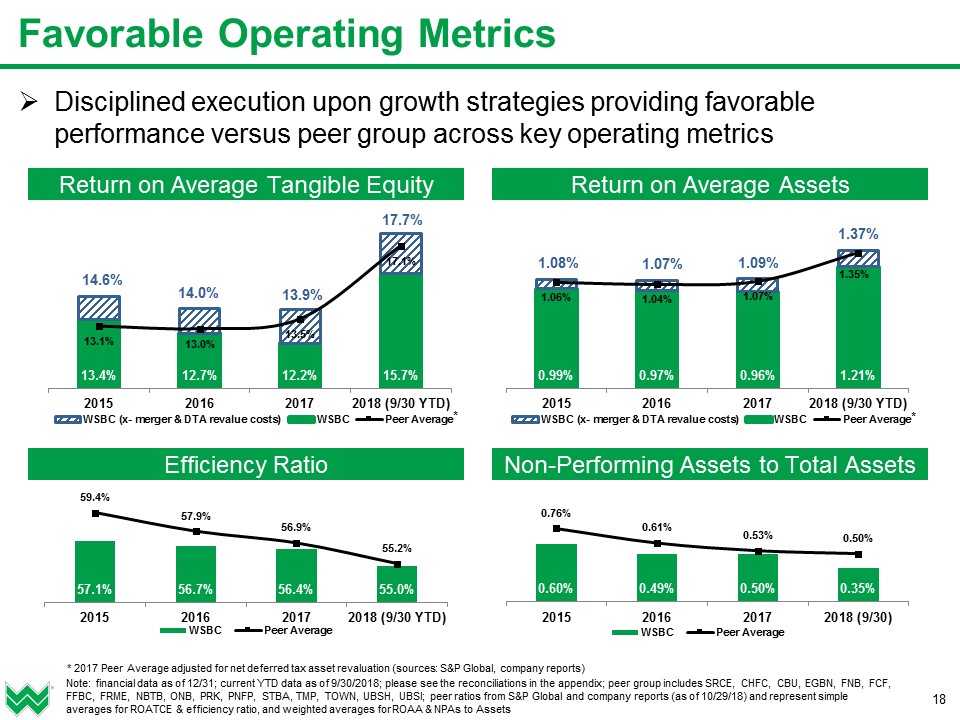
18 Favorable Operating Metrics Disciplined execution upon growth strategies providing favorable performance versus peer group across key operating metrics Note: financial data as of 12/31; current YTD data as of 9/30/2018; please see the reconciliations in the appendix; peer group includes SRCE, CHFC, CBU, EGBN, FNB, FCF, FFBC, FRME, NBTB, ONB, PRK, PNFP, STBA, TMP, TOWN, UBSH, UBSI; peer ratios from S&P Global and company reports (as of 10/29/18) and represent simple averages for ROATCE & efficiency ratio, and weighted averages for ROAA & NPAs to Assets Efficiency Ratio Return on Average Assets Return on Average Tangible Equity Non-Performing Assets to Total Assets * 2017 Peer Average adjusted for net deferred tax asset revaluation (sources: S&P Global, company reports) * *
Appendix
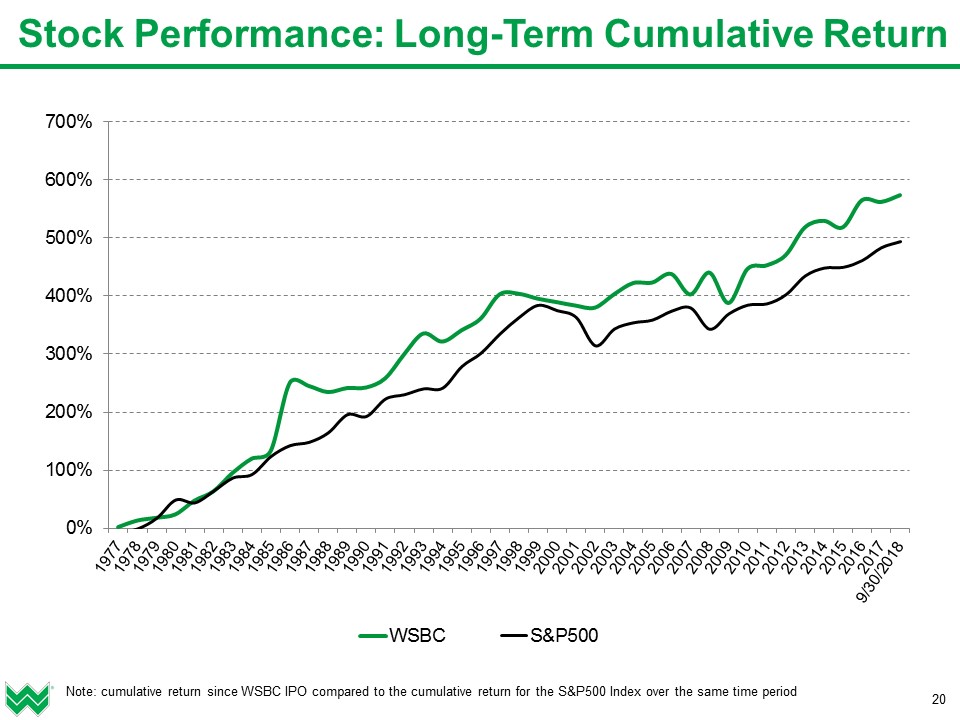
Stock Performance: Long-Term Cumulative Return 20 Note: cumulative return since WSBC IPO compared to the cumulative return for the S&P500 Index over the same time period
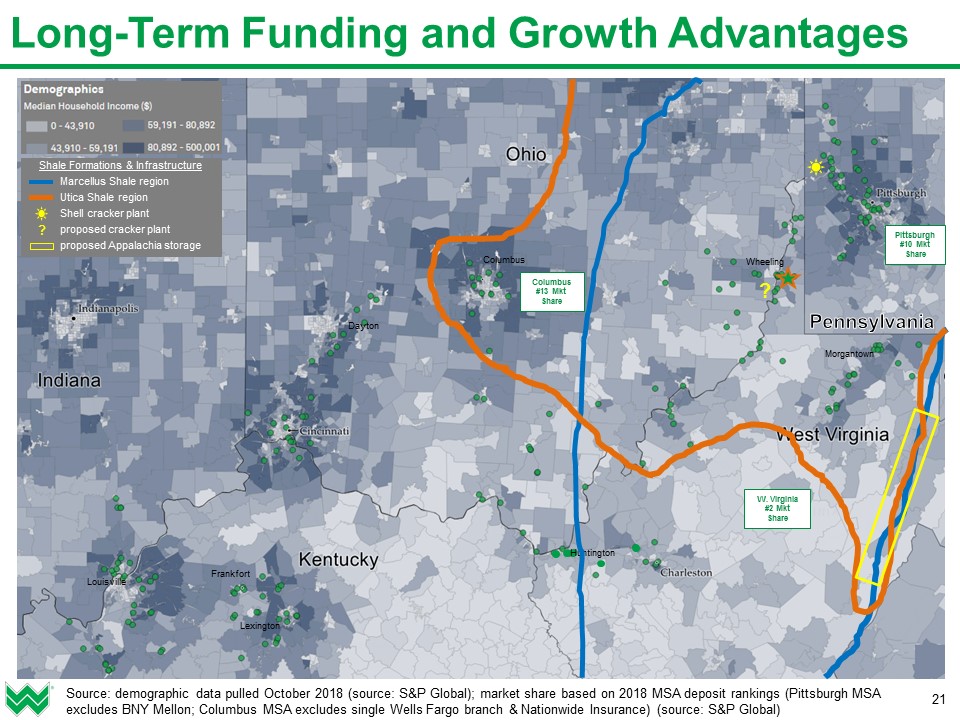
Pennsylvania 21 Long-Term Funding and Growth Advantages Source: demographic data pulled October 2018 (source: S&P Global); market share based on 2018 MSA deposit rankings (Pittsburgh MSA excludes BNY Mellon; Columbus MSA excludes single Wells Fargo branch & Nationwide Insurance) (source: S&P Global) Columbus Wheeling Louisville Lexington Morgantown Dayton Huntington Shale Formations & Infrastructure Marcellus Shale region Utica Shale region Shell cracker plant proposed cracker plant proposed Appalachia storage ? ? Pittsburgh #10 Mkt Share W. Virginia #2 Mkt Share Columbus #13 Mkt Share Frankfort
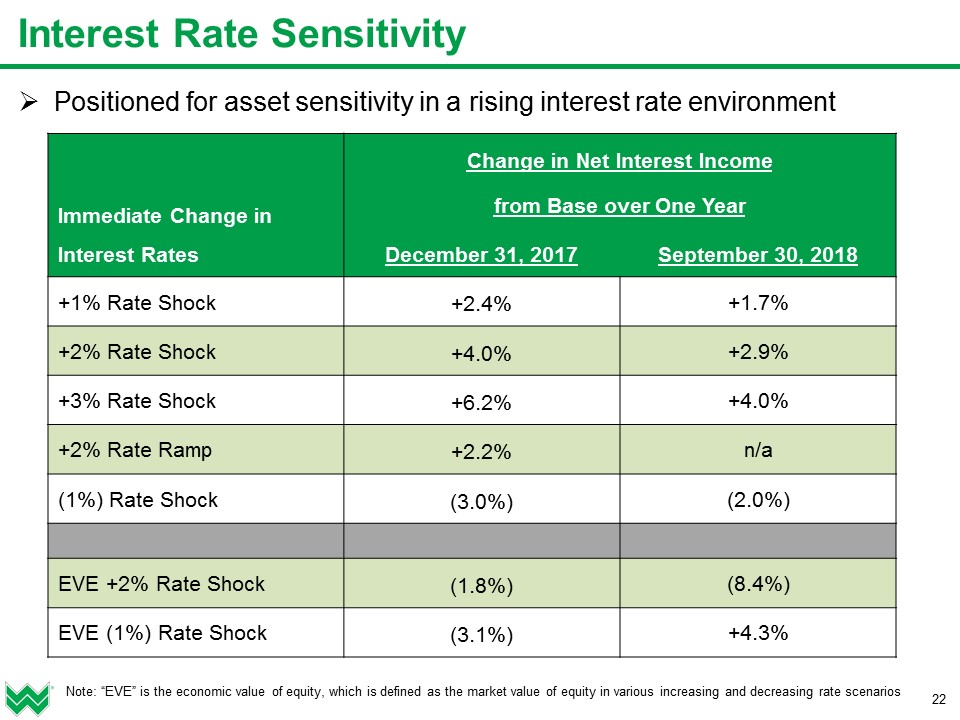
Interest Rate Sensitivity Positioned for asset sensitivity in a rising interest rate environment 22 Immediate Change in Interest Rates Change in Net Interest Incomefrom Base over One Year December 31, 2017 September 30, 2018 +1% Rate Shock +2.4% +1.7% +2% Rate Shock +4.0% +2.9% +3% Rate Shock +6.2% +4.0% +2% Rate Ramp +2.2% n/a (1%) Rate Shock (3.0%) (2.0%) EVE +2% Rate Shock (1.8%) (8.4%) EVE (1%) Rate Shock (3.1%) +4.3% Note: “EVE” is the economic value of equity, which is defined as the market value of equity in various increasing and decreasing rate scenarios
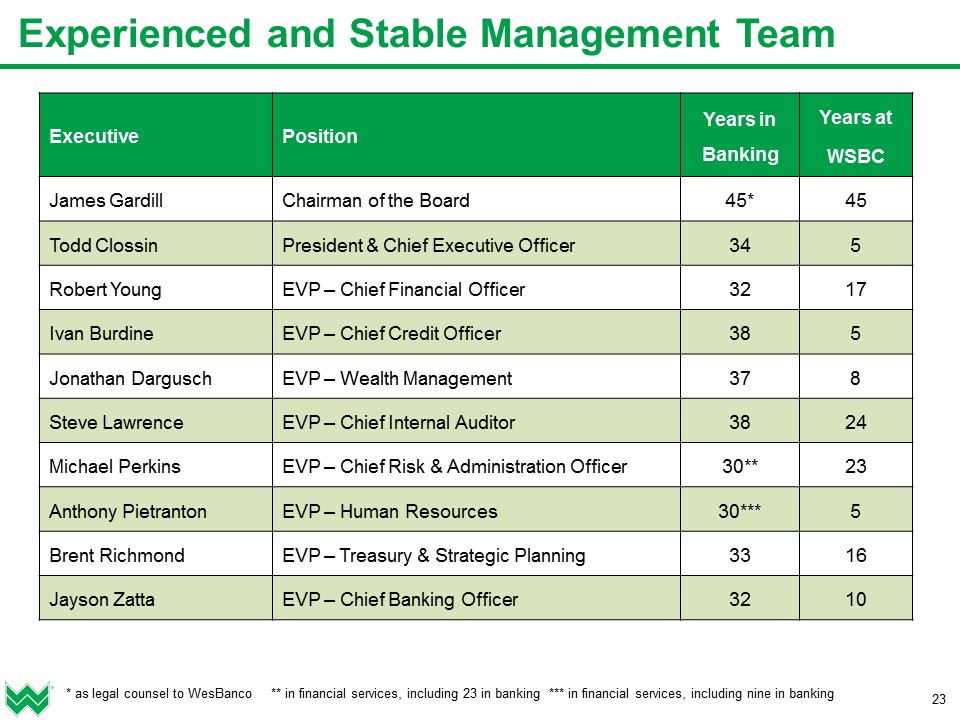
Executive Position Years in Banking Years atWSBC James Gardill Chairman of the Board 45* 45 Todd Clossin President & Chief Executive Officer 34 5 Robert Young EVP – Chief Financial Officer 32 17 Ivan Burdine EVP – Chief Credit Officer 38 5 Jonathan Dargusch EVP – Wealth Management 37 8 Steve Lawrence EVP – Chief Internal Auditor 38 24 Michael Perkins EVP – Chief Risk & Administration Officer 30** 23 Anthony Pietranton EVP – Human Resources 30*** 5 Brent Richmond EVP – Treasury & Strategic Planning 33 16 Jayson Zatta EVP – Chief Banking Officer 32 10 Experienced and Stable Management Team * as legal counsel to WesBanco ** in financial services, including 23 in banking *** in financial services, including nine in banking 23

Financial Performance Summary Trend – Annual 24 Efficiency Ratio (1) Net Income (1) ($MM) (1) excludes merger-related expenses and net deferred tax asset revaluation (as applicable)Note: please see the reconciliations to GAAP results in the appendix; Farmers Capital Bank Corporation merger closed August 2018; First Sentry Bancshares merger closed April 2018, Your Community Bankshares merger closed September 2016; ESB Financial merger closed February 2015 Return on Average Tangible Equity (1) Return on Average Assets (1)
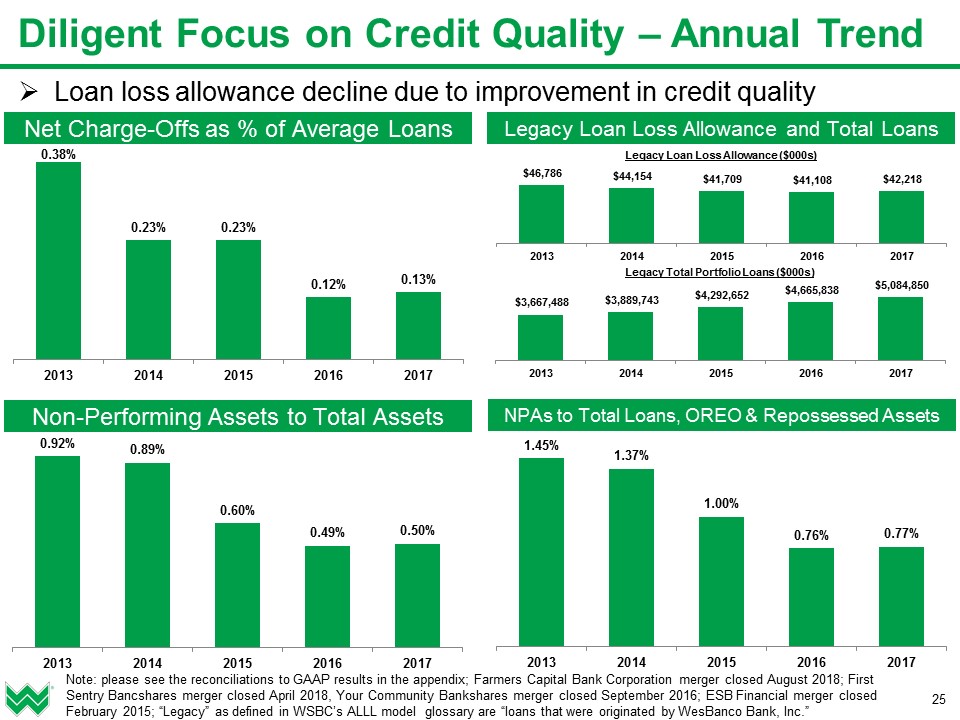
Loan loss allowance decline due to improvement in credit quality Legacy Loan Loss Allowance and Total Loans Non-Performing Assets to Total Assets Net Charge-Offs as % of Average Loans NPAs to Total Loans, OREO & Repossessed Assets Diligent Focus on Credit Quality – Annual Trend 25 Note: please see the reconciliations to GAAP results in the appendix; Farmers Capital Bank Corporation merger closed August 2018; First Sentry Bancshares merger closed April 2018, Your Community Bankshares merger closed September 2016; ESB Financial merger closed February 2015; “Legacy” as defined in WSBC’s ALLL model glossary are “loans that were originated by WesBanco Bank, Inc.”
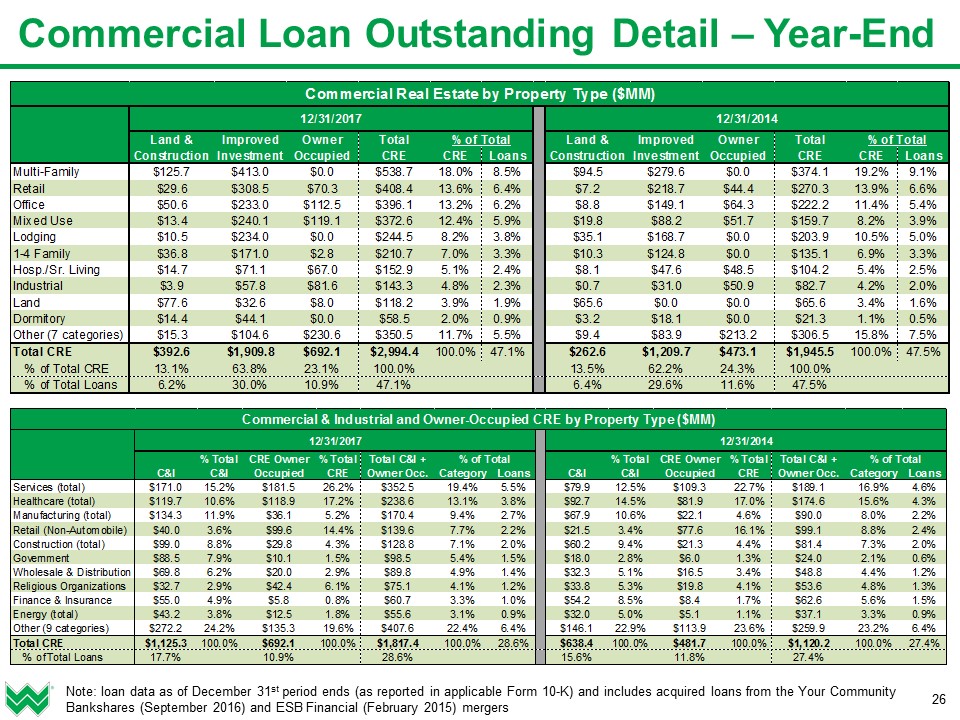
26 Commercial Loan Outstanding Detail – Year-End Note: loan data as of December 31st period ends (as reported in applicable Form 10-K) and includes acquired loans from the Your Community Bankshares (September 2016) and ESB Financial (February 2015) mergers

Reconciliation: Efficiency Ratio & Operating Leverage 27 Note: “efficiency ratio” is non-interest expense excluding restructuring and merger-related expense divided by total income; FTE represents fully taxable equivalent; Farmers Capital Bank Corporation merger closed August 2018; First Sentry Bancshares merger closed April 2018, Your Community Bankshares merger closed September 2016; ESB Financial merger closed February 2015; Fidelity Bancorp merger closed November 2012; AmTrust 5 branch acquisition closed March 2009
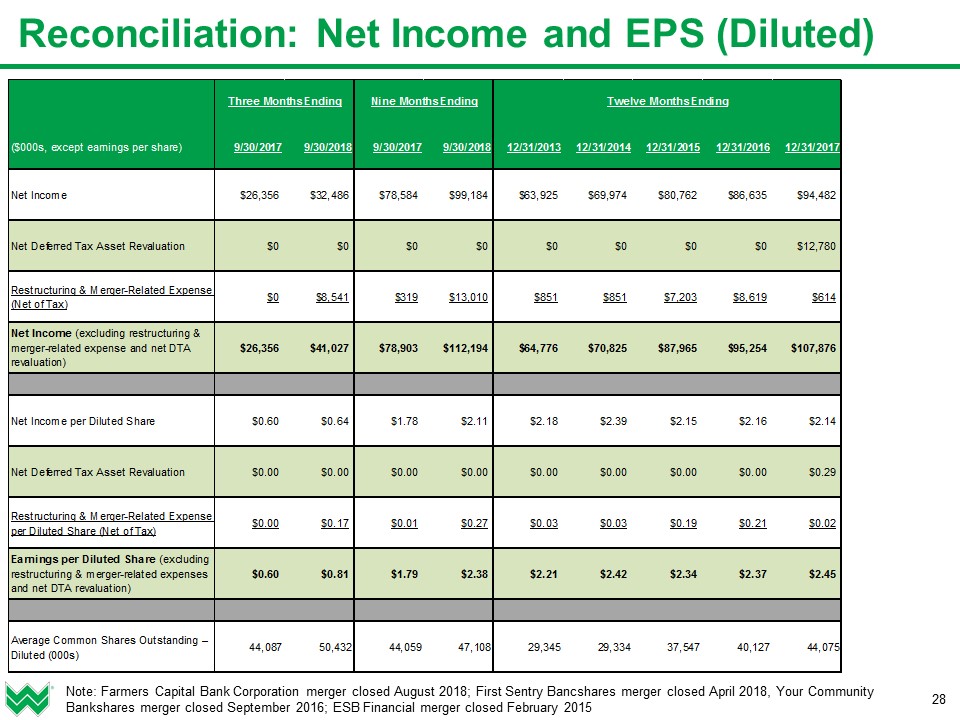
Reconciliation: Net Income and EPS (Diluted) 28 Note: Farmers Capital Bank Corporation merger closed August 2018; First Sentry Bancshares merger closed April 2018, Your Community Bankshares merger closed September 2016; ESB Financial merger closed February 2015
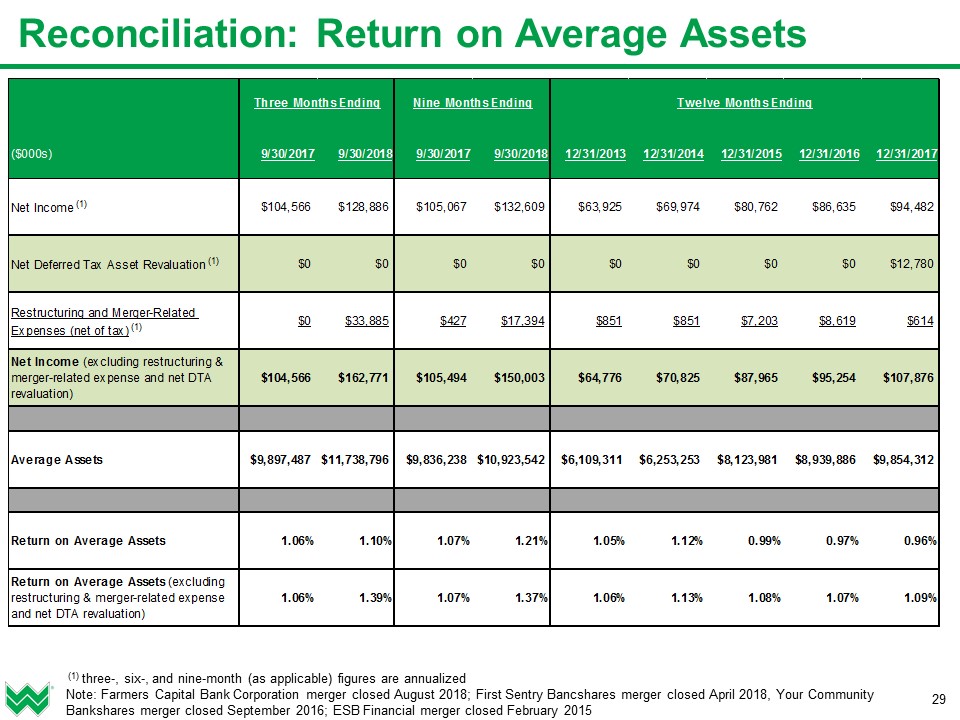
29 (1) three-, six-, and nine-month (as applicable) figures are annualizedNote: Farmers Capital Bank Corporation merger closed August 2018; First Sentry Bancshares merger closed April 2018, Your Community Bankshares merger closed September 2016; ESB Financial merger closed February 2015 Reconciliation: Return on Average Assets

30 (1) three-, six-, and nine-month (as applicable) figures are annualized; amortization of intangibles tax effected at 21% during 2018 and 35% for all prior periodsNote: Farmers Capital Bank Corporation merger closed August 2018; First Sentry Bancshares merger closed April 2018, Your Community Bankshares merger closed September 2016; ESB Financial merger closed February 2015 Reconciliation: Return on Average Tangible Equity
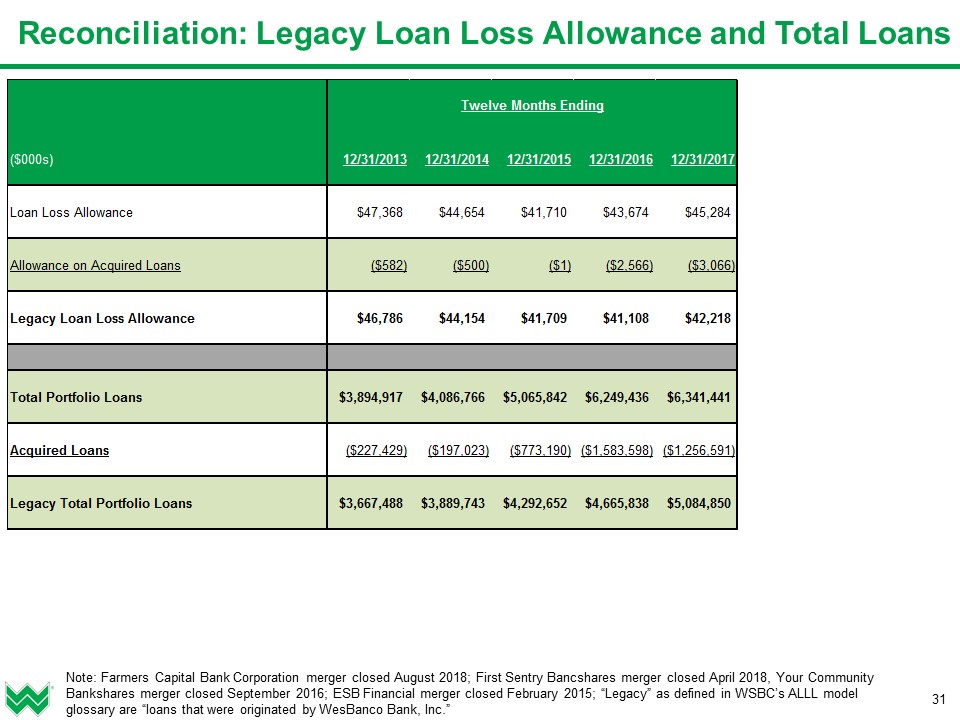
31 Note: Farmers Capital Bank Corporation merger closed August 2018; First Sentry Bancshares merger closed April 2018, Your Community Bankshares merger closed September 2016; ESB Financial merger closed February 2015; “Legacy” as defined in WSBC’s ALLL model glossary are “loans that were originated by WesBanco Bank, Inc.” Reconciliation: Legacy Loan Loss Allowance and Total Loans