Attached files
| file | filename |
|---|---|
| EX-99.3 - EXHIBIT 99.3 - TerraForm Power NY Holdings, Inc. | exh_993.htm |
| EX-99.1 - PRESS RELEASE - TerraForm Power NY Holdings, Inc. | exh_991.htm |
| 8-K - FORM 8-K - TerraForm Power NY Holdings, Inc. | f8k_110818.htm |
EXHIBIT 99.2
TERRAFORM POWER Q3 2018 Supplemental Three Months Ended September 30, 2018 Information
2 CAUTIONARY STATEMENT REGARDING FORWARD - LOOKING STATEMENTS This Supplemental Information contains forward - looking statements within the meaning of Section 27A of the Securities Act of 193 3, as amended (the “Securities Act”) and Section 21E of the Securities Exchange Act of 1934, as amended (the “Exchange Act”). Forward - looking statements can be identified by the fact that they do not relate strictly to historical or current facts. These statements involve estimates, expectations, projections, go als , assumptions, known and unknown risks, and uncertainties and typically include words or variations of words such as “expect,” “anticipate,” “believe,” “inten d,” “plan,” “seek,” “estimate,” “predict,” “project,” “goal,” “guidance,” “outlook,” “objective,” “forecast,” “target,” “potential,” “continue,” “would,” “will,” “shoul d,” “could,” or “may” or other comparable terms and phrases. All statements that address operating performance, events, or developments that the Company expects or anticipat es will occur in the future are forward - looking statements. They may include estimates of expected cash available for distribution, earnings, revenues, capital expenditures, liquidity, capital structure, future growth, financing arrangements and other financial performance items (including future dividends per share) , d escriptions of management’s plans or objectives for future operations, products, or services, or descriptions of assumptions underlying any of the above. Forwa rd - looking statements provide the Company’s current expectations or predictions of future conditions, events, or results and speak only as of the date they are ma de. Although the Company believes its expectations and assumptions are reasonable, it can give no assurance that these expectations and assumptions wi ll prove to have been correct and actual results may vary materially. Important factors that could cause actual results to differ materially from our expectations, or cautionary statements, are l ist ed below and further disclosed in our most recent Annual Report on Form 10 - K and quarter reports on Form 10 - Q. Such factors include, but are not limited to: risks rel ated to the transition to Brookfield Asset Management Inc. sponsorship, including our ability to realize the expected benefits of the sponsorship; risks related t o w ind conditions at our wind assets or to weather conditions at our solar assets; risks related to the effectiveness of our internal controls over financial reporti ng; pending and future litigation; the willingness and ability of counterparties to fulfill their obligations under offtake agreements; price fluctuations, terminat ion provisions and buyout provisions in offtake agreements; our ability to enter into contracts to sell power on acceptable prices and terms, including as our offtak e a greements expire; our ability to compete against traditional and renewable energy companies; government regulation, including compliance with regulatory and p erm it requirements and changes in tax laws, market rules, rates, tariffs, environmental laws and policies affecting renewable energy; the condition of the d ebt and equity capital markets and our ability to borrow additional funds and access capital markets, as well as our substantial indebtedness and the possibility th at we may incur additional indebtedness in the future; operating and financial restrictions placed on us and our subsidiaries related to agreements governing indebte dne ss; risks related to our ability to successfully integrate the operations, technologies and personnel of Saeta Yield, S.A.; government regulation regulating the ret urn of renewable energy facilities in Spain, including Saeta’s wind and solar assets, any reduction of which could have a material negative impact on the results o f o ur operations; our ability to successfully identify, evaluate and consummate acquisitions; our ability to integrate the projects we acquire from third part ies , including Saeta Yield, S.A., or otherwise and our ability to realize the anticipated benefits from such acquisitions and our ability to realize the benefit o f o ur cost and performance enhancement initiatives, including the long term service agreements with an affiliate of General Electric. The Company disclaims any obligation to publicly update or revise any forward - looking statement to reflect changes in underlying assumptions, factors, or expectations, new information, data, or methods, future events, or other changes, except as required by law. The foregoing li st of factors that might cause results to differ materially from those contemplated in the forward - looking statements is not exhaustive and should be considered in con nection with information regarding risks and uncertainties, which are described in our most recent Annual Report on Form 10 - K and subsequent Quarterly Report on Fo rm 10 - Q, as well as additional factors we may describe from time to time in other filings with the Securities and Exchange Commission (the “SEC”). We operat e i n a competitive and rapidly changing environment. New risks and uncertainties emerge from time to time, and you should understand that it is not possible to predict or identify all such factors and, consequently, you should not consider any such list to be a complete set of all potential risks or uncertainties. This Supplemental Information contains references to Adjusted Revenue, Adjusted EBITDA and cash available for distribution (“ CAF D”), which are Non - GAAP measures that should not be viewed as alternatives to GAAP measures of performance, including revenue, net income (loss), ope rat ing income or net cash provided by operating activities. Our definitions and calculation of these Non - GAAP measures may differ from definitions of Adj usted Revenue, Adjusted EBITDA and CAFD or other similarly titled measures used by other companies. We believe that Adjusted Revenue, Adjusted EBITDA and CA FD are useful supplemental measures that may assist investors in assessing the financial performance of the Company. None of these Non - GAAP measures should be considered as the sole measure of our performance, nor should they be considered in isolation from, or as a substitute for, analysis of our financia l s tatements prepared in accordance with GAAP, which are available on our website at www.terraform.com, as well as at www.sec.gov.

3 Q3 2018 HIGHLIGHTS Executing our Business Plan • Progressed the implementation of a Framework Agreement with an affiliate of General Electric (“GE”) in respect of Long Term Service Agreements (“LTSAs”) for turbine operations and maintenance (“O&M”) and other balance of plant services for our 1.6 GW North American wind fleet. • Successfully commissioned the battery energy storage replacement project in Hawaii on budget and ahead of schedule • Commenced our solar performance improvement plan this summer. After performing irradiation scans of our North American solar assets, we have identified opportunities to increase production by 45 GWh, which we believe corresponds to $7.5 million in additional potential annual revenue. • Closed project financing of certain unencumbered assets in North America yielding net proceeds of ~$77 million • Closed a € 50 million upfinancing of the Montegordo wind farm in Spain, yielding net proceeds of € 12 million • Executed amendments to our existing $600 million revolver to bring pricing terms in - line with our Term Loan B and cancelled Saeta’s corporate credit facility yielding $3 million of annual savings • Approved quarterly dividend of $0.19 per share, $0.76 per share on an annualized basis – consistent with guidance
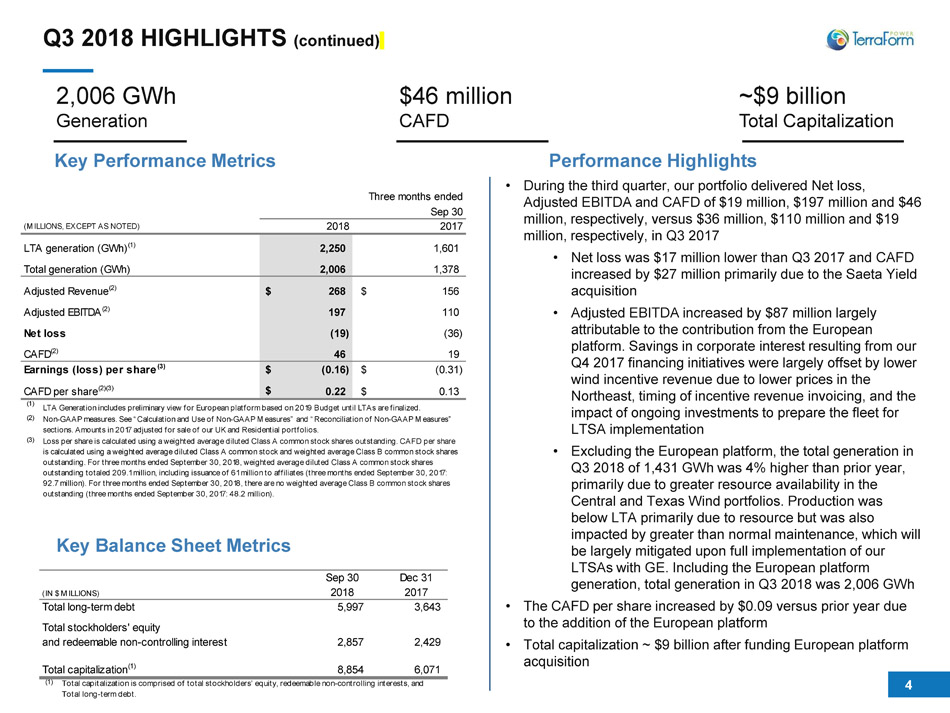
4 Q3 2018 HIGHLIGHTS (continued) Key Balance Sheet Metrics Performance Highlights 2,006 GWh Generation ~$9 billion Total Capitalization $46 million CAFD • During the third quarter, our portfolio delivered Net loss, Adjusted EBITDA and CAFD of $19 million, $197 million and $46 million, respectively , versus $36 million, $110 million and $19 million, respectively, in Q3 2017 • Net loss was $17 million lower than Q3 2017 and CAFD increased by $27 million primarily due to the Saeta Yield acquisition • Adjusted EBITDA increased by $87 million largely attributable to the contribution from the European platform. Savings in corporate interest resulting from our Q4 2017 financing initiatives were largely offset by lower wind incentive revenue due to lower prices in the Northeast, timing of incentive revenue invoicing, and the impact of ongoing investments to prepare the fleet for LTSA implementation • Excluding the European platform, the total generation in Q3 2018 of 1,431 GWh was 4% higher than prior year, primarily due to greater resource availability in the Central and Texas Wind portfolios. Production was below LTA primarily due to resource but was also impacted by greater than normal maintenance, which will be largely mitigated upon full implementation of our LTSAs with GE . Including the European platform generation, total generation in Q3 2018 was 2,006 GWh • The CAFD per share increased by $0.09 versus prior year due to the addition of the European platform • Total capitalization ~ $9 billion after funding European platform acquisition Key Performance Metrics Sep 30 Dec 31 2018 2017 5,997 3,643 2,857 2,429 8,854 6,071 (1) Total stockholders' equity and redeemable non-controlling interest Total capitalization is comprised of total stockholders’ equity, redeemable non-controlling interests, and Total long-term debt. (IN $ MILLIONS) Total long-term debt Total capitalization(1) 2018 2017 2,250 1,601 2,006 1,378 $ 268 $ 156 197 110 (19) (36) 46 19 $ (0.16) $ (0.31) $ 0.22 $ 0.13 LTA Generation includes preliminary view for European platform based on 2019 Budget until LTAs are finalized. (1) (3) Earnings (loss) per share(3) CAFD per share(2)(3) Three months ended Sep 30 CAFD(2) Net loss LTA generation (GWh)(1) Adjusted EBITDA(2) Adjusted Revenue(2) (2) Non-GAAP measures. See “Calculation and Use of Non-GAAP Measures” and “Reconciliation of Non-GAAP Measures” sections. Amounts in 2017 adjusted for sale of our UK and Residential portfolios. Loss per share is calculated using a weighted average diluted Class A common stock shares outstanding. CAFD per share is calculated using a weighted average diluted Class A common stock and weighted average Class B common stock shares outstanding. For three months ended September 30, 2018, weighted average diluted Class A common stock shares outstanding totaled 209.1 million, including issuance of 61 million to affiliates (three months ended September 30, 2017: 92.7 million). For three months ended September 30, 2018, there are no weighted average Class B common stock shares outstanding (three months ended September 30, 2017: 48.2 million). (MILLIONS, EXCEPT AS NOTED) Total generation (GWh)
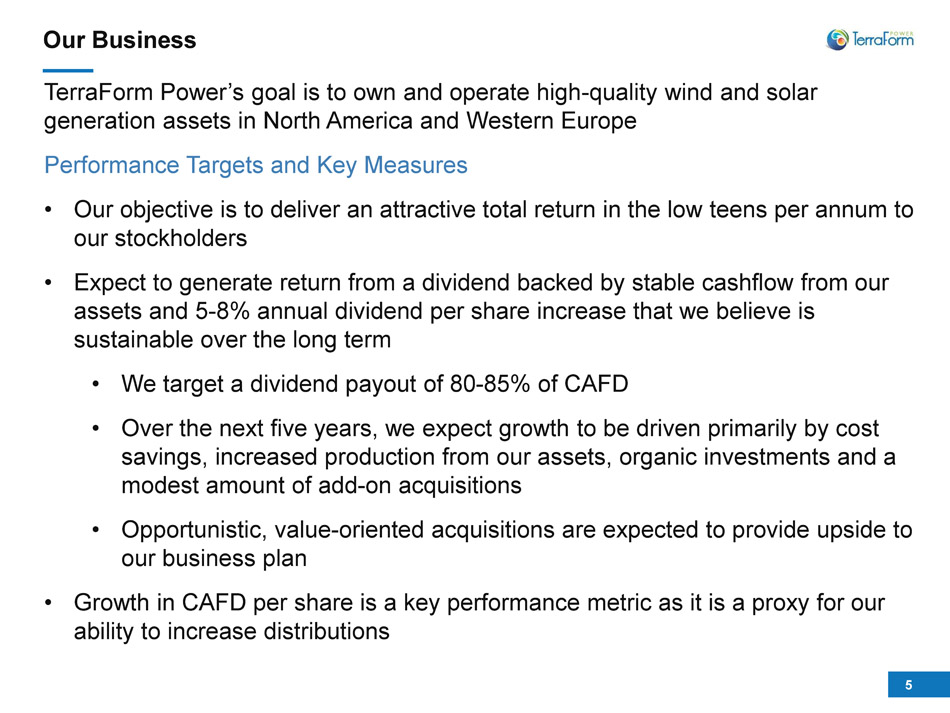
5 Our Business TerraForm Power’s goal is to own and operate high - quality wind and solar generation assets in North America and Western Europe Performance Targets and Key Measures • Our objective is to deliver an attractive total return in the low teens per annum to our stockholders • Expect to generate return from a dividend backed by stable cashflow from our assets and 5 - 8% annual dividend per share increase that we believe is sustainable over the long term • We target a dividend payout of 80 - 85% of CAFD • Over the next five years, we expect growth to be driven primarily by cost savings, increased production from our assets, organic investments and a modest amount of add - on acquisitions • Opportunistic, value - oriented acquisitions are expected to provide upside to our business plan • Growth in CAFD per share is a key performance metric as it is a proxy for our ability to increase distributions
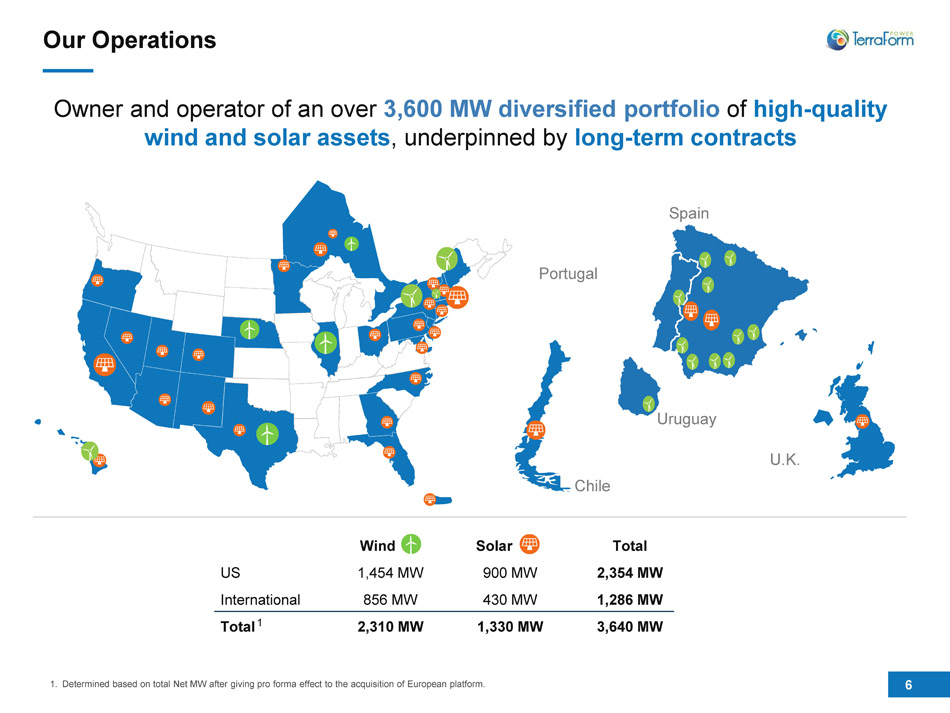
6 Wind Solar Total US 1,454 MW 900 MW 2,354 MW International 856 MW 430 MW 1,286 MW Total 2,310 MW 1,330 MW 3,640 MW Our Operations Owner and operator of an over 3,600 MW diversified portfolio of high - quality wind and solar assets , underpinned by long - term contracts Spain Portugal Uruguay Chile U.K. 1 1. Determined based on total Net MW after giving pro forma effect to the acquisition of European platform.
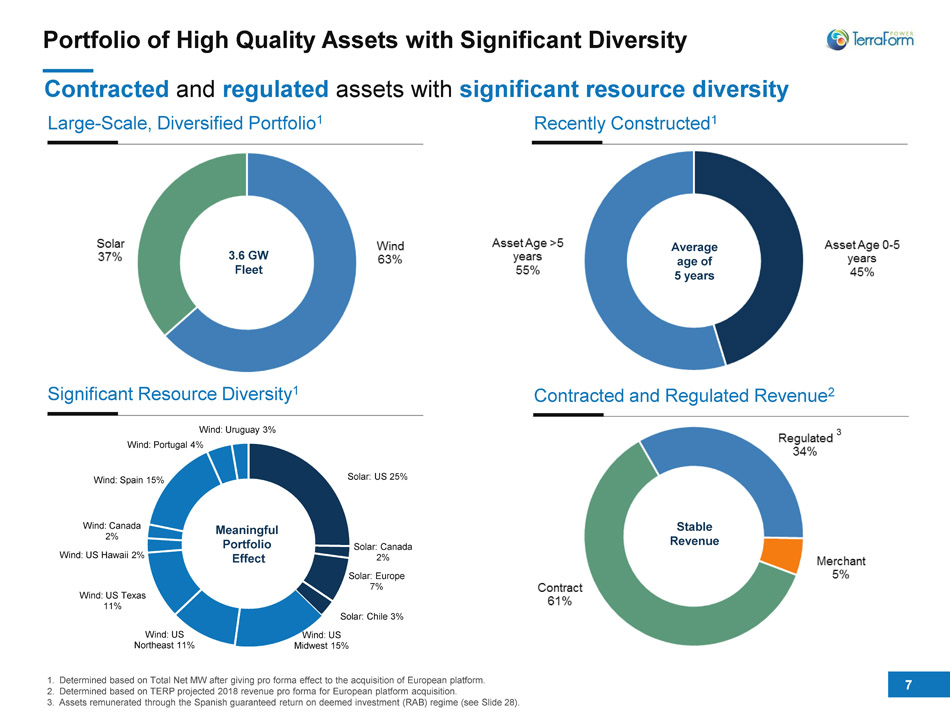
7 Portfolio of High Quality Assets with Significant Diversity 1. Determined based on Total Net MW after giving pro forma effect to the acquisition of European platform. 2. Determined based on TERP projected 2018 revenue pro forma for European platform acquisition. 3. Assets remunerated through the Spanish guaranteed return on deemed investment (RAB) regime (see Slide 28). Significant Resource D iversity 1 Solar: US 25% Solar: Canada 2% Solar: Europe 7% Solar: Chile 3% Wind: US Midwest 15% Wind: US Northeast 11% Wind: US Texas 11% Wind: US Hawaii 2% Wind: Canada 2% Wind: Spain 15% Wind: Portugal 4% Wind: Uruguay 3% Meaningful Portfolio Effect Large - Scale, Diversified Portfolio 1 Contracted and regulated assets with significant resource diversity Recently Constructed 1 Average age of 5 years 3.6 GW Fleet Contracted and Regulated Revenue 2 Stable Revenue 3
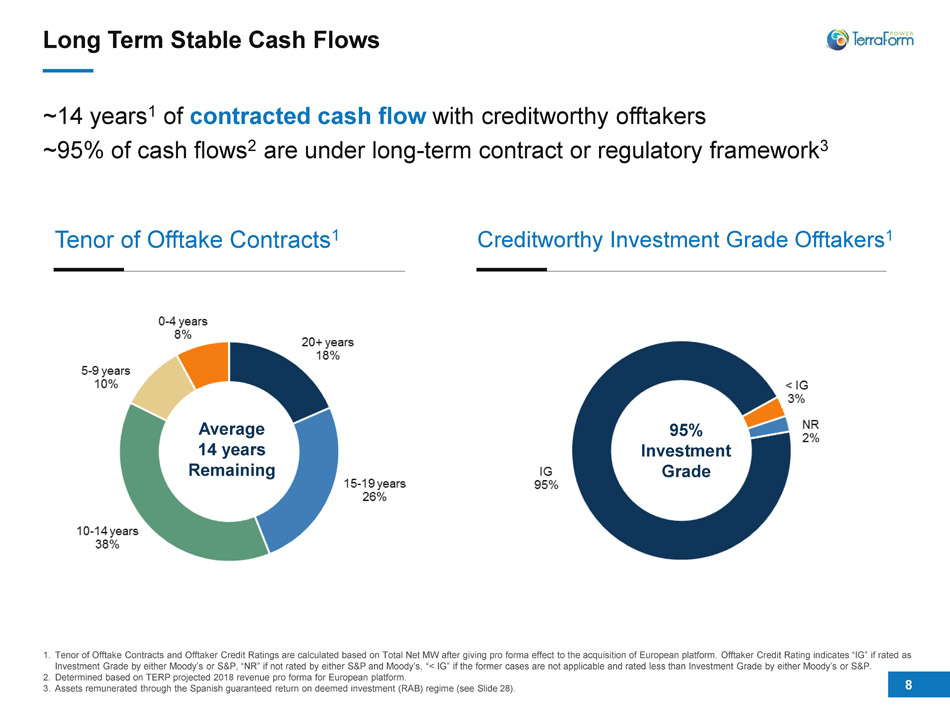
8 Tenor of Offtake Contracts 1 Creditworthy Investment Grade Offtakers 1 Long Term Stable Cash Flows ~14 years 1 of contracted cash flow with creditworthy offtakers ~95% of cash flows 2 are under long - term contract or regulatory framework 3 1. Tenor of Offtake Contracts and Offtaker Credit Ratings are calculated based on Total Net MW after giving pro forma effect to the acquisition of European platform. Offtaker Credit Rating indicates “IG” if rated as Investment Grade by either Moody’s or S&P, “NR” if not rated by either S&P and Moody’s, “< IG” if the former cases are not ap pli cable and rated less than Investment Grade by either Moody’s or S&P. 2. Determined based on TERP projected 2018 revenue pro forma for European platform. 3. Assets remunerated through the Spanish guaranteed return on deemed investment (RAB) regime (see Slide 28). Average 14 years Remaining 95% Investment Grade
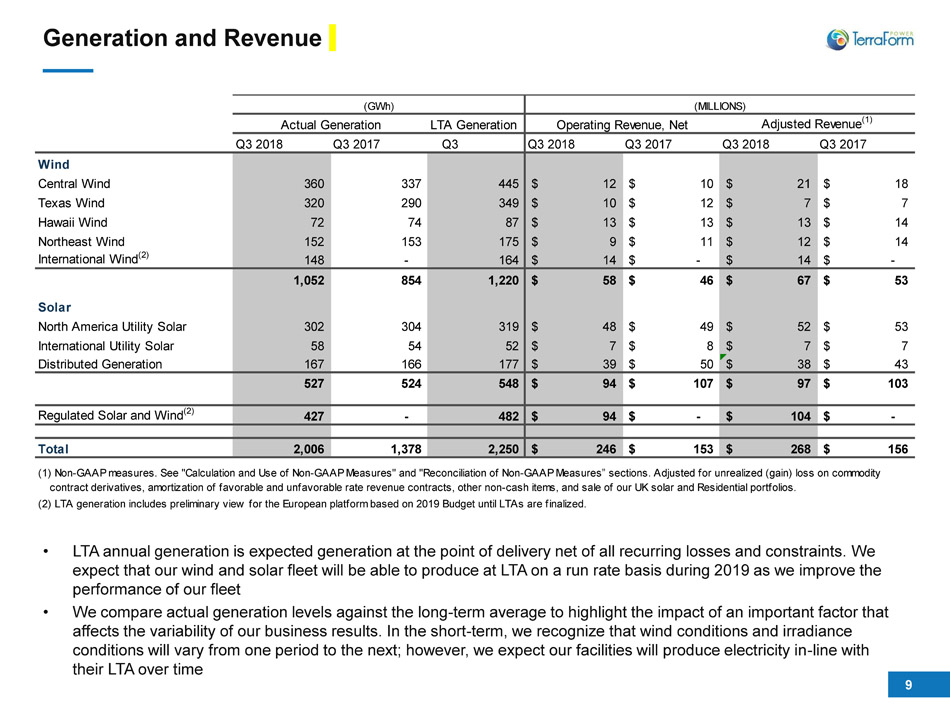
9 Generation and Revenue • LTA annual generation is expected generation at the point of delivery net of all recurring losses and constraints. We expect that our wind and solar fleet will be able to produce at LTA on a run rate basis during 2019 as we improve the performance of our fleet • We compare actual generation levels against the long - term average to highlight the impact of an important factor that affects the variability of our business results. In the short - term, we recognize that wind conditions and irradiance conditions will vary from one period to the next; however, we expect our facilities will produce electricity in - line with their LTA over time (GWh) (MILLIONS) Actual Generation LTA Generation Operating Revenue, Net Adjusted Revenue (1) Q3 2018 Q3 2017 Q3 Q3 2018 Q3 2017 Q3 2018 Q3 2017 Wind Central Wind 360 337 445 12$ 10$ 21$ 18$ Texas Wind 320 290 349 10$ 12$ 7$ 7$ Hawaii Wind 72 74 87 13$ 13$ 13$ 14$ Northeast Wind 152 153 175 9$ 11$ 12$ 14$ International Wind (2) 148 - 164 14$ -$ 14$ -$ 1,052 854 1,220 58$ 46$ 67$ 53$ Solar North America Utility Solar 302 304 319 48$ 49$ 52$ 53$ International Utility Solar 58 54 52 7$ 8$ 7$ 7$ Distributed Generation 167 166 177 39$ 50$ 38$ 43$ 527 524 548 94$ 107$ 97$ 103$ Regulated Solar and Wind (2) 427 - 482 94$ -$ 104$ -$ Total 2,006 1,378 2,250 246$ 153$ 268$ 156$ (2) LTA generation includes preliminary view for the European platform based on 2019 Budget until LTAs are finalized. (1) Non-GAAP measures. See "Calculation and Use of Non-GAAP Measures" and "Reconciliation of Non-GAAP Measures” sections. Adjusted for unrealized (gain) loss on commodity contract derivatives, amortization of favorable and unfavorable rate revenue contracts, other non-cash items, and sale of our UK solar and Residential portfolios.
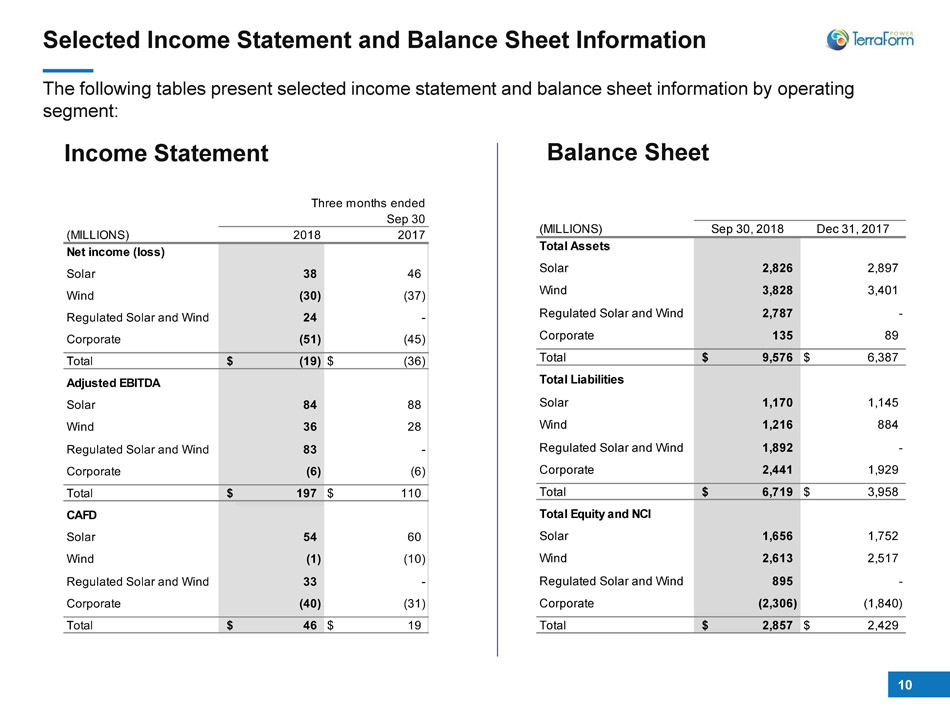
10 Selected Income Statement and Balance Sheet Information The following tables present selected income statement and balance sheet information by operating segment: Income Statement Balance Sheet 2,826 2,897 3,828 3,401 Regulated Solar and Wind 2,787 - 135 89 $ 9,576 $ 6,387 1,170 1,145 1,216 884 Regulated Solar and Wind 1,892 - 2,441 1,929 $ 6,719 $ 3,958 1,656 1,752 - 2,613 2,517 - Regulated Solar and Wind 895 - (2,306) (1,840) $ 2,857 $ 2,429 Dec 31, 2017 Total Assets Total Sep 30, 2018 Total Equity and NCI Total Liabilities Solar Wind Corporate Solar Wind Corporate Total Solar Wind Corporate Total (MILLIONS) 2018 2017 38 46 (30) (37) Regulated Solar and Wind 24 - (51) (45) $ (19) $ (36) 84 88 36 28 Regulated Solar and Wind 83 - (6) (6) $ 197 $ 110 54 60 (1) (10) Regulated Solar and Wind 33 - (40) (31) $ 46 $ 19Total Total CAFD Solar Wind Corporate Total Adjusted EBITDA Solar Wind Corporate (MILLIONS) Net income (loss) Solar Wind Corporate Three months ended Sep 30
11 Operating Segments
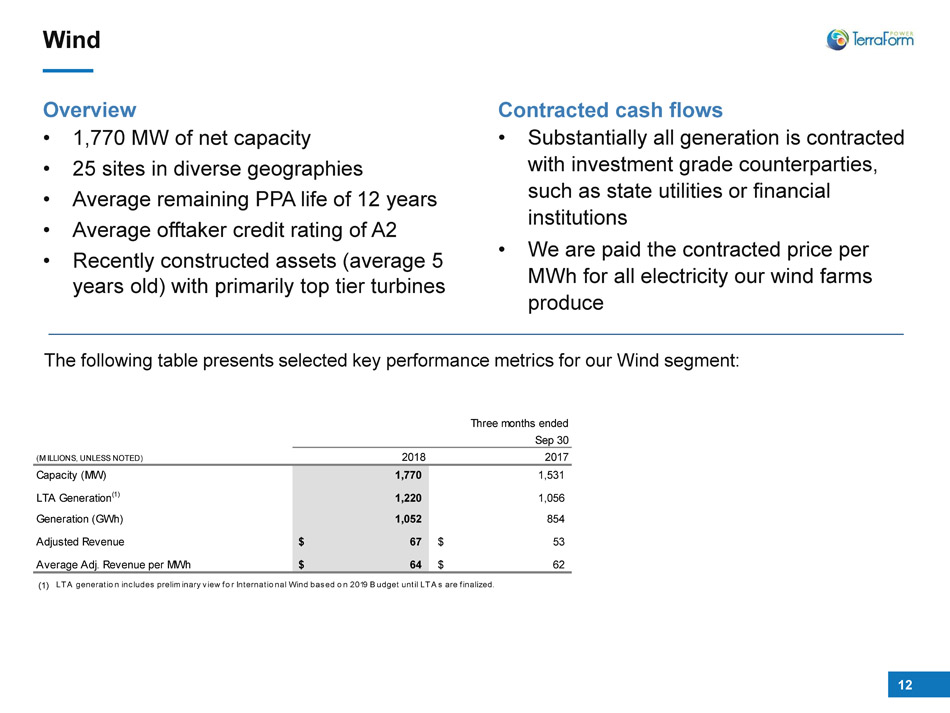
12 Wind Overview • 1,770 MW of net capacity • 25 sites in diverse geographies • Average remaining PPA life of 12 years • Average offtaker credit rating of A2 • Recently constructed assets (average 5 years old) with primarily top tier turbines Contracted cash flows • Substantially all generation is contracted with investment grade counterparties, such as state utilities or financial institutions • We are paid the contracted price per MWh for all electricity our wind farms produce The following table presents selected key performance metrics for our Wind segment: 2018 2017 1,770 1,531 1,220 1,056 1,052 854 $ 67 $ 53 $ 64 $ 62 (1) LTA generation includes preliminary view for International Wind based on 2019 Budget until LTAs are finalized. Three months ended Sep 30 (MILLIONS, UNLESS NOTED) Adjusted Revenue Average Adj. Revenue per MWh LTA Generation(1) Generation (GWh) Capacity (MW)
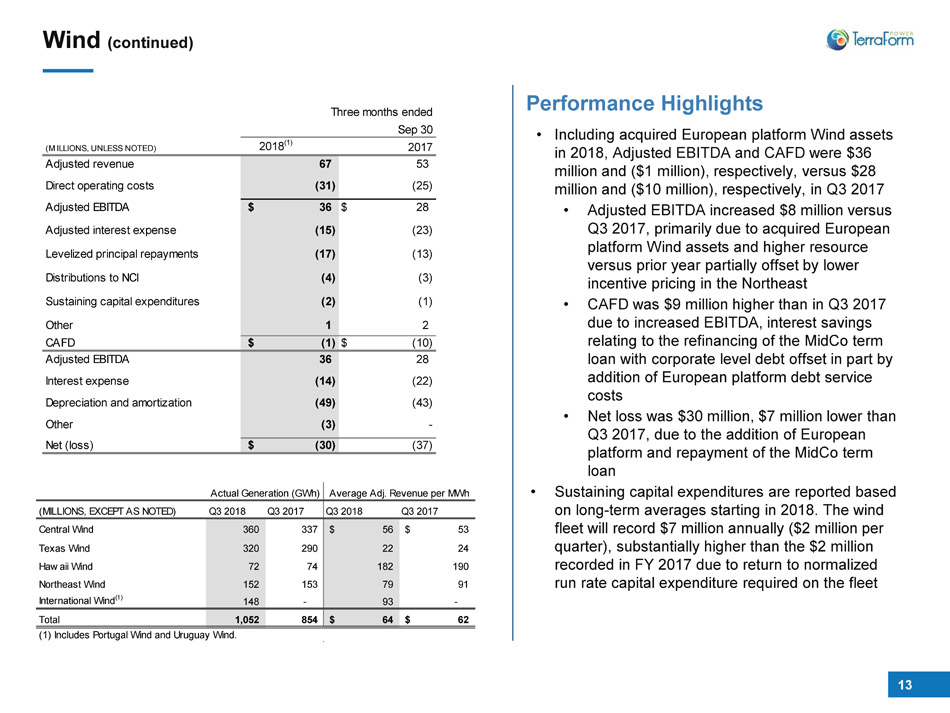
13 Wind (continued) Performance Highlights • Including acquired European platform Wind assets in 2018, Adjusted EBITDA and CAFD were $36 million and ($1 million), respectively, versus $28 million and ($10 million), respectively, in Q3 2017 • Adjusted EBITDA increased $8 million versus Q3 2017, primarily due to acquired European platform Wind assets and higher resource versus prior year partially offset by lower incentive pricing in the Northeast • CAFD was $9 million higher than in Q3 2017 due to increased EBITDA, interest savings relating to the refinancing of the MidCo term loan with corporate level debt offset in part by addition of European platform debt service costs • Net loss was $30 million, $7 million lower than Q3 2017, due to the addition of European platform and repayment of the MidCo term loan • Sustaining capital expenditures are reported based on long - term averages starting in 2018. The wind fleet will record $7 million annually ($2 million per quarter), substantially higher than the $2 million recorded in FY 2017 due to return to normalized run rate capital expenditure required on the fleet Actual Generation (GWh) Average Adj. Revenue per MWh (MILLIONS, EXCEPT AS NOTED) Q3 2018 Q3 2017 Q3 2018 Q3 2017 Central Wind 360 337 56$ 53$ Texas Wind 320 290 22 24 Hawaii Wind 72 74 182 190 Northeast Wind 152 153 79 91 International Wind(1) 148 - 93 - Total 1,052 854 64$ 62$ (1) Includes Portugal Wind and Uruguay Wind. 2018(1) 2017 67 53 (31) (25) $ 36 $ 28 (15) (23) (17) (13) (4) (3) Sustaining capital expenditures (2) (1) 1 2 $ (1)$ (10) 36 28 (14) (22) (49) (43) (3) - $ (30) (37) Adjusted EBITDA Adjusted interest expense Levelized principal repayments Distributions to NCI Other Other Net (loss) CAFD Adjusted EBITDA Interest expense Depreciation and amortization Three months ended Sep 30 (MILLIONS, UNLESS NOTED) Adjusted revenue Direct operating costs
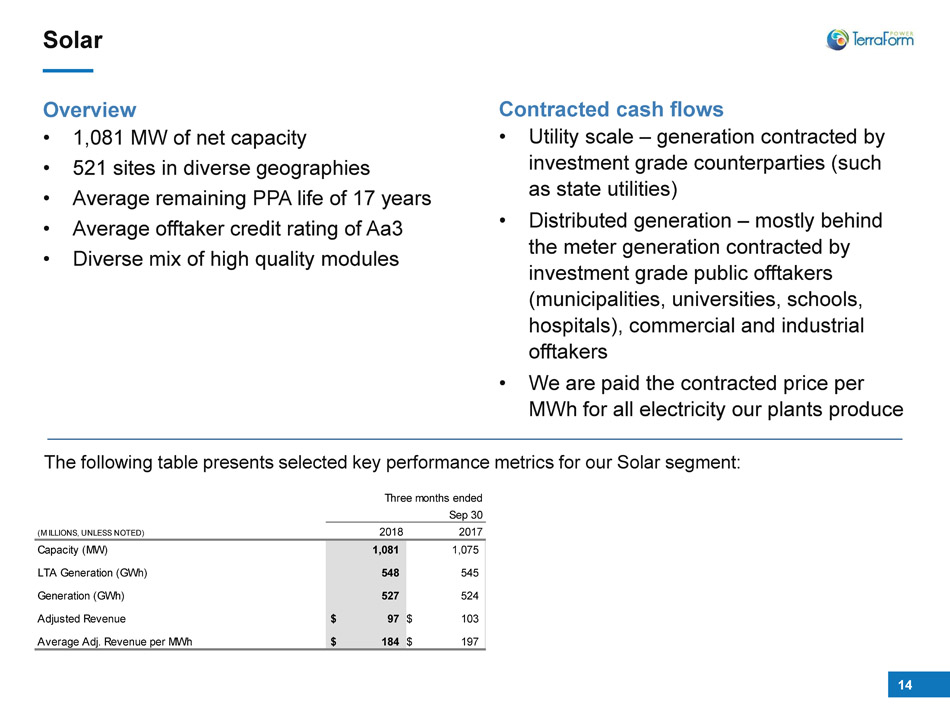
14 Solar The following table presents selected key performance metrics for our Solar segment: Overview • 1,081 MW of net capacity • 521 sites in diverse geographies • Average remaining PPA life of 17 years • Average offtaker credit rating of Aa3 • Diverse mix of high quality modules Contracted cash flows • Utility scale – generation contracted by investment grade counterparties (such as state utilities) • Distributed generation – mostly behind the meter generation contracted by investment grade public offtakers (municipalities, universities, schools, hospitals), commercial and industrial offtakers • We are paid the contracted price per MWh for all electricity our plants produce 2018 2017 1,081 1,075 548 545 527 524 $ 97 $ 103 $ 184 $ 197 Three months ended Sep 30 (MILLIONS, UNLESS NOTED) Average Adj. Revenue per MWh Adjusted Revenue Generation (GWh) LTA Generation (GWh) Capacity (MW)
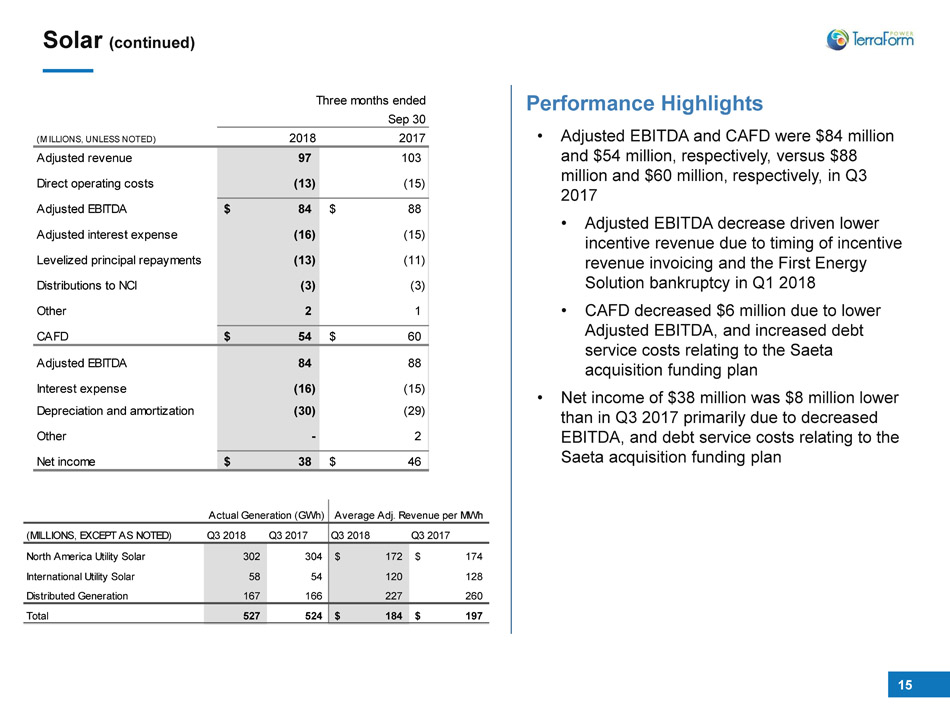
15 Solar (continued) • Adjusted EBITDA and CAFD were $84 million and $54 million, respectively, versus $88 million and $60 million, respectively, in Q3 2017 • Adjusted EBITDA decrease driven lower incentive revenue due to timing of incentive revenue invoicing and the First Energy Solution bankruptcy in Q1 2018 • CAFD decreased $6 million due to lower Adjusted EBITDA, and increased debt service costs relating to the Saeta acquisition funding plan • Net income of $38 million was $8 million lower than in Q3 2017 primarily due to decreased EBITDA, and debt service costs relating to the Saeta acquisition funding plan Performance Highlights Actual Generation (GWh) Average Adj. Revenue per MWh (MILLIONS, EXCEPT AS NOTED) Q3 2018 Q3 2017 Q3 2018 Q3 2017 North America Utility Solar 302 304 172$ 174$ International Utility Solar 58 54 120 128 Distributed Generation 167 166 227 260 Total 527 524 184$ 197$ 2018 2017 97 103 (13) (15) $ 84 $ 88 (16) (15) (13) (11) (3) (3) 2 1 $ 54 $ 60 84 88 (16) (15) (30) (29) - 2 $ 38 $ 46 Sep 30 Three months ended Depreciation and amortization Other Net income (MILLIONS, UNLESS NOTED) Adjusted revenue Direct operating costs Adjusted EBITDA Adjusted interest expense Levelized principal repayments Distributions to NCI Other CAFD Adjusted EBITDA Interest expense
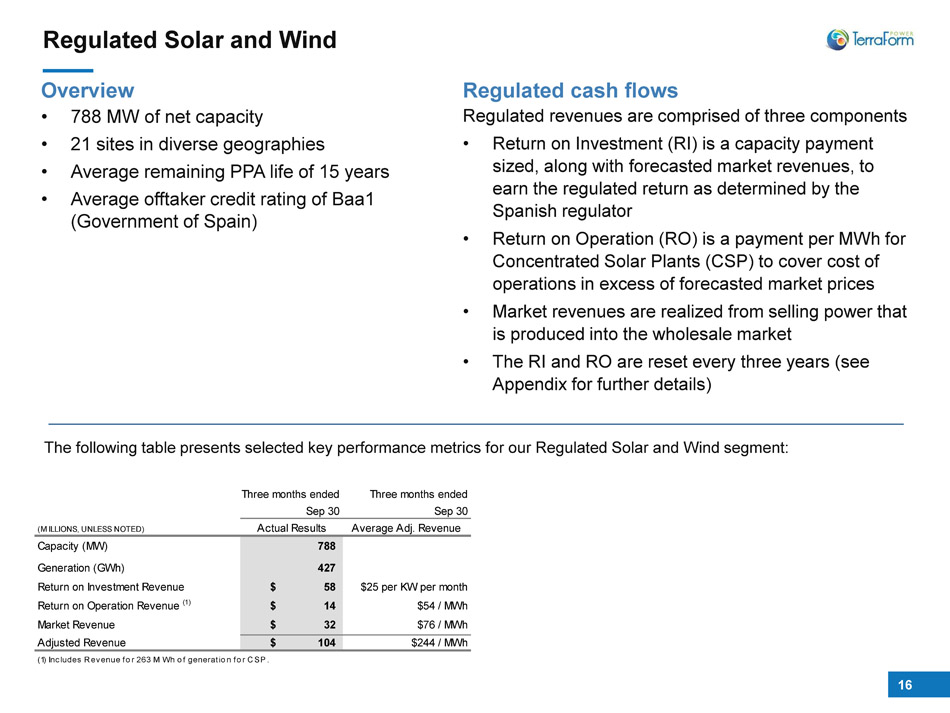
16 Regulated Solar and Wind Overview • 788 MW of net capacity • 21 sites in diverse geographies • Average remaining PPA life of 15 years • Average offtaker credit rating of Baa1 (Government of Spain) Regulated cash flows Regulated revenues are comprised of three components • Return on Investment (RI) is a capacity payment sized, along with forecasted market revenues, to earn the regulated return as determined by the Spanish regulator • Return on Operation (RO) is a payment per MWh for Concentrated Solar Plants (CSP) to cover cost of operations in excess of forecasted market prices • Market revenues are realized from selling power that is produced into the wholesale market • The RI and RO are reset every three years (see Appendix for further details) The following table presents selected key performance metrics for our Regulated Solar and Wind segment: 788 427 Return on Investment Revenue $ 58 $25 per KW per month Return on Operation Revenue (1) $ 14 $54 / MWh Market Revenue $ 32 $76 / MWh Adjusted Revenue $ 104 $244 / MWh (1) Includes Revenue for 263 MWh of generation for CSP. Generation (GWh) Three months ended Sep 30 (MILLIONS, UNLESS NOTED) Capacity (MW) Actual Results Three months ended Sep 30 Average Adj. Revenue
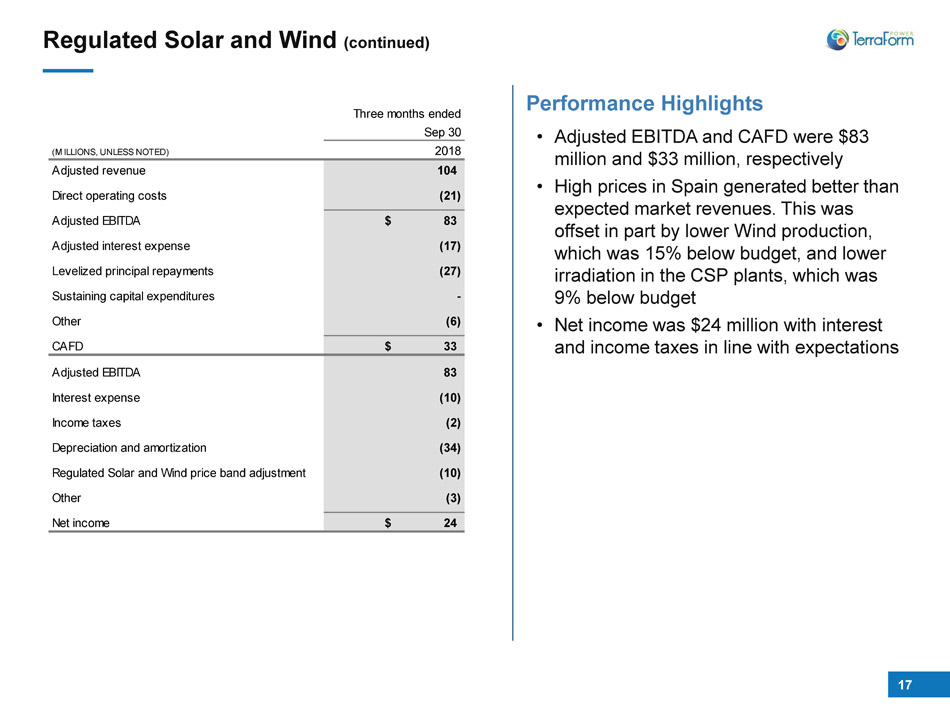
17 Regulated Solar and Wind (continued) Performance Highlights • Adjusted EBITDA and CAFD were $83 million and $33 million, respectively • High prices in Spain generated better than expected market revenues. This was offset in part by l ower Wind production, which was 15% below budget, and lower irradiation in the CSP plants, which was 9% below budget • Net income was $24 million with interest and income taxes in line with expectations 2018 104 (21) $ 83 (17) (27) Sustaining capital expenditures - (6) $ 33 83 (10) (2) (34) Regulated Solar and Wind price band adjustment (10) (3) $ 24 Three months ended Sep 30 Other CAFD (MILLIONS, UNLESS NOTED) Adjusted revenue Direct operating costs Adjusted EBITDA Adjusted interest expense Levelized principal repayments Depreciation and amortization Other Net income Adjusted EBITDA Interest expense Income taxes
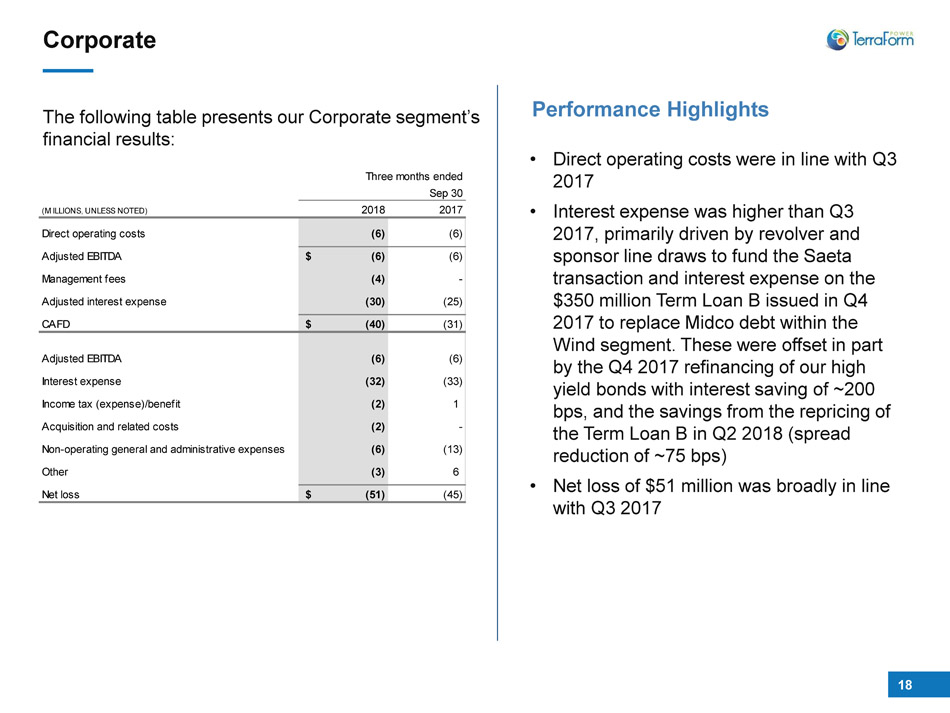
18 Corporate The following table presents our Corporate segment’s financial results: Performance Highlights • Direct operating costs were in line with Q3 2017 • Interest expense was higher than Q3 2017, primarily driven by revolver and sponsor line draws to fund the Saeta transaction and interest expense on the $350 million Term Loan B issued in Q4 2017 to replace Midco debt within the Wind segment. These were offset in part by the Q4 2017 refinancing of our high yield bonds with interest saving of ~200 bps, and the savings from the repricing of the Term Loan B in Q2 2018 (spread reduction of ~75 bps) • Net loss of $51 million was broadly in line with Q3 2017 2018 2017 (6) (6) $ (6)$ (6) (4) - (30) (25) $ (40)$ (31) (6) (6) (32) (33) (2) 1 (2) - (6) (13) (3) 6 $ (51) (45) Three months ended Sep 30 (MILLIONS, UNLESS NOTED) Direct operating costs Adjusted EBITDA Management fees Income tax (expense)/benefit Acquisition and related costs Other Net loss Adjusted interest expense CAFD Adjusted EBITDA Interest expense Non-operating general and administrative expenses
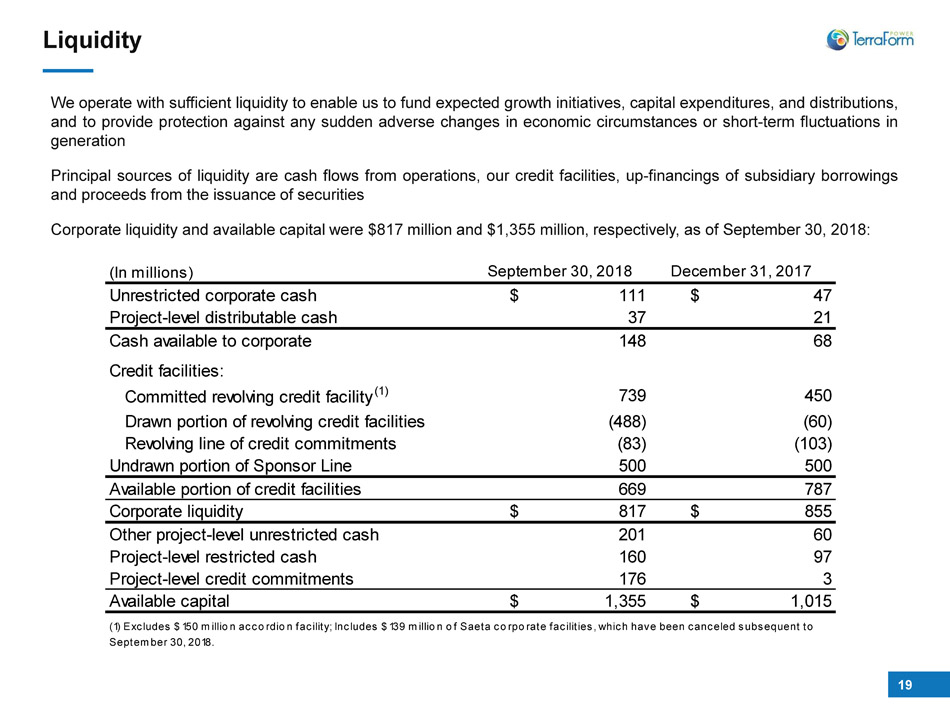
19 We operate with sufficient liquidity to enable us to fund expected growth initiatives, capital expenditures, and distributions, and to provide protection against any sudden adverse changes in economic circumstances or short - term fluctuations in generation Principal sources of liquidity are cash flows from operations, our credit facilities, up - financings of subsidiary borrowings and proceeds from the issuance of securities Corporate liquidity and available capital were $ 817 million and $ 1 , 355 million, respectively, as of September 30 , 2018 : Liquidity (In millions) Unrestricted corporate cash $ 111 $ 47 Project-level distributable cash Cash available to corporate Credit facilities: Committed revolving credit facility (1) Drawn portion of revolving credit facilities Revolving line of credit commitments Undrawn portion of Sponsor Line Available portion of credit facilities Corporate liquidity $ 817 $ 855 Other project-level unrestricted cash 201 Project-level restricted cash 160 Project-level credit commitments 176 Available capital $ 1,355 $ 1,015 September 30, 2018 December 31, 2017 37 21 148 68 739 450 (488) (60) (1) Excludes $150 million accordion facility; Includes $139 million of Saeta corporate facilities, which have been canceled subsequent to September 30, 2018. 60 97 3 (83) (103) 500 500 669 787
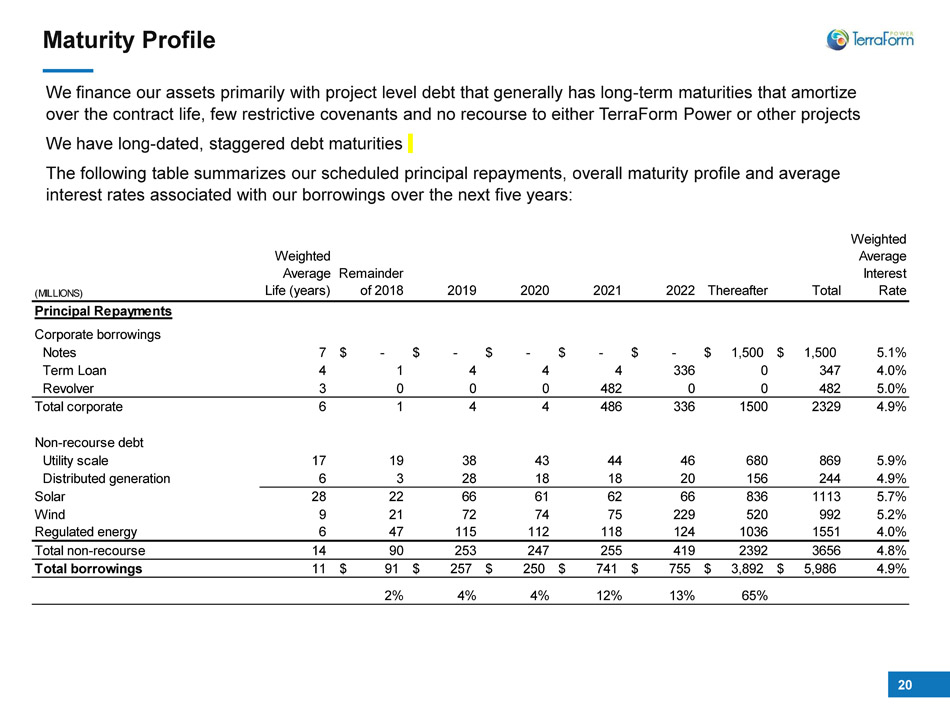
20 Maturity Profile We finance our assets primarily with project level debt that generally has long - term maturities that amortize over the contract life, few restrictive covenants and no recourse to either TerraForm Power or other projects We have long - dated, staggered debt maturities The following table summarizes our scheduled principal repayments, overall maturity profile and average interest rates associated with our borrowings over the next five years: (MILLIONS) Weighted Average Life (years) Remainder of 2018 2019 2020 2021 2022 Thereafter Total Weighted Average Interest Rate Principal Repayments Corporate borrowings Notes 7 -$ -$ -$ -$ -$ 1,500$ 1,500$ 5.1% Term Loan 4 1 4 4 4 336 0 347 4.0% Revolver 3 0 0 0 482 0 0 482 5.0% Total corporate 6 1 4 4 486 336 1500 2329 4.9% Non-recourse debt Utility scale 17 19 38 43 44 46 680 869 5.9% Distributed generation 6 3 28 18 18 20 156 244 4.9% Solar 28 22 66 61 62 66 836 1113 5.7% Wind 9 21 72 74 75 229 520 992 5.2% Regulated energy 6 47 115 112 118 124 1036 1551 4.0% Total non-recourse 14 90 253 247 255 419 2392 3656 4.8% Total borrowings 11 91$ 257$ 250$ 741$ 755$ 3,892$ 5,986$ 4.9% 2% 4% 4% 12% 13% 65%
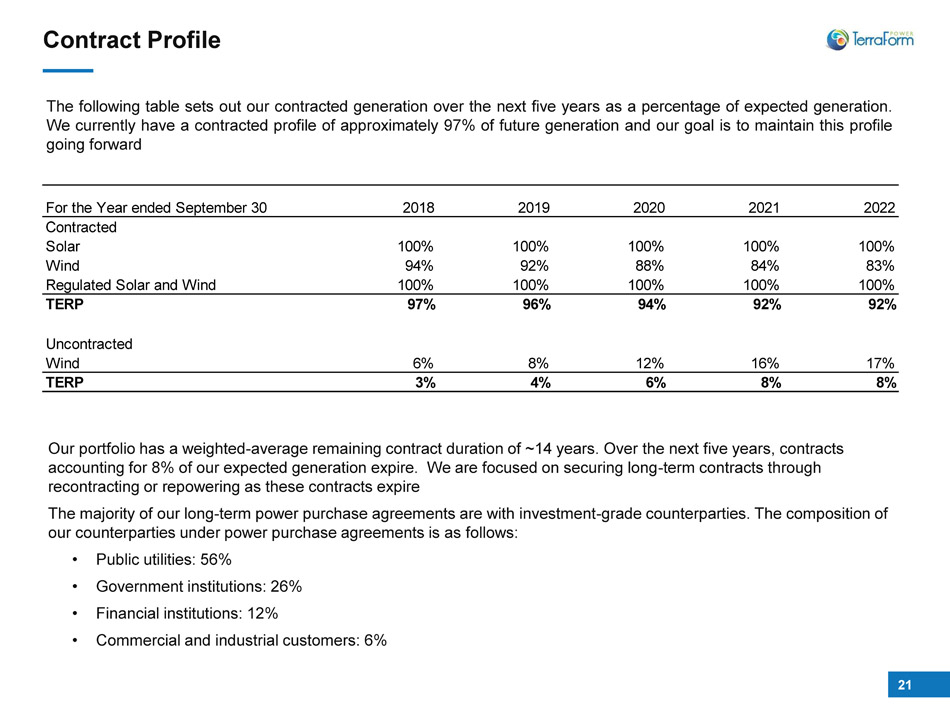
21 Our portfolio has a weighted - average remaining contract duration of ~14 years. Over the next five years, contracts accounting for 8% of our expected generation expire. We are focused on securing long - term contracts through recontracting or repowering as these contracts expire The majority of our long - term power purchase agreements are with investment - grade counterparties. The composition of our counterparties under power purchase agreements is as follows: • Public utilities: 56% • Government institutions: 26% • Financial institutions: 12% • Commercial and industrial customers: 6% The following table sets out our contracted generation over the next five years as a percentage of expected generation . We currently have a contracted profile of approximately 97 % of future generation and our goal is to maintain this profile going forward Contract Profile For the Year ended September 30 2018 2019 2020 2021 2022 Contracted Solar 100% 100% 100% 100% 100% Wind 94% 92% 88% 84% 83% Regulated Solar and Wind 100% 100% 100% 100% 100% TERP 97% 96% 94% 92% 92% Uncontracted Wind 6% 8% 12% 16% 17% TERP 3% 4% 6% 8% 8%
22 Appendix 1 - Reconciliation of Non - GAAP Measures
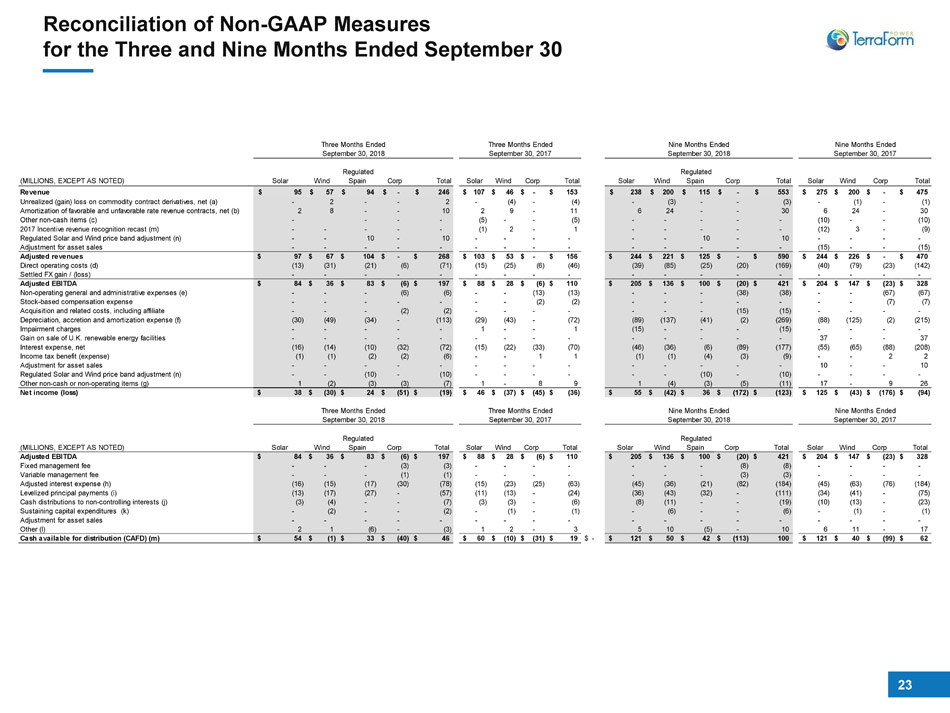
23 Reconciliation of Non - GAAP Measures for the Three and Nine Months Ended September 30 Three Months Ended Three Months Ended Nine Months Ended Nine Months Ended September 30, 2018 September 30, 2017 September 30, 2018 September 30, 2017 (MILLIONS, EXCEPT AS NOTED) Solar Wind Regulated Spain Corp Total Solar Wind Corp Total Solar Wind Regulated Spain Corp Total Solar Wind Corp Total Revenue 95$ 57$ 94$ -$ 246$ 107$ 46$ -$ 153$ 238$ 200$ 115$ -$ 553$ 275$ 200$ -$ 475$ Unrealized (gain) loss on commodity contract derivatives, net (a) - 2 - - 2 - (4) - (4) - (3) - - (3) - (1) - (1) Amortization of favorable and unfavorable rate revenue contracts, net (b) 2 8 - - 10 2 9 - 11 6 24 - - 30 6 24 - 30 Other non-cash items (c) - - - - (5) - - (5) - - - - - (10) - - (10) 2017 Incentive revenue recognition recast (m) - - - - - (1) 2 - 1 - - - - - (12) 3 - (9) Regulated Solar and Wind price band adjustment (n) - - 10 - 10 - - - - - - 10 - 10 - - - - Adjustment for asset sales - - - - - - - - - - - - - - (15) - - (15) Adjusted revenues 97$ 67$ 104$ -$ 268$ 103$ 53$ -$ 156$ 244$ 221$ 125$ -$ 590$ 244$ 226$ -$ 470$ Direct operating costs (d) (13) (31) (21) (6) (71) (15) (25) (6) (46) (39) (85) (25) (20) (169) (40) (79) (23) (142) Settled FX gain / (loss) - - - - - - - - - - - - - - - - - - Adjusted EBITDA 84$ 36$ 83$ (6)$ 197$ 88$ 28$ (6)$ 110$ 205$ 136$ 100$ (20)$ 421$ 204$ 147$ (23)$ 328$ Non-operating general and administrative expenses (e) - - - (6) (6) - - (13) (13) - - - (38) (38) - - (67) (67) Stock-based compensation expense - - - - - - - (2) (2) - - - - - - - (7) (7) Acquisition and related costs, including affiliate - - - (2) (2) - - - - - - - (15) (15) - - - - Depreciation, accretion and amortization expense (f) (30) (49) (34) - (113) (29) (43) - (72) (89) (137) (41) (2) (269) (88) (125) (2) (215) Impairment charges - - - - - 1 - - 1 (15) - - - (15) - - - - Gain on sale of U.K. renewable energy facilities - - - - - - - - - - - - - - 37 - - 37 Interest expense, net (16) (14) (10) (32) (72) (15) (22) (33) (70) (46) (36) (6) (89) (177) (55) (65) (88) (208) Income tax benefit (expense) (1) (1) (2) (2) (6) - - 1 1 (1) (1) (4) (3) (9) - - 2 2 Adjustment for asset sales - - - - - - - - - - - - - - 10 - - 10 Regulated Solar and Wind price band adjustment (n) - - (10) - (10) - - - - - - (10) - (10) - - - - Other non-cash or non-operating items (g) 1 (2) (3) (3) (7) 1 - 8 9 1 (4) (3) (5) (11) 17 - 9 26 Net income (loss) 38$ (30)$ 24$ (51)$ (19)$ 46$ (37)$ (45)$ (36)$ 55$ (42)$ 36$ (172)$ (123)$ 125$ (43)$ (176)$ (94)$ Three Months Ended Three Months Ended Nine Months Ended Nine Months Ended September 30, 2018 September 30, 2017 September 30, 2018 September 30, 2017 (MILLIONS, EXCEPT AS NOTED) Solar Wind Regulated Spain Corp Total Solar Wind Corp Total Solar Wind Regulated Spain Corp Total Solar Wind Corp Total Adjusted EBITDA 84$ 36$ 83$ (6)$ 197$ 88$ 28$ (6)$ 110$ 205$ 136$ 100$ (20)$ 421$ 204$ 147$ (23)$ 328$ Fixed management fee - - - (3) (3) - - - - - - - (8) (8) - - - - Variable management fee - - - (1) (1) - - - - - - - (3) (3) - - - - Adjusted interest expense (h) (16) (15) (17) (30) (78) (15) (23) (25) (63) (45) (36) (21) (82) (184) (45) (63) (76) (184) Levelized principal payments (i) (13) (17) (27) - (57) (11) (13) - (24) (36) (43) (32) - (111) (34) (41) - (75) Cash distributions to non-controlling interests (j) (3) (4) - - (7) (3) (3) - (6) (8) (11) - - (19) (10) (13) - (23) Sustaining capital expenditures (k) - (2) - - (2) - (1) - (1) - (6) - - (6) - (1) - (1) Adjustment for asset sales - - - - - - - - - - - - - - - - - - Other (l) 2 1 (6) - (3) 1 2 - 3 5 10 (5) - 10 6 11 - 17 Cash available for distribution (CAFD) (m) 54$ (1)$ 33$ (40)$ 46$ 60$ (10)$ (31)$ 19$ -$ 121$ 50$ 42$ (113)$ 100 121$ 40$ (99)$ 62$
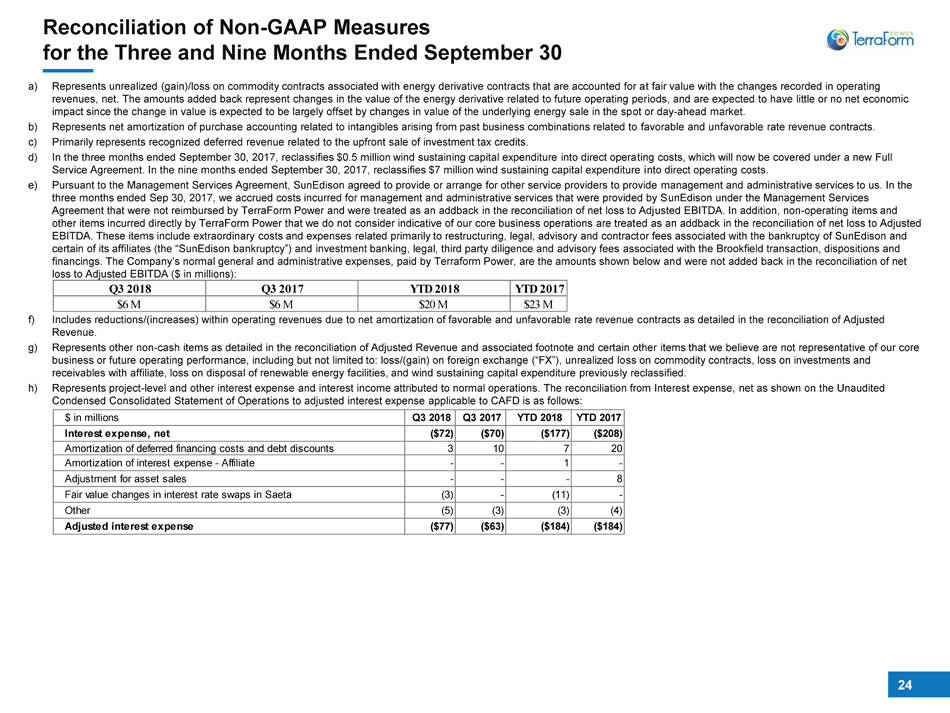
24 Reconciliation of Non - GAAP Measures for the Three and Nine Months Ended September 30 a) Represents unrealized (gain)/loss on commodity contracts associated with energy derivative contracts that are accounted for a t f air value with the changes recorded in operating revenues, net. The amounts added back represent changes in the value of the energy derivative related to future operating per iod s, and are expected to have little or no net economic impact since the change in value is expected to be largely offset by changes in value of the underlying energy sale in the sp ot or day - ahead market. b) Represents net amortization of purchase accounting related to intangibles arising from past business combinations related to fav orable and unfavorable rate revenue contracts. c) Primarily represents recognized deferred revenue related to the upfront sale of investment tax credits. d) In the three months ended September 30, 2017, reclassifies $0.5 million wind sustaining capital expenditure into direct opera tin g costs, which will now be covered under a new Full Service Agreement. In the nine months ended September 30, 2017, reclassifies $7 million wind sustaining capital expenditure i nto direct operating costs. e) Pursuant to the Management Services Agreement, SunEdison agreed to provide or arrange for other service providers to provide man agement and administrative services to us. In the three months ended Sep 30, 2017, we accrued costs incurred for management and administrative services that were provided by S unE dison under the Management Services Agreement that were not reimbursed by TerraForm Power and were treated as an addback in the reconciliation of net loss to Adj ust ed EBITDA. In addition, non - operating items and other items incurred directly by TerraForm Power that we do not consider indicative of our core business operations are treat ed as an addback in the reconciliation of net loss to Adjusted EBITDA. These items include extraordinary costs and expenses related primarily to restructuring, legal, advisory and contract or fees associated with the bankruptcy of SunEdison and certain of its affiliates (the “SunEdison bankruptcy”) and investment banking, legal, third party diligence and advisory fees as sociated with the Brookfield transaction, dispositions and financings. The Company’s normal general and administrative expenses, paid by Terraform Power, are the amounts shown below an d w ere not added back in the reconciliation of net loss to Adjusted EBITDA ($ in millions): f) Includes reductions/(increases) within operating revenues due to net amortization of favorable and unfavorable rate revenue c ont racts as detailed in the reconciliation of Adjusted Revenue. g) Represents other non - cash items as detailed in the reconciliation of Adjusted Revenue and associated footnote and certain other items that we believe are not representative of our core business or future operating performance, including but not limited to: loss/(gain) on foreign exchange (“FX”), unrealized lo ss on commodity contracts, loss on investments and receivables with affiliate, loss on disposal of renewable energy facilities, and wind sustaining capital expenditure previous ly reclassified. h) Represents project - level and other interest expense and interest income attributed to normal operations. The reconciliation from Interest expense, net as shown on the Unaudited Condensed Consolidated Statement of Operations to adjusted interest expense applicable to CAFD is as follows: Q3 2018 Q3 2017 YTD 2018 YTD 2017 $6 M $6 M $20 M $23 M $ in millions Q3 2018 Q3 2017 YTD 2018 YTD 2017 Interest expense, net ($72) ($70) ($177) ($208) Amortization of deferred financing costs and debt discounts 3 10 7 20 Amortization of interest expense - Affiliate - - 1 - Adjustment for asset sales - - - 8 Fair value changes in interest rate swaps in Saeta (3) - (11) - Other (5) (3) (3) (4) Adjusted interest expense ($77) ($63) ($184) ($184)
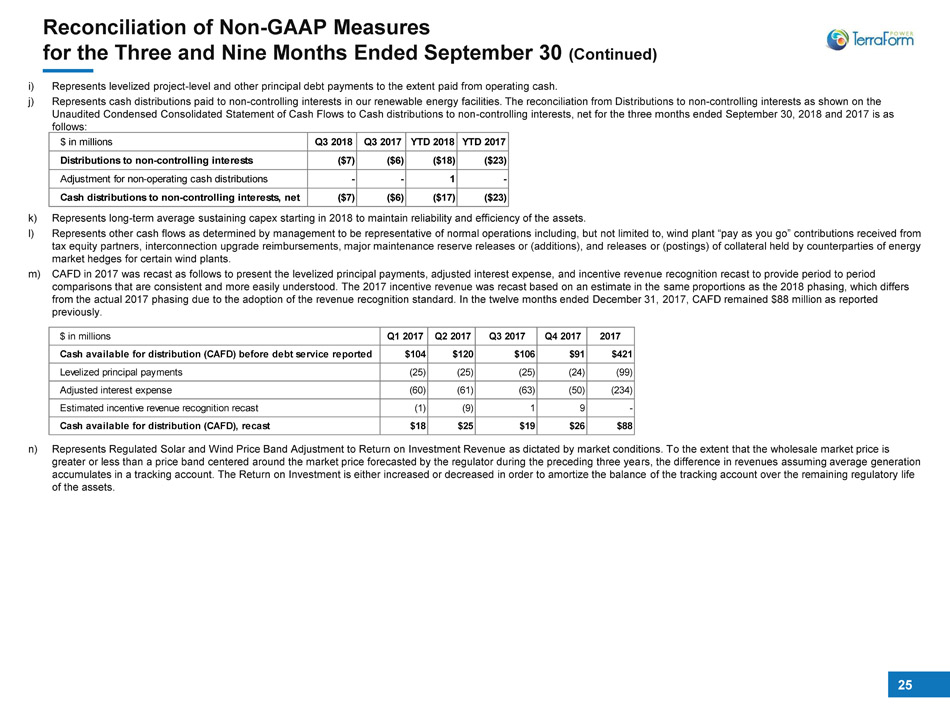
25 i) Represents levelized project - level and other principal debt payments to the extent paid from operating cash. j) Represents cash distributions paid to non - controlling interests in our renewable energy facilities. The reconciliation from Dist ributions to non - controlling interests as shown on the Unaudited Condensed Consolidated Statement of Cash Flows to Cash distributions to non - controlling interests, net for the three m onths ended September 30, 2018 and 2017 is as follows: k) Represents long - term average sustaining capex starting in 2018 to maintain reliability and efficiency of the assets. l) Represents other cash flows as determined by management to be representative of normal operations including, but not limited to, wind plant “pay as you go” contributions received from tax equity partners, interconnection upgrade reimbursements, major maintenance reserve releases or (additions), and releases or (postings) of collateral held by counterparties of energy market hedges for certain wind plants. m) CAFD in 2017 was recast as follows to present the levelized principal payments, adjusted interest expense, and incentive reve nue recognition recast to provide period to period comparisons that are consistent and more easily understood. The 2017 incentive revenue was recast based on an estimate in the sa me proportions as the 2018 phasing, which differs from the actual 2017 phasing due to the adoption of the revenue recognition standard. In the twelve months ended December 31, 20 17, CAFD remained $88 million as reported previously. n) Represents Regulated Solar and Wind Price Band Adjustment to Return on Investment Revenue as dictated by market conditions. T o t he extent that the wholesale market price is greater or less than a price band centered around the market price forecasted by the regulator during the preceding three yea rs, the difference in revenues assuming average generation accumulates in a tracking account. The Return on Investment is either increased or decreased in order to amortize the balance of the tracking account over the remaining regulatory life of the assets. Reconciliation of Non - GAAP Measures for the Three and Nine Months Ended September 30 (Continued) $ in millions Q3 2018 Q3 2017 YTD 2018 YTD 2017 Distributions to non-controlling interests ($7) ($6) ($18) ($23) Adjustment for non-operating cash distributions - - 1 - Cash distributions to non-controlling interests, net ($7) ($6) ($17) ($23) $ in millions Q1 2017 Q2 2017 Q3 2017 Q4 2017 2017 Cash available for distribution (CAFD) before debt service reported $104 $120 $106 $91 $421 Levelized principal payments (25) (25) (25) (24) (99) Adjusted interest expense (60) (61) (63) (50) (234) Estimated incentive revenue recognition recast (1) (9) 1 9 - Cash available for distribution (CAFD), recast $18 $25 $19 $26 $88
26 Appendix 2 – Additional Information
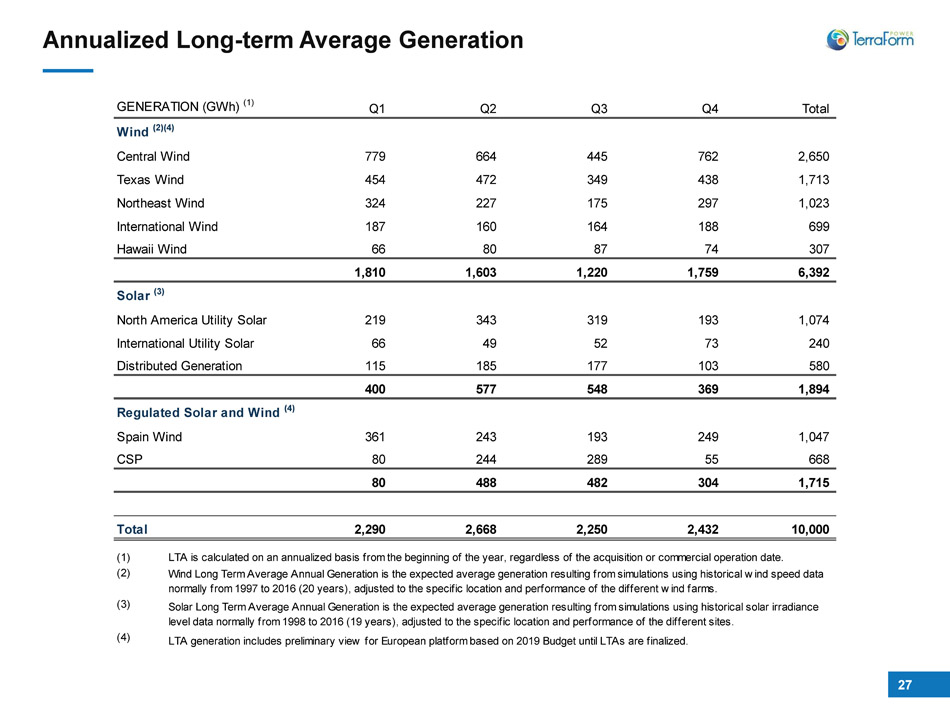
27 Annualized Long - term Average Generation GENERATION (GWh) (1) Q1 Q2 Q3 Q4 Total Wind (2)(4) Central Wind 779 664 445 762 2,650 Texas Wind 454 472 349 438 1,713 Northeast Wind 324 227 175 297 1,023 International Wind 187 160 164 188 699 Hawaii Wind 66 80 87 74 307 1,810 1,603 1,220 1,759 6,392 Solar (3) North America Utility Solar 219 343 319 193 1,074 International Utility Solar 66 49 52 73 240 Distributed Generation 115 185 177 103 580 400 577 548 369 1,894 Regulated Solar and Wind (4) Spain Wind 361 243 193 249 1,047 CSP 80 244 289 55 668 80 488 482 304 1,715 Total 2,290 2,668 2,250 2,432 10,000 (1) (2) (3) (4) LTA is calculated on an annualized basis from the beginning of the year, regardless of the acquisition or commercial operation date. Wind Long Term Average Annual Generation is the expected average generation resulting from simulations using historical wind speed data normally from 1997 to 2016 (20 years), adjusted to the specific location and performance of the different wind farms. Solar Long Term Average Annual Generation is the expected average generation resulting from simulations using historical solar irradiance level data normally from 1998 to 2016 (19 years), adjusted to the specific location and performance of the different sites. LTA generation includes preliminary view for European platform based on 2019 Budget until LTAs are finalized.
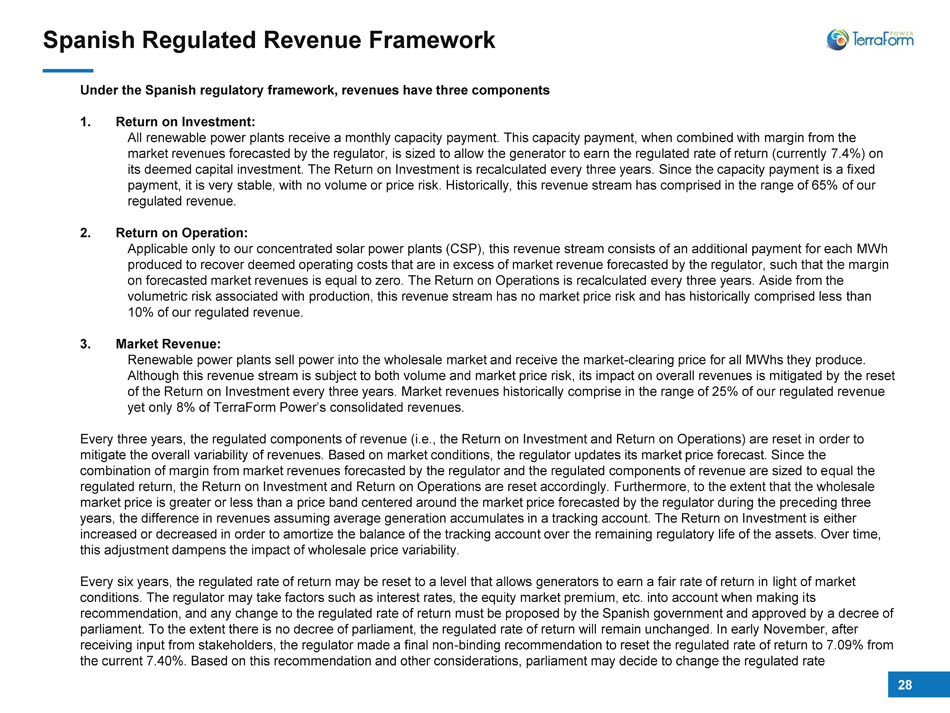
28 Spanish Regulated Revenue Framework Under the Spanish regulatory framework, revenues have three components 1. Return on Investment: All renewable power plants receive a monthly capacity payment. This capacity payment, when combined with margin from the market revenues forecasted by the regulator, is sized to allow the generator to earn the regulated rate of return (currently 7.4 %) on its deemed capital investment. The Return on Investment is recalculated every three years. Since the capacity payment is a fi xed payment, it is very stable, with no volume or price risk. Historically, this revenue stream has comprised in the range of 65% of our regulated revenue. 2. Return on Operation: Applicable only to our concentrated solar power plants (CSP), this revenue stream consists of an additional payment for each MWh produced to recover deemed operating costs that are in excess of market revenue forecasted by the regulator, such that the ma rgi n on forecasted market revenues is equal to zero. The Return on Operations is recalculated every three years. Aside from the volumetric risk associated with production, this revenue stream has no market price risk and has historically comprised less tha n 10% of our regulated revenue. 3. Market Revenue: Renewable power plants sell power into the wholesale market and receive the market - clearing price for all MWhs they produce. Although this revenue stream is subject to both volume and market price risk, its impact on overall revenues is mitigated by the reset of the Return on Investment every three years. Market revenues historically comprise in the range of 25% of our regulated rev enu e yet only 8% of TerraForm Power’s consolidated revenues. Every three years, the regulated components of revenue (i.e., the Return on Investment and Return on Operations) are reset in or der to mitigate the overall variability of revenues. Based on market conditions, the regulator updates its market price forecast. Si nce the combination of margin from market revenues forecasted by the regulator and the regulated components of revenue are sized to e qua l the regulated return, the Return on Investment and Return on Operations are reset accordingly. Furthermore, to the extent that th e w holesale market price is greater or less than a price band centered around the market price forecasted by the regulator during the pre ced ing three years, the difference in revenues assuming average generation accumulates in a tracking account. The Return on Investment is eit her increased or decreased in order to amortize the balance of the tracking account over the remaining regulatory life of the ass ets . Over time, this adjustment dampens the impact of wholesale price variability. Every six years, the regulated rate of return may be reset to a level that allows generators to earn a fair rate of return in li ght of market conditions. The regulator may take factors such as interest rates, the equity market premium, etc. into account when making i ts recommendation, and any change to the regulated rate of return must be proposed by the Spanish government and approved by a d ecr ee of parliament. To the extent there is no decree of parliament, the regulated rate of return will remain unchanged. In early Nove mbe r, after receiving input from stakeholders, the regulator made a final non - binding recommendation to reset the regulated rate of return t o 7.09% from the current 7.40%. Based on this recommendation and other considerations, parliament may decide to change the regulated rate
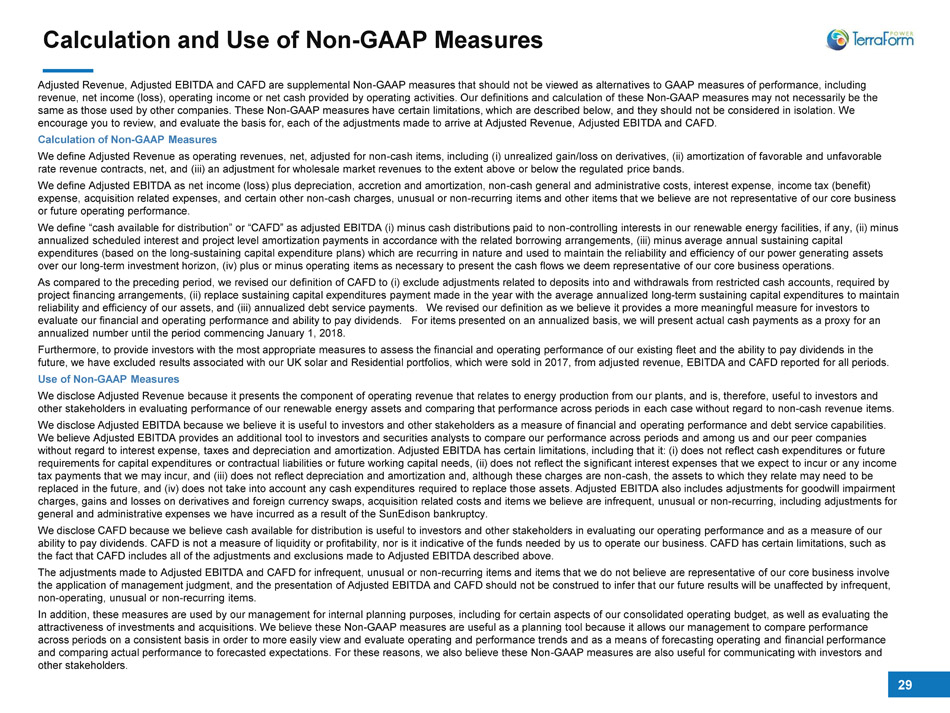
29 Calculation and Use of Non - GAAP Measures Adjusted Revenue, Adjusted EBITDA and CAFD are supplemental Non - GAAP measures that should not be viewed as alternatives to GAAP measures of performance, including revenue, net income (loss), operating income or net cash provided by operating activities. Our definitions and calculation of th ese Non - GAAP measures may not necessarily be the same as those used by other companies. These Non - GAAP measures have certain limitations, which are described below, and they sho uld not be considered in isolation. We encourage you to review, and evaluate the basis for, each of the adjustments made to arrive at Adjusted Revenue, Adjusted EBI TDA and CAFD. Calculation of Non - GAAP Measures We define Adjusted Revenue as operating revenues, net, adjusted for non - cash items, including ( i ) unrealized gain/loss on derivatives, (ii) amortization of favorable and unfavorable rate revenue contracts, net, and (iii) an adjustment for wholesale market revenues to the extent above or below the regulated pr ice bands. We define Adjusted EBITDA as net income (loss) plus depreciation, accretion and amortization, non - cash general and administrativ e costs, interest expense, income tax (benefit) expense, acquisition related expenses, and certain other non - cash charges, unusual or non - recurring items and other items that w e believe are not representative of our core business or future operating performance. We define “cash available for distribution” or “CAFD” as adjusted EBITDA (i) minus cash distributions paid to non - controlling in terests in our renewable energy facilities, if any, (ii) minus annualized scheduled interest and project level amortization payments in accordance with the related borrowing arrangements, (ii i) minus average annual sustaining capital expenditures (based on the long - sustaining capital expenditure plans) which are recurring in nature and used to maintain the rel iability and efficiency of our power generating assets over our long - term investment horizon, (iv) plus or minus operating items as necessary to present the cash flows we deem represe ntative of our core business operations. As compared to the preceding period, we revised our definition of CAFD to (i) exclude adjustments related to deposits into an d w ithdrawals from restricted cash accounts, required by project financing arrangements, (ii) replace sustaining capital expenditures payment made in the year with the average annual ize d long - term sustaining capital expenditures to maintain reliability and efficiency of our assets, and (iii) annualized debt service payments. We revised our definition as we belie ve it provides a more meaningful measure for investors to evaluate our financial and operating performance and ability to pay dividends. For items presented on an annualized basis, we will present actual cash payments as a proxy for an annualized number until the period commencing January 1, 2018. Furthermore, to provide investors with the most appropriate measures to assess the financial and operating performance of our ex isting fleet and the ability to pay dividends in the future, we have excluded results associated with our UK solar and Residential portfolios, which were sold in 2017, from adjus ted revenue, EBITDA and CAFD reported for all periods. Use of Non - GAAP Measures We disclose Adjusted Revenue because it presents the component of operating revenue that relates to energy production from ou r p lants, and is, therefore, useful to investors and other stakeholders in evaluating performance of our renewable energy assets and comparing that performance across periods in eac h case without regard to non - cash revenue items. We disclose Adjusted EBITDA because we believe it is useful to investors and other stakeholders as a measure of financial and op erating performance and debt service capabilities. We believe Adjusted EBITDA provides an additional tool to investors and securities analysts to compare our performance across pe riods and among us and our peer companies without regard to interest expense, taxes and depreciation and amortization. Adjusted EBITDA has certain limitations, includi ng that it: (i) does not reflect cash expenditures or future requirements for capital expenditures or contractual liabilities or future working capital needs, (ii) does not reflect the s ign ificant interest expenses that we expect to incur or any income tax payments that we may incur, and (iii) does not reflect depreciation and amortization and, although these charges are non - cas h, the assets to which they relate may need to be replaced in the future, and (iv) does not take into account any cash expenditures required to replace those assets. Adjusted EBI TDA also includes adjustments for goodwill impairment charges, gains and losses on derivatives and foreign currency swaps, acquisition related costs and items we believe are infre que nt, unusual or non - recurring, including adjustments for general and administrative expenses we have incurred as a result of the SunEdison bankruptcy. We disclose CAFD because we believe cash available for distribution is useful to investors and other stakeholders in evaluati ng our operating performance and as a measure of our ability to pay dividends. CAFD is not a measure of liquidity or profitability, nor is it indicative of the funds needed by us to operate our business. CAFD has certain limitations, such as the fact that CAFD includes all of the adjustments and exclusions made to Adjusted EBITDA described above. The adjustments made to Adjusted EBITDA and CAFD for infrequent, unusual or non - recurring items and items that we do not believe are representative of our core business involve the application of management judgment, and the presentation of Adjusted EBITDA and CAFD should not be construed to infer tha t o ur future results will be unaffected by infrequent, non - operating, unusual or non - recurring items. In addition, these measures are used by our management for internal planning purposes, including for certain aspects of our c ons olidated operating budget, as well as evaluating the attractiveness of investments and acquisitions. We believe these Non - GAAP measures are useful as a planning tool because it allo ws our management to compare performance across periods on a consistent basis in order to more easily view and evaluate operating and performance trends and as a mean s o f forecasting operating and financial performance and comparing actual performance to forecasted expectations. For these reasons, we also believe these Non - GAAP measures are also useful for communicating with investors and other stakeholders.
NASDAQ: TERP www.terraformpower.com 30