Attached files
| file | filename |
|---|---|
| EX-32.1 - EXHIBIT 32.1 - SMTA Liquidating Trust | smta3q18exhibit321906ceocfo.htm |
| EX-31.1 - EXHIBIT 31.1 - SMTA Liquidating Trust | smta3q18exhibit311302ceocfo.htm |
UNITED STATES
SECURITIES AND EXCHANGE COMMISSION
Washington, D.C. 20549
Form 10-Q
x | QUARTERLY REPORT PURSUANT TO SECTION 13 OR 15(d) OF THE SECURITIES EXCHANGE ACT OF 1934 |
For the quarterly period ended September 30, 2018
OR
o | TRANSITION REPORT PURSUANT TO SECTION 13 OR 15(d) OF THE SECURITIES EXCHANGE ACT OF 1934 |
For the transition period from to
Commission file number 001-38414
___________________________________________________________
SPIRIT MTA REIT
(Exact name of registrant as specified in its charter)
_______________________________________________
Maryland | 82-6712510 | |||
(State or other Jurisdiction of Incorporation) | (IRS Employer Identification No.) | |||
2727 North Harwood Street, Suite 300 Dallas, Texas 75201 | (972) 476-1409 | |||
(Address of principal executive offices; zip code) | (Registrant’s telephone number, including area code) | |||
(Former name, former address and former fiscal year, if changed since last report)
__________________________________________________________________________
Indicate by check mark whether the registrant (1) has filed all reports required to be filed by Section 13 or 15(d) of the Securities Exchange Act of 1934 during the preceding 12 months (or for such shorter period that the registrant was required to file such reports), and (2) has been subject to such filing requirements for the past 90 days.
Yes x No o |
Indicate by check mark whether the registrant has submitted electronically every Interactive Data File required to be submitted pursuant to Rule 405 of Regulation S-T (§232.405 of this chapter) during the preceding 12 months (or for such shorter period that the registrant was required to submit such files).
Yes x No o |
Indicate by check mark whether the registrant is a large accelerated filer, an accelerated filer, a non-accelerated filer, a smaller reporting company, or an emerging growth company. See the definitions of "large accelerated filer," “accelerated filer,” "smaller reporting company," and "emerging growth company" in Rule 12b-2 of the Exchange Act.
Large accelerated filer o | Accelerated filer o | Non-accelerated filer x |
Smaller reporting company o | Emerging growth company x |
If an emerging growth company, indicate by check mark if the registrant has elected not to use the extended transition period for complying with any new or revised financial accounting standards provided pursuant to Section 13(a) of the Exchange Act. o
Indicate by check mark whether the registrant is a shell company (as defined in Rule 12b-2 of the Exchange Act).
Yes o No x
As of November 7, 2018, there were 43,000,862 commons shares, par value $0.01, of Spirit MTA REIT outstanding.
EXPLANATORY NOTE
This quarterly report of Spirit MTA REIT includes the financial information of the Company as of September 30, 2018 and December 31, 2017 and for the three and nine months ended September 30, 2018 and 2017.
On May 31, 2018, the distribution date, Spirit Realty Capital, Inc. completed the previously announced Spin-Off of the assets that collateralize Master Trust 2014, all of its properties leased to Shopko, and certain other assets into an independent, publicly traded REIT, Spirit MTA REIT. The Spin-Off was effected by means of a pro rata distribution of one share of SMTA common stock for every ten shares of Spirit common stock held by each of Spirit's stockholders as of May 18, 2018, the record date.
The accompanying financial statements include the consolidated accounts of the Company and its wholly-owned subsidiaries for the period subsequent to the Spin-Off on May 31, 2018. The pre-spin financial statements were prepared on a carve-out basis and reflect the combined net assets and operations of the predecessor legal entities which formed the Company at the time of the Spin-Off. Accordingly, the results of operations for the nine months ended September 30, 2018 and 2017 reflect the aggregate operations and changes in cash flows and equity on a combined basis for all periods prior to May 31, 2018 and on a consolidated basis for all periods subsequent to May 31, 2018. The discussion of our results of operations, cash flows and financial condition set forth in this report is not necessarily indicative of the future results of operations, cash flows or financial condition as an independent, publicly traded company.
INDEX
Glossary | |
Item 1. Spirit MTA REIT Financial Statements (Unaudited) | |
GLOSSARY
2018 Incentive Award Plan | Spirit MTA REIT and Spirit MTA REIT, L.P. 2018 Incentive Award Plan |
AFFO | Adjusted Funds From Operations. See definition in Management’s Discussion and Analysis of Financial Condition and Results of Operations |
Annualized Contractual Rent | Contractual Rent multiplied by twelve |
ASC | Accounting Standards Codification |
Asset Management Agreement | Asset Management Agreement between Spirit Realty, L.P. and Spirit MTA REIT dated May 31, 2018 |
ASU | Accounting Standards Update |
CMBS | Commercial Mortgage-Backed Securities |
Code | Internal Revenue Code of 1986, as amended |
Collateral Pool | Pool of collateral assets that are pledged to the indenture trustee for the benefit of the noteholders and secure obligations of issuers under Master Trust 2014 |
Contractual Rent | Monthly contractual cash rent, excluding percentage rents, from properties owned fee-simple or ground leased, recognized during the final month of the reporting period, adjusted to exclude amounts received from properties sold during that period and adjusted to include a full month of contractual rent for properties acquired during that period. We use Contractual Rent when calculating certain metrics that are useful to evaluate portfolio credit, asset type, industry, and geographic diversity and to manage risk. |
CPI | Consumer Price Index |
EBITDAre | EBITDAre is a non-GAAP financial measure and is computed in accordance with standards established by NAREIT. See definition in Management's Discussion and Analysis of Financial Condition and Results of Operations |
Exchange Act | Securities Exchange Act of 1934, as amended |
FASB | Financial Accounting Standards Board |
FFO | Funds From Operations. See definition in Management’s Discussion and Analysis of Financial Condition and Results of Operations |
GAAP | Generally Accepted Accounting Principles in the United States |
Liquidity Reserve | Cash held on deposit until there is a cashflow shortfall as defined in the Master Trust 2014 agreements or a liquidation of Master Trust 2014 occurs |
Manager | Spirit Realty, L.P., a wholly-owned subsidiary of Spirit |
Master Trust 2014 | The asset-backed securitization trust established in 2005, and amended and restated in 2014, which issues non-recourse net-lease mortgage notes collateralized by commercial real estate, net-leases and mortgage loans from time to time. Indirect special purpose entity subsidiaries of the Company are the borrowers. |
NAREIT | National Association of Real Estate Investment Trusts |
Occupancy | The number of economically yielding owned properties divided by total owned properties |
Other Properties | One of two reportable segments consisting of all properties not included in the Master Trust 2014 Collateral Pool |
Properties | Owned properties and mortgage loans receivable secured by properties |
Property Management and Servicing Agreement | Second amended and restated agreement governing the management services and special services provided to Master Trust 2014 by Spirit Realty, L.P., dated as of May 20, 2014, as amended, supplemented, amended and restated or otherwise modified |
3
Real Estate Investment Value | The gross acquisition cost, including capitalized transaction costs, plus improvements and less impairments, if any |
REIT | Real Estate Investment Trust |
Release Account | Proceeds from the sale of assets securing Master Trust 2014 held in a restricted account until a qualifying substitution is made or the funds are applied as prepayment of principal |
Separation and Distribution Agreement | Separation and Distribution Agreement between Spirit Realty Capital, Inc. and Spirit MTA REIT dated May 21, 2018 |
SEC | Securities and Exchange Commission |
Shopko | Specialty Retail Shops Holding Corp. and certain of its affiliates |
SMTA | Spirit MTA REIT |
Spirit | Spirit Realty Capital, Inc. |
SubREIT | Spirit MTA SubREIT, Inc., a wholly-owned subsidiary of SMTA |
U.S. | United States of America |
Vacant | Owned properties that are not economically yielding |
Unless otherwise indicated or unless the context requires otherwise, all references to the "Company," "Spirit MTA
REIT," “SMTA,” "we," "us" or "our" refer to Spirit MTA REIT and its wholly-owned subsidiaries.
4
PART I - FINANCIAL INFORMATION
Item 1. Financial Statements
SPIRIT MTA REIT
Consolidated Balance Sheets
(In Thousands, Except Share and Per Share Data)
(Unaudited)
September 30, 2018 | December 31, 2017 | ||||||
Assets | |||||||
Investments: | |||||||
Real estate investments: | |||||||
Land and improvements | $ | 971,444 | $ | 973,231 | |||
Buildings and improvements | 1,707,970 | 1,658,023 | |||||
Total real estate investments | 2,679,414 | 2,631,254 | |||||
Less: accumulated depreciation | (588,194 | ) | (557,948 | ) | |||
2,091,220 | 2,073,306 | ||||||
Loans receivable, net | 66,950 | 32,307 | |||||
Intangible lease assets, net | 104,937 | 102,262 | |||||
Real estate assets held for sale, net | 22,106 | 28,460 | |||||
Net investments | 2,285,213 | 2,236,335 | |||||
Cash and cash equivalents | 16,188 | 6 | |||||
Deferred costs and other assets, net | 69,766 | 107,770 | |||||
Goodwill | 13,549 | 13,549 | |||||
Total assets | $ | 2,384,716 | $ | 2,357,660 | |||
Liabilities and equity | |||||||
Liabilities: | |||||||
Mortgages and notes payable, net | $ | 1,993,572 | $ | 1,926,835 | |||
Intangible lease liabilities, net | 22,222 | 23,847 | |||||
Accounts payable, accrued expenses and other liabilities | 32,885 | 16,060 | |||||
Total liabilities | 2,048,679 | 1,966,742 | |||||
Commitments and contingencies (see Note 7) | |||||||
Redeemable preferred equity: | |||||||
SMTA Preferred Stock, $0.01 par value, $25 per share liquidation preference, 20,000,000 shares authorized: 6,000,000 and 0 shares issued and outstanding at September 30, 2018 and December 31, 2017, respectively | 150,000 | — | |||||
SubREIT Preferred Stock, $0.01 par value, $1,000 per share liquidation preference, 50,000,000 shares authorized: 5,000 and 0 shares issued and outstanding at September 30, 2018 and December 31, 2017, respectively | 5,000 | — | |||||
Total redeemable preferred equity | 155,000 | — | |||||
Stockholders' equity and parent company equity: | |||||||
Net parent investment | — | 390,918 | |||||
Common stock, $0.01 par value, 750,000,000 shares authorized; 43,000,862 and 10,000 shares issued and outstanding at September 30, 2018 and December 31, 2017, respectively | 430 | — | |||||
Capital in excess of common stock par value | 200,448 | — | |||||
Accumulated deficit | (19,841 | ) | — | ||||
Total stockholders' equity and parent company equity | 181,037 | 390,918 | |||||
Total liabilities and equity | $ | 2,384,716 | $ | 2,357,660 | |||
See accompanying notes.
5
SPIRIT MTA REIT
Consolidated Statements of Operations and Comprehensive Income (Loss)
(In Thousands, Except Share and Per Share Data)
(Unaudited)
Three Months Ended September 30, | Nine Months Ended September 30, | ||||||||||||||
2018 | 2017 | 2018 | 2017 | ||||||||||||
Revenues: | |||||||||||||||
Rentals | $ | 59,769 | $ | 55,257 | $ | 178,040 | $ | 167,645 | |||||||
Interest income on loans receivable | 1,131 | 217 | 1,964 | 622 | |||||||||||
Tenant reimbursement income | 518 | 691 | 1,499 | 1,841 | |||||||||||
Other income | 993 | 2,994 | 1,934 | 4,144 | |||||||||||
Total revenues | 62,411 | 59,159 | 183,437 | 174,252 | |||||||||||
Expenses: | |||||||||||||||
General and administrative | 1,795 | 4,862 | 11,221 | 18,593 | |||||||||||
Related party fees | 8,369 | 1,411 | 13,450 | 4,150 | |||||||||||
Transaction costs | 78 | 1,733 | 8,620 | 2,100 | |||||||||||
Property costs (including reimbursable) | 1,909 | 2,189 | 5,369 | 6,210 | |||||||||||
Interest | 27,672 | 18,733 | 83,427 | 56,324 | |||||||||||
Depreciation and amortization | 20,969 | 19,891 | 63,071 | 60,776 | |||||||||||
Impairments | 9,343 | 15,436 | 15,415 | 27,348 | |||||||||||
Total expenses | 70,135 | 64,255 | 200,573 | 175,501 | |||||||||||
Loss before other income (loss) and income tax expense | (7,724 | ) | (5,096 | ) | (17,136 | ) | (1,249 | ) | |||||||
Other income (loss): | |||||||||||||||
(Loss) gain on debt extinguishment | — | — | (363 | ) | 1 | ||||||||||
Gain (loss) on disposition of real estate assets | 4,210 | (1,382 | ) | 7,464 | 18,196 | ||||||||||
Total other income (loss) | 4,210 | (1,382 | ) | 7,101 | 18,197 | ||||||||||
(Loss) income before income tax expense | (3,514 | ) | (6,478 | ) | (10,035 | ) | 16,948 | ||||||||
Income tax expense | (60 | ) | (45 | ) | (139 | ) | (135 | ) | |||||||
Net (loss) income and total comprehensive (loss) income | (3,574 | ) | (6,523 | ) | (10,174 | ) | 16,813 | ||||||||
Preferred dividends | (3,975 | ) | — | (5,300 | ) | — | |||||||||
Net (loss) income attributable to common stockholders | $ | (7,549 | ) | $ | (6,523 | ) | $ | (15,474 | ) | $ | 16,813 | ||||
Net (loss) income per share attributable to common stockholders | |||||||||||||||
Basic | $ | (0.18 | ) | $ | (0.15 | ) | $ | (0.36 | ) | $ | 0.39 | ||||
Diluted | $ | (0.18 | ) | $ | (0.15 | ) | $ | (0.36 | ) | $ | 0.39 | ||||
Weighted average shares of common stock outstanding: | |||||||||||||||
Basic | 42,851,010 | 42,851,010 | 42,851,010 | 42,851,010 | |||||||||||
Diluted | 42,851,010 | 42,851,010 | 42,851,010 | 42,851,010 | |||||||||||
Dividends declared per common share issued | $ | 0.33 | N/A | $ | 0.33 | N/A | |||||||||
See accompanying notes.
6
SPIRIT MTA REIT
Consolidated Statement of Changes in Equity
(In Thousands, Except Share and Per Share Data)
(Unaudited)
Redeemable Preferred Equity | Stockholders' Equity and Parent Company Equity | |||||||||||||||||||||||||||||||||||||||
SMTA Preferred Stock | SubREIT Preferred Stock | Common Stock | ||||||||||||||||||||||||||||||||||||||
Shares | Par Value and Capital in Excess of Par Value | Shares | Par Value and Capital in Excess of Par Value | Total Redeemable Preferred Equity | Shares | Par Value | Capital in Excess of Par Value | Accumulated Earnings | Net Parent Investment | Total Stockholders' Equity and Parent Company Equity | ||||||||||||||||||||||||||||||
Balances, December 31, 2017 | — | $ | — | — | $ | — | $ | — | — | $ | — | $ | — | $ | — | $ | 390,918 | $ | 390,918 | |||||||||||||||||||||
Net loss | — | — | — | — | — | — | — | — | (351 | ) | (9,823 | ) | (10,174 | ) | ||||||||||||||||||||||||||
Contributions from parent company | — | — | — | — | — | — | — | — | — | 174,515 | 174,515 | |||||||||||||||||||||||||||||
Distributions to parent company | — | — | — | — | — | — | — | — | — | (200,183 | ) | (200,183 | ) | |||||||||||||||||||||||||||
Issuance of shares of common stock, net | — | — | — | — | — | 42,851,010 | 429 | 199,998 | — | (200,427 | ) | — | ||||||||||||||||||||||||||||
Issuance of shares of preferred stock, net | 6,000,000 | 150,000 | 5,000 | 5,000 | 155,000 | — | — | — | — | (155,000 | ) | (155,000 | ) | |||||||||||||||||||||||||||
Dividends declared on preferred stock | — | — | — | — | — | — | — | — | (5,300 | ) | — | (5,300 | ) | |||||||||||||||||||||||||||
Dividends declared on common stock | — | — | — | — | — | — | — | — | (14,190 | ) | — | (14,190 | ) | |||||||||||||||||||||||||||
Stock-based compensation, net | — | — | — | — | 149,852 | 1 | 450 | — | — | 451 | ||||||||||||||||||||||||||||||
Balances, September 30, 2018 | 6,000,000 | $ | 150,000 | 5,000 | $ | 5,000 | $ | 155,000 | 43,000,862 | $ | 430 | $ | 200,448 | $ | (19,841 | ) | $ | — | $ | 181,037 | ||||||||||||||||||||
See accompanying notes.
7
SPIRIT MTA REIT
Consolidated Statements of Cash Flows
(In Thousands, Unaudited)
Nine Months Ended September 30, | |||||||
2018 | 2017 | ||||||
Operating activities | |||||||
Net (loss) income | $ | (10,174 | ) | $ | 16,813 | ||
Adjustments to reconcile net (loss) income to net cash provided by operating activities: | |||||||
Depreciation and amortization | 63,071 | 60,776 | |||||
Impairments | 15,415 | 27,348 | |||||
Amortization of deferred financing costs | 2,581 | 984 | |||||
Amortization of debt discounts | 5,291 | 3,207 | |||||
Stock based compensation expense | 2,875 | 5,101 | |||||
Loss (gain) on debt extinguishment, net | 363 | (1 | ) | ||||
Gain on disposition of real estate assets | (7,464 | ) | (18,196 | ) | |||
Non-cash revenue | (2,145 | ) | (2,554 | ) | |||
Bad debt expense and other | 500 | 2,105 | |||||
Changes in operating assets and liabilities: | |||||||
Deferred costs and other assets, net | (5,551 | ) | 3,636 | ||||
Accounts payable, accrued expenses and other liabilities | 1,970 | 1,843 | |||||
Net cash provided by operating activities | 66,732 | 101,062 | |||||
Investing activities | |||||||
Acquisitions of real estate | (112,694 | ) | (27,058 | ) | |||
Capitalized real estate expenditures | (2,634 | ) | (1,169 | ) | |||
Collections of principal on loans receivable | 3,741 | 8,008 | |||||
Proceeds from dispositions of real estate and other assets | 68,862 | 128,746 | |||||
Net cash (used in) provided by investing activities | (42,725 | ) | 108,527 | ||||
Financing activities | |||||||
Borrowings under mortgages and notes payable | 92,216 | — | |||||
Repayments under mortgages and notes payable | (31,935 | ) | (11,959 | ) | |||
Debt extinguishment costs | (363 | ) | — | ||||
Deferred financing costs | (1,415 | ) | — | ||||
Preferred stock dividends paid | (5,300 | ) | — | ||||
Common stock dividends paid | — | — | |||||
Contributions from parent company | 91,662 | 89,421 | |||||
Distributions to parent company | (198,038 | ) | (249,865 | ) | |||
Net cash used in financing activities | (53,173 | ) | (172,403 | ) | |||
Net (decrease) increase in cash, cash equivalents and restricted cash | (29,166 | ) | 37,186 | ||||
Cash, cash equivalents and restricted cash, beginning of period | 66,510 | 12,688 | |||||
Cash, cash equivalents and restricted cash, end of period | $ | 37,344 | $ | 49,874 | |||
Nine Months Ended September 30, | |||||||
2018 | 2017 | ||||||
Supplemental Disclosures of Non-Cash Investing and Financing Activities: | |||||||
Investment contribution from parent | $ | 80,429 | $ | — | |||
Investment distribution to parent | 2,144 | 1,183 | |||||
Financing provided in connection with the disposition of assets | 2,888 | — | |||||
Preferred equity issuance | 155,000 | — | |||||
Distributions declared and unpaid | 14,190 | ||||||
Supplemental Cash Flow Disclosures: | |||||||
Interest paid | $ | 74,265 | $ | 52,185 | |||
Taxes paid | $ | 280 | $ | 250 | |||
See accompanying notes.
8
SPIRIT MTA REIT
Notes to Consolidated Financial Statements
(Unaudited)
Note 1. Organization
Spirit MTA REIT ("SMTA" or the "Company") operates as an externally managed REIT that seeks to generate and deliver sustainable and attractive returns for stockholders by primarily investing in and managing a portfolio of single-tenant, operationally essential real estate throughout the U.S. that is generally leased on a long-term, triple-net basis to tenants operating within retail, office, and industrial property types. Single tenant, operationally essential real estate generally refers to free-standing, commercial real estate facilities where tenants conduct activities that are essential to the generation of their sales and profits.
The Company's portfolio includes (i) an asset-backed securitization trust which issues non-recourse asset-backed securities collateralized by commercial real estate, net-leases and mortgage loans (“Master Trust 2014”), (ii) a portfolio of properties leased to Specialty Retail Shops Holding Corp. ("Shopko") and its subsidiaries, (iii) a single distribution center property leased to a sporting goods tenant encumbered with CMBS debt, and (iv) a portfolio of unencumbered properties.
The Company began operations through predecessor legal entities which were wholly-owned subsidiaries of Spirit Realty Capital, Inc. ("Spirit"). On May 31, 2018, Spirit completed the Spin-Off that resulted in the Company's establishment as an independent, publicly traded company. The Spin-Off was effected by means of a pro rata distribution of SMTA common shares to Spirit stockholders of record as of the close of business on the record date. In conjunction with the Spin-Off, SMTA and Spirit Realty, L.P. (the "Manager"), a wholly-owned subsidiary of Spirit, entered into an Asset Management Agreement under which Spirit Realty, L.P. provides external management of SMTA.
Costs associated with the Spin-Off incurred in the three months ended September 30, 2018 and 2017 totaled $0.1 million and $1.7 million, respectively, and in the nine months ended September 30, 2018 and 2017 totaled $8.6 million and $2.1 million, respectively. These are reflected as transaction costs on the accompanying consolidated statements of operations and comprehensive income (loss).
Note 2. Summary of Significant Accounting Policies
Basis of Accounting
The accompanying consolidated financial statements have been prepared in accordance with United States generally accepted accounting principles (“GAAP”) and pursuant to the rules and regulations of the SEC. All intercompany balances and transactions have been eliminated in consolidation. In the opinion of management, the consolidated financial statements include the normal, recurring adjustments necessary for a fair presentation of the information required to be set forth therein.
The results for interim periods are not necessarily indicative of the results for the entire year. Certain information and note disclosures, normally included in financial statements prepared in accordance with GAAP, have been condensed or omitted from these statements pursuant to SEC rules and regulations and, accordingly, these financial statements should be read in conjunction with the audited combined financial statements for the year ended December 31, 2017 included in the Company's registration statement on Form 10 filed with the SEC.
Subsequent to the Spin-Off on May 31, 2018, the consolidated financial statements include the accounts of the Company and its wholly-owned subsidiaries. The pre-spin consolidated financial statements were prepared on a carve-out basis and reflect significant assumptions and allocations.
For the periods prior to the Spin-Off, the financial position and results of operations reflect a combination of entities under common control that have been “carved out” from Spirit’s consolidated financial statements and present Spirit's historical carrying values of the assets and liabilities, consistent with accounting for spin-off transactions in accordance with GAAP. Since the Company prior to the Spin-Off did not represent one entity, a separate capital structure did not exist. As a result, the combined net assets of the predecessor legal entities have been reflected in the consolidated financial statements as net parent investment for periods prior to the Spin-Off. All transactions between Spirit and the predecessor legal entities are considered effectively settled through equity in the consolidated financial statements at the time the transaction is recorded, other than certain mortgages as discussed in Note 6. The settlement of these transactions is reflected as contributions from and distributions to parent in the consolidated statement of changes in equity and contributions from and distributions to parent in the consolidated statements of cash flows as a financing activity.
9
SPIRIT MTA REIT
Notes to Consolidated Financial Statements
(Unaudited)
Through May 31, 2018, the pre-spin consolidated financial statements include expense allocations related to certain Spirit corporate general and administrative functions. These expenses have been allocated based on direct usage or benefit where specifically identifiable, with the remainder allocated pro rata based on property count. All the expense allocations were deemed to have been incurred and settled through net parent investment in the period in which the costs were incurred. Management considers the expense allocation methodology and results to be reasonable. However, the allocations may not be indicative of the actual expense that would have been incurred had the Company operated as an independent, publicly traded company for the periods presented prior to May 31, 2018. At time of the Spin-Off, SMTA entered into an Asset Management Agreement with Spirit to provide these corporate functions.
These consolidated financial statements include certain special purpose entities that were formed to acquire and hold real estate encumbered by indebtedness (see Note 4). Each special purpose entity is a separate legal entity and is the sole owner of its assets and responsible for its liabilities. The assets of these special purpose entities are not available to pay, or otherwise satisfy obligations to, the creditors of any affiliate or owner of another entity unless the special purpose entities have expressly agreed and are permitted under their governing documents. As of September 30, 2018 and December 31, 2017, net assets totaling $1.86 billion and $1.82 billion, respectively, were held and net liabilities totaling $2.02 billion and $1.96 billion, respectively, were owed by these encumbered special purpose entities included in the accompanying consolidated balance sheets.
Use of Estimates
The preparation of financial statements in conformity with GAAP requires management to make estimates and assumptions that affect the reported amounts of assets and liabilities at the date of the financial statements and the reported amounts of revenues and expenses during the reporting period. Although management believes its estimates are reasonable, actual results could differ from those estimates.
Segment Reporting
The Company views its operations in two segments—Master Trust 2014 and all other properties ("Other Properties"), see Note 11 for further discussion on these segments. The Company has no other reportable segments.
Allowance for Doubtful Accounts
The Company reviews its rent and other tenant receivables for collectability on a regular basis, taking into consideration changes in factors such as the tenant’s payment history, the financial condition of the tenant, business conditions in the industry in which the tenant operates, and economic conditions in the area in which the tenant operates. If the collectability of a receivable with respect to any tenant is in doubt, a provision for uncollectible amounts will be established or a direct write-off of the specific receivable will be made. The Company’s reserves for uncollectible amounts totaled $6.8 million and $3.5 million as of September 30, 2018 and December 31, 2017, respectively, against accounts receivable balances of $12.2 million and $5.0 million, respectively. Receivables are recorded within deferred costs and other assets, net in the accompanying consolidated balance sheets. Receivables are written off against the reserves for uncollectible amounts when all possible means of collection have been exhausted.
For rental revenues related to the straight-line method of reporting rental revenue, the collectability review includes management’s estimates of amounts that will not be realized based on an assessment of the risks inherent in the portfolio, considering historical experience. The Company established a reserve for losses of $0.3 million and $1.0 million as of September 30, 2018 and December 31, 2017, respectively, against straight-line rental revenue receivables of $27.2 million and $24.9 million, respectively. These receivables are recorded within deferred costs and other assets, net in the accompanying consolidated balance sheets.
Goodwill
Goodwill arises from business combinations and represents the excess of the cost of an acquired entity over the net fair value amounts that were assigned to the identifiable assets acquired and the liabilities assumed. Spirit recorded goodwill as a result of its merger with Cole Credit Property II, Inc. (“Cole”) on July 17, 2013. Goodwill was allocated to the Company based on the fair value of the Cole assets attributable to the Company relative to the total fair value of Cole assets acquired through the merger. Goodwill is tested for impairment at the reporting unit level on an annual basis and between annual tests if an event occurs or circumstances change that would more likely than not reduce the fair value of the reporting unit below its carrying value. Goodwill has been allocated to each reporting unit based
10
SPIRIT MTA REIT
Notes to Consolidated Financial Statements
(Unaudited)
upon the relative fair value of each reporting unit, resulting in $7.0 million allocated to Master Trust 2014 and $6.5 million allocated to Other Properties. No impairment was recorded for the periods presented.
Cash, Cash Equivalents and Restricted Cash
Cash and cash equivalents include cash and highly liquid investment securities with maturities at acquisition of three months or less. The Company invests cash primarily in money market funds of major financial institutions with fund investments consisting of highly-rated money market instruments and other short-term instruments. Restricted cash is classified within deferred costs and other assets, net in the accompanying consolidated balance sheets. Cash, cash equivalents and restricted cash as shown in the consolidated statements of cash flows consisted of the following (in thousands):
September 30, 2018 | December 31, 2017 | September 30, 2017 | |||||||||
Cash and cash equivalents | $ | 16,188 | $ | 6 | $ | 6 | |||||
Restricted cash: | |||||||||||
Release Account (1) | 9,313 | 61,001 | 49,868 | ||||||||
Liquidity Reserve (2) | 5,570 | 5,503 | — | ||||||||
Lender controlled accounts (3) | 4,725 | — | — | ||||||||
Other (4) | 1,548 | — | — | ||||||||
Total cash, cash equivalents and restricted cash | $ | 37,344 | $ | 66,510 | $ | 49,874 | |||||
(1) Release Account cash consists of proceeds from the sales of assets pledged as collateral under Master Trust 2014 and is held on deposit until a qualifying substitution is made or the funds are applied as prepayment of principal.
(2) | Liquidity Reserve cash was placed on deposit in conjunction with the issuance of additional series of notes under Master Trust 2014 and is held until there is a cashflow shortfall, as defined in the Master Trust 2014 agreements, or a liquidation of Master Trust 2014 occurs. |
(3) | Funds held in lender controlled accounts released after scheduled debt service requirements are met. As of September 30, 2018, $4.2 million of this balance was rent-related receipts associated with Master Trust 2014. |
(4) | Funds held in escrow accounts until the related purchase/sale transaction closes. |
Income Taxes
For the period prior to the Spin-Off, the Company applies the provisions of FASB ASC Topic 740, Income Taxes, and computes the provision for income taxes on a separate return basis. The separate return method applies the accounting guidance for income taxes to the stand-alone consolidated financial statements as if the Company was a separate taxpayer and a stand-alone enterprise for the periods presented.
The Company was wholly-owned by the Manager prior to the Spin-Off and was disregarded for federal income tax purposes. The Manager is wholly-owned by Spirit through certain direct and indirect ownership interests and is taxed as a partnership for Federal income tax purposes. Spirit has elected to be taxed as a REIT under the applicable provisions of the Code and, as a result, will not be subject to federal income tax as long as it distributes 100% of its taxable income and satisfies certain other requirements. Therefore, no provision for federal income tax has been made in the accompanying consolidated financial statements for the period prior to the Spin-Off.
For the period subsequent to the Spin-Off, the Company intends to elect to be taxed as a REIT under the Code beginning with its initial tax year ending December 31, 2018. As a REIT, the Company generally will not be subject to federal income tax provided it continues to satisfy certain tests concerning the Company’s sources of income, the nature of its assets, the amounts distributed to its stockholders, and the ownership of Company stock. Management believes the Company has qualified and will continue to qualify as a REIT and therefore, no provision has been made for federal income taxes in the accompanying consolidated financial statements. Even if the Company qualifies for taxation as a REIT, it may be subject to state and local income and franchise taxes, and to federal income tax and excise tax on its undistributed income.
The Company is subject to certain other taxes which are reflected as income tax expense in the consolidated statements of operations and comprehensive income (loss). Franchise taxes are included in general and administrative expenses in the accompanying consolidated statements of operations and comprehensive income (loss).
11
SPIRIT MTA REIT
Notes to Consolidated Financial Statements
(Unaudited)
New Accounting Pronouncements
In May 2014, the FASB issued ASU 2014-09, Revenue from Contracts with Customers: Topic 606. This new guidance establishes a principles-based approach for accounting for revenue from contracts with customers and is effective for annual reporting periods beginning after December 15, 2017, with early application permitted for annual reporting periods beginning after December 15, 2016. The Company adopted the new revenue recognition standard effective January 1, 2018 under the modified retrospective method, and elected to apply the standard only to contracts that were not completed as of the date of adoption (i.e., January 1, 2018). In evaluating the impact of this new standard, the Company identified that lease contracts covered by Leases (Topic 840) are excluded from the scope of this new guidance. As such, this ASU had no material impact on the Company's reported revenues, results of operations, financial position, cash flows and disclosures.
In February 2016, the FASB issued ASU 2016-02, Leases (Topic 842), which supersedes the existing guidance for lease accounting Leases (Topic 840). ASU 2016-02 requires lessees to recognize leases on their balance sheets, and leaves lessor accounting largely unchanged. Leases pursuant to which the Company is the lessee primarily consists of ground leases. The amendments in this ASU are effective for the fiscal years beginning after December 15, 2018 and interim periods within those fiscal years. Early application is permitted for all entities. ASU 2016-02 requires a modified retrospective approach for all leases existing at, or entered into after, the date of initial application, with an option to elect to use certain transition relief. The Company has elected to use all of the practical expedients available for adoption of this ASU except for the hindsight expedient, which would require the re-evaluation of the lease term on all leases using current facts and circumstances. The Company has begun implementation of the ASU and is currently evaluating the overall impact of this ASU on its consolidated financial statements.
In June 2016, the FASB issued ASU 2016-13, Measurement of Credit Losses on Financial Instruments, which requires more timely recognition of credit losses associated with financial assets. ASU 2016-13 requires financial assets (or a group of financial assets) measured at an amortized cost basis to be presented at the net amount expected to be collected. ASU 2016-13 is effective for fiscal years beginning after December 15, 2019, including interim periods within those fiscal years. Early adoption is permitted for fiscal years beginning after December 15, 2018, including interim periods within those fiscal years. The Company is currently evaluating the impact of this ASU on its consolidated financial statements.
Note 3. Investments
Real Estate Investments
As of September 30, 2018, the Company’s gross investment in real estate properties and loans totaled approximately $2.9 billion, representing investments in 884 owned properties and eight properties securing mortgage loans. The gross investment is comprised of land, buildings, lease intangible assets and lease intangible liabilities, as adjusted for any impairment, and the carrying amount of loans receivable and real estate assets held for sale. The portfolio is geographically dispersed throughout 45 states with Texas, at 11.9%, as the only state with a Real Estate Investment Value greater than 10.0% of the Real Estate Investment Value of the Company’s entire portfolio.
12
SPIRIT MTA REIT
Notes to Consolidated Financial Statements
(Unaudited)
During the nine months ended September 30, 2018, the Company had the following real estate and loan activity, net of accumulated depreciation and amortization:
Number of Properties | Dollar Amount of Investments | |||||||||||||||||||
Owned | Financed | Total | Owned | Financed | Total | |||||||||||||||
(In Thousands) | ||||||||||||||||||||
Gross balance, December 31, 2017 | 907 | 11 | 918 | $ | 2,838,285 | $ | 32,307 | $ | 2,870,592 | |||||||||||
Acquisitions/improvements (1) | 19 | 2 | 21 | 169,564 | 37,888 | 207,452 | ||||||||||||||
Dispositions of real estate (2)(3) | (42 | ) | — | (42 | ) | (90,442 | ) | — | (90,442 | ) | ||||||||||
Principal payments and payoffs | — | (5 | ) | (5 | ) | — | (4,031 | ) | (4,031 | ) | ||||||||||
Impairments | — | — | — | (15,415 | ) | — | (15,415 | ) | ||||||||||||
Write-off of gross lease intangibles | — | — | — | (23,122 | ) | — | (23,122 | ) | ||||||||||||
Loan premium amortization and other | — | — | — | (267 | ) | 786 | 519 | |||||||||||||
Gross balance, September 30, 2018 | 884 | 8 | 892 | $ | 2,878,603 | $ | 66,950 | $ | 2,945,553 | |||||||||||
Accumulated depreciation and amortization | (682,940 | ) | — | (682,940 | ) | |||||||||||||||
Other non-real estate assets held for sale | 378 | — | 378 | |||||||||||||||||
Net balance, September 30, 2018 | $ | 2,196,041 | $ | 66,950 | $ | 2,262,991 | ||||||||||||||
(1) Includes investments of $1.7 million in revenue producing capitalized expenditures, as well as $0.7 million of non-revenue producing capitalized expenditures as of September 30, 2018.
(2) The total accumulated depreciation and amortization associated with dispositions of real estate was $23.0 million as of September 30, 2018.
(3) For the nine months ended September 30, 2018, the total loss on disposal of assets on held and used properties was $4.1 million and on held for sale properties was $3.4 million.
Scheduled minimum future contractual rent to be received under the remaining non-cancelable term of the operating leases (including contractual fixed rent increases occurring on or after October 1, 2018) are as follows (in thousands):
September 30, 2018 | |||
2018 Remainder | $ | 58,888 | |
2019 | 232,126 | ||
2020 | 222,310 | ||
2021 | 215,388 | ||
2022 | 202,488 | ||
Thereafter | 1,290,455 | ||
Total future minimum rentals | $ | 2,221,655 | |
Because lease renewal periods are exercisable at the option of the lessee, the preceding table presents future minimum lease payments due during the initial lease term only. In addition, the future minimum rentals do not include any contingent rent based on a percentage of the lessees’ gross sales or lease escalations based on future changes in the CPI or other stipulated reference rate.
13
SPIRIT MTA REIT
Notes to Consolidated Financial Statements
(Unaudited)
Loans Receivable
The following table details loans receivable, net of premium and allowance for loan losses (in thousands):
September 30, 2018 | December 31, 2017 | ||||||
Mortgage loans-principal | $ | 31,517 | $ | 32,665 | |||
Mortgage loans-premium, net of amortization | — | 31 | |||||
Allowance for loan losses | — | (389 | ) | ||||
Mortgage loans, net | 31,517 | 32,307 | |||||
Other note receivables - principal | 35,000 | — | |||||
Other notes receivables-discount, net of amortization | 433 | — | |||||
Total loans receivable, net | $ | 66,950 | $ | 32,307 | |||
The mortgage loans are secured by single-tenant commercial properties and generally have fixed interest rates over the term of the loans.
On April 30, 2018, Spirit contributed to the Company a $35.0 million B-1 Term Loan, included in the table above in other notes, as part of a syndicated loan and security agreement with Shopko as borrower and several banks as lenders. The B-1 Term Loan bears interest at a rate of 12% per annum and matures on June 19, 2020. Principal will be repaid in quarterly installments of $0.6 million commencing on November 1, 2018, while interest will be paid monthly. The loan is secured by Shopko’s assets in its $784 million asset-backed lending facility and is subordinate to other loans made under the syndicated loan and security agreement.
Lease Intangibles, Net
The following table details lease intangible assets and liabilities, net of accumulated amortization (in thousands):
September 30, 2018 | December 31, 2017 | ||||||
In-place leases | $ | 183,957 | $ | 191,557 | |||
Above-market leases | 23,864 | 24,691 | |||||
Less: accumulated amortization | (102,884 | ) | (113,986 | ) | |||
Intangible lease assets, net | $ | 104,937 | $ | 102,262 | |||
Below-market leases | $ | 38,099 | $ | 39,274 | |||
Less: accumulated amortization | (15,877 | ) | (15,427 | ) | |||
Intangible lease liabilities, net | $ | 22,222 | $ | 23,847 | |||
The amounts amortized as a net increase to rental revenue for capitalized above and below-market leases were $175 thousand and $63 thousand for the three months ended September 30, 2018 and 2017, respectively, and $501 thousand and $456 thousand for the nine months ended September 30, 2018 and 2017, respectively. The value of in place leases amortized and included in depreciation and amortization expense was $2.8 million and $2.6 million for the three months ended September 30, 2018 and 2017, respectively, and $8.1 million and $10.5 million for the nine months ended September 30, 2018 and 2017, respectively.
14
SPIRIT MTA REIT
Notes to Consolidated Financial Statements
(Unaudited)
Real Estate Assets Held for Sale
The following table shows the activity in real estate assets held for sale for the nine months ended September 30, 2018 (dollars in thousands):
Number of Properties | Carrying Value | |||||
Balances, December 31, 2017 | 7 | $ | 28,460 | |||
Transfers from real estate investments | 14 | 38,685 | ||||
Sales | (6 | ) | (19,263 | ) | ||
Transfers to real estate investments held and used | (5 | ) | (24,880 | ) | ||
Impairments | — | (896 | ) | |||
Balances, September 30, 2018 | 10 | $ | 22,106 | |||
Impairments
The following table summarizes total impairment losses recognized on the accompanying consolidated statements of operations and comprehensive income (loss) (in thousands):
Three Months Ended September 30, | Nine Months Ended September 30, | ||||||||||||||
2018 | 2017 | 2018 | 2017 | ||||||||||||
Real estate and intangible asset impairment | $ | 9,305 | $ | 14,550 | $ | 15,435 | $ | 26,876 | |||||||
Write-off of lease intangibles, net | 38 | 886 | (4 | ) | 472 | ||||||||||
Recovery of loans receivable, previously reserved | — | — | (16 | ) | — | ||||||||||
Total impairment loss | $ | 9,343 | $ | 15,436 | $ | 15,415 | $ | 27,348 | |||||||
Impairments for the three months ended September 30, 2018 were comprised of $9.3 million on properties classified as held and used. Impairments for the three months ended September 30, 2017 were comprised of $11.7 million on properties classified as held and used and $3.7 million on properties classified as held for sale. Impairments for the nine months ended September 30, 2018 were comprised of $14.5 million on properties classified as held and used and $0.9 million on properties classified as held for sale. Impairments for the nine months ended September 30, 2017 were comprised of $20.4 million on properties classified as held and used and $6.9 million on properties classified as held for sale.
Note 4. Debt
Master Trust 2014
The Company has access to an asset-backed securitization platform, Master Trust 2014, to raise capital through the issuance of non-recourse asset-back securities collateralized by commercial real estate, net-leases and mortgage loans. Master Trust 2014 has five bankruptcy-remote, special purpose entities as issuers or co-issuers of the notes.
On January 23, 2018, the Company re-priced a private offering of the Master Trust 2014 Series 2017-1 notes with an aggregate principal amount of $674.4 million. As a result, the interest rate on the Class B Notes was reduced from 6.35% to 5.49%, while the other terms of the Class B Notes remained unchanged. The terms of the Class A Notes were unaffected by the repricing. In connection with the repricing, the Company received $8.2 million in additional proceeds that reduced the debt discount. The additional proceeds were distributed to Spirit.
During the nine months ended September 30, 2018, the Company extinguished $6.3 million of Master Trust 2014 debt as a result of principal pre-payments, resulting in approximately $0.4 million in losses on debt extinguishment attributable to the pre-payment premiums paid. During the same period, scheduled principal payments of $24.9 million were made on the Master Trust 2014 notes.
15
SPIRIT MTA REIT
Notes to Consolidated Financial Statements
(Unaudited)
The Master Trust 2014 notes are summarized below:
Stated Rates (1) | Maturity | September 30, 2018 | December 31, 2017 | ||||||||
(in Years) | (in Thousands) | ||||||||||
Series 2014-1 Class A2 | 5.4% | 1.8 | $ | 243,632 | $ | 252,437 | |||||
Series 2014-2 | 5.8% | 2.5 | 230,541 | 234,329 | |||||||
Series 2014-3 | 5.7% | 3.5 | 309,884 | 311,336 | |||||||
Series 2014-4 Class A1 | 3.5% | 1.3 | 149,484 | 150,000 | |||||||
Series 2014-4 Class A2 | 4.6% | 11.3 | 345,200 | 358,664 | |||||||
Series 2017-1 Class A | 4.4% | 4.2 | 539,163 | 542,400 | |||||||
Series 2017-1 Class B | 5.5% | 4.2 | 132,000 | 132,000 | |||||||
Total Master Trust 2014 notes | 4.9% | 4.6 | 1,949,904 | 1,981,166 | |||||||
Debt discount, net | (22,834 | ) | (36,342 | ) | |||||||
Deferred financing costs, net | (15,749 | ) | (17,989 | ) | |||||||
Total Master Trust 2014, net | $ | 1,911,321 | $ | 1,926,835 | |||||||
(1) Represents the individual series stated interest rates as of September 30, 2018 and the weighted average stated rate of the total Master Trust 2014 notes, based on the collective series outstanding principal balances as of September 30, 2018.
As of September 30, 2018, the Master Trust 2014 notes were secured by 790 owned and financed properties. The notes issued under Master Trust 2014 are cross-collateralized by the assets of all issuers within this trust.
CMBS
On January 22, 2018, the Company entered into a new non-recourse loan agreement with Société Générale and Barclays Bank PLC as lenders, which is collateralized by a single distribution center property located in Katy, Texas. The loan has a stated interest rate of 5.14% and an effective interest rate of 5.42% as of September 30, 2018. As a result of the issuance, the Company received approximately $84.0 million in proceeds. The Company distributed all of the proceeds to Spirit. As of September 30, 2018, the loan had an outstanding principal balance of $83.3 million, after $0.7 million in scheduled principal payments, unamortized deferred financing costs of $1.1 million and a remaining maturity of 9.3 years.
Debt Maturities
As of September 30, 2018, scheduled debt maturities of Master Trust 2014 and CMBS debt are as follows (in thousands):
Scheduled Principal | Balloon Payment | Total | |||||||||
2018 Remainder | $ | 8,900 | $ | — | $ | 8,900 | |||||
2019 | 36,403 | — | 36,403 | ||||||||
2020 | 40,743 | 364,645 | 405,388 | ||||||||
2021 | 23,620 | 219,964 | 243,584 | ||||||||
2022 | 23,227 | 971,453 | 994,680 | ||||||||
Thereafter | 182,612 | 161,664 | 344,276 | ||||||||
Total | $ | 315,505 | $ | 1,717,726 | $ | 2,033,231 | |||||
16
SPIRIT MTA REIT
Notes to Consolidated Financial Statements
(Unaudited)
Interest Expense
The following table is a summary of the components of interest expense related to the Company’s borrowings (in thousands):
Three Months Ended September 30, | Nine Months Ended September 30, | ||||||||||||||
2018 | 2017 | 2018 | 2017 | ||||||||||||
Interest expense | $ | 25,160 | $ | 17,325 | $ | 75,555 | $ | 52,133 | |||||||
Non-cash interest expense: | |||||||||||||||
Amortization of deferred financing costs | 855 | 331 | 2,581 | 984 | |||||||||||
Amortization of debt discount | 1,657 | 1,077 | 5,291 | 3,207 | |||||||||||
Total interest expense | $ | 27,672 | $ | 18,733 | $ | 83,427 | $ | 56,324 | |||||||
Note 5. Stockholders' Equity and Redeemable Preferred Equity
The Company's declaration of trust authorizes it to issue 750,000,000 common shares of beneficial interest, $0.01 par value per share, and 20,000,000 preferred shares of beneficial interest, $0.01 par value per share. The Board of Trustees has the power, without shareholder approval, to increase or decrease the number of common shares the Company is authorized to issue.
Issuance of Common Stock
SMTA was originally capitalized on November 17, 2017 with the issuance of 10,000 shares of common stock of beneficial interest ($0.01 par value per share) for a total of $10,000.
On May 31, 2018, the distribution date, Spirit completed the Spin-Off of SMTA. On the distribution date, Spirit distributed on a pro rata basis one share of SMTA common stock for every ten shares of Spirit common stock held by each of Spirit's stockholders as of May 18, 2018, the record date. As a result, 42,851,010 shares of SMTA common stock were issued on May 31, 2018.
During the quarter ended September 30, 2018, the Company declared $14.2 million in SMTA Common Stock dividends and had 43,000,862 shares of Common Stock outstanding as of September 30, 2018.
Issuance of SMTA Preferred Stock
In conjunction with the Spin-Off, SMTA issued to the Manager and one of its affiliates, also a wholly-owned subsidiary of Spirit, 6.0 million shares of Series A preferred stock with an aggregate liquidation preference of $150.0 million (the "SMTA Preferred Stock"). Redemption value of the SMTA Preferred Stock is equal to the liquidation preference plus any accrued and unpaid dividends and redemption is under the control of the issuer unless a change of control event occurs, as defined in the SMTA Preferred Stock agreements. Therefore, as redemption may occur outside the control of the issuer, the SMTA Preferred Stock is classified as temporary equity.
The SMTA Preferred Stock pays cash dividends at the rate of 10.0% per annum on the liquidation preference of $25.00 per share (equivalent to $0.625 per share on a quarterly basis and $2.50 per share on an annual basis). During the quarter ended September 30, 2018, the Company paid $3.8 million in SMTA Preferred Stock dividends and had 6.0 million shares of 10.0% SMTA Preferred Stock outstanding as of September 30, 2018.
Issuance of SubREIT Preferred Stock
Prior to the Spin-Off, in exchange for property, SubREIT issued to the Manager 5,000 shares of Series A preferred stock with an aggregate liquidation preference of $5.0 million (the "SubREIT Preferred Stock"). Redemption value of the SubREIT Preferred Stock is equal to the liquidation preference plus any accrued and unpaid dividends and redemption is under the control of the issuer unless a change of control event occurs, as defined in the SubREIT Preferred Stock agreements. Therefore, as redemption may occur outside the control of the issuer, the SubREIT Preferred Stock is classified as temporary equity. In conjunction with the Spin-Off, the Manager sold the SubREIT Preferred Stock to a third-party.
17
SPIRIT MTA REIT
Notes to Consolidated Financial Statements
(Unaudited)
The SubREIT Preferred Stock pays cash dividends at the rate of 18.0% per annum on the liquidation preference of $1,000.00 per share (equivalent to $45.00 per share on a quarterly basis and $180.00 per share on an annual basis). During the quarter ended September 30, 2018, the Company paid $225 thousand in SubREIT Preferred Stock dividends and had 5,000 shares of the SubREIT Preferred Stock outstanding as of September 30, 2018.
Dividends Declared
For the nine months ended September 30, 2018, the Company's Board of Trustees declared the following stock dividends for SMTA Preferred Stock and SMTA Common Stock and SubREIT's Board of Directors declared the following stock dividends for SubREIT Preferred Stock:
Declaration Date | Dividend Per Share | Record Date | Total Amount (in thousands) | Payment Date | |||||||||
Preferred Stock | |||||||||||||
SMTA Preferred Stock (1) | Jun 19, 2018 | $ | 0.2083 | Jun 19, 2018 | $ | 1,250 | Jun 29, 2018 | ||||||
SubREIT Preferred Stock (1) | Jun 14, 2018 | $ | 15.0000 | Jun 19, 2018 | $ | 75 | Jun 29, 2018 | ||||||
SMTA Preferred Stock | Aug 9, 2018 | $ | 0.6250 | Sep 14, 2018 | $ | 3,750 | Sep 28, 2018 | ||||||
SubREIT Preferred Stock | Aug 9, 2018 | $ | 45.0000 | Sep 14, 2018 | $ | 225 | Sep 28, 2018 | ||||||
Common Stock | |||||||||||||
Aug 9, 2018 | $ | 0.3300 | Sep 28, 2018 | $ | 14,190 | Oct 15, 2018 | |||||||
(1) Dividend was prorated for the period from June 1, 2018 to June 30, 2018.
The Common Stock dividend declared on August 9, 2018 was paid on October 15, 2018 and is included in accounts payable, accrued expenses and other liabilities as of September 30, 2018.
Note 6. Related Party Transactions
Related Party Transfers and Acquisitions
The financial statements include transfers of properties between the Company and Spirit and its wholly-owned subsidiaries prior to the Spin-Off. During the nine months ended September 30, 2018, the Company transferred three properties to Spirit with a net book value of $2.1 million and during the nine months ended September 30, 2018 Spirit contributed ten properties to the Company with an aggregate net book value of $44.9 million and a $35.0 million B-1 Term Loan with Shopko as borrower, all of which are reflected as non-cash activity in the consolidated statement of cash flows. For the nine months ended September 30, 2017, the Company purchased one property from Spirit for $16.0 million, which is reflected in the consolidated statement of cash flows as acquisitions of real estate. For these transactions, due to all entities being under common control at the time of transaction, no gain or loss was recognized by the Company and the acquired properties are accounted for by the Company at their historical cost basis to Spirit. The amount paid in excess of historical cost basis was recognized as distribution to parent company.
During the third quarter of 2018, Spirit acquired a portfolio of properties and subsequently assigned three of the acquired properties to SMTA. In conjunction with the assignment, the Company paid a $392.5 thousand equalization payment to Spirit to ensure a consistent capitalization rate for the acquired properties between the Company and Spirit.
Related Party Loans Receivable
SMTA has four mortgage loans receivable where wholly-owned subsidiaries of Spirit are the borrower, and the loans are secured by six single-tenant commercial properties. These mortgage loans, which have a weighted average stated interest rate of 1.0%, were entered into by entities under common control of Spirit in conjunction with the issuance of the Series 2014 notes of Master Trust 2014 because the underlying properties did not qualify to be held directly as collateral by Master Trust 2014 under its governing agreements. In total, these mortgage notes had outstanding principal of $28.6 million and $30.8 million at September 30, 2018 and December 31, 2017, respectively, which is included in loans receivable, net on the consolidated balance sheets. The mortgage notes generated $72.2 thousand and $79.6 thousand of income for the three months ended September 30, 2018 and 2017, respectively, and $222.5 thousand and $244.7 thousand for the nine months ended September 30, 2018 and 2017, respectively, which is included in interest income on loans receivable in the consolidated statements of operations and comprehensive income (loss).
18
SPIRIT MTA REIT
Notes to Consolidated Financial Statements
(Unaudited)
As specified in the original loan agreements dated May 20, 2014, these mortgage notes have maturity dates between June 1, 2027 and April 1, 2028, with a weighted average maturity of 9.5 years at September 30, 2018.
Related Party Notes Payable
In conjunction with the Series 2017-1 notes issuance completed in December 2017, the Manager, as sponsor of the issuance, retained a 5% economic interest in the Master Trust 2014 Series 2017-1 notes as required by the risk retention rules issued under 17 CFR Part 246. The principal amount due to the Manager under the notes was $33.6 million and $33.7 million at September 30, 2018 and December 31, 2017, respectively, and is included in mortgages and notes payable, net on the consolidated balance sheets. The notes have a weighted average stated interest rate of 4.6% with a weighted average term of 4.2 years to expected maturity as of September 30, 2018. Interest expense on the consolidated statements of operations and comprehensive income (loss) for the three and nine months ended September 30, 2018 includes $0.4 million and $1.2 million of interest expense, respectively, paid to the Manager in relation to these notes.
Related Party Property Management and Servicing Agreement
The Manager provides property management services and special services for Master Trust 2014. The property management fees accrue daily at 0.25% per annum of the collateral value of the Master Trust 2014 Collateral Pool less any specially serviced assets, and the special servicing fees accrue daily at 0.75% per annum of the collateral value of any assets deemed to be specially serviced per the terms of the Property Management and Servicing Agreement dated May 20, 2014. During the three months ended September 30, 2018 and 2017, property management fees of $1.6 million and $1.1 million, respectively, were incurred and during the nine months ended September 30, 2018 and 2017, property management fees of $4.6 million and $3.4 million, respectively, were incurred. Special servicing fees of $0.2 million and $0.3 million were incurred during the three months ended September 30, 2018 and 2017, respectively, and $0.5 million and $0.7 million were incurred in the nine months ended September 30, 2018 and 2017, respectively. The property management fees and special servicing fees are included in related party fees in the consolidated statements of operations and comprehensive income (loss). As of September 30, 2018, the Company had an accrued payable balance of $0.4 million related to these fees.
Related Party Asset Management Agreement
In conjunction with the Spin-Off, SMTA and the Manager entered into the Asset Management Agreement pursuant to which the Manager will provide various services subject to the supervision of SMTA's Board of Trustees, including, but not limited to: (i) performing all of SMTA's day-to-day functions, (ii) sourcing, analyzing and executing on investments and dispositions, (iii) determining investment criteria, (iv) performing investment and liability management duties, including financing and hedging, and (v) performing financial and accounting management. As compensation for these services, SMTA will pay $20 million per annum, payable monthly in arrears. Additionally, the Manager may be entitled to, under certain circumstances, a promoted interest fee based on the total shareholder return of SMTA's common shares during the relevant period, as well as a termination fee. $1.6 million in expense for the promoted interest fee has been recognized as of September 30, 2018. The fair value of the promote fee was calculated using a Monte Carlo simulation model, which incorporated the initial 30-day volume weighted average share price of SMTA of $10.01, a projected volatility rate for SMTA, a risk-free rate, and other variables over the 36 month service period as defined in the Asset Management Agreement. The resulting total estimated fair value of the promote is $14.6 million and is amortized over the service period. During the three and nine months ended September 30, 2018, asset management fees of $5.0 million and $6.7 million were incurred, respectively, which are included in related party fees in the consolidated statements of operations and comprehensive income (loss). Asset management fees of $1.7 million and promote fees of $1.6 million were accrued at September 30, 2018 and are included in accounts payable, accrued expenses and other liabilities in the accompanying balance sheet.
Related Party Cost Sharing Arrangements and Other Accrued Balances
In conjunction with the Spin-Off, SMTA and Spirit entered into certain agreements, including the Separation and Distribution Agreement, Tax Matters Agreement, Registration Rights Agreement and Insurance Sharing Agreement. These agreements provide a framework for the relationship between the Company and Spirit after the Spin-Off, by which Spirit may incur certain expenses on behalf of SMTA that SMTA must reimburse in a timely manner. As part of the Separation and Distribution Agreement, Spirit contributed $3.0 million of cash to SMTA at the time of the Spin-Off. Additionally, in relation to rental payments received by SMTA subsequent to the Spin-Off that relate to rents prior to the Spin-Off, SMTA was required to reimburse $2.0 million to Spirit within 60 days of the Spin-Off, which was reimbursed
19
SPIRIT MTA REIT
Notes to Consolidated Financial Statements
(Unaudited)
to Spirit during the quarter ended September 30, 2018. There was $0.1 million payable to Spirit and $0.4 million receivable from Spirit in connection with these arrangements at September 30, 2018.
Expense Allocations
As described in Note 2, the accompanying consolidated financial statements present the operations of the Company as "carved out" from the financial statements of Spirit through the date of the Spin-Off. General and administrative expenses and transaction costs were first specifically identified based on direct usage or benefit. The remaining general and administrative expenses and transaction costs for the period prior to the Spin-Off have been allocated to the Company based on relative property count, which the Company believes to be a reasonable methodology. These allocated expenses are centralized corporate costs borne by Spirit for management and other services, including, but not limited to, executive oversight, asset management, property management, treasury, finance, human resources, tax, accounting, financial reporting, information technology and investor relations, as well as transaction costs incurred in connection with the Spin-Off. A summary of the amounts allocated by property count is provided below:
Three Months Ended September 30, | Nine Months Ended September 30, | ||||||||||||||
2018 | 2017 | 2018 | 2017 | ||||||||||||
Allocated corporate expenses: | |||||||||||||||
Cash compensation and benefits | $ | — | $ | 1,710 | $ | 3,965 | $ | 6,388 | |||||||
Stock compensation | — | 866 | 2,424 | 5,101 | |||||||||||
Professional fees | — | 881 | 1,013 | 2,759 | |||||||||||
Other corporate expenses | — | 504 | 1,068 | 1,734 | |||||||||||
Total corporate expenses | — | 3,961 | 8,470 | 15,982 | |||||||||||
Transaction Costs | — | 545 | 3,957 | 575 | |||||||||||
Total allocated costs | $ | — | $ | 4,506 | $ | 12,427 | $ | 16,557 | |||||||
Corporate expenses have been included within general and administrative expenses in the consolidated statements of operations and comprehensive income (loss).
Note 7. Commitments and Contingencies
The Company is periodically subject to claims or litigation in the ordinary course of business, including claims generated from business conducted by tenants on real estate owned by the Company. In these instances, the Company is typically indemnified by the tenant against any losses that might be suffered, and the Company and/or the tenant are insured against such claims.
As of September 30, 2018, there were no outstanding claims against the Company that are expected to have a material adverse effect on the Company’s financial position, results of operations or cash flows.
As of September 30, 2018, the Company had commitments totaling $2.6 million, all of which relate to funding improvements on properties the Company currently owns. The Company expects to be fund these commitments by the end of fiscal year 2019.
The Company estimates future costs for known environmental remediation requirements when it is probable that the Company has incurred a liability and the related costs can be reasonably estimated. The Company considers various factors when estimating its environmental liabilities, and adjustments are made when additional information becomes available that affects the estimated costs to study or remediate any environmental issues. When only a wide range of estimated amounts can be reasonably established and no other amount within the range is better than another, the low end of the range is recorded in the consolidated financial statements. As of September 30, 2018, no accruals have been made.
20
SPIRIT MTA REIT
Notes to Consolidated Financial Statements
(Unaudited)
Note 8. Fair Value Measurements
Nonrecurring Fair Value Measurements
Fair value measurement of an asset on a nonrecurring basis occurs when events or changes in circumstances related to an asset indicate that the carrying amount of the asset is no longer recoverable. Real estate and the related intangible assets are evaluated for impairment based on certain indicators including, but not limited to: the asset being held for sale, vacant, non-operating or the lease on the asset expiring in 60 days or less. The fair values of impaired real estate and intangible assets were determined by using the following information, depending on availability, in order of preference: signed purchase and sale agreements or letters of intent; recently quoted bid or ask prices, or market prices for comparable properties; estimates of cashflow, which consider, among other things, contractual and forecasted rental revenues, leasing assumptions, and expenses based upon market conditions; and expectations for the use of the real estate. Based on these inputs, the Company determined that its valuation of the impaired real estate and intangible assets falls within Level 3 of the fair value hierarchy.
The following table sets forth the Company’s assets that were accounted for at fair value on a nonrecurring basis as of September 30, 2018 and December 31, 2017 (in thousands):
Fair Value Hierarchy Level | |||||||||||||||
Description | Fair Value | Level 1 | Level 2 | Level 3 | |||||||||||
September 30, 2018 | |||||||||||||||
Long-lived assets held and used | $ | 24,999 | $ | — | $ | — | $ | 24,999 | |||||||
Long-lived assets held for sale | $ | 3,299 | $ | — | $ | — | $ | 3,299 | |||||||
December 31, 2017 | |||||||||||||||
Long-lived assets held and used | $ | 11,077 | $ | — | $ | — | $ | 11,077 | |||||||
Long-lived assets held for sale | $ | 30,956 | $ | — | $ | — | $ | 30,956 | |||||||
During the nine months ended September 30, 2018 and for the year ended December 31, 2017, we determined that 17 and five long-lived assets held and used, respectively, were impaired.
For four of the held and used properties impaired during the nine months ended September 30, 2018 and four of the held and used properties impaired during the year ended December 31, 2017, the Company estimated property fair value using the price per square foot of comparable properties. The following table provides information about the price per square foot of comparable properties used as inputs (price per square foot in dollars):
September 30, 2018 | December 31, 2017 | ||||||||||||||||
Range | Weighted Average | Square Footage | Range | Weighted Average | Square Footage | ||||||||||||
Long-lived assets held and used by asset type | |||||||||||||||||
Retail | $53.49 - $499.17 | $113.49 | 46,427 | $18.40 - $285.98 | $72.04 | 68,871 | |||||||||||
Office | $ | — | $ | — | — | $81.61 - $244.86 | $149.49 | 19,821 | |||||||||
21
SPIRIT MTA REIT
Notes to Consolidated Financial Statements
(Unaudited)
For the 13 held and used properties impaired during the nine months ended September 30, 2018 and one held and used property impaired during the year ended December 31, 2017, the Company estimated property fair value using the price per square foot based on a listing price or a broker opinion of value. The following table provides information about the price per square foot based on a listing price and a broker opinion of value used as inputs (price per square foot in dollars):
September 30, 2018 | December 31, 2017 | ||||||||||
Range | Weighted Average | Square Footage | Range | Weighted Average | Square Footage | ||||||
Long-lived assets held and used by asset type | |||||||||||
Retail | $57.50 - $109.79 | $86.43 | 222,531 | $88.89 | $88.89 | 22,500 | |||||
For the nine months ended September 30, 2018 and year ended December 31, 2017, we determined that one and six long-lived assets held for sale, respectively, were impaired. The Company estimated fair value of held for sale properties using price per square foot from signed purchase and sale agreements as follows (price per square foot in dollars):
September 30, 2018 | December 31, 2017 | ||||||||||||||
Range | Weighted Average | Square Footage | Range | Weighted Average | Square Footage | ||||||||||
Long-lived assets held for sale by asset type | |||||||||||||||
Retail | $38.87 | $38.87 | 90,334 | $55.30 - $346.23 | $299.89 | 87,248 | |||||||||
Industrial | $ | — | $ | — | — | $54.21 | $54.21 | 96,845 | |||||||
Estimated Fair Value of Financial Instruments
Financial assets and liabilities for which the carrying values approximate their fair values include cash and cash equivalents, restricted cash and escrow deposits, and accounts receivable and payable. Generally, these assets and liabilities are short-term in duration and are recorded at cost, which approximates fair value, on the accompanying consolidated balance sheets.
In addition to the disclosures for assets and liabilities required to be measured at fair value at the balance sheet date, companies are required to disclose the estimated fair values of all financial instruments, even if they are not carried at their fair values. The fair values of financial instruments are estimates based upon market conditions and perceived risks at September 30, 2018 and December 31, 2017. These estimates require management’s judgment and may not be indicative of the future fair values of the assets and liabilities.
The estimated fair values of the following financial instruments have been derived based on market quotes for comparable instruments or discounted cash flow analyses using estimates of the amount and timing of future cash flows, market rates and credit spreads. These measurements are classified as Level 2 of the fair value hierarchy. The following table discloses fair value information for these financial instruments (in thousands):
September 30, 2018 | December 31, 2017 | ||||||||||||||
Carrying Value | Estimated Fair Value | Carrying Value | Estimated Fair Value | ||||||||||||
Loans receivable, net | $ | 66,950 | $ | 67,507 | $ | 32,307 | $ | 29,076 | |||||||
Mortgages and notes payable, net (1) | $ | 1,993,572 | $ | 2,041,280 | $ | 1,926,835 | $ | 2,030,191 | |||||||
(1) The carrying value of the debt instruments are net of unamortized deferred financing costs and certain debt discounts/premiums.
Note 9. Significant Credit and Revenue Concentration
As of September 30, 2018 and December 31, 2017, the Company's real estate investments were operated by 205 and 201 tenants, respectively, that operate within retail, office and industrial property types across various industries throughout the U.S. Shopko operates in the general merchandise industry and is the Company's largest tenant as a percentage of rental revenue. Total rental revenues from properties leased to Shopko for the three months ended
22
SPIRIT MTA REIT
Notes to Consolidated Financial Statements
(Unaudited)
September 30, 2018 and 2017 contributed 18.9% and 22.1% of the rental revenue presented in the accompanying consolidated statements of operations and comprehensive income (loss). No other tenant contributed 5% or more of the rental revenue during any of the periods presented. As of both September 30, 2018 and December 31, 2017, the Company's net investment in Shopko properties represents approximately 14.0% and 15.8%, respectively, of the Company's total assets presented in the accompanying consolidated balance sheets. Additionally, the Company holds a B-1 Term Loan that was issued by Shopko in April 2018, see Note 3 for further discussion. This B-1 Term Loan contributed 89.4% of the interest income on loans receivable presented in the accompanying consolidated statement of operations and comprehensive income (loss) for the three months ended September 30, 2018. As of September 30, 2018, the B-1 Term Loan represents approximately 1.5% of the Company's total assets presented in the accompanying consolidated balance sheet.
Note 10. Income (Loss) Per Share
Income (loss) per share has been computed using the two-class method, which is computed by dividing the sum of distributed earnings to common stockholders and undistributed earnings allocated to common stockholders by the weighted average number of shares of common stock outstanding for the period. In applying the two-class method, undistributed earnings are allocated to both shares of common stock and any participating securities based on the weighted average shares outstanding during the period. Under the two-class method, any earnings attributable to unvested restricted shares are deducted from income (loss) from continuing operations in the computation of net income (loss) attributable to common stockholders.
The shares of common stock outstanding at the Spin-Off date are reflected as outstanding for all periods prior to the Spin-Off. The table below is a reconciliation of the numerator and denominator used in the computation of basic and diluted net income (loss) per share computed using the two-class method (dollars in thousands):
Three Months Ended September 30, | Nine Months Ended September 30, | ||||||||||||||
2018 | 2017 | 2018 | 2017 | ||||||||||||
Basic and diluted (loss) income: | |||||||||||||||
Net (loss) income and total comprehensive (loss) income | $ | (3,574 | ) | $ | (6,523 | ) | $ | (10,174 | ) | $ | 16,813 | ||||
Less: dividends paid to preferred stockholders | (3,975 | ) | — | (5,300 | ) | — | |||||||||
Less: income attributable to unvested restricted stock | (49 | ) | — | (49 | ) | — | |||||||||
Net (loss) income attributable to common stockholders used in basic and diluted (loss) income per share | $ | (7,598 | ) | $ | (6,523 | ) | $ | (15,523 | ) | $ | 16,813 | ||||
Basic weighted average shares of common stock outstanding: | |||||||||||||||
Weighted average shares of common stock outstanding | 42,974,801 | 42,851,010 | 42,892,727 | 42,851,010 | |||||||||||
Less: Unvested weighted average shares of restricted stock | (123,791 | ) | — | (41,717 | ) | — | |||||||||
Weighted average shares of common stock outstanding used in basic (loss) income per share | 42,851,010 | 42,851,010 | 42,851,010 | 42,851,010 | |||||||||||
Net (loss) income per share attributable to common stockholders | $ | (0.18 | ) | $ | (0.15 | ) | $ | (0.36 | ) | $ | 0.39 | ||||
Dilutive weighted average shares of common stock (1): | |||||||||||||||
Weighted average shares of common stock outstanding used in diluted (loss) income per share | 42,851,010 | 42,851,010 | 42,851,010 | 42,851,010 | |||||||||||
Net (loss) income per share attributable to common stockholders - diluted | $ | (0.18 | ) | $ | (0.15 | ) | $ | (0.36 | ) | $ | 0.39 | ||||
Total potentially dilutive shares of common stock (1) | — | — | — | — | |||||||||||
(1) As of September 30, 2018 and 2017, there were no adjustments to the weighted average shares of common stock outstanding used in the diluted calculation given there were no potentially dilutive shares.
23
SPIRIT MTA REIT
Notes to Consolidated Financial Statements
(Unaudited)
Note 11. Segments
Management views the operations of the Company as two separate segments—Master Trust 2014 and Other Properties—and makes operating decisions based on these two reportable segments. The business strategy for the Company as a whole is (i) to grow and reinforce Master Trust 2014 and (ii) to monetize the Other Properties to distribute proceeds to stockholders or redeploy into assets that can be added to the Collateral Pool of Master Trust 2014.
Master Trust 2014 is an asset-backed securitization platform, see Note 4, with specific criteria for operating the Collateral Pool, including restrictions on use of Release Account cash, concentration thresholds which cannot be exceeded, and a minimum debt service coverage ratio which must be met. Operations for the Other Properties are focused on monetization of the assets through dispositions, or could include redevelopment or outparcel development where prudent.
Segment results are comprised of revenues, property management and servicing fees, property expenses (which include property costs, depreciation and amortization, and impairments), and interest expense. General and administrative expenses, asset management fees under the Asset Management Agreement, transaction costs, and income taxes are not allocated to individual segments for purposes of assessing segment performance. The Company believes that segment results serve as a useful supplement to net (loss) income because they allow investors and management to measure the Company's progress against its stated strategy.
The performance of the reportable segments is not comparable with the Company's consolidated results and is not necessarily comparable with similar information for any other REITs. Additionally, because of the interrelationship of the segments, the information presented is not indicative of how the segments would perform if they operated as independent entities.
Segment results for the three and nine months ended September 30, 2018 and 2017 are as follows (in thousands):
Three Months Ended September 30, 2018 | Three Months Ended September 30, 2017 | |||||||||||||||||||||||
Master Trust 2014 | Other Properties | Total | Master Trust 2014 | Other Properties | Total | |||||||||||||||||||
Segment Results: | ||||||||||||||||||||||||
Revenues | $ | 46,174 | $ | 16,237 | $ | 62,411 | $ | 43,451 | $ | 15,708 | $ | 59,159 | ||||||||||||
Property Management and Servicing Fees (1) | (1,750 | ) | — | (1,750 | ) | (1,411 | ) | — | (1,411 | ) | ||||||||||||||
Property expenses | (20,660 | ) | (11,561 | ) | (32,221 | ) | (28,306 | ) | (9,210 | ) | (37,516 | ) | ||||||||||||
Interest expense | (26,551 | ) | (1,121 | ) | (27,672 | ) | (18,733 | ) | — | (18,733 | ) | |||||||||||||
Gain (loss) on disposition of assets | 1,386 | 2,824 | 4,210 | (185 | ) | (1,197 | ) | (1,382 | ) | |||||||||||||||
Segment (loss) income | $ | (1,401 | ) | $ | 6,379 | $ | 4,978 | $ | (5,184 | ) | $ | 5,301 | $ | 117 | ||||||||||
Non-allocated expenses | (8,552 | ) | (6,640 | ) | ||||||||||||||||||||
Net loss | $ | (3,574 | ) | $ | (6,523 | ) | ||||||||||||||||||
Nine Months Ended September 30, 2018 | Nine Months Ended September 30, 2017 | |||||||||||||||||||||||
Master Trust 2014 | Other Properties | Total | Master Trust 2014 | Other Properties | Total | |||||||||||||||||||
Segment Results: | ||||||||||||||||||||||||
Revenues | $ | 136,170 | $ | 47,267 | $ | 183,437 | $ | 126,237 | $ | 48,015 | $ | 174,252 | ||||||||||||
Property Management and Servicing Fees (1) | (5,164 | ) | — | (5,164 | ) | (4,150 | ) | — | (4,150 | ) | ||||||||||||||
Property expenses | (58,717 | ) | (25,138 | ) | (83,855 | ) | (66,114 | ) | (28,220 | ) | (94,334 | ) | ||||||||||||
Interest expense | (80,348 | ) | (3,079 | ) | (83,427 | ) | (56,324 | ) | — | (56,324 | ) | |||||||||||||
(Loss) gain on debt extinguishment | (363 | ) | — | (363 | ) | — | 1 | 1 | ||||||||||||||||
(Loss) gain on disposition of assets | (757 | ) | 8,221 | 7,464 | 5,527 | 12,669 | 18,196 | |||||||||||||||||
Segment (loss) income | $ | (9,179 | ) | $ | 27,271 | $ | 18,092 | $ | 5,176 | $ | 32,465 | $ | 37,641 | |||||||||||
Non-allocated expenses | (28,266 | ) | (20,828 | ) | ||||||||||||||||||||
Net (loss) income | $ | (10,174 | ) | $ | 16,813 | |||||||||||||||||||
(1) Property Management and Servicing Fees are included in related party fees in the consolidated statements of operations and comprehensive income (loss). Asset Management Fees, the other component of related party fees, are included in non-allocated expenses above.
24
SPIRIT MTA REIT
Notes to Consolidated Financial Statements
(Unaudited)
Assets and liabilities by reportable segment are as follows (in thousands):
September 30, 2018 | December 31, 2017 | |||||||||||||||||||||||
Master Trust 2014 | Other Properties | Total | Master Trust 2014 | Other Properties | Total | |||||||||||||||||||
Net investments | $ | 1,750,855 | $ | 534,358 | $ | 2,285,213 | $ | 1,721,583 | $ | 514,752 | $ | 2,236,335 | ||||||||||||
Restricted cash | 19,034 | 2,122 | 21,156 | 66,504 | — | 66,504 | ||||||||||||||||||
Segment assets | $ | 1,769,889 | $ | 536,480 | $ | 2,306,369 | $ | 1,788,087 | $ | 514,752 | $ | 2,302,839 | ||||||||||||
Other assets | 78,347 | 54,821 | ||||||||||||||||||||||
Total assets | $ | 2,384,716 | $ | 2,357,660 | ||||||||||||||||||||
Mortgages and notes payable, net | $ | 1,911,321 | $ | 82,251 | $ | 1,993,572 | $ | 1,926,835 | $ | — | $ | 1,926,835 | ||||||||||||
Intangible lease liabilities, net | 17,593 | 4,629 | 22,222 | 19,725 | 4,122 | 23,847 | ||||||||||||||||||
Segment liabilities | $ | 1,928,914 | $ | 86,880 | $ | 2,015,794 | $ | 1,946,560 | $ | 4,122 | $ | 1,950,682 | ||||||||||||
Other liabilities | 32,885 | 16,060 | ||||||||||||||||||||||
Total liabilities | $ | 2,048,679 | $ | 1,966,742 | ||||||||||||||||||||
Dispositions by reportable segment are as follows (dollars in thousands):
Nine Months Ended September 30, 2018 | Nine Months Ended September 30, 2017 | |||||||||||||
Properties(1) | Gross Proceeds(1) | Properties | Gross Proceeds | |||||||||||
Master Trust 2014 | 29 | $ | 31,796 | 42 | $ | 62,463 | ||||||||
Other Properties | 10 | 44,022 | 22 | 73,158 | ||||||||||
Total | 39 | $ | 75,818 | 64 | $ | 135,621 | ||||||||
(1) Excludes three properties transfered to Spirit prior to the Spin-Off, see Note 6.
Note 12. 2018 Incentive Award Plan
During the nine months ended September 30, 2018, the Company granted 149.9 thousand restricted shares under the 2018 Incentive Award Plan to members of the Board of Trustees, all of which were unvested as of September 30, 2018. The Company recorded $1.7 million in deferred compensation associated with these grants, which will be recognized over the service period of the awards.
For both the three and nine months ended September 30, 2018, the Company recognized $451.2 thousand in stock-based compensation expense, which is included in general and administrative expenses in the accompanying consolidated statements of operations and comprehensive income (loss).
As of September 30, 2018, the remaining unamortized stock-based compensation expense totaled $1.2 million, all of which is related to restricted stock awards. Amortization is recognized on a straight-line basis over the service period of the awards.
25
SPIRIT MTA REIT
Notes to Consolidated Financial Statements
(Unaudited)
Note 13. Subsequent Events
CMBS Loan
On November 1, 2018, SMTA closed on a $165.0 million non-recourse financing loan secured by our remaining 85 Shopko assets in our Other Properties portfolio. The loan is pre-payable, in whole or in part, without penalty and bears interest at a rate of one month LIBOR plus 750 basis points. The loan is subject to scheduled amortization payments of $1.0 million per month. The initial maturity is November 15, 2019, with two one-year extension options, subject to certain conditions.
Variable Funding Note
On November 1, 2018, SMTA closed on a $50.0 million variable funding note ("VFN") within Master Trust 2014, which is secured by properties of Master Trust 2014 and has an anticipated repayment date of November 1, 2021. Interest on the VFN will be payable at a rate per annum equal to the CP Rate, Base Rate or Eurodollar Rate, each as defined in the Note Purchase Agreement. There is a commitment fee on the unused portion of the VFN of 0.5% per annum. No funds have been drawn on the VFN as of November 7, 2018.
26
Item 2. Management’s Discussion and Analysis of Financial Condition and Results of Operations
FORWARD-LOOKING STATEMENTS
This quarterly report contains forward-looking statements within the meaning of the federal securities laws. When used in this quarterly report, the words “estimate,” “anticipate,” “expect,” “believe,” “intend,” “may,” “will,” “should,” “seek,” “approximately” or “plan,” or the negative of these words or similar words or phrases that are predictions of or indicate future events or trends and which do not relate solely to historical matters are intended to identify forward-looking statements. You can also identify forward-looking statements by discussions of strategy, plans or intentions of management.
Forward-looking statements involve numerous risks and uncertainties and you should not rely on them as predictions of future events. Forward-looking statements depend on assumptions, data or methods which may be incorrect or imprecise and we may not be able to realize them. We do not guarantee that the transactions and events described will happen as described (or that they will happen at all).
The following risks and uncertainties, among others, could cause actual results and future events to differ materially from those set forth or contemplated in the forward-looking statements:
◦ | industry and economic conditions; |
◦ | volatility and uncertainty in the financial markets, including potential fluctuations in the CPI; |
◦ | our success in implementing our business strategy and our ability to identify, underwrite, finance, consummate, integrate and manage diversifying acquisitions or investments; |
◦ | the financial performance of our retail tenants and the demand for retail space, particularly with respect to challenges being experienced by general merchandise retailers; |
◦ | our ability to diversify our tenant base and reduce the concentration of our significant tenant; |
◦ | the nature and extent of future competition; |
◦ | increases in our costs of borrowing as a result of changes in interest rates and other factors; |
◦ | our ability to access debt and equity capital markets; |
◦ | our ability to pay down, refinance, restructure and/or extend our indebtedness as it becomes due; |
◦ | our ability and willingness to renew our leases upon expiration and to reposition our properties on the same or better terms upon expiration in the event such properties are not renewed by tenants or we exercise our rights to replace existing tenants upon default; |
◦ | the impact of any financial, accounting, legal or regulatory issues or litigation that may affect us or our major tenants; |
◦ | our ability to manage our expanded operations; |
◦ | our ability and willingness to maintain our qualification as a REIT; |
◦ | our relationship with our Manager and its ability to retain qualified personnel; |
◦ | potential conflicts of interest with our Manager or Spirit; |
◦ | our ability to achieve the intended benefits from our Spin-Off from Spirit; and |
◦ | other risks inherent in the real estate business, including tenant defaults, potential liability relating to environmental matters, illiquidity of real estate investments and potential damages from natural disasters. |
The factors included in this quarterly report, including the documents incorporated by reference and documents we subsequently file with the SEC and incorporate by reference, are not exhaustive and additional factors could adversely affect our business and financial performance. For a discussion of additional risk factors, see the factors included under the caption “Risk Factors” in our Information Statement filed as Exhibit 99.1 to our Form 10 filed on May 4, 2018. All forward-looking statements are based on information that was available, and speak only, as of the date on which they were made. We disclaim any obligation to publicly update or revise any forward-looking statement to reflect changes in underlying assumptions or factors, new information, data or methods, future events or other changes, except as required by law.
27
OVERVIEW AND BASIS OF PRESENTATION
SMTA was formed for the purpose of receiving, via contribution from Spirit, the legal entities which held (i) Master Trust 2014, an asset-backed securitization trust which issues non-recourse asset-back securities collateralized by commercial real estate, net-leases and mortgage loans, (ii) all of Spirit's properties leased to Shopko, (iii) a single distribution center property leased to a sporting goods tenant encumbered with CMBS debt, and (iv) a portfolio of unencumbered properties, as well as newly formed legal entities that hold ten additional properties contributed to SMTA with an aggregate net book value of $44.9 million, a $35.0 million B-1 Term Loan with Shopko as borrower, and a cash contribution of $3.0 million. The activities of the newly formed legal entities are not reflected in the accompanying financial statements balances or results of operations prior to May 31, 2018, but the ten additional properties, the B-1 Term Loan and cash are reflected as contributions within the three and nine months ended September 30, 2018 as of their respective legal dates of transfer.
On May 31, 2018, the distribution date, Spirit completed the Spin-Off of SMTA. On the distribution date, Spirit distributed on a pro rata basis one share of SMTA common stock for every ten shares of Spirit common stock held by each of Spirit's stockholders as of May 18, 2018, the record date. As a result, 42,851,010 shares of SMTA common were issued on May 31, 2018.
In connection with the Spin-Off, SMTA entered into an Asset Management Agreement with Spirit Realty, L.P. (our "Manager"), a wholly-owned subsidiary of Spirit, under which Spirit Realty, L.P. provides various services including, but not limited to: active portfolio management (including underwriting and risk management), financial reporting, and SEC compliance. The fees for these services are a flat rate of $20 million per annum. Additionally, Spirit Realty, L.P. continues as the property manager and special servicer of Master Trust 2014, under which Spirit Realty, L.P. receives property management fees which accrue daily at 0.25% per annum of the collateral value of the Master Trust 2014 Collateral Pool less any specially serviced assets, and special servicing fees which accrue daily at 0.75% per annum of the collateral value of any assets deemed to be specially serviced per the terms of the Property Management and Servicing Agreement. SMTA and Spirit also entered into a Separation and Distribution Agreement, an Insurance-Sharing Agreement, a Tax Matters Agreement, and a Registration Rights Agreement in connection with the Spin-Off.
SMTA expects to operate in a manner intended to enable it to qualify as a REIT under the applicable provisions of the Internal Revenue Code of 1986, as amended. To maintain REIT status, SMTA must meet a number of organizational and operational requirements, including a requirement to distribute annually to shareholders at least 90% of SMTA’s REIT taxable income, determined without regard to the dividends paid deduction and excluding any net capital gains. Management believes the Company has qualified and will continue to qualify as a REIT and therefore, no provision has been made for federal income taxes for the period presented subsequent to the Spin-Off. For the period presented prior to the Spin-Off, the Company was disregarded for federal income tax purposes, so no provision for federal income tax was made. SMTA is subject to certain other taxes, including state taxes, which have been reflected as income tax expense in the consolidated statements of operations and comprehensive income (loss).
The accompanying financial statements include the consolidated accounts of the Company and its wholly-owned subsidiaries for the period subsequent to the Spin-Off on May 31, 2018. The pre-spin financial statements were prepared on a carve-out basis and reflect the combined net assets and operations of the predecessor legal entities which formed the Company at the time of the Spin-Off. GAAP requires us to make estimates and assumptions that affect the reported amounts of assets and liabilities, and revenues and expenses during the reporting periods. Actual results could differ from these estimates. The historical financial results prior to the Spin-Off include allocated expenses for certain corporate costs which we believe are reasonable. These expenses were based on either actual costs incurred or a proportion of costs estimated to be allocable to SMTA based on the relative property count of the Company to those owned by Spirit as a whole. Such costs do not necessarily reflect what the actual costs would have been if SMTA had been operating as a separate standalone public company. These expenses are discussed further in Note 6 of the accompanying financial statements.
CRITICAL ACCOUNTING POLICIES AND ESTIMATES
The preparation of financial statements in conformity with GAAP requires management to use judgment in the application of accounting policies, including making estimates and assumptions. We base estimates on the best information available to us at the time, our experience and various other assumptions deemed reasonable under the circumstances. From time to time, we re-evaluate our estimates and assumptions. In the event estimates or assumptions prove to be different from actual results, adjustments are made in subsequent periods to reflect more current estimates and assumptions about matters that are inherently uncertain. A summary of our critical accounting policies is included under the caption “Management’s Discussion and Analysis of Financial Condition and Results of Operations” in our
28
Information Statement filed as Exhibit 99.1 to our Registration Statement on Form 10 filed on May 4, 2018. We have not made any material changes to these policies during the periods covered by this quarterly report.
HIGHLIGHTS
For the three months ended September 30, 2018:
• | Invested $97.4 million in acquisitions comprising five properties, with a weighted average lease term of 15.8 years, a weighted-average initial cash yield of approximately 6.44% and an economic yield of 7.60%. |
• | Disposed of nine properties for $31.6 million in gross proceeds. Among the sales were five properties leased to Shopko for gross proceeds of $23.1 million. |
• | The Board of Trustees of SMTA declared a total cash dividend of $0.33 per common share and a cash dividend of $0.625 per share of SMTA Preferred Stock. |
• | Generated Net Loss of $0.18 per share, FFO of $0.43 per share and AFFO of $0.52 per share. |
RESULTS OF OPERATIONS
Comparison of the Three Months Ended September 30, 2018 to the Three Months Ended September 30, 2017
Three Months Ended September 30, | ||||||||||||||
(In Thousands) | 2018 | 2017 | Change | % Change | ||||||||||
Revenues: | ||||||||||||||
Rentals | $ | 59,769 | $ | 55,257 | $ | 4,512 | 8.2 | % | ||||||
Interest income on loans receivable | 1,131 | 217 | 914 | NM | ||||||||||
Tenant reimbursement income | 518 | 691 | (173 | ) | (25.0 | )% | ||||||||
Other income | 993 | 2,994 | (2,001 | ) | (66.8 | )% | ||||||||
Total revenues | 62,411 | 59,159 | 3,252 | 5.5 | % | |||||||||
Expenses: | ||||||||||||||
General and administrative | 1,795 | 4,862 | (3,067 | ) | (63.1 | )% | ||||||||
Related party fees | 8,369 | 1,411 | 6,958 | NM | ||||||||||
Transaction costs | 78 | 1,733 | (1,655 | ) | (95.5 | )% | ||||||||
Property costs (including reimbursable) | 1,909 | 2,189 | (280 | ) | (12.8 | )% | ||||||||
Interest | 27,672 | 18,733 | 8,939 | 47.7 | % | |||||||||
Depreciation and amortization | 20,969 | 19,891 | 1,078 | 5.4 | % | |||||||||
Impairment | 9,343 | 15,436 | (6,093 | ) | (39.5 | )% | ||||||||
Total expenses | 70,135 | 64,255 | 5,880 | 9.2 | % | |||||||||
Loss before other income (expense) and income tax expense | (7,724 | ) | (5,096 | ) | (2,628 | ) | (51.6 | )% | ||||||
Other income (expense): | ||||||||||||||
Gain (loss) on disposition of real estate assets | 4,210 | (1,382 | ) | 5,592 | NM | |||||||||
Total other income (expense) | 4,210 | (1,382 | ) | 5,592 | NM | |||||||||
Loss before income tax expense | (3,514 | ) | (6,478 | ) | 2,964 | 45.8 | % | |||||||
Income tax expense | (60 | ) | (45 | ) | (15 | ) | (33.3 | )% | ||||||
Net loss | $ | (3,574 | ) | $ | (6,523 | ) | $ | 2,949 | 45.2 | % | ||||
NM-Percentages over 100% are not displayed.
29
Revenues
Rentals
Rental revenue for the comparative period increased primarily as a result of increases in contractual rents, which increased 7.4% as SMTA was a net acquirer over the trailing twelve-month period (based on Real Estate Investment Value). We received ten properties from Spirit as a contribution in conjunction with the Master Trust 2014 issuance with a Real Estate Investment Value of $238.1 million, acquired nine properties for $112.7 million, and received an additional ten properties from Spirit in conjunction with the Spin-Off with a Real Estate Investment Value of $54.2 million. During the same period, we disposed of 51 properties with a Real Estate Investment Value of $104.4 million and transfered three properties to Spirit in conjunction with the Spin-Off with a Real Estate Investment Value of $3.2 million. Additionally, as of September 30, 2018, 24 of our properties were vacant, compared to 32 vacancies as of December 31, 2017.
During the three months ended September 30, 2018 and 2017, non-cash rental revenues were $0.8 million and $0.7 million, respectively, representing approximately 1.3% and 1.2%, respectively, of total rental revenue.
Interest income on loans receivable
The increase in interest income on loans receivable is a result of the contribution from Spirit of the $35.0 million B-1 12% term loan with Shopko as borrower prior to the completion of the Spin-Off. Interest income on mortgage loans remained relatively flat period-over-period.
Tenant reimbursement income
We have a number of leases that require our tenants to reimburse us for certain property costs we incur, which we record on a gross basis. As such, tenant reimbursement income is driven by the tenant reimbursable property costs described below, less an allowance for reimbursable expenses determined to be uncollectible from our tenants.
Other income
Period-over-period other income decreased primarily due to a decrease in lease termination fees received. For the three months ended September 30, 2018, we received $0.4 million in lease termination fees from eight properties with tenants in the restaurant - casual dining industry, compared to $2.8 million in lease termination fees received primarily from one property with a tenant in the medical/other office industry during the three months ended September 30, 2017.
Expenses
General and administrative and Transaction costs
For periods prior to the Spin-Off, general administrative expenses and transaction costs are comprised of amounts specifically identified and amounts allocated from Spirit's financial statements.
Specifically identified expenses: All $1.8 million of the general and administrative expenses during the three months ended September 30, 2018 and $0.9 million of the general and administrative expenses for the same period in 2017 were specifically identified based on direct usage or benefit. Transaction costs are the expenses associated with the Spin-Off. All $0.1 million of the transaction costs during the three months ended September 30, 2018 and $1.2 million of the transaction costs for the same period in 2017 were specifically identified based on direct usage or benefit. As a result, specifically identified expenses remained relatively flat at $1.9 million during the three months ended September 30, 2018, compared to $2.1 million during the three months ended September 30, 2017.
Allocated expenses: The decrease in general and administrative expenses and transaction costs period-over-period is a result of there being no allocated expenses for the three months ended September 30, 2018 since SMTA operated as an independent company, compared to approximately $4.5 million of allocated expenses for the three months ended September 30, 2017. These have been allocated from Spirit’s financial statements, based on SMTA's property count relative to Spirit’s property count. SMTA's property count was 920 properties at September 30, 2017 compared to Spirit’s property count of 2,525 properties.
Related party fees
In conjunction with the Spin-Off, SMTA entered into the Asset Management Agreement with Spirit Realty, L.P. for a $20 million flat fee per annum, plus a promoted interest fee based on the total shareholder return of SMTA's common
30
shares during the relevant period if certain conditions are met. Therefore, asset management fees of $5.0 million were incurred and a promoted interest of $1.6 million was recognized for the three months ended September 30, 2018, which was the primary driver of the increase in related party fees period-over-period.
Additionally, property management fees for Master Trust 2014 accrue daily at 0.25% per annum of the collateral value of the Master Trust 2014 Collateral Pool less any specially serviced assets and special servicing fees which accrue daily at 0.75% per annum of the collateral value of any assets deemed to be specially serviced per the terms of the Property Management and Servicing Agreement. Collateral value of Master Trust 2014 has increased from $1.9 billion at September 30, 2017 to $2.6 billion at September 30, 2018 as a result of the issuance completed in December 2017 and acquisitions in 2018. The increase in collateral value resulted in an increase of property management and special servicing fees paid to our Manager of $0.3 million period-over-period.
Property costs (including reimbursable)
For the three months ended September 30, 2018, property costs were $1.9 million (including $0.9 million of tenant reimbursable expenses) compared to $2.2 million (including $0.8 million of tenant reimbursable expenses) for the same period in 2017. The decrease in non-reimbursable costs of $0.4 million was driven primarily by a decrease in non-reimbursable property taxes on vacant properties, as well as a decrease in non-reimbursable property taxes on operating properties as a result of fewer tenant credit issues.
Interest
The increase in interest expense is primarily related to the new issuance of Master Trust 2014 notes in December 2017 and a new CMBS loan entered into in January 2018. See Note 4 to the financial statements herein.
The following table summarizes our interest expense:
Three Months Ended September 30, | |||||||
(In Thousands) | 2018 | 2017 | |||||
Interest expense-Master Trust 2014 | $ | 24,064 | $ | 17,325 | |||
Interest expense-CMBS | 1,096 | — | |||||
Non-cash interest expense: | |||||||
Amortization of deferred financing costs | 855 | 331 | |||||
Amortization of debt discount, net | 1,657 | 1,077 | |||||
Total interest expense | $ | 27,672 | $ | 18,733 | |||
Depreciation and amortization
During the twelve months ended September 30, 2018, we acquired or received through contribution 29 properties, representing a Real Estate Investment Value of $405.0 million, and we disposed of or contributed 54 properties with a Real Estate Investment Value of $107.6 million. Therefore, as a net acquirer during the period based on Real Estate Investment Value, depreciation and amortization increased period-over-period.
The following table summarizes our depreciation and amortization expenses:
Three Months Ended September 30, | |||||||
(In Thousands) | 2018 | 2017 | |||||
Depreciation of real estate assets | $ | 18,218 | $ | 17,280 | |||
Amortization of lease intangibles | 2,751 | 2,611 | |||||
Total depreciation and amortization | $ | 20,969 | $ | 19,891 | |||
Impairment
During the three months ended September 30, 2018, we recorded impairment losses of $9.3 million, of which $6.3 million of the impairment was recorded on four vacant held for use properties. The remaining $3.0 million of impairment was recorded on three underperforming held for use properties.
31
During the three months ended September 30, 2017, we recorded impairment losses of $15.4 million, of which $12.8 million of the impairment was recorded on vacant properties, comprised of $12.0 million recorded on five vacant held for use properties and $0.8 million recorded on one vacant held for sale property. The remaining $2.6 million of impairment was recorded on underperforming properties, comprised of $2.9 million recorded on five underperforming held for sale properties, offset by a $0.3 million write-off of intangible lease liabilities on one underperforming held for use property.
Gain (loss) on disposition of assets
During the three months ended September 30, 2018, we disposed of nine properties and recorded net gains totaling $4.2 million. There were $3.0 million in net gains on the sale of six active properties, including the sale of five properties operated by Shopko. The remaining $1.2 million in net gains were from the sale of three vacant properties.
For the same period in 2017, we disposed of 33 properties and recorded net losses totaling $1.4 million. There were $0.5 million in net losses on the sale of three properties operated by Shopko. The remaining $0.9 million in net losses were from the sale of 30 vacant properties.
RESULTS OF OPERATIONS
Comparison of the Nine Months Ended September 30, 2018 to the Nine Months Ended September 30, 2017
Nine Months Ended September 30, | ||||||||||||||
(In Thousands) | 2018 | 2017 | Change | % Change | ||||||||||
Revenues: | ||||||||||||||
Rentals | $ | 178,040 | $ | 167,645 | $ | 10,395 | 6.2 | % | ||||||
Interest income on loans receivable | 1,964 | 622 | 1,342 | NM | ||||||||||
Tenant reimbursement income | 1,499 | 1,841 | (342 | ) | (18.6 | )% | ||||||||
Other income | 1,934 | 4,144 | (2,210 | ) | (53.3 | )% | ||||||||
Total revenues | 183,437 | 174,252 | 9,185 | 5.3 | % | |||||||||
Expenses: | ||||||||||||||
General and administrative | 11,221 | 18,593 | (7,372 | ) | (39.6 | )% | ||||||||
Related party fees | 13,450 | 4,150 | 9,300 | NM | ||||||||||
Transaction costs | 8,620 | 2,100 | 6,520 | NM | ||||||||||
Property costs (including reimbursable) | 5,369 | 6,210 | (841 | ) | (13.5 | )% | ||||||||
Interest | 83,427 | 56,324 | 27,103 | 48.1 | % | |||||||||
Depreciation and amortization | 63,071 | 60,776 | 2,295 | 3.8 | % | |||||||||
Impairment | 15,415 | 27,348 | (11,933 | ) | (43.6 | )% | ||||||||
Total expenses | 200,573 | 175,501 | 25,072 | 14.3 | % | |||||||||
Loss before other income and income tax expense | (17,136 | ) | (1,249 | ) | (15,887 | ) | NM | |||||||
Other income: | ||||||||||||||
(Loss) gain on debt extinguishment | (363 | ) | 1 | (364 | ) | NM | ||||||||
Gain on disposition of real estate assets | 7,464 | 18,196 | (10,732 | ) | (59.0 | )% | ||||||||
Total other income | 7,101 | 18,197 | (11,096 | ) | (61.0 | )% | ||||||||
(Loss) income before income tax expense | (10,035 | ) | 16,948 | (26,983 | ) | NM | ||||||||
Income tax expense | (139 | ) | (135 | ) | (4 | ) | (3.0 | )% | ||||||
Net (loss) income | $ | (10,174 | ) | $ | 16,813 | $ | (26,987 | ) | NM | |||||
NM-Percentages over 100% are not displayed.
32
Revenues
Rentals
Rental revenue for the comparative period increased primarily as a result of increases in contractual rents, which increased 5.9% as SMTA was a net acquirer over the trailing twelve-month period (based on Real Estate Investment Value). We received ten properties from Spirit as a contribution in conjunction with the Master Trust 2014 issuance with a Real Estate Investment Value of $238.1 million, acquired nine properties for $112.7 million, and received an additional ten properties from Spirit in conjunction with the Spin-Off with a Real Estate Investment Value of $54.2 million. During the same period, we disposed of 51 properties with a Real Estate Investment Value of $104.4 million and transfered three properties to Spirit in conjunction with the Spin-Off with a Real Estate Investment Value of $3.2 million. Additionally, as of September 30, 2018, 24 of our properties were vacant, compared to 32 vacancies as of December 31, 2017.
During the nine months ended September 30, 2018 and 2017, non-cash rental revenues were $2.2 million and $2.5 million, respectively, representing approximately 1.2% and 1.5%, respectively, of total rental revenue.
Interest income on loans receivable
The increase in interest income on loans receivable is a result of the contribution from Spirit of the $35.0 million B-1 12% term loan with Shopko as borrower prior to the completion of the Spin-Off. Interest income on mortgage loans remained relatively flat period-over-period.
Tenant reimbursement income
We have a number of leases that require our tenants to reimburse us for certain property costs we incur, which we record on a gross basis. As such, tenant reimbursement income is driven by the tenant reimbursable property costs described below, less an allowance for reimbursable expenses determined to be uncollectible from our tenants.
Other income
Period-over-period other income decreased primarily due to a decrease in lease termination fees received. For the nine months ended September 30, 2018, we received $0.5 million in lease termination fees primarily received from eight properties with tenants in the restaurant - casual dining industry, compared to $3.5 million in lease termination fees received primarily from one property with a tenant in the medical/other office industry and nine properties with tenants in the restaurant - casual dining industry during the nine months ended September 30, 2017.
Expenses
General and administrative and Transaction costs
For periods prior to the Spin-Off, general administrative expenses and transaction costs are comprised of amounts specifically identified and amounts allocated from Spirit's financial statements.
Specifically identified expenses: General and administrative expenses of $2.8 million and $2.6 million during the nine months ended September 30, 2018 and 2017, respectively, were specifically identified based on direct usage or benefit. Transaction costs are the expenses associated with the Spin-Off and, for the nine months ended September 30, 2018, $4.7 million were specifically identified based on direct usage or benefit. For nine months ended September 30, 2017, $1.5 million of transaction costs were specifically identified. As such, specifically identified expenses increased period-over-period, primarily as a result of increases in specifically identified transaction costs period-over-period.
Allocated expenses: The increase from specifically identified expenses was offset by a decrease in allocated general and administrative expenses and transaction costs period-over-period. These have been allocated from Spirit’s financial statements for the periods prior to the completion of the Spin-Off, based on SMTA's property count relative to Spirit’s property count. SMTA’s property count decreased from 920 properties at September 30, 2017 compared to 893 properties at May 31, 2018. Spirit’s property count also decreased from 2,525 properties to 2,432 for the same period. As such, the allocation percentage year over year remained relatively flat. Therefore, the net decrease in allocated expenses is a direct result of Spirit’s decreased general and administrative expenses period-over-period, partially offset by an increase in transaction costs.
33
Related party fees
In conjunction with the Spin-Off, SMTA entered into the Asset Management Agreement with Spirit Realty, L.P. for a $20 million flat fee per annum, plus a promoted interest fee based on the total shareholder return of SMTA's common shares during the relevant period if certain conditions are met. Therefore, asset management fees of $6.7 million were incurred and a promoted interest of $1.6 million was recognized for the four months subsequent to the Spin-Off, which was the primary driver of the increase in related party fees period-over-period.
Additionally, property management fees for Master Trust 2014 accrue daily at 0.25% per annum of the collateral value of the Master Trust 2014 Collateral Pool less any specially serviced assets and special servicing fees which accrue daily at 0.75% per annum of the collateral value of any assets deemed to be specially serviced per the terms of the Property Management and Servicing Agreement. Collateral value of Master Trust 2014 has increased from $1.9 billion at September 30, 2017 to $2.6 billion at September 30, 2018 as a result of the issuance completed in December 2017 and acquisitions in 2018. The increase in collateral value resulted in an increase of property management and special servicing fees paid to our Manager of $1.0 million period-over-period.
Property costs (including reimbursable)
For the nine months ended September 30, 2018, property costs were $5.4 million (including $2.1 million of tenant reimbursable expenses) compared to $6.2 million (including $1.9 million of tenant reimbursable expenses) for the same period in 2017. The decrease in non-reimbursable costs of $1.0 million was driven primarily by a decrease in non-reimbursable property taxes on vacant properties.
Interest
The increase in interest expense is primarily related to the new issuance of Master Trust 2014 notes in December 2017 and a new CMBS loan entered into in January 2018. See Note 4 to the financial statements herein.
The following table summarizes our interest expense:
Nine Months Ended September 30, | |||||||
(In Thousands) | 2018 | 2017 | |||||
Interest expense-Master Trust 2014 | $ | 72,544 | $ | 52,133 | |||
Interest expense-CMBS | 3,011 | — | |||||
Non-cash interest expense: | |||||||
Amortization of deferred financing costs | 2,581 | 984 | |||||
Amortization of debt discount, net | 5,291 | 3,207 | |||||
Total interest expense | $ | 83,427 | $ | 56,324 | |||
Depreciation and amortization
During the twelve months ended September 30, 2018, we acquired or received through contribution 29 properties, representing a Real Estate Investment Value of $405.0 million, and we disposed of or contributed 54 properties with a Real Estate Investment Value of $107.6 million. Therefore, as a net acquirer during the period based on Real Estate Investment Value, depreciation and amortization increased period-over-period.
The following table summarizes our depreciation and amortization expenses:
Nine Months Ended September 30, | |||||||
(In Thousands) | 2018 | 2017 | |||||
Depreciation of real estate assets | $ | 54,928 | $ | 52,841 | |||
Amortization of lease intangibles | 8,143 | 7,935 | |||||
Total depreciation and amortization | $ | 63,071 | $ | 60,776 | |||
34
Impairment
During the nine months ended September 30, 2018, we recorded impairment losses of $15.4 million, of which $8.6 million of the impairment was recorded on nine held for use vacant properties. The remaining $6.8 million of the impairment was recorded on underperforming properties, comprised of $6.0 million recorded on 14 underperforming held for use properties and $0.9 million recorded on one underperforming held for sale property.
During the nine months ended September 30, 2017, we recorded impairment losses of $27.3 million, of which $24.0 million of the impairment was recorded on vacant properties, comprised of $20.2 million recorded on 18 vacant held for use properties and $3.8 million recorded on eight vacant held for sale properties. The remaining $3.3 million of impairment was recorded on underperforming properties, comprised of $0.1 million recorded on three underperforming held for use properties and $3.2 million recorded on eight underperforming held for sale properties.
(Loss) gain on debt extinguishment
During the nine months ended September 30, 2018, we extinguished $6.3 million of Master Trust 2014 debt, resulting in approximately $0.4 million in losses on debt extinguishment related to pre-payment premiums paid. During the same period in 2017, there was de minimus gain.
Gain on disposition of assets
During the nine months ended September 30, 2018, we disposed of 39 properties and recorded gains totaling $7.5 million. There were $6.9 million in net gains on the sale of 29 active properties, including the sale of eight properties operated by Shopko. The remaining $0.5 million in net gains were from the sale of ten vacant properties.
For the same period in 2017, we disposed of 64 properties and recorded gains totaling $18.2 million. There were $19.6 million in net gains on the sale of 26 active properties, including the sale of 11 properties operated by Shopko. These gains were partially offset by $1.4 million in net losses from the sale of 38 vacant properties.
35
PROPERTY PORTFOLIO INFORMATION
884 | 236.2M | 45 | 205 | 23 |
Properties | Annualized Contractual Rent | States | Tenants | Industries |
Our diverse real estate portfolio at September 30, 2018 had:
◦ | an Occupancy of 97.3%; |
◦ | 57.9% of Contractual Rent from master leases; |
◦ | 96.1% of leases containing contractual rent escalators (based on Contractual Rent); and |
◦ | a weighted average remaining lease term of 10.0 years. |
Diversification By Tenant
Tenant concentration represents the tenant’s contribution to Contractual Rent of our owned real estate properties at September 30, 2018 (total square feet in thousands):
Tenant (1) | Number of Properties | Total Square Feet | Percent of Contractual Rent | ||||||
Shopko | 90 | 6,158 | 18.3 | % | |||||
AMC Entertainment, Inc. | 14 | 696 | 4.6 | % | |||||
Academy, LTD. | 2 | 1,564 | 4.2 | % | |||||
Universal Pool Co., Inc. | 14 | 543 | 3.0 | % | |||||
Crème De La Crème, Inc. | 9 | 190 | 2.3 | % | |||||
Goodrich Quality Theaters, Inc. | 4 | 245 | 2.3 | % | |||||
Life Time Fitness, Inc. | 3 | 420 | 2.2 | % | |||||
Destination XL Group, Inc. | 1 | 756 | 2.2 | % | |||||
Buehler Food Markets Inc. | 5 | 503 | 2.2 | % | |||||
Carmax Auto Superstores, Inc. | 4 | 201 | 2.0 | % | |||||
Other | 714 | 8,363 | 56.7 | % | |||||
Vacant | 24 | 356 | — | % | |||||
Total | 884 | 19,995 | 100.0 | % | |||||
(1) Tenants represent legal entities ultimately responsible for obligations under the lease agreements or affiliated entities. Other tenants may operate the same or similar business concepts or brands as those set forth above.
Diversification By Asset Type
Asset type concentration represents the type of asset's contribution to Contractual Rent within our owned real estate properties as of September 30, 2018 (total square feet in thousands):
Asset Type | Number of Properties | Total Square Feet | Percent of Contractual Rent | |||||
Retail | 763 | 15,535 | 83.2% | |||||
Industrial | 40 | 3,617 | 9.1% | |||||
Office | 81 | 843 | 7.7% | |||||
Total | 884 | 19,995 | 100.0% | |||||
36
Diversification By Industry
Industry concentration represents the type of asset's contribution to Contractual Rent within our owned real estate properties as of September 30, 2018 (total square feet in thousands):
Industry | Number of Properties | Total Square Feet | Percent of Contractual Rent | |||||
General Merchandise | 93 | 6,257 | 18.6% | |||||
Restaurants-Quick Service | 312 | 854 | 11.0% | |||||
Movie Theaters | 29 | 1,519 | 10.1% | |||||
Restaurants-Casual Dining | 89 | 640 | 8.6% | |||||
Health and Fitness | 19 | 1,049 | 5.9% | |||||
Medical / Other Office | 79 | 517 | 5.4% | |||||
Sporting Goods | 4 | 1,832 | 5.4% | |||||
Specialty Retail | 22 | 857 | 4.5% | |||||
Education | 18 | 431 | 4.2% | |||||
Home Furnishings | 17 | 907 | 3.8% | |||||
Grocery | 19 | 1,011 | 3.6% | |||||
Automotive Parts and Services | 79 | 362 | 3.6% | |||||
Automotive Dealers | 12 | 323 | 3.4% | |||||
Apparel | 3 | 1,019 | 2.7% | |||||
Other | 3 | 183 | 2.1% | |||||
Entertainment | 4 | 200 | 1.7% | |||||
Multi-Tenant | 3 | 176 | 1.1% | |||||
Manufacturing | 7 | 763 | 1.0% | |||||
Car Washes | 6 | 49 | 1.0% | |||||
Building Materials | 28 | 458 | 0.9% | |||||
Drug Stores / Pharmacies | 8 | 83 | 0.7% | |||||
Distribution | 1 | 94 | 0.5% | |||||
Dollar Stores | 5 | 55 | 0.2% | |||||
Vacant | 24 | 356 | —% | |||||
Total | 884 | 19,995 | 100.0% | |||||
37
Diversification By Geography
Geographic concentration represents the type of asset's contribution to Contractual Rent within our owned real estate properties as of September 30, 2018 (total square feet in thousands):
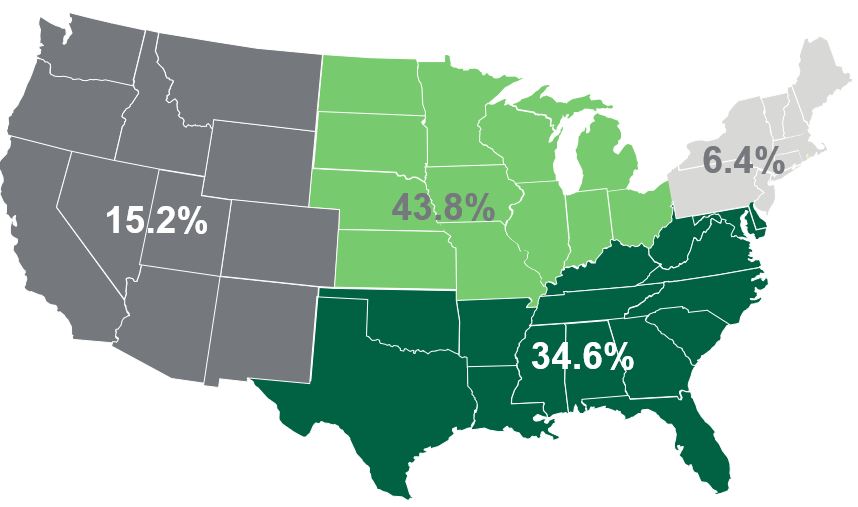
Location | Number of Properties | Total Square Feet (in thousands) | Percent of Contractual Rent | Location (continued) | Number of Properties | Total Square Feet (in thousands) | Percent of Contractual Rent | ||||||||||||
Texas | 64 | 2,698 | 11.6 | % | New Mexico | 10 | 76 | 1.3 | |||||||||||
Wisconsin | 33 | 2,587 | 8.8 | Arkansas | 19 | 309 | 1.2 | ||||||||||||
Illinois | 69 | 1,363 | 7.8 | Washington | 5 | 348 | 1.2 | ||||||||||||
Minnesota | 26 | 1,574 | 6.2 | New York | 10 | 104 | 1.2 | ||||||||||||
Georgia | 73 | 498 | 5.3 | Kansas | 19 | 252 | 1.1 | ||||||||||||
Ohio | 40 | 1,162 | 5.1 | Virginia | 17 | 208 | 1.0 | ||||||||||||
Michigan | 63 | 1,148 | 4.3 | South Dakota | 4 | 236 | 1.0 | ||||||||||||
Indiana | 41 | 637 | 4.3 | Montana | 3 | 254 | 0.8 | ||||||||||||
Missouri | 37 | 520 | 3.0 | West Virginia | 8 | 233 | 0.7 | ||||||||||||
Arizona | 22 | 346 | 2.8 | Nebraska | 7 | 227 | 0.7 | ||||||||||||
South Carolina | 16 | 415 | 2.6 | Kentucky | 15 | 95 | 0.6 | ||||||||||||
Florida | 46 | 380 | 2.5 | Idaho | 4 | 233 | 0.6 | ||||||||||||
Pennsylvania | 23 | 405 | 2.5 | Mississippi | 11 | 60 | 0.6 | ||||||||||||
North Carolina | 20 | 387 | 2.3 | Wyoming | 6 | 113 | 0.5 | ||||||||||||
Massachusetts | 1 | 756 | 2.2 | Maryland | 12 | 41 | 0.4 | ||||||||||||
Colorado | 8 | 328 | 2.1 | New Jersey | 2 | 195 | 0.3 | ||||||||||||
Oklahoma | 16 | 303 | 2.0 | Louisiana | 7 | 19 | 0.3 | ||||||||||||
Oregon | 6 | 300 | 1.9 | Utah | 2 | 97 | 0.2 | ||||||||||||
Nevada | 3 | 166 | 1.9 | Rhode Island | 1 | 22 | 0.1 | ||||||||||||
Tennessee | 48 | 233 | 1.8 | Alaska | 1 | 50 | 0.1 | ||||||||||||
California | 13 | 122 | 1.8 | North Dakota | 1 | 8 | 0.1 | ||||||||||||
Alabama | 31 | 110 | 1.7 | Maine | 1 | 6 | 0.1 | ||||||||||||
Iowa | 20 | 371 | 1.4 | ||||||||||||||||
38
Lease Expirations
The following table sets forth a summary schedule of expiration dates for leases in place as of September 30, 2018. The weighted average remaining non-cancelable initial term of our leases (based on Contractual Rent) was 10.0 years. The information set forth in the table assumes that tenants do not exercise renewal options and/or any early termination rights (total square feet and Annualized Contractual Rent in thousands):
Leases Expiring In: | Number of Properties | Annualized Contractual Rent | Total Square Feet | Percent of Expiring Contractual Rent | ||||||||
2018 | 8 | $ | 1,114 | 97 | 0.5 | % | ||||||
2019 | 72 | 11,324 | 999 | 4.8 | ||||||||
2020 | 37 | 6,524 | 452 | 2.8 | ||||||||
2021 | 61 | 11,810 | 1,180 | 5.0 | ||||||||
2022 | 76 | 13,094 | 1,022 | 5.5 | ||||||||
2023 | 26 | 4,207 | 375 | 1.8 | ||||||||
2024 | 32 | 6,987 | 325 | 3.0 | ||||||||
2025 | 38 | 15,953 | 783 | 6.7 | ||||||||
2026 | 110 | 19,989 | 1,931 | 8.5 | ||||||||
2027 | 59 | 38,257 | 3,417 | 16.2 | ||||||||
Thereafter | 341 | 106,940 | 9,058 | 45.2 | ||||||||
Vacant | 24 | — | 356 | — | ||||||||
Total owned properties | 884 | $ | 236,199 | 19,995 | 100.0 | % | ||||||
LIQUIDITY AND CAPITAL RESOURCES
Short-term Liquidity and Capital Resources
On a short-term basis, our principal demands for funds will be for operating expenses, including financing of acquisitions, distributions to shareholders and interest and principal on current and any future debt financings. We expect to fund our operating expenses and other short-term liquidity requirements, capital expenditures, payment of principal and interest on our outstanding indebtedness, property improvements, re-leasing costs and cash distributions to common and preferred stockholders, primarily through cash provided by operating activities, continued dispositions of our Other Properties and potential future borrowings.
Long-term Liquidity and Capital Resources
We plan to meet our long-term capital needs, including long-term financing of property acquisitions, by issuing bonds using the Master Trust 2014 program discussed below, obtaining asset level financing and occasionally by issuing fixed rate secured or unsecured notes and debt or equity securities. We may issue common shares when we believe that our share price is at a level that allows for the proceeds of any offering to be accretively invested into additional properties.
We will continually evaluate alternative financing and believe that we can obtain financing on reasonable terms. However, we cannot assure you that we will have access to the capital markets at times and on terms that are acceptable to us. We expect that our primary uses of capital will be for property and other asset acquisitions and the payment of tenant improvements, operating expenses, including debt service payments on any outstanding indebtedness, and distributions to our shareholders.
Description of Certain Debt
The following descriptions of debt should be read in conjunction with Note 4 to the consolidated financial statements herein.
39
Master Trust 2014
Master Trust 2014 is an asset-backed securitization platform through which we raise capital by issuing non-recourse asset-backed securities collateralized by commercial real estate, net leases and mortgage loans. The Master Trust 2014 Collateral Pool is managed by Spirit Realty, L.P., a related party, in capacity as property manager and special servicer. In general, monthly rental and mortgage receipts are deposited with the indenture trustee, who first utilizes these funds to satisfy the debt service requirements on the notes and any fees and costs associated with the administration of Master Trust 2014. Any remaining funds are remitted to the issuers monthly on the note payment date.
Upon satisfaction of certain conditions, we may, from time to time, sell or exchange real estate properties or mortgage loans from the Collateral Pool. Proceeds from these transactions are held on deposit by the indenture trustee in the Release Account until a qualifying substitution is made or the amounts are distributed as an early repayment of principal. At September 30, 2018, $9.3 million and $5.6 million was held on deposit in the Release Account and Liquidity Reserve Account, respectively, and classified as restricted cash within deferred costs and other assets, net in the consolidated balance sheet. All outstanding series of Master Trust 2014 were rated investment grade as of September 30, 2018.
As of September 30, 2018, the Master Trust 2014 notes were secured by 790 owned and financed properties. The notes issued under Master Trust 2014 are cross-collateralized by the assets of all issuers (each its own special purpose entity) within this trust. The assets of these special purpose entities are not available to pay, or otherwise satisfy obligations to, the creditors of any affiliate or owner of another entity unless the special purpose entities have expressly agreed and are permitted under their governing documents. As of September 30, 2018, net assets of $1.75 billion were held by the Master Trust 2014 special purpose entities. The Master Trust 2014 debt is summarized below:
Stated Rates (1) | Maturity | September 30, 2018 | December 31, 2017 | ||||||||
(in Years) | (in Thousands) | ||||||||||
Series 2014-1 Class A2 | 5.4% | 1.8 | $ | 243,632 | $ | 252,437 | |||||
Series 2014-2 | 5.8% | 2.5 | 230,541 | 234,329 | |||||||
Series 2014-3 | 5.7% | 3.5 | 309,884 | 311,336 | |||||||
Series 2014-4 Class A1 | 3.5% | 1.3 | 149,484 | 150,000 | |||||||
Series 2014-4 Class A2 | 4.6% | 11.3 | 345,200 | 358,664 | |||||||
Series 2017-1 Class A | 4.4% | 4.2 | 539,163 | 542,400 | |||||||
Series 2017-1 Class B | 5.5% | 4.2 | 132,000 | 132,000 | |||||||
Total Master Trust 2014 notes | 4.9% | 4.6 | 1,949,904 | 1,981,166 | |||||||
Debt discount, net | (22,834 | ) | (36,342 | ) | |||||||
Deferred financing costs, net | (15,749 | ) | (17,989 | ) | |||||||
Total Master Trust 2014, net | $ | 1,911,321 | $ | 1,926,835 | |||||||
(1) Represents the individual series stated interest rates as of September 30, 2018 and the weighted average stated rate of the total Master Trust 2014 notes, based on the collective series outstanding principal balances as of September 30, 2018.
CMBS
On January 22, 2018, we entered into a new non-recourse loan agreement, which is collateralized by a single distribution center property located in Katy, Texas. The loan has a stated interest rate of 5.14% and an effective interest rate of 5.42% as of September 30, 2018. As a result of the issuance, we received approximately $84 million in proceeds, all of which was distributed to Spirit. This CMBS loan and its collateral are held in special purpose entities, which are separate legal entities, and are the sole owner of their assets and responsible for their liabilities. The assets of the special purpose entities are not available to pay, or otherwise satisfy obligations to, the creditors of any affiliate or owner of another entity unless the special purpose entities have expressly agreed and are permitted under their governing documents. As of September 30, 2018, net assets totaling $107.8 million were held by the CMBS special purpose entities, the loan had an outstanding principal balance of $83.3 million and the loan had a remaining maturity of 9.3 years.
40
Debt Maturities
Future principal payments due on our Master Trust 2014 and CMBS debt outstanding as of September 30, 2018 :
(in thousands) | Total | 2018 | 2019 | 2020 | 2021 | 2022 | Thereafter | ||||||||||||||||||||
Master Trust 2014 | $ | 1,949,904 | $ | 8,516 | $ | 35,199 | $ | 404,132 | $ | 242,248 | $ | 993,273 | $ | 266,536 | |||||||||||||
CMBS | 83,327 | 384 | 1,204 | 1,256 | 1,336 | 1,407 | 77,740 | ||||||||||||||||||||
Total | $ | 2,033,231 | $ | 8,900 | $ | 36,403 | $ | 405,388 | $ | 243,584 | $ | 994,680 | $ | 344,276 | |||||||||||||
Contractual Obligations
There were no material changes outside the ordinary course of business to the information regarding specified contractual obligations contained in our Information Statement filed as Exhibit 99.1 to our Form 10 filed on May 4, 2018 with the SEC.
We may enter into commitments to purchase goods and services in connection with the operations of our properties. Those commitments generally have terms of one-year or less and reflect expenditure levels comparable to our historical expenditures.
CASH FLOWS
The following table presents a summary of our cash flows for the nine months ended September 30, 2018 and 2017:
Nine Months Ended September 30, | ||||||||||||
(In Thousands) | 2018 | 2017 | Change | |||||||||
Net cash provided by operating activities | $ | 66,732 | $ | 101,062 | $ | (34,330 | ) | |||||
Net cash (used in) provided by investing activities | (42,725 | ) | 108,527 | (151,252 | ) | |||||||
Net cash used in financing activities | (53,173 | ) | (172,403 | ) | 119,230 | |||||||
Net (decrease) increase in cash, cash equivalents and restricted cash | $ | (29,166 | ) | $ | 37,186 | $ | (66,352 | ) | ||||
As of September 30, 2018, we had $37.3 million in cash, cash equivalents and restricted cash as compared to $66.5 million as of December 31, 2017 and $49.9 million as of September 30, 2017.
Operating Activities
Our cash flows from operating activities are primarily dependent upon the occupancy level of our portfolio, the rental rates specified in our leases, the collectability of rent and the level of our operating expenses and other general and administrative costs.
The net decrease in cash provided by operating activities was primarily attributable to an increase in cash interest expense of $23.4 million, an increase in related party fees of $9.3 million, an increase in transaction costs of $6.5 million, and a decrease in lease settlement fees received of $3.0 million; partially offset by a decrease in compensation & benefits totaling $5.1 million and a decrease in property costs of $0.8 million.
Investing Activities
Cash used in investing activities is generally used to fund property acquisitions, for investments in loans receivable and, to a limited extent, for capital expenditures. Cash provided by investing activities generally relates to the disposition of real estate and other assets.
Net cash used in investing activities during the nine months ended September 30, 2018 included $68.9 million in proceeds from the disposition of 39 properties and collections of principal on loans receivable totaling $3.7 million, fully offset by $112.7 million to fund the acquisition of nine properties and capitalized real estate expenditures of $2.6 million.
41
During the same period in 2017, net cash provided by investing activities included proceeds of $128.7 million from the disposition of 64 properties, and collections of principal on loans receivable totaling $8.0 million, partially offset by $27.1 million to fund the acquisition of two properties and capitalized real estate expenditures of $1.2 million.
Financing Activities
Generally, our net cash used in financing activities is impacted by our contributions/distributions to Spirit for the period prior to the Spin-Off and our net borrowings under Master Trust 2014 and CMBS.
Net cash used in financing activities during the nine months ended September 30, 2018 was primarily attributable to net distributions to Spirit of $106.4 million, payments of preferred dividends totaling $5.3 million, offset by net borrowings under our mortgages and notes payable of $60.3 million.
During the same period in 2017, net cash used in financing activities was primarily attributable to net distributions to Spirit of $160.4 million and payments of $12.0 million on our mortgages and notes payable.
OFF-BALANCE SHEET ARRANGEMENTS
As of September 30, 2018, we did not have any material off-balance sheet arrangements.
NEW ACCOUNTING PRONOUNCEMENTS
See Note 2 to the consolidated financial statements herein.
NON-GAAP FINANCIAL MEASURES
FFO AND AFFO
We calculate FFO in accordance with the standards established by the National Association of Real Estate Investment Trusts (NAREIT). FFO represents net income (loss) attributable to common stockholders (computed in accordance with GAAP) excluding real estate-related depreciation and amortization, impairment charges and net (gains) losses from property dispositions. FFO is a supplemental non-GAAP financial measure. We use FFO as a supplemental performance measure because we believe that FFO is beneficial to investors as a starting point in measuring our operational performance. Specifically, in excluding real estate-related depreciation and amortization, gains and losses from property dispositions and impairment charges, which do not relate to or are not indicative of operating performance, FFO provides a performance measure that, when compared year over year, captures trends in occupancy rates, rental rates and operating costs. We also believe that, as a widely recognized measure of the performance of equity REITs, FFO will be used by investors as a basis to compare our operating performance with that of other equity REITs. However, because FFO excludes depreciation and amortization and does not capture the changes in the value of our properties that result from use or market conditions, all of which have real economic effects and could materially impact our results from operations, the utility of FFO as a measure of our performance is limited. In addition, other equity REITs may not calculate FFO as we do, and, accordingly, our FFO may not be comparable to such other equity REITs’ FFO. Accordingly, FFO should be considered only as a supplement to net income (loss) attributable to common stockholders as a measure of our performance.
AFFO is a non-GAAP financial measure of operating performance used by many companies in the REIT industry. Accordingly, AFFO should be considered only as a supplement to net income (loss) attributable to common stockholders as a measure of our performance. We adjust FFO to eliminate the impact of certain items that we believe are not indicative of our core operating performance, including restructuring and divestiture costs, other G&A costs associated with relocation of the Company's headquarters, transaction costs associated with our Spin-Off, default interest and fees on non-recourse mortgage indebtedness, debt extinguishment gains (losses), transaction costs incurred in connection with the acquisition of real estate investments subject to existing leases, amortization of the promote fee and certain non-cash items. These certain non-cash items include non-cash revenues (comprised of straight-line rents, amortization of above and below market rent on our leases, amortization of lease incentives, amortization of net premium (discount) on loans receivable, provision for bad debts and amortization of capitalized lease transaction costs), non-cash interest expense (comprised of amortization of deferred financing costs and amortization of net debt discount/premium) and non-cash compensation expense (stock-based compensation expense). In addition, other equity REITs may not calculate AFFO as we do, and, accordingly, our AFFO may not be comparable to such other equity REITs’ AFFO. AFFO does not represent cash generated from operating activities determined in accordance
42
with GAAP, is not necessarily indicative of cash available to fund cash needs and should not be considered as an alternative to net income (loss) (determined in accordance with GAAP) as a performance measure. A reconciliation of our FFO and AFFO to net income (loss) attributable to common stockholders (computed in accordance with GAAP) is included in the financial information accompanying this report.
Adjusted Debt
Adjusted Debt represents interest bearing debt (reported in accordance with GAAP) adjusted to exclude unamortized debt discount/premium, deferred financing costs, and reduced by cash and cash equivalents and cash reserves on deposit with lenders as additional security. By excluding these amounts, the result provides an estimate of the contractual amount of borrowed capital to be repaid, net of cash available to repay it. We believe this calculation constitutes a beneficial supplemental non-GAAP financial disclosure to investors in understanding our financial condition. A reconciliation of interest bearing debt (reported in accordance with GAAP) to Adjusted Debt is included below.
Adjusted Debt to Annualized Adjusted EBITDAre
Adjusted Debt to Annualized Adjusted EBITDAre is a supplemental non-GAAP financial measure we use to evaluate the level of borrowed capital being used to increase the potential return of our real estate investments and a proxy for a measure we believe is used by many lenders and ratings agencies to evaluate our ability to repay and service our debt obligations over time. We believe this ratio is a beneficial disclosure to investors as a supplemental means of evaluating our ability to meet obligations senior to those of our equity holders. Our computation of this ratio may differ from the methodology used by other equity REITs and, therefore, may not be comparable to such other REITs. A reconciliation of Adjusted Debt to Annualized Adjusted EBITDAre is included below.
Adjusted EBITDAre
Adjusted EBITDAre represents EBITDAre, modified to include other adjustments to GAAP net income (loss) for transaction costs, adjustments to revenue producing acquisitions and dispositions for the quarter as if such acquisitions and dispositions had occurred as of the beginning of the quarter, severance charges, real estate acquisition costs, debt extinguishment gains (losses), amortization of the promote fee and other items that we do not consider to be indicative of our on-going operating performance. We focus our business plans to enable us to sustain increasing shareholder value. Accordingly, we believe that excluding these items, which are not key drivers of our investment decisions and may cause short-term fluctuations in net income (loss), provides a useful supplemental measure to investors and analysts in assessing the net earnings contribution of our real estate portfolio. Because these measures do not represent net income (loss) that is computed in accordance with GAAP, they should not be considered alternatives to net income (loss) or as an indicator of financial performance. A reconciliation of net income (loss) attributable to common stockholders (computed in accordance with GAAP) to Adjusted EBITDAre is included below.
Annualized Adjusted EBITDAre
Annualized Adjusted EBITDAre is calculated by multiplying Adjusted EBITDAre of a quarter by four. Our computation of Adjusted EBITDAre and Annualized Adjusted EBITDAre may differ from the methodology used by other equity REITs to calculate these measures and, therefore, may not be comparable to such other REITs. A reconciliation of Annualized Adjusted EBITDAre is included below.
EBITDAre
EBITDAre is a non-GAAP financial measure and is computed in accordance with standards established by NAREIT. EBITDAre is defined as net income (loss) (computed in accordance with GAAP), plus interest expense, plus income tax expense (if any), plus depreciation and amortization, plus (minus) losses and gains on the disposition of depreciated property, plus impairment write-downs of depreciated property and investments in unconsolidated real estate ventures, plus adjustments to reflect the Company's share of EBITDAre of unconsolidated real estate ventures. A reconciliation of net income (loss) attributable to common stockholders (computed in accordance with GAAP) to EBITDAre is included below
Fixed Charge Coverage Ratio (FCCR)
Fixed Charge Coverage Ratio is the ratio of Annualized Adjusted EBITDAre to Fixed Charges, a ratio derived from non-GAAP measures that we use to evaluate our liquidity and ability to obtain financing. Fixed Charges consist of interest expense, reported in accordance with GAAP, less non-cash interest expense.
43
FFO and AFFO
Three Months Ended September 30, | Nine Months Ended September 30, | |||||||||||||||
(Unaudited, In Thousands) | 2018 | 2017 (1) | 2018 (2) | 2017 (1) | ||||||||||||
Net (loss) income attributable to common stockholders | $ | (7,549 | ) | $ | (6,523 | ) | $ | (15,474 | ) | $ | 16,813 | |||||
Add/(less): | ||||||||||||||||
Portfolio depreciation and amortization | 20,969 | 19,891 | 63,071 | 60,776 | ||||||||||||
Portfolio impairments | 9,343 | 15,436 | 15,415 | 27,348 | ||||||||||||
(Gain) loss on disposition of real estate assets | (4,210 | ) | 1,382 | (7,464 | ) | (18,196 | ) | |||||||||
Total adjustments to net (loss) income | 26,102 | 36,709 | 71,022 | 69,928 | ||||||||||||
FFO | $ | 18,553 | $ | 30,186 | $ | 55,548 | $ | 86,741 | ||||||||
Add/(less): | ||||||||||||||||
Loss (gain) on debt extinguishment | — | — | 363 | (1 | ) | |||||||||||
Transaction costs | 78 | 1,733 | 8,620 | 2,100 | ||||||||||||
Real Estate Acquisition Costs | 54 | 16 | 273 | 26 | ||||||||||||
Non-cash interest expense | 2,511 | 1,408 | 7,872 | 4,191 | ||||||||||||
Straight-line rent, net of related bad debt expense | (844 | ) | (35 | ) | (2,278 | ) | (894 | ) | ||||||||
Other amortization and non-cash charges | 148 | 186 | 371 | 510 | ||||||||||||
Non-cash compensation expense | 451 | 866 | 2,875 | 5,101 | ||||||||||||
Amortization of the promote fee | 1,619 | — | 1,619 | — | ||||||||||||
Total adjustments to FFO | 4,017 | 4,174 | 19,715 | 11,033 | ||||||||||||
AFFO | $ | 22,570 | $ | 34,360 | $ | 75,263 | $ | 97,774 | ||||||||
Dividends declared to common stockholders | $ | 14,190 | N/A | $ | 14,190 | N/A | ||||||||||
Net (loss) income per share of common stock | ||||||||||||||||
Basic | $ | (0.18 | ) | $ | (0.15 | ) | $ | (0.36 | ) | $ | 0.39 | |||||
Diluted | $ | (0.18 | ) | $ | (0.15 | ) | $ | (0.36 | ) | $ | 0.39 | |||||
FFO per share of common stock | ||||||||||||||||
Diluted (3) | $ | 0.43 | $ | 0.70 | $ | 1.29 | $ | 2.02 | ||||||||
AFFO per share of common stock | ||||||||||||||||
Diluted (3) | $ | 0.52 | $ | 0.80 | $ | 1.75 | $ | 2.28 | ||||||||
Weighted average shares of common stock outstanding: | ||||||||||||||||
Basic | 42,851,010 | 42,851,010 | 42,851,010 | 42,851,010 | ||||||||||||
Diluted | 42,851,010 | 42,851,010 | 42,851,010 | 42,851,010 | ||||||||||||
(1) Amounts for the three and nine months ended September 30, 2017 are based entirely on results of SMTA's legal predecessor entities.
(2) Amounts for the nine months ended September 30, 2018 include five months of income and expense items based on SMTA's legal predecessor entities and four month of actual results from SMTA operations as a stand alone company.
(3) For both the three and nine months ended September 30, 2018, there were dividends declared to unvested restricted stockholders of $49.5 thousand.
44
Adjusted Debt, Adjusted EBITDAre and Annualized Adjusted EBITDAre - Leverage
The following provides a calculation of adjusted debt and a reconciliation of EBITDAre and adjusted EBITDAre (dollars in thousands):
September 30, | ||||||||
(Unaudited, In Thousands) | 2018 | 2017 | ||||||
Master Trust 2014, net | $ | 1,911,321 | $ | 1,331,847 | ||||
CMBS, net | 82,251 | — | ||||||
Total debt, net | $ | 1,993,572 | $ | 1,331,847 | ||||
Add/(less): | ||||||||
Unamortized debt discount | 22,834 | 15,778 | ||||||
Unamortized deferred financing costs | 16,823 | 7,573 | ||||||
Cash and cash equivalents | (16,188 | ) | (6 | ) | ||||
Cash reserves on deposit with lenders as additional security classified as other assets | (21,156 | ) | (49,868 | ) | ||||
Total adjustments | 2,313 | (26,523 | ) | |||||
Adjusted Debt | $ | 1,995,885 | $ | 1,305,324 | ||||
Three Months Ended September 30, | ||||||||
(Unaudited, In Thousands) | 2018 | 2017 (1) | ||||||
Net (loss) income | $ | (3,574 | ) | $ | (6,523 | ) | ||
Add/(less): | ||||||||
Interest | 27,672 | 18,733 | ||||||
Depreciation and amortization | 20,969 | 19,891 | ||||||
Income tax expense | 60 | 45 | ||||||
(Gain) loss on disposition of real estate assets | (4,210 | ) | 1,382 | |||||
Impairments on real estate assets | 9,343 | 15,436 | ||||||
Total adjustments | 53,834 | 55,487 | ||||||
EBITDAre | $ | 50,260 | $ | 48,964 | ||||
Add/(less): | ||||||||
Adjustments to revenue producing acquisitions and dispositions (2) | 220 | — | ||||||
Transaction costs | 78 | 1,733 | ||||||
Real estate acquisition costs | 54 | 16 | ||||||
Amortization of the promote fee | 1,619 | — | ||||||
Total adjustments | 1,971 | 1,749 | ||||||
Adjusted EBITDAre | $ | 52,231 | $ | 50,713 | ||||
Annualized Adjusted EBITDAre (3) | $ | 208,924 | $ | 202,852 | ||||
Interest Expense | $ | 27,672 | $ | 18,733 | ||||
Less: Non-cash interest | (2,511 | ) | (1,408 | ) | ||||
Preferred Stock Dividends | 3,975 | — | ||||||
Fixed Charges | $ | 29,136 | $ | 17,325 | ||||
Adjusted Debt / Annualized Adjusted EBITDAre | 9.6x | 6.4x | ||||||
Fixed Charge Coverage Ratio (Adjusted EBITDAre / Fixed Charges) | 1.8x | 2.9x | ||||||
(1) | Amounts for 2017 are based on SMTA's allocated portion of Spirit’s expense. For further detail on the allocation, see related party transactions as described in Note 6 to the consolidated financial statements herein. |
(2) | Revenue producing acquisitions and dispositions were adjusted as if such acquisitions and dispositions had occurred at the beginning of the quarter. |
(3) | Adjusted EBITDAre for the quarter multiplied by four. |
45
Item 3. Quantitative and Qualitative Disclosures About Market Risk
We are exposed to financial market risks, especially interest rate risk. Interest rates and other factors, such as occupancy, rental rates and the financial condition of our tenants, influence our performance more so than does inflation. Changes in interest rates do not necessarily correlate with inflation rates or changes in inflation rates. We generally offer leases that provide for payments of base rent with scheduled increases, based on a fixed amount or the lesser of a multiple of the increase in the CPI over a specified period term or fixed percentage and, to a lesser extent, contingent rent based on a percentage of the tenant’s gross sales, to help mitigate the effect of inflation. Because the properties in our portfolio are generally leased to tenants under triple-net leases, where the tenant is responsible for property operating costs and expenses, our exposure to rising property operating costs due to inflation is mitigated.
Interest rates are highly sensitive to many factors, including governmental monetary policies, domestic and global economic and political conditions, and other factors which are beyond our control. Our operating results will depend heavily on the difference between the revenue from our assets and the interest expense incurred on our borrowings. We may incur variable rate debt in the future. In addition, decreases in interest rates may lead to additional competition for the acquisition of real estate due to a reduction in desirable alternative income-producing investments. Increased competition for the acquisition of real estate may lead to a decrease in the yields on real estate we have targeted for acquisition. In such circumstances, if we are not able to offset the decrease in yields by obtaining lower interest costs on our borrowings, our results of operations will be adversely affected. Significant increases in interest rates may also have an adverse impact on our earnings if we are unable to acquire real estate with rental rates high enough to offset the increase in interest rates on our borrowings.
In the event interest rates rise significantly or there is an economic downturn, defaults may increase and result in credit losses, which may adversely affect our liquidity and operating results. In a decreasing interest rate environment, borrowers are generally more likely to prepay their loans in order to obtain financing at lower interest rates. Some of our investments in our mortgage loans receivable have significant prepayment protection in the form of yield maintenance provisions, which provide us with yield protection in a decreasing interest rate environment with respect to this portion of our investment portfolio.
As of September 30, 2018, all $2.0 billion of our indebtedness consisted of long-term, fixed-rate obligations, consisting of our Master Trust 2014 notes and CMBS loan. As of September 30, 2018, the weighted average stated interest rate of the Master Trust 2014 obligations, excluding amortization of deferred financing costs and debt discounts, was approximately 4.9%. The stated interest rate of the CMBS obligation, excluding amortization of deferred financing costs, was 5.1%. As of September 30, 2018, we had no variable-rate obligations.
The estimated fair values of our debt instruments have been derived based on market quotes for comparable instruments or discounted cash flow analyses using estimates of the amount and timing of future cash flows, market rates and credit spreads. The debt instrument balances as of September 30, 2018 are as follows (in thousands):
Carrying Value | Estimated Fair Value | ||||||
Loans receivable, net | $ | 66,950 | $ | 67,507 | |||
Mortgages and notes payable, net (1) | $ | 1,993,572 | $ | 2,041,280 | |||
(1) The carrying value of the debt instruments are net of unamortized deferred financing costs and certain debt discounts/premiums.
46
Item 4. Controls and Procedures
Evaluation of Disclosure Controls and Procedures
An evaluation was performed under the supervision and with the participation of the Company’s management, including the Chief Executive Officer and Chief Financial Officer, of the effectiveness, as of September 30, 2018, of the design and operation of the Company's disclosure controls and procedures as defined in Rules 13a-15(e) and 15d-15(e) under the Exchange Act. Based on that evaluation, the Chief Executive Officer and Chief Financial Officer concluded that the design and operation of the disclosure controls and procedures were effective as of the end of the period covered by this quarterly report.
Changes in Internal Control over Financial Reporting
There were no changes to the Company's internal control over financial reporting (as defined in Rule 13a-15(e) and 15d-15(e) under the Exchange Act) that occurred during the quarter ended September 30, 2018 that have materially affected, or are reasonably likely to materially affect, the Company's internal control over financial reporting.
47
PART II - OTHER INFORMATION
Item 1. Legal Proceedings
From time-to-time, we may be subject to certain claims and lawsuits in the ordinary course of business, the outcome of which cannot be determined at this time. We are not currently a party as plaintiff or defendant to any legal proceedings that we believe to be material or that individually or in the aggregate would be expected to have a material effect on our business, financial condition or results of operations if determined adversely to us.
Item 1A. Risk Factors
There have been no material changes to the risk factors as disclosed in the section entitled “Risk Factors” in our Information Statement filed as Exhibit 99.1 to our Registration Statement on Form 10 filed on May 4, 2018.
Item 2. Unregistered Sales of Equity Securities and Use of Proceeds
None.
Item 3. Defaults Upon Senior Securities
None.
Item 4. Mine Safety Disclosures
None.
Item 5. Other Information
None.
48
Item 6. Exhibits
Exhibit No. | Description |
3.1 | |
3.2 | |
3.3 | |
31.1* | |
32.1* | |
101.INS | XBRL Instance Document |
101.SCH | XBRL Taxonomy Extension Schema |
101.CAL | XBRL Taxonomy Extension Calculation Linkbase |
101.DEF | XBRL Taxonomy Extension Definition Linkbase |
101.LAB | XBRL Taxonomy Extension Label Linkbase |
101.PRE | XBRL Taxonomy Extension Presentation Linkbase |
* Filed herewith.
49
SIGNATURES
Pursuant to the requirements of the Securities Exchange Act of 1934, the registrants have duly caused this report to be signed on their behalf by the undersigned thereunto duly authorized.
SPIRIT MTA REIT | ||
By: | /s/ Ricardo Rodriguez | |
Name: | Ricardo Rodriguez | |
Title: | Chief Executive Officer, President, Chief Financial Officer and Treasurer | |
Date: November 9, 2018
50