Attached files
| file | filename |
|---|---|
| EX-99.1 - EX-99.1 - MedEquities Realty Trust, Inc. | mrt-ex991_6.htm |
| 8-K - 8-K - MedEquities Realty Trust, Inc. | mrt-8k_20181109.htm |
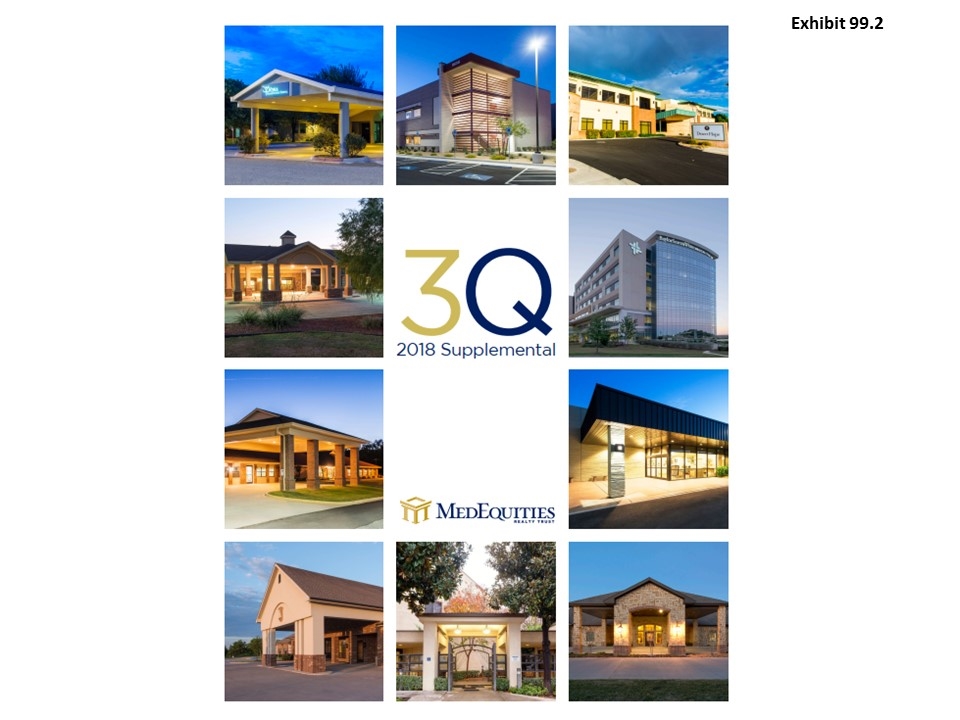
Exhibit 99.2
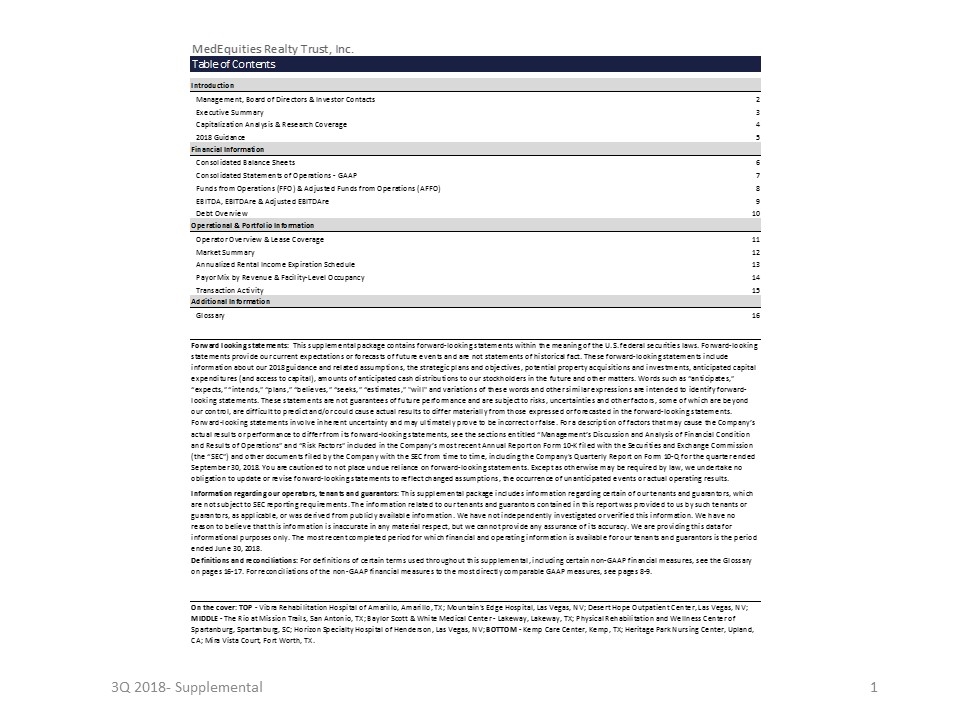
3Q 2018- Supplemental MedEquities Realty Trust, Inc.Table of ContentsIntroductionManagement, Board of Directors & Investor Contacts2Executive Summary3Capitalization Analysis & Research Coverage42018 Guidance5Financial InformationConsolidated Balance Sheets6Consolidated Statements of Operations - GAAP7Funds from Operations (FFO) & Adjusted Funds from Operations (AFFO)8EBITDA, EBITDAre & Adjusted EBITDAre9Debt Overview10Operational & Portfolio InformationOperator Overview & Lease Coverage11Market Summary12Annualized Rental Income Expiration Schedule13Payor Mix by Revenue & Facility-Level Occupancy14Transaction Activity15Additional InformationGlossary16Forward looking statements: This supplemental package contains forward-looking statements within the meaning of the U.S. federal securities laws. Forward-looking statements provide our current expectations or forecasts of future events and are not statements of historical fact. These forward-looking statements include information about our 2018 guidance and related assumptions, the strategic plans and objectives, potential property acquisitions and investments, anticipated capital expenditures (and access to capital), amounts of anticipated cash distributions to our stockholders in the future and other matters. Words such as “anticipates,” “expects,” “intends,” “plans,” “believes,” “seeks,” “estimates,” "will" and variations of these words and other similar expressions are intended to identify forward-looking statements. These statements are not guarantees of future performance and are subject to risks, uncertainties and other factors, some of which are beyond our control, are difficult to predict and/or could cause actual results to differ materially from those expressed or forecasted in the forward-looking statements. Forward-looking statements involve inherent uncertainty and may ultimately prove to be incorrect or false. For a description of factors that may cause the Company’s actual results or performance to differ from its forward-looking statements, see the sections entitled “Management’s Discussion and Analysis of Financial Condition and Results of Operations” and “Risk Factors” included in the Company’s most recent Annual Report on Form 10-K filed with the Securities and Exchange Commission (the “SEC”) and other documents filed by the Company with the SEC from time to time, including the Company's Quarterly Report on Form 10-Q for the quarter ended September 30, 2018. You are cautioned to not place undue reliance on forward-looking statements. Except as otherwise may be required by law, we undertake no obligation to update or revise forward-looking statements to reflect changed assumptions, the occurrence of unanticipated events or actual operating results.Information regarding our operators, tenants and guarantors: This supplemental package includes information regarding certain of our tenants and guarantors, which are not subject to SEC reporting requirements. The information related to our tenants and guarantors contained in this report was provided to us by such tenants or guarantors, as applicable, or was derived from publicly available information. We have not independently investigated or verified this information. We have no reason to believe that this information is inaccurate in any material respect, but we cannot provide any assurance of its accuracy. We are providing this data for informational purposes only. The most recent completed period for which financial and operating information is available for our tenants and guarantors is the period ended June 30, 2018.Definitions and reconciliations: For definitions of certain terms used throughout this supplemental, including certain non-GAAP financial measures, see the Glossary on pages 16-17. For reconciliations of the non-GAAP financial measures to the most directly comparable GAAP measures, see pages 8-9. On the cover: TOP - Vibra Rehabilitation Hospital of Amarillo, Amarillo, TX; Mountain's Edge Hospital, Las Vegas, NV; Desert Hope Outpatient Center, Las Vegas, NV; MIDDLE - The Rio at Mission Trails, San Antonio, TX; Baylor Scott & White Medical Center - Lakeway, Lakeway, TX; Physical Rehabilitation and Wellness Center of Spartanburg, Spartanburg, SC; Horizon Specialty Hospital of Henderson, Las Vegas, NV; BOTTOM - Kemp Care Center, Kemp, TX; Heritage Park Nursing Center, Upland, CA; Mira Vista Court, Fort Worth, TX.
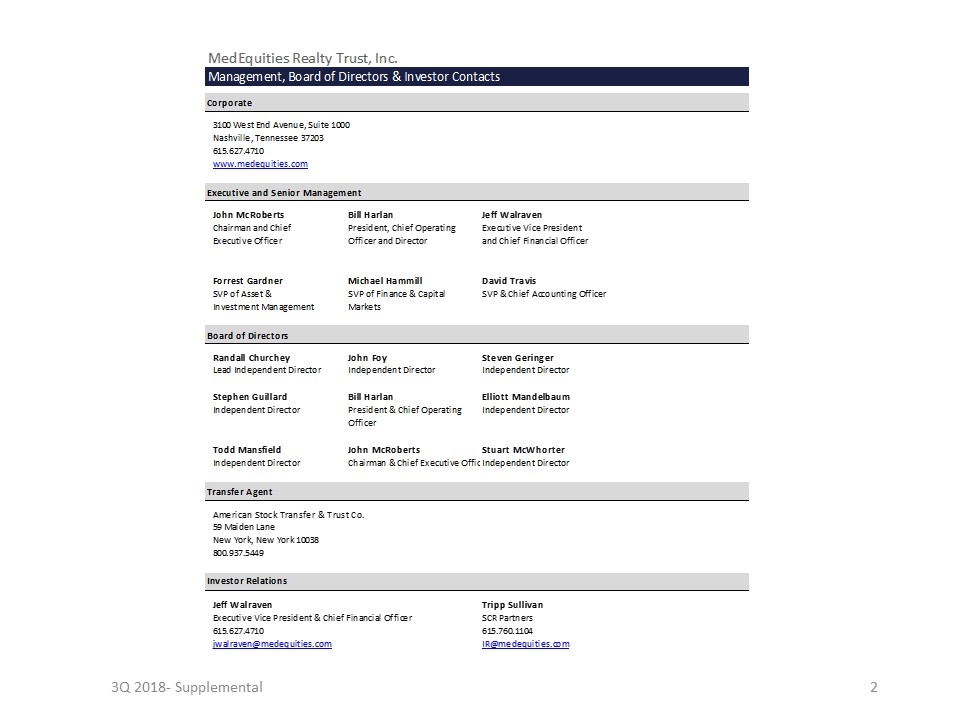
3Q 2018- Supplemental MedEquities Realty Trust, Inc.Management, Board of Directors & Investor ContactsCorporate3100 West End Avenue, Suite 1000Nashville, Tennessee 37203615.627.4710www.medequities.comExecutive and Senior ManagementJohn McRobertsBill HarlanJeff WalravenChairman and ChiefPresident, Chief OperatingExecutive Vice PresidentExecutive OfficerOfficer and Directorand Chief Financial OfficerForrest GardnerMichael HammillDavid TravisSVP of Asset & SVP of Finance & CapitalSVP & Chief Accounting OfficerInvestment ManagementMarketsBoard of DirectorsRandall ChurcheyJohn FoySteven GeringerLead Independent DirectorIndependent DirectorIndependent DirectorStephen GuillardBill HarlanElliott MandelbaumIndependent DirectorPresident & Chief OperatingIndependent DirectorOfficerTodd MansfieldJohn McRobertsStuart McWhorterIndependent DirectorChairman & Chief Executive OfficerIndependent DirectorTransfer AgentAmerican Stock Transfer & Trust Co.59 Maiden LaneNew York, New York 10038800.937.5449Investor RelationsJeff WalravenTripp SullivanExecutive Vice President & Chief Financial OfficerSCR Partners615.627.4710615.760.1104jwalraven@medequities.comIR@medequities.com
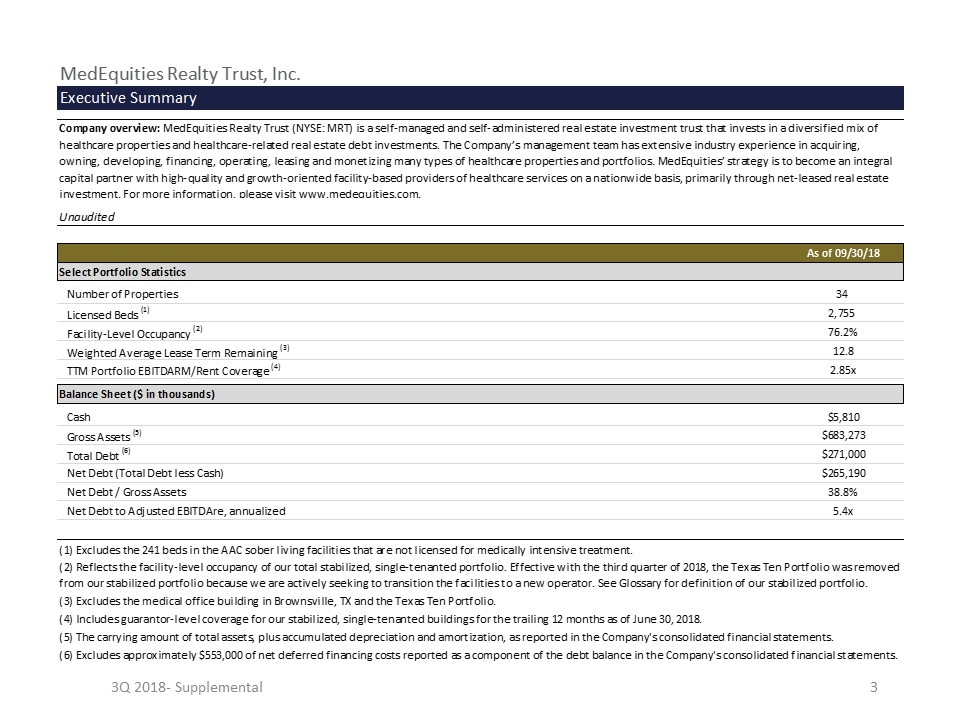
3Q 2018- Supplemental MedEquities Realty Trust, Inc.Executive SummaryCompany overview: MedEquities Realty Trust (NYSE: MRT) is a self-managed and self-administered real estate investment trust that invests in a diversified mix of healthcare properties and healthcare-related real estate debt investments. The Company’s management team has extensive industry experience in acquiring, owning, developing, financing, operating, leasing and monetizing many types of healthcare properties and portfolios. MedEquities’ strategy is to become an integral capital partner with high-quality and growth-oriented facility-based providers of healthcare services on a nationwide basis, primarily through net-leased real estate investment. For more information, please visit www.medequities.com.Unaudited As of 09/30/18Select Portfolio Statistics Number of Properties34 Licensed Beds (1)2,755 Facility-Level Occupancy (2)76.2%Weighted Average Lease Term Remaining (3)12.8TTM Portfolio EBITDARM/Rent Coverage (4)2.85xBalance Sheet ($ in thousands)Cash$5,810Gross Assets (5)$683,273Total Debt (6)$271,000Net Debt (Total Debt less Cash)$265,190Net Debt / Gross Assets38.8%Net Debt to Adjusted EBITDAre, annualized5.4x(1) Excludes the 241 beds in the AAC sober living facilities that are not licensed for medically intensive treatment.(2) Reflects the facility-level occupancy of our total stabilized, single-tenanted portfolio. Effective with the third quarter of 2018, the Texas Ten Portfolio was removed from our stabilized portfolio because we are actively seeking to transition the facilities to a new operator. See Glossary for definition of our stabilized portfolio.(3) Excludes the medical office building in Brownsville, TX and the Texas Ten Portfolio.(4) Includes guarantor-level coverage for our stabilized, single-tenanted buildings for the trailing 12 months as of June 30, 2018.(5) The carrying amount of total assets, plus accumulated depreciation and amortization, as reported in the Company's consolidated financial statements.(6) Excludes approximately $553,000 of net deferred financing costs reported as a component of the debt balance in the Company's consolidated financial statements.
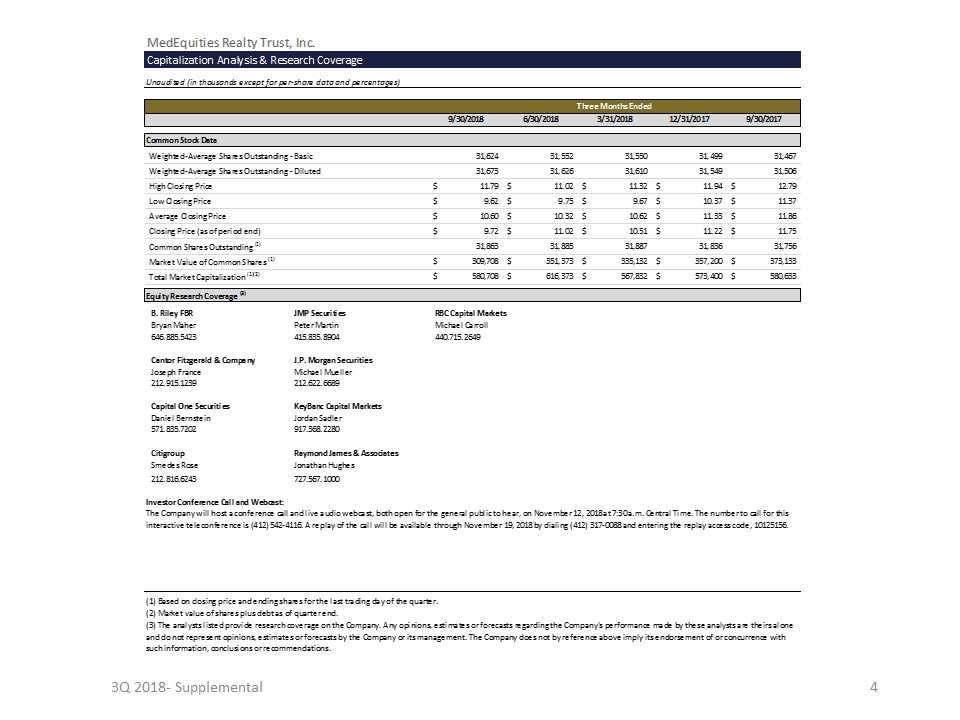
3Q 2018- Supplemental MedEquities Realty Trust, Inc.Capitalization Analysis & Research CoverageUnaudited (in thousands except for per-share data and percentages)Three Months Ended9/30/20186/30/20183/31/201812/31/20179/30/2017Common Stock Data Weighted-Average Shares Outstanding - Basic31,624 31,552 31,550 31,499 31,467 Weighted-Average Shares Outstanding - Diluted31,673 31,626 31,610 31,549 31,506 High Closing Price $11.79 $11.02 $11.32 $11.94 $12.79 Low Closing Price $9.62 $9.75 $9.67 $10.37 $11.37 Average Closing Price $10.60 $10.32 $10.62 $11.33 $11.86 Closing Price (as of period end) $9.72 $11.02 $10.51 $11.22 $11.75 Common Shares Outstanding (1)31,863 31,885 31,887 31,836 31,756 Market Value of Common Shares (1) $309,708 $351,373 $335,132 $357,200 $373,133 Total Market Capitalization (1)(2) $580,708 $616,373 $567,832 $573,400 $580,633 Equity Research Coverage (3)B. Riley FBRJMP SecuritiesRBC Capital MarketsBryan MaherPeter MartinMichael Carroll646.885.5423415.835.8904440.715.2649Cantor Fitzgerald & CompanyJ.P. Morgan SecuritiesJoseph FranceMichael Mueller212.915.1239212.622.6689Capital One SecuritiesKeyBanc Capital MarketsDaniel BernsteinJordan Sadler571.835.7202917.368.2280CitigroupRaymond James & AssociatesSmedes RoseJonathan Hughes212.816.6243727.567.1000"Investor Conference Call and Webcast:The Company will host a conference call and live audio webcast, both open for the general public to hear, on November 12, 2018 at 7:30 a.m. Central Time. The number to call for this interactive teleconference is (412) 542-4116. A replay of the call will be available through November 19, 2018 by dialing (412) 317-0088 and entering the replay access code, 10125156."(1) Based on closing price and ending shares for the last trading day of the quarter.(2) Market value of shares plus debt as of quarter end.(3) The analysts listed provide research coverage on the Company. Any opinions, estimates or forecasts regarding the Company's performance made by these analysts are theirs alone and do not represent opinions, estimates or forecasts by the Company or its management. The Company does not by reference above imply its endorsement of or concurrence with such information, conclusions or recommendations.
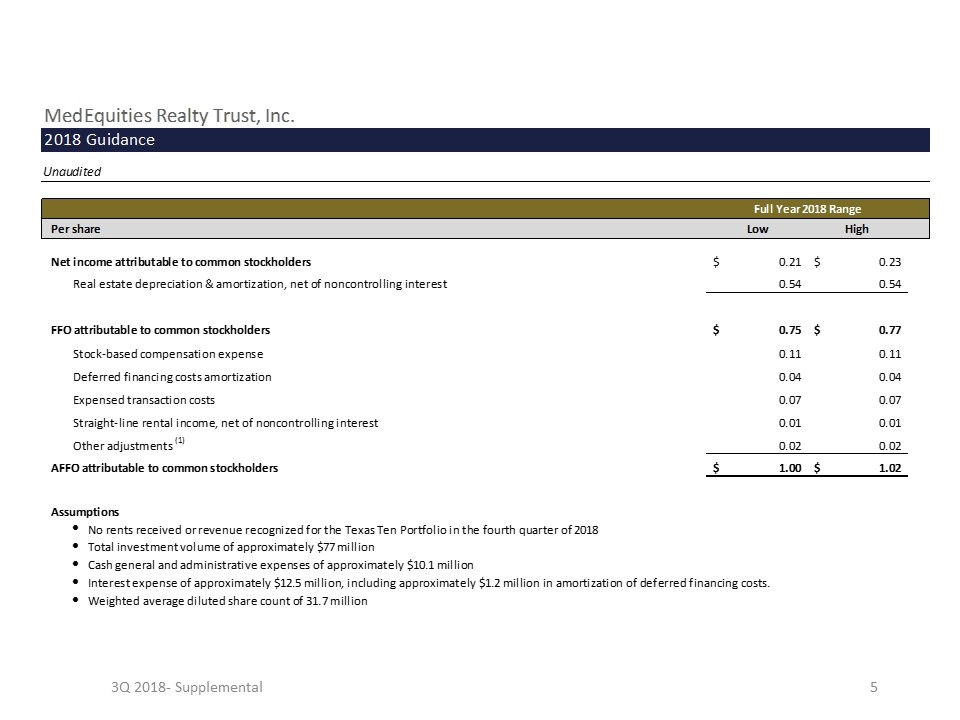
3Q 2018- Supplemental MedEquities Realty Trust, Inc.2018 GuidanceUnauditedFull Year 2018 RangePer shareLowHighNet income attributable to common stockholders $0.21 $0.23 Real estate depreciation & amortization, net of noncontrolling interest 0.54 0.54 FFO attributable to common stockholders $0.75 $0.77 Stock-based compensation expense 0.11 0.11 Deferred financing costs amortization 0.04 0.04 Expensed transaction costs 0.07 0.07 Straight-line rental income, net of noncontrolling interest 0.01 0.01 Other adjustments (1) 0.02 0.02 AFFO attributable to common stockholders $1.00 $1.02 AssumptionslNo rents received or revenue recognized for the Texas Ten Portfolio in the fourth quarter of 2018lTotal investment volume of approximately $77 millionlCash general and administrative expenses of approximately $10.1 millionlInterest expense of approximately $12.5 million, including approximately $1.2 million in amortization of deferred financing costs.lWeighted average diluted share count of 31.7 million
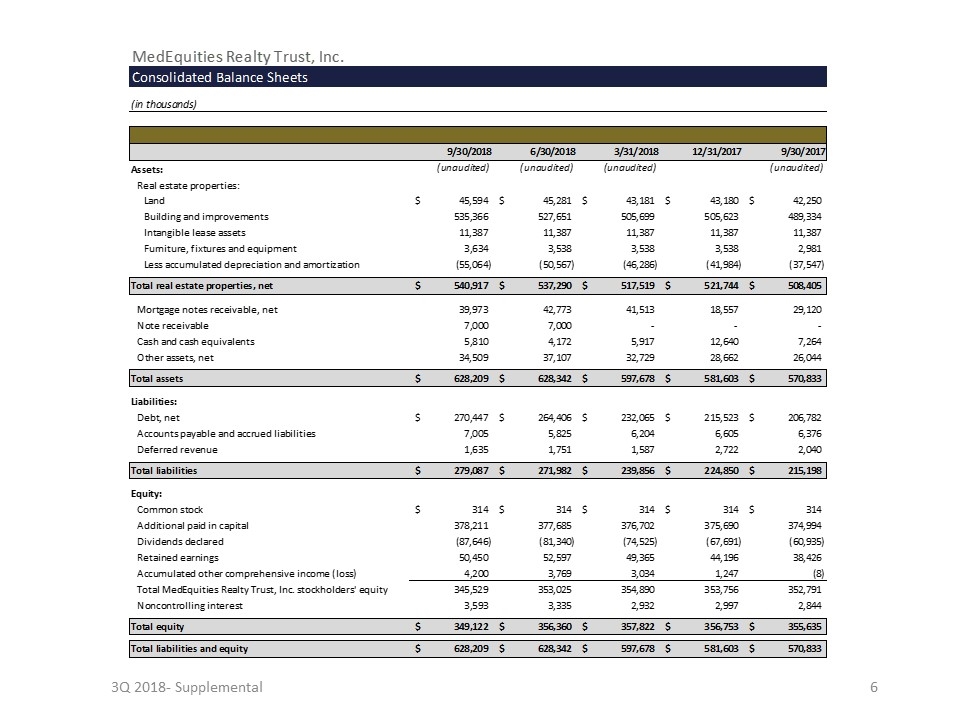
3Q 2018- Supplemental MedEquities Realty Trust, Inc.Consolidated Balance Sheets(in thousands)9/30/20186/30/20183/31/201812/31/20179/30/2017Assets:(unaudited)(unaudited)(unaudited)(unaudited)Real estate properties:Land $45,594 $45,281 $43,181 $43,180 $42,250 Building and improvements 535,366 527,651 505,699 505,623 489,334 Intangible lease assets 11,387 11,387 11,387 11,387 11,387 Furniture, fixtures and equipment 3,634 3,538 3,538 3,538 2,981 Less accumulated depreciation and amortization (55,064) (50,567) (46,286) (41,984) (37,547)Total real estate properties, net $540,917 $537,290 $517,519 $521,744 $508,405 Mortgage notes receivable, net 39,973 42,773 41,513 18,557 29,120 Note receivable 7,000 7,000 - - - Cash and cash equivalents 5,810 4,172 5,917 12,640 7,264 Other assets, net 34,509 37,107 32,729 28,662 26,044 Total assets $628,209 $628,342 $597,678 $581,603 $570,833 Liabilities:Debt, net $270,447 $264,406 $232,065 $215,523 $206,782 Accounts payable and accrued liabilities 7,005 5,825 6,204 6,605 6,376 Deferred revenue 1,635 1,751 1,587 2,722 2,040 Total liabilities $279,087 $271,982 $239,856 $224,850 $215,198 Equity:Common stock $314 $314 $314 $314 $314 Additional paid in capital 378,211 377,685 376,702 375,690 374,994 Dividends declared (87,646) (81,340) (74,525) (67,691) (60,935)Retained earnings 50,450 52,597 49,365 44,196 38,426 Accumulated other comprehensive income (loss) 4,200 3,769 3,034 1,247 (8)Total MedEquities Realty Trust, Inc. stockholders' equity 345,529 353,025 354,890 353,756 352,791 Noncontrolling interest 3,593 3,335 2,932 2,997 2,844 Total equity $349,122 $356,360 $357,822 $356,753 $355,635 Total liabilities and equity $628,209 $628,342 $597,678 $581,603 $570,833
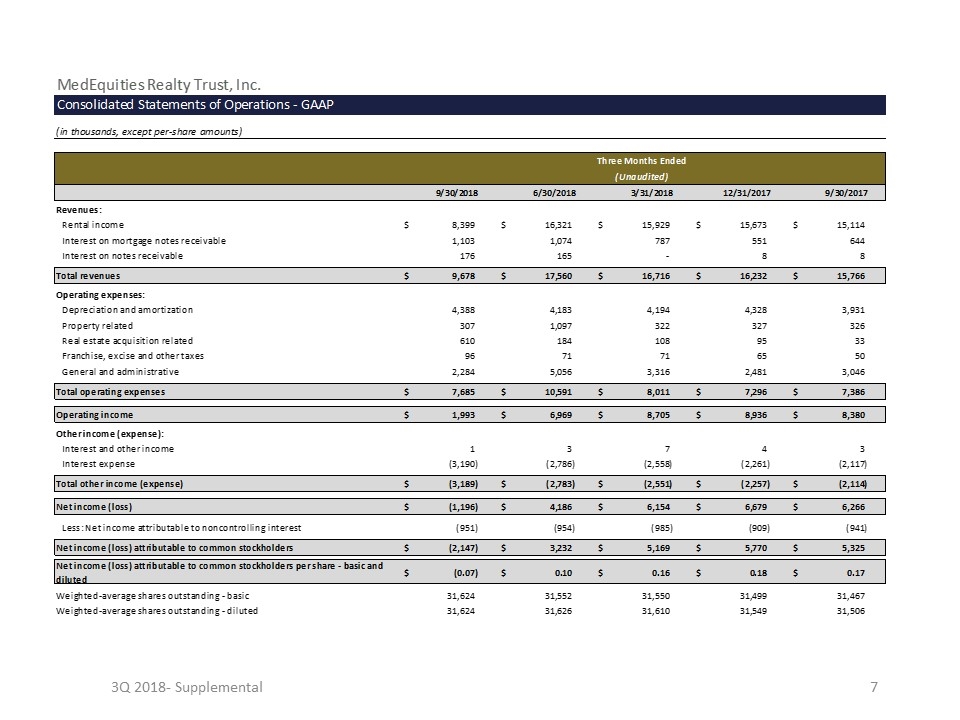
3Q 2018- Supplemental MedEquities Realty Trust, Inc.Consolidated Statements of Operations - GAAP(in thousands, except per-share amounts)Three Months Ended(Unaudited)9/30/20186/30/20183/31/201812/31/20179/30/2017Revenues:Rental income $8,399 $16,321 $15,929 $15,673 $15,114 Interest on mortgage notes receivable 1,103 1,074 787 551 644 Interest on notes receivable 176 165 - 8 8 Total revenues $9,678 $17,560 $16,716 $16,232 $15,766 Operating expenses:Depreciation and amortization 4,388 4,183 4,194 4,328 3,931 Property related 307 1,097 322 327 326 Real estate acquisition related 610 184 108 95 33 Franchise, excise and other taxes 96 71 71 65 50 General and administrative 2,284 5,056 3,316 2,481 3,046 Total operating expenses $7,685 $10,591 $8,011 $7,296 $7,386 Operating income $1,993 $6,969 $8,705 $8,936 $8,380 Other income (expense):Interest and other income 1 3 7 4 3 Interest expense (3,190) (2,786) (2,558) (2,261) (2,117)Total other income (expense) $(3,189) $(2,783) $(2,551) $(2,257) $(2,114)Net income (loss) $(1,196) $4,186 $6,154 $6,679 $6,266 Less: Net income attributable to noncontrolling interest (951) (954) (985) (909) (941)Net income (loss) attributable to common stockholders $(2,147) $3,232 $5,169 $5,770 $5,325 Net income (loss) attributable to common stockholders per share - basic and diluted $(0.07) $0.10 $0.16 $0.18 $0.17 Weighted-average shares outstanding - basic31,624 31,552 31,550 31,499 31,467 Weighted-average shares outstanding - diluted31,624 31,626 31,610 31,549 31,506
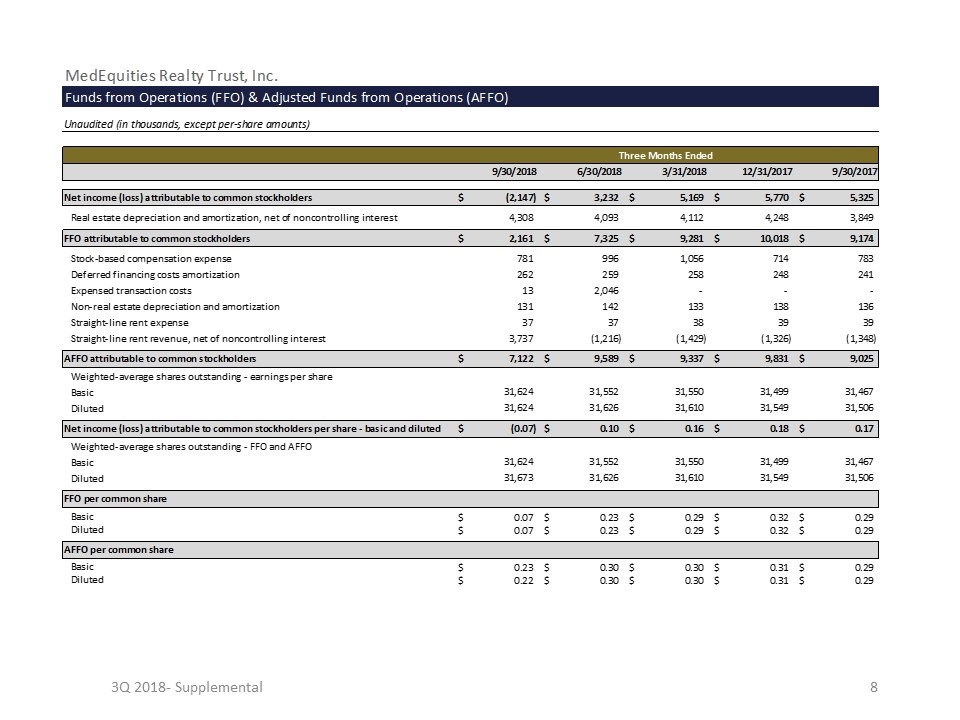
3Q 2018- Supplemental MedEquities Realty Trust, Inc.Funds from Operations (FFO) & Adjusted Funds from Operations (AFFO)Unaudited (in thousands, except per-share amounts)Three Months Ended9/30/20186/30/20183/31/201812/31/20179/30/2017Net income (loss) attributable to common stockholders $(2,147) $3,232 $5,169 $5,770 $5,325 Real estate depreciation and amortization, net of noncontrolling interest 4,308 4,093 4,112 4,248 3,849 FFO attributable to common stockholders $2,161 $7,325 $9,281 $10,018 $9,174 Stock-based compensation expense 781 996 1,056 714 783 Deferred financing costs amortization 262 259 258 248 241 Expensed transaction costs 13 2,046 - - - Non-real estate depreciation and amortization 131 142 133 138 136 Straight-line rent expense 37 37 38 39 39 Straight-line rent revenue, net of noncontrolling interest 3,737 (1,216) (1,429) (1,326) (1,348)AFFO attributable to common stockholders $7,122 $9,589 $9,337 $9,831 $9,025 Weighted-average shares outstanding - earnings per shareBasic 31,624 31,552 31,550 31,499 31,467 Diluted 31,624 31,626 31,610 31,549 31,506 Net income (loss) attributable to common stockholders per share - basic and diluted $(0.07) $0.10 $0.16 $0.18 $0.17 Weighted-average shares outstanding - FFO and AFFOBasic 31,624 31,552 31,550 31,499 31,467 Diluted 31,673 31,626 31,610 31,549 31,506 FFO per common shareBasic $0.07 $0.23 $0.29 $0.32 $0.29 Diluted $0.07 $0.23 $0.29 $0.32 $0.29 AFFO per common shareBasic $0.23 $0.30 $0.30 $0.31 $0.29 Diluted $0.22 $0.30 $0.30 $0.31 $0.29
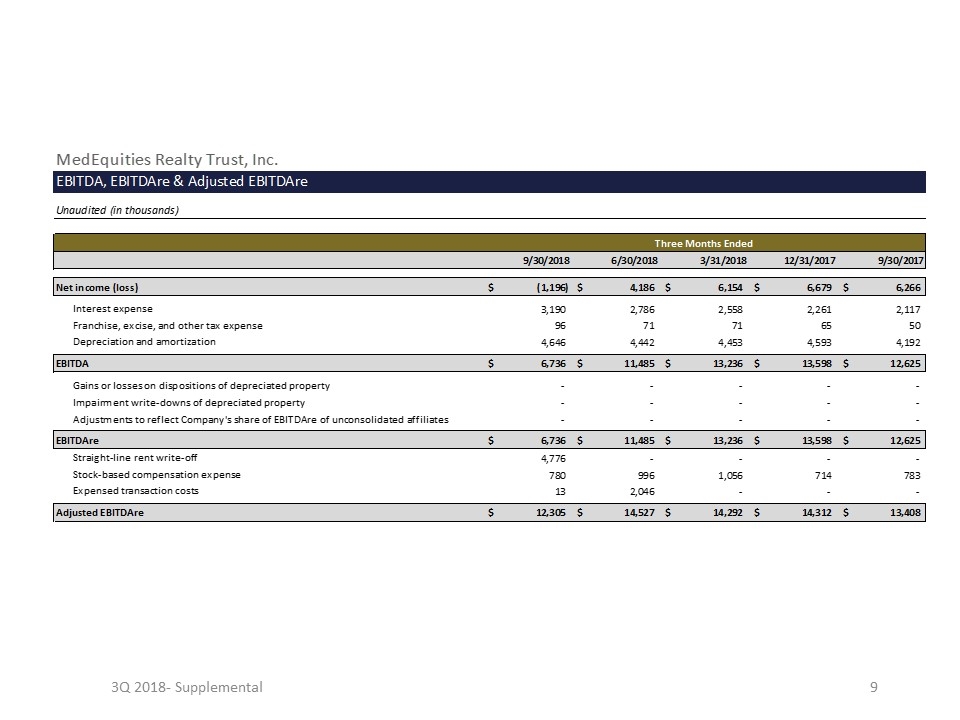
3Q 2018- Supplemental MedEquities Realty Trust, Inc.EBITDA, EBITDAre & Adjusted EBITDAreUnaudited (in thousands)Three Months Ended9/30/20186/30/20183/31/201812/31/20179/30/2017Net income (loss) $(1,196) $4,186 $6,154 $6,679 $6,266 Interest expense 3,190 2,786 2,558 2,261 2,117 Franchise, excise, and other tax expense 96 71 71 65 50 Depreciation and amortization 4,646 4,442 4,453 4,593 4,192 EBITDA $6,736 $11,485 $13,236 $13,598 $12,625 Gains or losses on dispositions of depreciated property - - - - - Impairment write-downs of depreciated property - - - - - Adjustments to reflect Company's share of EBITDAre of unconsolidated affiliates - - - - - EBITDAre $6,736 $11,485 $13,236 $13,598 $12,625 Straight-line rent write-off 4,776 - - - - Stock-based compensation expense 780 996 1,056 714 783 Expensed transaction costs 13 2,046 - - - Adjusted EBITDAre $12,305 $14,527 $14,292 $14,312 $13,408
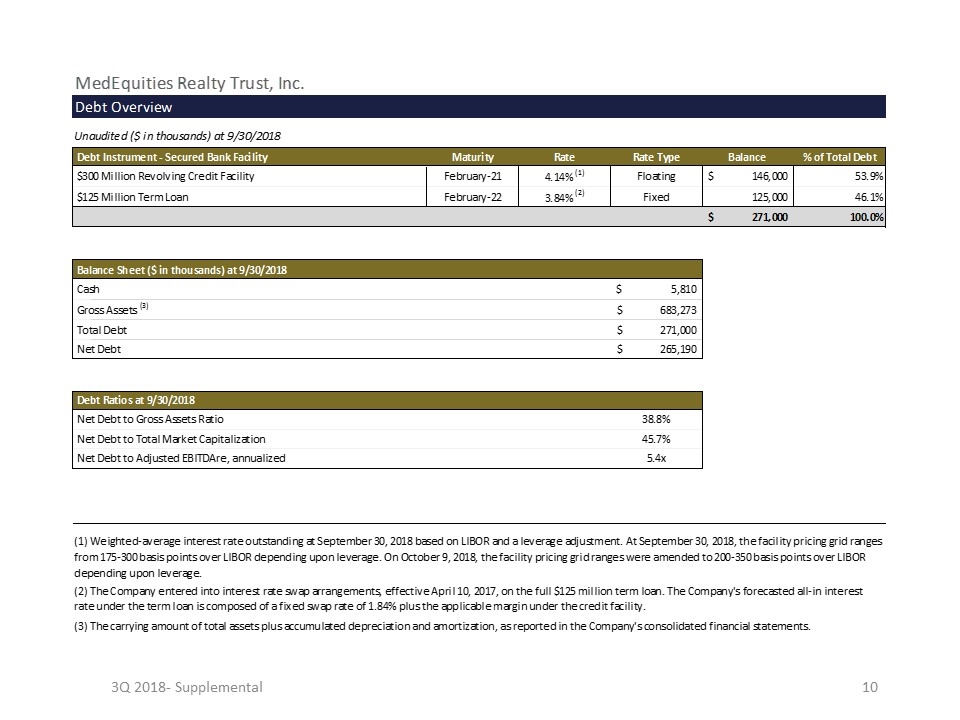
3Q 2018- Supplemental MedEquities Realty Trust, Inc.Debt OverviewUnaudited ($ in thousands) at 9/30/2018 Debt Instrument - Secured Bank FacilityMaturityRateRate TypeBalance % of Total Debt $300 Million Revolving Credit FacilityFebruary-214.14% (1)Floating $146,000 53.9% $125 Million Term LoanFebruary-223.84% (2)Fixed 125,000 46.1% $271,000 100.0% Balance Sheet ($ in thousands) at 9/30/2018 Cash $5,810 Gross Assets (3) $683,273 Total Debt $271,000 Net Debt $265,190 Debt Ratios at 9/30/2018 Net Debt to Gross Assets Ratio38.8% Net Debt to Total Market Capitalization45.7% Net Debt to Adjusted EBITDAre, annualized5.4x(1) Weighted-average interest rate outstanding at September 30, 2018 based on LIBOR and a leverage adjustment. At September 30, 2018, the facility pricing grid ranges from 175-300 basis points over LIBOR depending upon leverage. On October 9, 2018, the facility pricing grid ranges were amended to 200-350 basis points over LIBOR depending upon leverage.(2) The Company entered into interest rate swap arrangements, effective April 10, 2017, on the full $125 million term loan. The Company's forecasted all-in interest rate under the term loan is composed of a fixed swap rate of 1.84% plus the applicable margin under the credit facility.(3) The carrying amount of total assets plus accumulated depreciation and amortization, as reported in the Company's consolidated financial statements.
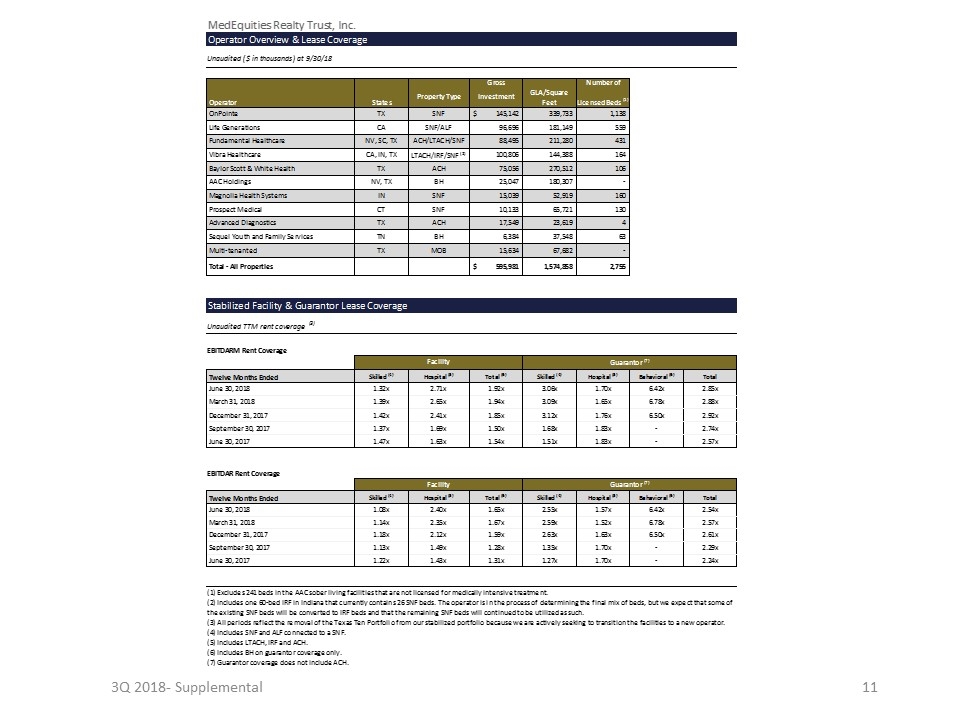
3Q 2018- Supplemental MedEquities Realty Trust, Inc.Operator Overview & Lease CoverageUnaudited ($ in thousands) at 9/30/18 Gross Number of Operator States Property Type Investment GLA/Square FeetLicensed Beds (1) OnPointeTX SNF $145,142 339,733 1,138 Life GenerationsCA SNF/ALF 96,696 181,149 559 Fundamental HealthcareNV, SC, TX ACH/LTACH/SNF 88,495 211,280 431 Vibra HealthcareCA, IN, TXLTACH/IRF/SNF (2) 100,806 144,388 164 Baylor Scott & White HealthTX ACH 75,056 270,512 106 AAC HoldingsNV, TX BH 25,047 180,307 - Magnolia Health SystemsIN SNF 15,039 52,919 160 Prospect MedicalCT SNF 10,133 65,721 130 Advanced DiagnosticsTX ACH 17,549 23,619 4 Sequel Youth and Family ServicesTN BH 6,384 37,548 63 Multi-tenantedTX MOB 15,634 67,682 - Total - All Properties $595,981 1,574,858 2,755 Stabilized Facility & Guarantor Lease CoverageUnaudited TTM rent coverage (3)EBITDARM Rent CoverageFacilityGuarantor (7) Twelve Months EndedSkilled (4)Hospital (5)Total (6)Skilled (4)Hospital (5)Behavioral (6)Total June 30, 20181.32x2.71x1.92x3.06x1.70x6.42x2.85x March 31, 20181.39x2.65x1.94x3.09x1.65x6.78x2.88x December 31, 20171.42x2.41x1.85x3.12x1.76x6.50x2.92x September 30, 20171.37x1.69x1.50x1.68x1.83x-2.74x June 30, 20171.47x1.63x1.54x1.51x1.83x-2.57xEBITDAR Rent CoverageFacilityGuarantor (7) Twelve Months EndedSkilled (4)Hospital (5)Total (6)Skilled (4)Hospital (5)Behavioral (6)Total June 30, 20181.08x2.40x1.65x2.55x1.57x6.42x2.54x March 31, 20181.14x2.35x1.67x2.59x1.52x6.78x2.57x December 31, 20171.18x2.12x1.59x2.63x1.63x6.50x2.61x September 30, 20171.13x1.49x1.28x1.35x1.70x-2.29x June 30, 20171.22x1.43x1.31x1.27x1.70x-2.24x(1) Excludes 241 beds in the AAC sober living facilities that are not licensed for medically intensive treatment.(2) Includes one 60-bed IRF in Indiana that currently contains 26 SNF beds. The operator is in the process of determining the final mix of beds, but we expect that some of the existing SNF beds will be converted to IRF beds and that the remaining SNF beds will continued to be utilized as such.(3) All periods reflect the removal of the Texas Ten Portfolio from our stabilized portfolio because we are actively seeking to transition the facilities to a new operator.(4) Includes SNF and ALF connected to a SNF.(5) Includes LTACH, IRF and ACH.(6) Includes BH on guarantor coverage only.(7) Guarantor coverage does not include ACH.
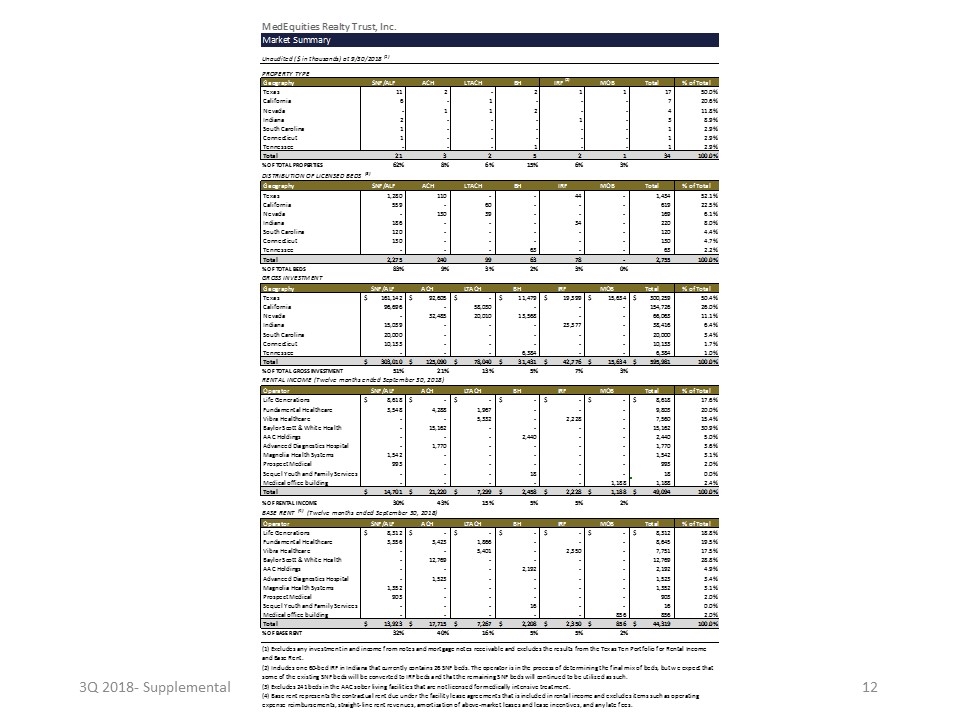
3Q 2018- Supplemental MedEquities Realty Trust, Inc.Market SummaryUnaudited ($ in thousands) at 9/30/2018(1)PROPERTY TYPE Geography SNF/ALF ACH LTACH BH IRF (2) MOB Total % of Total Texas11 2 -2 1 1 17 50.0% California6 -1 ---7 20.6% Nevada-1 1 2 --4 11.8% Indiana2 ---1 -3 8.9% South Carolina1 -----1 2.9% Connecticut1 -----1 2.9% Tennessee---1 --1 2.9% Total21 3 2 5 2 1 34 100.0%% OF TOTAL PROPERTIES62%8%6%15%6%3%DISTRIBUTION OF LICENSED BEDS (3) Geography SNF/ALF ACH LTACH BH IRF MOB Total % of Total Texas 1,280 110 - - 44 - 1,434 52.1% California 559 - 60 - - - 619 22.5% Nevada - 130 39 - - - 169 6.1% Indiana 186 - - - 34 - 220 8.0% South Carolina 120 - - - - - 120 4.4% Connecticut 130 - - - - - 130 4.7% Tennessee - - - 63 - - 63 2.2% Total 2,275 240 99 63 78 - 2,755 100.0%% OF TOTAL BEDS83%9%3%2%3%0%GROSS INVESTMENT GeographySNF/ALFACHLTACHBHIRFMOBTotal% of Total Texas $161,142 $92,605 $- $11,479 $19,399 $15,634 $300,259 50.4% California 96,696 - 58,030 - - - 154,726 26.0% Nevada - 32,485 20,010 13,568 - - 66,063 11.1% Indiana 15,039 - - - 23,377 - 38,416 6.4% South Carolina 20,000 - - - - - 20,000 3.4% Connecticut 10,133 - - - - - 10,133 1.7% Tennessee - - - 6,384 - - 6,384 1.0% Total $303,010 $125,090 $78,040 $31,431 $42,776 $15,634 $595,981 100.0%% OF TOTAL GROSS INVESTMENT51%21%13%5%7%3%RENTAL INCOME (Twelve months ended September 30, 2018) OperatorSNF/ALFACHLTACHBHIRFMOBTotal% of Total Life Generations $8,618 $- $- $- $- $- $8,618 17.6% Fundamental Healthcare 3,548 4,288 1,967 - - - 9,803 20.0% Vibra Healthcare - - 5,332 - 2,228 - 7,560 15.4% Baylor Scott & White Health - 15,162 - - - - 15,162 30.9% AAC Holdings - - - 2,440 - - 2,440 5.0% Advanced Diagnostics Hospital - 1,770 - - - - 1,770 3.6% Magnolia Health Systems 1,542 - - - - - 1,542 3.1% Prospect Medical 993 - - - - - 993 2.0% Sequel Youth and Family Services - - - 18 - - 18 0.0% Medical office building - - - - - 1,188 1,188 2.4% Total $14,701 $21,220 $7,299 $2,458 $2,228 $1,188 $49,094 100.0%% OF RENTAL INCOME30%43%15%5%5%2%BASE RENT (4) (Twelve months ended September 30, 2018) OperatorSNF/ALFACHLTACHBHIRFMOBTotal% of Total Life Generations $8,312 $- $- $- $- $- $8,312 18.8% Fundamental Healthcare 3,356 3,423 1,866 - - - 8,645 19.5% Vibra Healthcare - - 5,401 - 2,350 - 7,751 17.5% Baylor Scott & White Health - 12,769 - - - - 12,769 28.8% AAC Holdings - - - 2,192 - - 2,192 4.9% Advanced Diagnostics Hospital - 1,523 - - - - 1,523 3.4% Magnolia Health Systems 1,352 - - - - - 1,352 3.1% Prospect Medical 903 - - - - - 903 2.0% Sequel Youth and Family Services - - - 16 - - 16 0.0% Medical office building - - - - - 856 856 2.0% Total $13,923 $17,715 $7,267 $2,208 $2,350 $856 $44,319 100.0%% OF BASE RENT32%40%16%5%5%2%(1) Excludes any investment in and income from notes and mortgage notes receivable and excludes the results from the Texas Ten Portfolio for Rental Income and Base Rent.(2) Includes one 60-bed IRF in Indiana that currently contains 26 SNF beds. The operator is in the process of determining the final mix of beds, but we expect that some of the existing SNF beds will be converted to IRF beds and that the remaining SNF beds will continued to be utilized as such.(3) Excludes 241 beds in the AAC sober living facilities that are not licensed for medically intensive treatment.(4) Base rent represents the contractual rent due under the facility lease agreements that is included in rental income and excludes items such as operating expense reimbursements, straight-line rent revenues, amortization of above-market leases and lease incentives, and any late fees.
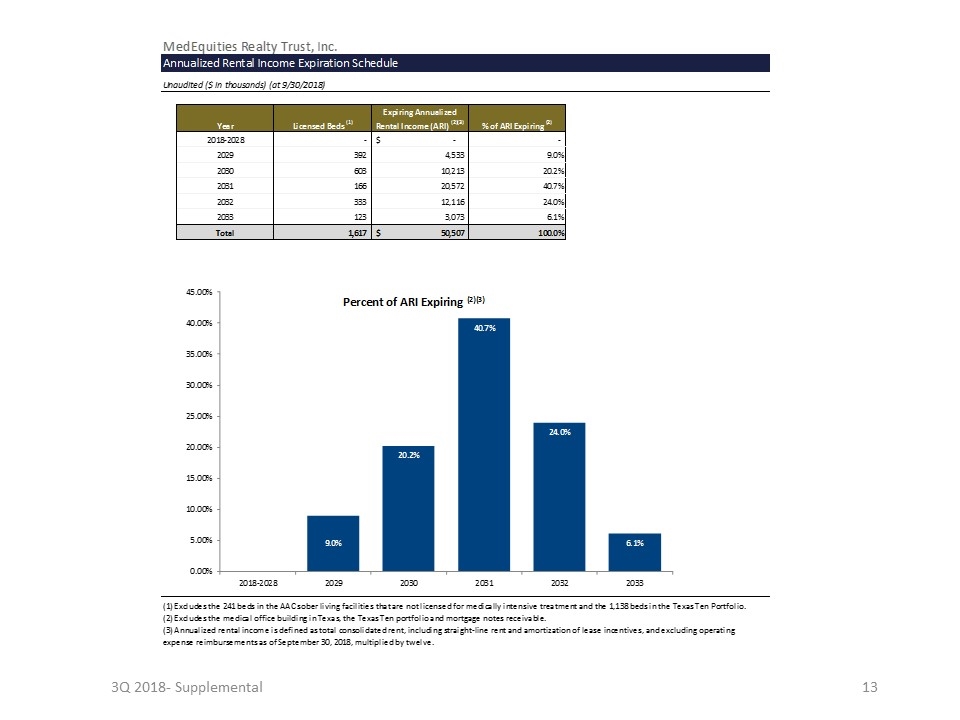
3Q 2018- Supplemental MedEquities Realty Trust, Inc.Annualized Rental Income Expiration ScheduleUnaudited ($ in thousands) (at 9/30/2018)YearLicensed Beds (1)Expiring Annualized Rental Income (ARI) (2)(3)% of ARI Expiring (2)2018-2028 - $- - 2029 392 4,533 9.0%2030 603 10,213 20.2%2031 166 20,572 40.7%2032 333 12,116 24.0%2033 123 3,073 6.1%Total 1,617 $50,507 100.0%(1) Excludes the 241 beds in the AAC sober living facilities that are not licensed for medically intensive treatment and the 1,138 beds in the Texas Ten Portfolio. (2) Excludes the medical office building in Texas, the Texas Ten portfolio and mortgage notes receivable.(3) Annualized rental income is defined as total consolidated rent, including straight-line rent and amortization of lease incentives, and excluding operating expense reimbursements as of September 30, 2018, multiplied by twelve.
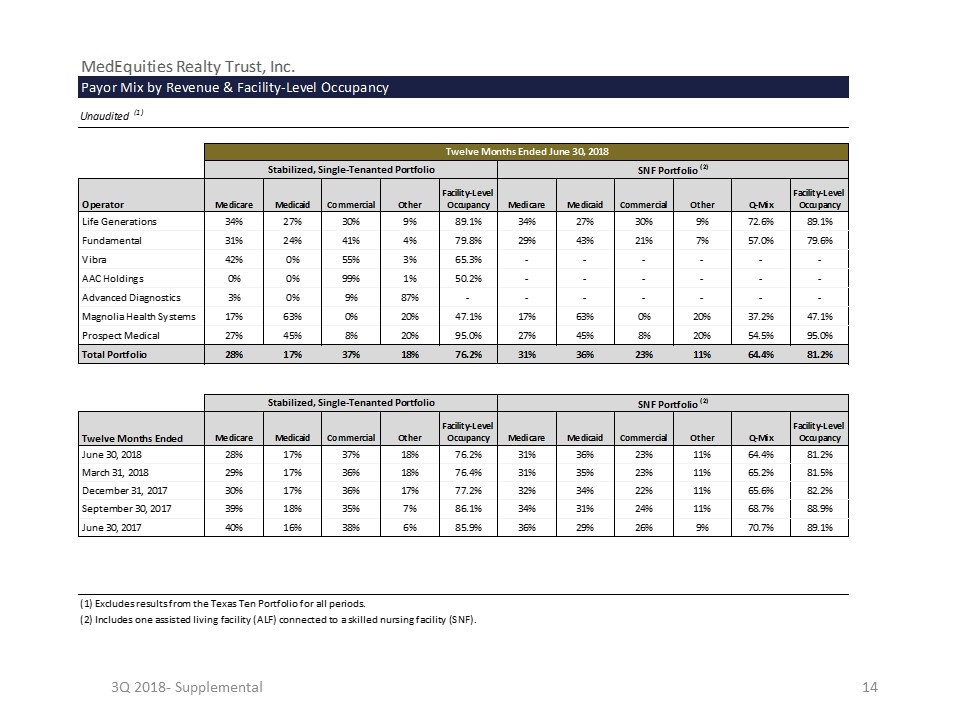
3Q 2018- Supplemental MedEquities Realty Trust, Inc. Payor Mix by Revenue & Facility-Level OccupancyUnaudited (1)Twelve Months Ended June 30, 2018Stabilized, Single-Tenanted PortfolioSNF Portfolio (2) OperatorMedicareMedicaidCommercialOtherFacility-Level OccupancyMedicareMedicaidCommercialOtherQ-MixFacility-Level Occupancy Life Generations34%27%30%9%89.1%34%27%30%9%72.6%89.1% Fundamental31%24%41%4%79.8%29%43%21%7%57.0%79.6% Vibra42%0%55%3%65.3%------ AAC Holdings0%0%99%1%50.2%------ Advanced Diagnostics3%0%9%87%------- Magnolia Health Systems17%63%0%20%47.1%17%63%0%20%37.2%47.1% Prospect Medical27%45%8%20%95.0%27%45%8%20%54.5%95.0% Total Portfolio28%17%37%18%76.2%31%36%23%11%64.4%81.2% Stabilized, Single-Tenanted PortfolioSNF Portfolio (2) Twelve Months EndedMedicareMedicaidCommercialOtherFacility-Level OccupancyMedicareMedicaidCommercialOtherQ-MixFacility-Level Occupancy June 30, 201828%17%37%18%76.2%31%36%23%11%64.4%81.2% March 31, 201829%17%36%18%76.4%31%35%23%11%65.2%81.5% December 31, 201730%17%36%17%77.2%32%34%22%11%65.6%82.2% September 30, 201739%18%35%7%86.1%34%31%24%11%68.7%88.9% June 30, 201740%16%38%6%85.9%36%29%26%9%70.7%89.1%(1) Excludes results from the Texas Ten Portfolio for all periods.(2) Includes one assisted living facility (ALF) connected to a skilled nursing facility (SNF).
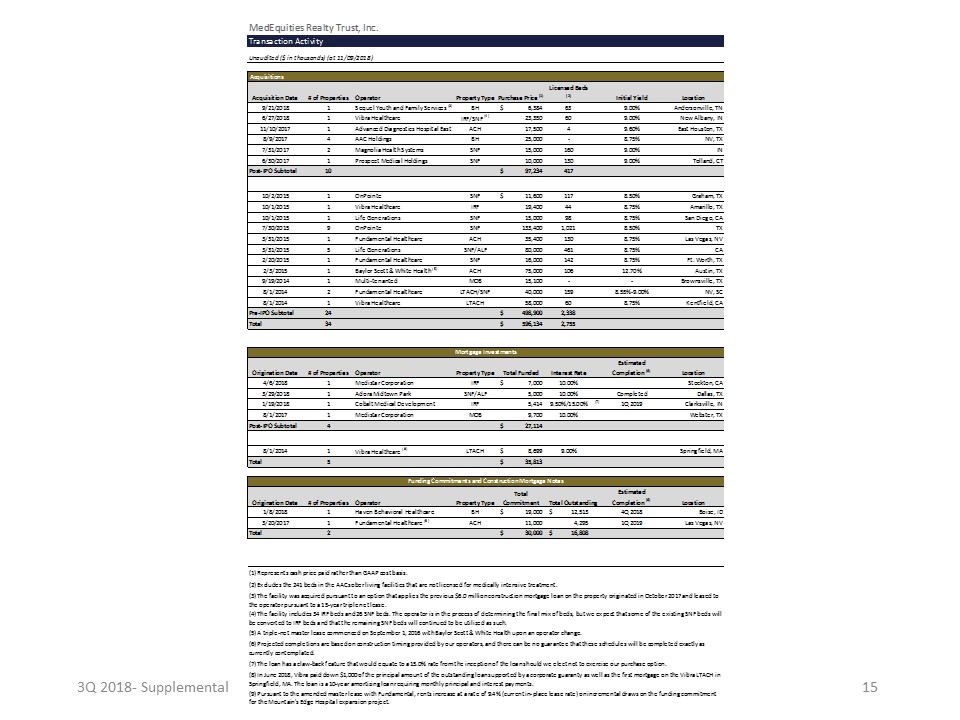
3Q 2018- Supplemental MedEquities Realty Trust, Inc.Transaction ActivityUnaudited ($ in thousands) (at 11/09/2018) AcquisitionsAcquisition Date# of PropertiesOperatorProperty TypePurchase Price (1)Licensed Beds (2)Initial YieldLocation9/21/20181Sequel Youth and Family Services (3)BH $6,384 63 9.00%Andersonville, TN6/27/20181Vibra HealthcareIRF/SNF (4) 23,350 60 9.00%New Albany, IN11/10/20171Advanced Diagnostics Hospital EastACH 17,500 4 9.60%East Houston, TX8/9/20174AAC HoldingsBH 25,000 -8.75%NV, TX7/31/20172Magnolia Health SystemsSNF 15,000 160 9.00%IN6/30/20171Prospect Medical HoldingsSNF 10,000 130 9.00%Tolland, CTPost-IPO Subtotal10 $97,234 417 10/2/20151OnPointeSNF $11,600 117 8.50%Graham, TX10/1/20151Vibra HealthcareIRF 19,400 44 8.75%Amarillo, TX10/1/20151Life GenerationsSNF 15,000 98 8.75%San Diego, CA7/30/20159OnPointeSNF 133,400 1,021 8.50%TX3/31/20151Fundamental HealthcareACH 35,400 130 8.75%Las Vegas, NV3/31/20155Life GenerationsSNF/ALF 80,000 461 8.75%CA2/20/20151Fundamental HealthcareSNF 16,000 142 8.75%Ft. Worth, TX2/3/20151Baylor Scott & White Health (5)ACH 75,000 106 12.70%Austin, TX9/19/20141Multi-tenantedMOB 15,100 --Brownsville, TX8/1/20142Fundamental HealthcareLTACH/SNF 40,000 159 8.55%-9.00%NV, SC8/1/20141Vibra HealthcareLTACH 58,000 60 8.75%Kentfield, CAPre-IPO Subtotal24 $498,900 2,338 Total34 $596,134 2,755 Mortgage InvestmentsOrigination Date# of PropertiesOperatorProperty TypeTotal FundedInterest RateEstimated Completion (6)Location4/6/20181Medistar CorporationIRF $7,000 10.00%Stockton, CA3/29/20181Adora Midtown ParkSNF/ALF 5,000 10.00% Completed Dallas, TX1/19/20181Cobalt Medical DevelopmentIRF 5,414 9.50%/15.00%(7) 1Q 2019 Clarksville, IN8/1/20171Medistar CorporationMOB 9,700 10.00%Webster, TXPost-IPO Subtotal4 $27,114 8/1/20141Vibra Healthcare (8)LTACH $8,699 9.00%Springfield, MATotal5 $35,813 Funding Commitments and Construction Mortgage NotesOrigination Date# of PropertiesOperatorProperty TypeTotal CommitmentTotal OutstandingEstimated Completion (6)Location1/8/20181Haven Behavioral HealthcareBH $19,000 $12,513 4Q 2018 Boise, ID3/20/20171Fundamental Healthcare (9)ACH 11,000 4,295 1Q 2019 Las Vegas, NVTotal2 $30,000 $16,808 (1) Represents cash price paid rather than GAAP cost basis.(2) Excludes the 241 beds in the AAC sober living facilities that are not licensed for medically intensive treatment.(3) The facility was acquired pursuant to an option that applies the previous $6.0 million construction mortgage loan on the property originated in October 2017 and leased to the operator pursuant to a 15-year triple net lease.(4) The facility includes 34 IRF beds and 26 SNF beds. The operator is in the process of determining the final mix of beds, but we expect that some of the existing SNF beds will be converted to IRF beds and that the remaining SNF beds will continued to be utilized as such.(5) A triple-net master lease commenced on September 1, 2016 with Baylor Scott & White Health upon an operator change.(6) Projected completions are based on construction timing provided by our operators, and there can be no guarantee that these schedules will be completed exactly as currently contemplated.(7) The loan has a claw-back feature that would equate to a 15.0% rate from the inception of the loan should we elect not to exercise our purchase option.(8) In June 2018, Vibra paid down $1,000 of the principal amount of the outstanding loan supported by a corporate guaranty as well as the first mortgage on the Vibra LTACH in Springfield, MA. The loan is a 10-year amortizing loan requiring monthly principal and interest payments.(9) Pursuant to the amended master lease with Fundamental, rents increase at a rate of 9.4% (current in-place lease rate) on incremental draws on the funding commitment for the Mountain's Edge Hospital expansion project.
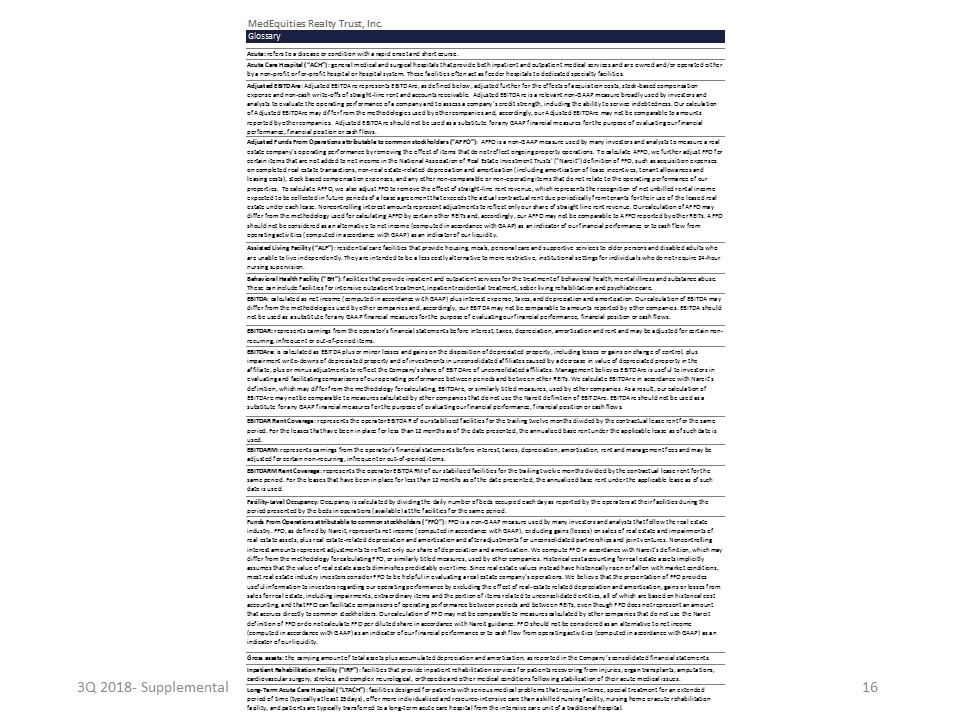
3Q 2018- Supplemental MedEquities Realty Trust, Inc.Glossary"Acute: refers to a disease or condition with a rapid onset and short course.""Acute Care Hospital (“ACH”): general medical and surgical hospitals that provide both inpatient and outpatient medical services and are owned and/or operated either by a non-profit or for-profit hospital or hospital system. These facilities often act as feeder hospitals to dedicated specialty facilities.""Adjusted EBITDAre: Adjusted EBITDAre represents EBITDAre, as defined below, adjusted further for the effects of acquisition costs, stock-based compensation expense and non-cash write-offs of straight-line rent and accounts receivable. Adjusted EBITDAre is a relevant non-GAAP measure broadly used by investors and analysts to evaluate the operating performance of a company and to assess a company’s credit strength, including the ability to service indebtedness. Our calculation of Adjusted EBITDAre may differ from the methodologies used by other companies and, accordingly, our Adjusted EBITDAre may not be comparable to amounts reported by other companies. Adjusted EBITDAre should not be used as a substitute for any GAAP financial measures for the purpose of evaluating our financial performance, financial position or cash flows.""Adjusted Funds From Operations attributable to common stockholders (“AFFO”): AFFO is a non-GAAP measure used by many investors and analysts to measure a real estate company’s operating performance by removing the effect of items that do not reflect ongoing property operations. To calculate AFFO, we further adjust FFO for certain items that are not added to net income in the National Association of Real Estate Investment Trusts' (""Nareit"") definition of FFO, such as acquisition expenses on completed real estate transactions, non-real estate-related depreciation and amortization (including amortization of lease incentives, tenant allowances and leasing costs), stock based compensation expenses, and any other non-comparable or non-operating items that do not relate to the operating performance of our properties. To calculate AFFO, we also adjust FFO to remove the effect of straight-line rent revenue, which represents the recognition of net unbilled rental income expected to be collected in future periods of a lease agreement that exceeds the actual contractual rent due periodically from tenants for their use of the leased real estate under each lease. Noncontrolling interest amounts represent adjustments to reflect only our share of straight line rent revenue. Our calculation of AFFO may differ from the methodology used for calculating AFFO by certain other REITs and, accordingly, our AFFO may not be comparable to AFFO reported by other REITs. AFFO should not be considered as an alternative to net income (computed in accordance with GAAP) as an indicator of our financial performance or to cash flow from operating activities (computed in accordance with GAAP) as an indicator of our liquidity.""Assisted Living Facility (“ALF”): residential care facilities that provide housing, meals, personal care and supportive services to older persons and disabled adults who are unable to live independently. They are intended to be a less costly alternative to more restrictive, institutional settings for individuals who do not require 24-hour nursing supervision."Behavioral Health Facility (“BH”): facilities that provide inpatient and outpatient services for the treatment of behavioral health, mental illness and substance abuse. These can include facilities for intensive outpatient treatment, inpatient residential treatment, sober living rehabilitation and psychiatric care."EBITDA: calculated as net income (computed in accordance with GAAP) plus interest expense, taxes, and depreciation and amortization. Our calculation of EBITDA may differ from the methodologies used by other companies and, accordingly, our EBITDA may not be comparable to amounts reported by other companies. EBITDA should not be used as a substitute for any GAAP financial measures for the purpose of evaluating our financial performance, financial position or cash flows.""EBITDAR: represents earnings from the operator’s financial statements before interest, taxes, depreciation, amortization and rent and may be adjusted for certain non-recurring, infrequent or out-of-period items."EBITDAre: is calculated as EBITDA plus or minor losses and gains on the disposition of depreciated property, including losses or gains on change of control, plus impairment write-downs of depreciated property and of investments in unconsolidated affiliates caused by a decrease in value of depreciated property in the affiliate, plus or minus adjustments to reflect the Company's share of EBITDAre of unconsolidated affiliates. Management believes EBITDAre is useful to investors in evaluating and facilitating comparisons of our operating performance between periods and between other REITs. We calculate EBITDAre in accordance with Nareit's definition, which may differ from the methodology for calculating, EBITDAre, or similarly titled measures, used by other companies. As a result, our calculation of EBITDAre may not be comparable to measures calculated by other companies that do not use the Nareit definition of EBITDAre. EBITDAre should not be used as a substitute for any GAAP financial measures for the purpose of evaluating our financial performance, financial position or cash flows."EBITDAR Rent Coverage: represents the operator EBITDAR of our stabilized facilities for the trailing twelve months divided by the contractual lease rent for the same period. For the leases that have been in place for less than 12 months as of the date presented, the annualized base rent under the applicable lease as of such date is used.""EBITDARM: represents earnings from the operator’s financial statements before interest, taxes, depreciation, amortization, rent and management fees and may be adjusted for certain non-recurring, infrequent or out-of-period items.""EBITDARM Rent Coverage: represents the operator EBITDARM of our stabilized facilities for the trailing twelve months divided by the contractual lease rent for the same period. For the leases that have been in place for less than 12 months as of the date presented, the annualized base rent under the applicable lease as of such date is used."Facility-Level Occupancy: Occupancy is calculated by dividing the daily number of beds occupied each day as reported by the operators at their facilities during the period presented by the beds in operations (available) at the facilities for the same period.Funds From Operations attributable to common stockholders (“FFO”): FFO is a non-GAAP measure used by many investors and analysts that follow the real estate industry. FFO, as defined by Nareit, represents net income (computed in accordance with GAAP), excluding gains (losses) on sales of real estate and impairments of real estate assets, plus real estate-related depreciation and amortization and after adjustments for unconsolidated partnerships and joint ventures. Noncontrolling interest amounts represent adjustments to reflect only our share of depreciation and amortization. We compute FFO in accordance with Nareit’s definition, which may differ from the methodology for calculating FFO, or similarly titled measures, used by other companies. Historical cost accounting for real estate assets implicitly assumes that the value of real estate assets diminishes predictably over time. Since real estate values instead have historically risen or fallen with market conditions, most real estate industry investors consider FFO to be helpful in evaluating a real estate company’s operations. We believe that the presentation of FFO provides useful information to investors regarding our operating performance by excluding the effect of real-estate related depreciation and amortization, gains or losses from sales for real estate, including impairments, extraordinary items and the portion of items related to unconsolidated entities, all of which are based on historical cost accounting, and that FFO can facilitate comparisons of operating performance between periods and between REITs, even though FFO does not represent an amount that accrues directly to common stockholders. Our calculation of FFO may not be comparable to measures calculated by other companies that do not use the Nareit definition of FFO or do not calculate FFO per diluted share in accordance with Nareit guidance. FFO should not be considered as an alternative to net income (computed in accordance with GAAP) as an indicator of our financial performance or to cash flow from operating activities (computed in accordance with GAAP) as an indicator of our liquidity."Gross assets: the carrying amount of total assets plus accumulated depreciation and amortization, as reported in the Company’s consolidated financial statements.""Inpatient Rehabilitation Facility (“IRF”): facilities that provide inpatient rehabilitation services for patients recovering from injuries, organ transplants, amputations, cardiovascular surgery, strokes, and complex neurological, orthopedic and other medical conditions following stabilization of their acute medical issues.""Long-Term Acute Care Hospital (“LTACH”): facilities designed for patients with serious medical problems that require intense, special treatment for an extended period of time (typically at least 25 days), offer more individualized and resource-intensive care than a skilled nursing facility, nursing home or acute rehabilitation facility, and patients are typically transferred to a long-term acute care hospital from the intensive care unit of a traditional hospital."
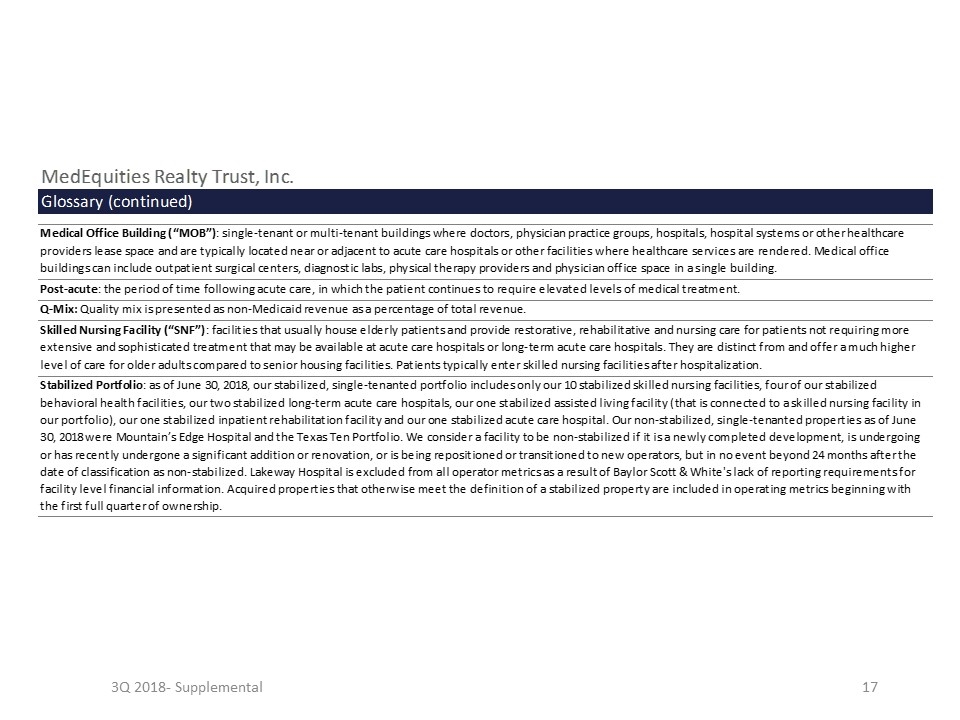
3Q 2018- Supplemental MedEquities Realty Trust, Inc.Glossary (continued)"Medical Office Building (“MOB”): single-tenant or multi-tenant buildings where doctors, physician practice groups, hospitals, hospital systems or other healthcare providers lease space and are typically located near or adjacent to acute care hospitals or other facilities where healthcare services are rendered. Medical office buildings can include outpatient surgical centers, diagnostic labs, physical therapy providers and physician office space in a single building.""Post-acute: the period of time following acute care, in which the patient continues to require elevated levels of medical treatment.""Q-Mix: Quality mix is presented as non-Medicaid revenue as a percentage of total revenue. ""Skilled Nursing Facility (“SNF”): facilities that usually house elderly patients and provide restorative, rehabilitative and nursing care for patients not requiring more extensive and sophisticated treatment that may be available at acute care hospitals or long-term acute care hospitals. They are distinct from and offer a much higher level of care for older adults compared to senior housing facilities. Patients typically enter skilled nursing facilities after hospitalization."Stabilized Portfolio: as of June 30, 2018, our stabilized, single-tenanted portfolio includes only our 10 stabilized skilled nursing facilities, four of our stabilized behavioral health facilities, our two stabilized long-term acute care hospitals, our one stabilized assisted living facility (that is connected to a skilled nursing facility in our portfolio), our one stabilized inpatient rehabilitation facility and our one stabilized acute care hospital. Our non-stabilized, single-tenanted properties as of June 30, 2018 were Mountain’s Edge Hospital and the Texas Ten Portfolio. We consider a facility to be non-stabilized if it is a newly completed development, is undergoing or has recently undergone a significant addition or renovation, or is being repositioned or transitioned to new operators, but in no event beyond 24 months after the date of classification as non-stabilized. Lakeway Hospital is excluded from all operator metrics as a result of Baylor Scott & White's lack of reporting requirements for facility level financial information. Acquired properties that otherwise meet the definition of a stabilized property are included in operating metrics beginning with the first full quarter of ownership.
