Attached files
| file | filename |
|---|---|
| EX-32.1 - GULF RESOURCES, INC. | e618029_ex32-1.htm |
| EX-31.2 - GULF RESOURCES, INC. | e618029_ex31-2.htm |
| EX-31.1 - GULF RESOURCES, INC. | e618029_ex31-1.htm |
| EX-23.1 - GULF RESOURCES, INC. | e618029_ex23-1.htm |
UNITED STATES
SECURITIES AND EXCHANGE COMMISSION
Washington, D.C. 20549
FORM 10-K/A
(Amendment No. 2)
(Mark One)
x ANNUAL REPORT PURSUANT TO SECTION 13 OR 15(d) OF THE SECURITIES EXCHANGE ACT OF 1934
For the fiscal year ended December 31, 2017
Or
o TRANSITION REPORT PURSUANT TO SECTION 13 OR 15(d) OF THE SECURITIES EXCHANGE ACT OF 1934
For the transition period from ________________ to ________________
Commission file number 001-34499
Gulf Resources, Inc.
(Exact name of registrant as specified in its charter)
| Nevada | 13-3637458 | |
| (State or other jurisdiction of incorporation or organization) | (I.R.S. Employer Identification No.) | |
| Level 11,Vegetable Building, Industrial Park of the East Shouguang City, Shandong, China | 262700 | |
| (Address of principal executive offices) | (Zip Code) |
+86 (536) 567-0008
Registrant’s telephone number, including area code
Securities registered pursuant to Section 12(b) of the Act:
| Title of each class | Name of each exchange on which registered |
| Common Stock, $0.0005 par value | NASDAQ Global Select Market |
Securities registered pursuant to section 12(g) of the Act:
Indicate by check mark if the registrant is a well-known seasoned issuer, as defined in Rule 405 of the Securities Act. Yes o No x
Indicate by check mark if the registrant is not required to file reports pursuant to Section 13 or Section 15(d) of the Act. Yes o No x
Indicate by check mark whether the registrant (1) has filed all reports required to be filed by Section 13 or 15(d) of the Securities Exchange Act of 1934 during the preceding 12 months (or for such shorter period that the registrant was required to file such reports), and (2) has been subject to such filing requirements for the past 90 days. Yes x No o
Indicate by check mark if disclosure of delinquent filers pursuant to Item 405 of Regulation S-K (§ 229.405 of this chapter) is not contained herein, and will not be contained, to the best of registrant’s knowledge, in definitive proxy or information statements incorporated by reference in Part III of this Form 10-K or any amendment to this Form 10-K o
Indicate by check mark whether the registrant is a large accelerated filer, an accelerated filer, a non-accelerated filer, or a smaller reporting company. See definitions of “large accelerated filer," "accelerated filer,” and "smaller reporting company" in Rule 12b-2 of the Exchange Act. (Check one):
| Large accelerated filer o | Accelerated filer o | Emerging Growth Company o |
| Non-accelerated filer (Do not check if a smaller reporting company) o | Smaller reporting company x | |
If an emerging growth company, indicate by check mark if the registrant has elected not to use the extended transition period for complying with any new or revised financial accounting standards provided pursuant to Section 13(a) of the Exchange Act. ☐
Indicate by check mark whether the registrant is a shell company (as defined in Rule 12b-2 of the Act). Yes o No x
State the aggregate market value of the voting and non-voting common equity held by non-affiliates computed by reference to the price at which the common equity was last sold, or the average bid and asked price of such common equity, as of the last business day of the registrant’s most recently completed second fiscal quarter. As of June 30, 2017, the aggregate market value of the common stock of the registrant held by non-affiliates (excluding shares held by directors, officers and others holding more than 5% of the outstanding shares of the class) was $52,265,626 based upon a closing sale price of $1.59.
APPLICABLE ONLY TO REGISTRANTS INVOLVED IN BANKRUPTCY PROCEEDINGS DURING THE PRECEDING FIVE YEARS:
Indicate by check mark whether the registrant has filed all documents and reports required to be filed by Section 12, 13 or 15 of the Securities Exchange Act of 1934 subsequent to the distribution of securities under a plan confirmed by a court.
Yes o No o
(APPLICABLE ONLY TO CORPORATE REGISTRANTS)
As of March 14, 2018, the registrant had outstanding 46,803,791 shares of common stock.
DOCUMENTS INCORPORATED BY REFERENCE
Portions of the Registrant’s Proxy Statement relating to the Registrant’s 2018 Annual Meeting of Shareholders are incorporated by reference into Part III of this Annual Report on Form 10-K.
Explanatory Note
This Amendment no. 2 on Form 10-K/A is being filed to reflect the correction of an error in the previously reported fiscal year 2017 financial statements as filed on March 16, 2018 related to the one-time mandatory federal transition tax on accumulated foreign earnings. See Note 2 to the Consolidated Financial Statements included in item 8 for additional information and a reconciliation of the previously reported amounts to the restated amounts. Items that have not been amended have been omitted from this amendment.
The following are the sections that are impacted by the correction of the error:
Part 1, Item 1 - Business
Part II, Item 7 - Management’s Discussion and Analysis of Financial Condition and Results of Operations
Part II, Item 8 - Financial Statements and Supplementary Data
Part II, Item 9A - Controls and Procedures
The Company is also concurrently filing amended Quarterly Reports for the quarterly periods ended March 31, 2018 and June 30, 2018 to restate the previously issued interim financial statements due to the error described above.
| PART I | |||
| Item 1. | Business | 1 | |
| PART II | |||
| Item 7. | Management’s Discussion and Analysis of Financial Condition and Results of Operations | 12 | |
| Item 8. | Financial Statements and Supplementary Data | 26 | |
| Item 9A. | Controls and Procedures | 27 | |
| PART IV | |||
| Item 15. | Exhibits and Financial Statement Schedules | 29 | |
| Signatures | 30 | ||
Special Note Regarding Forward Looking Information
This report contains forward-looking statements that reflect management's current views and expectations with respect to our business, strategies, future results and events, and financial performance. All statements made in this report other than statements of historical fact, including statements that address operating performance, events or developments that management expects or anticipates will or may occur in the future, including statements related to future reserves, cash flows, revenues, profitability, adequacy of funds from operations, statements expressing general optimism about future operating results and non-historical information, are forward-looking statements. In particular, the words "believe", "expect", "intend", "anticipate", "estimate", "plan", "may", "will", variations of such words and similar expressions identify forward-looking statements, but are not the exclusive means of identifying such statements and their absence does not mean that the statement is not forward-looking. Readers should not place undue reliance on forward-looking statements which are based on management's current expectations and projections about future events, are not guarantees of future performance, are subject to risks, uncertainties and assumptions. Our actual results, performance or achievements could differ materially from the results expressed in, or implied by, these forward-looking statements. Factors that could cause or contribute to such differences include those discussed in this report, particularly under the caption "Risk Factors". Except as required under the federal securities laws, we do not undertake any obligation to update the forward-looking statements in this report.
PART I
Introduction
We manufacture and trade bromine and crude salt, natural gas, manufacture and sell chemical products used in oil and gas field exploration, oil and gas distribution, oil field drilling, papermaking chemical agents, inorganic chemicals, and manufacture and sell materials for human and animal antibiotics. To date, our products have been sold only within the People’s Republic of China. As used in this report, the terms "we," "our," "Company" and "Gulf Resources" refers to Gulf Resources, Inc. and its wholly-owned subsidiaries, and the terms “ton” and “tons” refers to metric tons, in each case, unless otherwise stated or the context requires otherwise. All information in this report gives retroactive effect to a 4-for-1 reverse stock split of our common stock effected on October 12, 2009.
The functional currency of the Company’s operating foreign subsidiaries is the Renminbi (“RMB”), which had an average exchange rate of $0.15062 and $0.14811 during fiscal years 2016 and 2017, respectively. The functional and reporting currency of the Company is the United States dollar (“USD” or $”).
1
Our Corporate History
We were originally incorporated in Delaware and subsequently re-incorporated in Nevada. From November 1993 through August 2006, we were engaged in the business of owning, leasing and operating coin and debit card pay-per copy photocopy machines, fax machines, microfilm reader-printers and accessory equipment under the name “Diversifax, Inc.”. Due to the increased use of internet services, demand for our services declined sharply, and in August 2006, our Board of Directors decided to discontinue our operations.
Upper Class Group Limited, incorporated in the British Virgin Islands in July 2006, acquired all the outstanding stock of Shouguang City Haoyuan Chemical Company Limited ("SCHC"), a company incorporated in Shouguang City, Shandong Province, the People's Republic of China (the “PRC”), in May 2005. At the time of the acquisition, members of the family of Mr. Ming Yang, our president and former chief executive officer, owned approximately 63.20% of the outstanding shares of Upper Class Group Limited. Since the ownership of Upper Class Group Limited and SCHC was then substantially the same, the acquisition was accounted for as a transaction between entities under common control, whereby Upper Class Group Limited recognized the assets and liabilities transferred at their carrying amounts.
On December 12, 2006, our Company, then known as Diversifax, Inc., a public "shell" company, acquired Upper Class Group Limited and SCHC. Under the terms of the agreement, the stockholders of Upper Class Group Limited received 13,250,000 (restated for the 2-for-1 stock split in 2007 and the 1-for-4 stock split in 2009) shares of our voting common stock in exchange for all outstanding shares of Upper Class Group Limited. Members of the Yang family received approximately 62% of our common stock as a result of the acquisition. Under accounting principles generally accepted in the United States, the share exchange is considered to be a capital transaction rather than a business combination. That is, the share exchange is equivalent to the issuance of stock by Upper Class Group Limited for the net assets of Gulf Resources, Inc., accompanied by a recapitalization, and is accounted for as a change in capital structure. Accordingly, the accounting for the share exchange is identical to that resulting from a reverse acquisition, except no goodwill is recorded. Under reverse takeover accounting, the post reverse acquisition comparative historical consolidated financial statements of the legal acquirer, Diversifax, Inc., are those of the legal acquiree, Upper Class Group Limited. Share and per share amounts stated have been retroactively adjusted to reflect the share exchange. On February 20, 2007, we changed our corporate name to Gulf Resources, Inc.
On February 5, 2007, we acquired Shouguang Yuxin Chemical Industry Co., Limited ("SYCI"), a company incorporated in the People's Republic of China. Under the terms of the acquisition agreement, the stockholders of SYCI received a total of 8,094,059 (restated for the 2-for-1 stock split in 2007 and the 1-for-4 stock split in 2009) shares of common stock of Gulf Resources, Inc. in exchange for all outstanding shares of SYCI's common stock. Simultaneously with the completion of the acquisition, a dividend of $2,550,000 was paid to the former stockholders of SYCI. At the time of the acquisition, approximately 49.1% of the outstanding shares of SYCI were owned by Ms. Yu, Mr. Yang’s wife, and the remaining 50.9% of the outstanding shares of SYCI were owned by SCHC, all of whose outstanding shares were owned by Mr. Yang and his wife. Since the ownership of Gulf Resources, Inc. and SYCI are substantially the same, the acquisition was accounted for as a transaction between entities under common control, whereby Gulf Resources, Inc. recognized the assets and liabilities of SYCI at their carrying amounts. Share and per share amounts have been retroactively adjusted to reflect the acquisition.
To satisfy certain ministerial requirements necessary to confirm certain government approvals required in connection with the acquisition of SCHC by Upper Class Group Limited, all of the equity interest of SCHC were transferred to a newly formed Hong Kong corporation named Hong Kong Jiaxing Industrial Limited (“Hong Kong Jiaxing”) all of the outstanding shares of which are owned by Upper Class Group Limited. The transfer of all of the equity interest of SCHC to Hong Kong Jiaxing received approval from the local State Administration of Industry and Commerce on December 10, 2007.
As a result of the transactions described above, our corporate structure is linear. That is Gulf Resources owns 100% of the outstanding shares of Upper Class Group Limited, which owns 100% of the outstanding shares of Hong Kong Jiaxing, which owns 100% of the outstanding shares of SCHC, which owns 100% of the outstanding shares of SYCI. Further, as a result of our acquisitions of SCHC and SYCI, our historical consolidated financial statements, as contained in our Consolidated Financial Statements and Management's Discussion and Analysis, appearing elsewhere in the report, reflect the accounts of SCHC and SYCI.
On October 12, 2009, we completed a 1-for-4 reverse stock split of our common stock, such that for each four shares outstanding prior to the stock split there was one share outstanding after the reverse stock split. All shares of common stock referenced in this report have been adjusted to reflect the stock split figures. On October 27, 2009, our shares began trading on the NASDAQ Global Select Market under the ticker symbol “GFRE” and on June 30, 2011 we changed our ticker symbol to “GURE” to better reflect our corporate name.
On January 12, 2015, the Company and SCHC entered into an Equity Interest Transfer Agreement with Shouguang City Rongyuan Chemical Co., Ltd (“SCRC”) pursuant to which SCHC agreed to acquire SCRC and all rights, title and interest in and to all assets owned by SCRC, a leading manufacturer of materials for human and animal antibiotics in China and other parts of Asia.
On February 4, 2015 the Company closed the transactions contemplated by the agreement between the Company, SCHC and SCRC.
On the Closing Date, the Company issued 7,268,011 shares of its common stock, par value $0.0005 per share (the “Shares”), at the closing market price of $1.84 per Share on the closing date to the four former equity owners of SCRC .The issuance of the Shares was exempt from registration pursuant to Regulation S of the Securities Act of 1933, as amended. On the Closing Date, the Company entered into a lock-up agreement with the four former equity owners of SCRC. In accordance with the terms of the lock-up agreement, the shareholders agreed not to sell or transfer the Shares for five years from the date the stock certificates evidencing the Shares were issued.
The sellers of SCRC agreed as part of the purchase price to accept the Shares, based on a valuation of $2.00, which was a 73% premium to the price on the day the agreement was reached. For accounting purposes, the Shares are now being valued at $1.84, which was the closing price of our stock on the closing date of the agreement. The price difference between the original $2.00 and the current $1.84 is solely for accounting purposes. There has been no change in the number of shares issued.
On November 24, 2015, Gulf Resources, Inc., a Delaware corporation consummated a merger with and into its wholly-owned subsidiary, Gulf Resources, Inc., a Nevada corporation. As a result of the reincorporation, the Company is now a Nevada corporation.
2
On December 15, 2015, the Company registered a new subsidiary in the Sichuan Province of the PRC named Daying County Haoyuan Chemical Company Limited (“DCHC”) with registered Capital of RMB50,000,000, and there was RMB13,848,730 capital contributed by SCHC as of December 31, 2017. DCHC was established to further explore and develop natural gas and brine resources (including bromine and crude salt) in China.
On September 2, 2016, the Company announced the planned merger of two of its 100% owned subsidiaries, ShouguanYuxin Chemical Co., Limited (“SYCI”) and ShouguanRongyuan Chemical Co., Ltd (“SCRC”). On March 24, 2017, the legal process of the merger was completed and SCRC was officially deregistered on March 28, 2017. The results of these two subsidiaries were reported as SYCI in the fiscal year 2017.
Our current corporate structure chart is set forth in the following diagram:
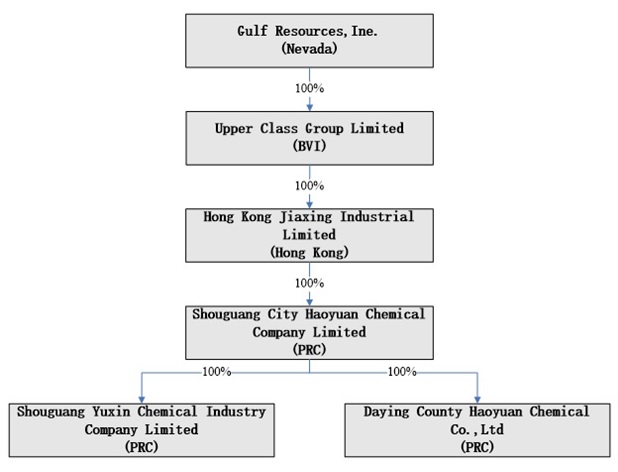
Our executive offices are located in China at Level 11,Vegetable Building, Industrial Park of the East in Shouguang City, Shandong Province, P.R.C. Our telephone number is +86 (536) 5670008. Our website address is www.gulfresourcesinc.com. The information contained on or accessed through our website is not intended to constitute and shall not be deemed to constitute part of this Form 10-K.
Closure and rectification process of our Bromine, Crude Salt and Chemical Products factories
On September 1, 2017, the company received letters from the Yangkou County, Shouguang City government to each of its subsidiaries, Shouguang City Haoyuan Chemical Company Limited and Shouguang Yuxin Chemical Industry Co., Limited, which stated that in an effort to improve the safety and environmental protection management level of chemical enterprises, the plants are requested to immediately stop production and perform rectification and improvements in accordance with the country's new safety, environmental protection requirements.
Later on the local government organized the Safety Supervision and Administration Department and the Environmental Protection Departments conducted inspections of every bromine production enterprise within its jurisdiction, in order to improve security, environmental protections, pollution, and safety. The Company has been working closely with the County authorities developing rectification plans for both its bromine and its chemical businesses. The Company and the government agreed on a rectification plan for Haoyuan Chemicals, the Company’s bromine business which is currently under process.
The Company has converted its bromine and crude salt factories from coal to electricity, installed computerized production monitoring and safety equipment, lined all of the salt ponds, paved roads, and performed some other upgrades. The total cost of rectification is estimated to be approximately $35 million. During 2017, the Company spent $17.9 million on this process. The largest portion, $13.7 million was spent on enhancement work in the salt fields. The additional $4.2 million was primarily for equipment. In 2018, the Company will continue to invest in this project on enhancement projects for transmission channels and ducts, equipment and upgrades.
In addition to the $35 million, the Company expects to spend an additional $40 million in 2018 to carry out enhancement projects for its extraction wells. This should allow the Company to increase its efficiency and utilization.
We expect to complete the rectification and improvements of the bromine and crude salt factories and be ready for the government inspection in the first half of 2018, and will resume operations upon receipt of approval from the government. Once we receive the approval from government, we will begin test production, and will begin to carefully ramp up production in each of the factories. Full production should be achieved in a few months.
After the completion of the rectification, the only potential constraint is the waste water treatment. It is still unclear if the government will place some small limitations on waste water. We are currently working with the government on the waste water issue. In the worst case, it is possible we may have a small reduction in capacity.
Because many smaller producers have not had the capital to conduct the rectification required by the government, management believes there could be some extremely attractive acquisition opportunities in bromine. At the present time, All of management’s attention is focused on getting its facilities approved and in full production. However, management could consider acquisitions in this segment in the future if the prices were sufficiently attractive.
On November 24, 2017, we received a letter from the People’s Government of Yangkou County, Shouguang City notifying the Company that due to the new standards and regulations relating to safety production and environmental pollution, from certain local governmental departments, such as the municipal environmental protection department, the security supervision department and the fire department, have decided to relocate chemical enterprises to a new industrial park called Bohai Marine Fine Chemical Industry Park. Chemical companies that are not invited into the park will be permanently closed. Although we are in compliance with regulations within the county, due to the proximity of our subsidiary, Shouguang Yuxin Chemical Co.’s, production plant in or near a residential area, we have been invited to relocate our chemical production plant to Bohai Marine Fine Chemical Industry Park. This is due to the country’s effort to improve the development of the chemical industry, manage safe production and curb environmental pollution accidents effectively, as well as ensure the quality of the environment for residents. All chemical enterprises which do not comply with the requirements of the safety and environmental protection regulations will be ordered to shut down. However, we must not commence activities until we have relocated the production plant and received qualified acceptances from related departments.
To date, we have secured the land for the chemical factory. We are currently working on the design of the factory as well as the relevant documents to apply for construction and project plan certificates. We expect this process of take several months. The level of capital expenditures in 2018 will depend on the timing of the approvals. As soon as the design, project plan, and construction are approved, Gulf will move ahead as quickly as possible We expect the new factory will be fully operational by the beginning of 2020. However, we are working very hard to get the project completed earlier. There is an impairment loss on the property, plant and equipment related to the relocation of our chemical production plant to Bohai Marine Fine Chemical Industry Park in the amount of $16,636,322, since much of the equipment that was used in the chemical factories was relatively old. Further, even if it had been newer, we believe that it might not have passed new environmental tests. The total cost of the new factories is currently estimated to be $60 million. We have incurred a relocation cost of $9,732,118 for land lease.
We are not writing off any of the goodwill related to our chemicals business. We believe the new chemical factory should be able to produce strong sales and profits. There may be much less capacity in the chemical industry, as many factories may be permanently closed. In addition, other factories will have their capacity reduced. We should have a very modern factory that operates highly efficiently. With less competition and better equipment, we believe can generate sales and earnings in this segment at a level well above previous results.
We will continue to control the land and buildings where the old chemical factories are located. At this time, we have not considered how or if we can monetize this asset.
3
Our Business Segments
Our business operations are conducted in four segments, bromine, crude salt, chemical products, and natural gas. We manufacture and trade bromine, crude salt and natural gas, and manufacture and sell chemical products used in oil and gas field exploration, oil and gas distribution, oil field drilling, papermaking chemical agents, inorganic chemicals and manufacturer of materials for human and animal antibiotics. We conduct all of our operations in China.
Bromine and Crude Salt
We manufacture and distribute bromine through our wholly-owned subsidiary, Shouguang City Haoyuan Chemical Company Limited, or SCHC. Bromine (Br2) is a halogen element and it is a red volatile liquid at standard room temperature which has reactivity between chlorine and iodine. Elemental bromine is used to manufacture a wide variety of bromine compounds used in industry and agriculture. Bromine is also used to form intermediates in organic synthesis, in which it is somewhat preferable over iodine due to its lower cost. Our bromine is commonly used in brominated flame retardants, fumigants, water purification compounds, dyes, medicines and disinfectants.
The extraction of bromine in the Shandong Province is limited by the Provincial Government to licensed operations. We hold one such license. As part of our business strategy, it is our plan to continue acquiring smaller scaled and unlicensed producers and to use our bromine to expand our downstream chemical operations.
Location of Production Sites
Our production sites are located in the Shandong Province in northeastern China. The productive formation (otherwise referred to as the “working region”), extends from latitude N 36°56’ to N 37°20’ and from longitude E 118°38’ to E 119°14’, in the north region of Shouguang city, from the Xiaoqing River of Shouguang city to the west of the Dan River, bordering on Hanting District in the east, from the main channel of “Leading the Yellow River to Supply Qingdao City Project” in the south to the coastline in the north. The territory is classified as coastal alluvial – marine plain with an average height two to seven meters above the sea level. The terrain is relatively flat.
Geological background of this region
The Shandong Province working region is located to the east of Lubei Plain and on the south bank of Bohai Laizhou Bay. The geotectonic location bestrides on the North China Platte (I) and north three-level structure units, from west to east including individually the North China Depression, Luxi Plate, and Jiaobei Plate. Meanwhile, 4 V-level structure units including the Dongying Sag of Dongying Depression (IV) of North China Depression, the Buried Lifting Area of Guangrao, Niutou sag and Buried Lifting Area of Shuanghe and are all on two V-level structure units including Xiaying Buried Lifting Area of Weifang Depression (IV) of Luxi Plate and Chuangyi Sag, as well as on a V-level structure units of Jiaobei Buried Lifting Area of Jiaobei Plate.
Processing of Bromine
Natural brine is a complicated salt-water system, containing many ionic compositions in which different ions have close interdependent relationships and which can be reunited to form many dissolved soluble salts such as sodium chloride, potassium chloride, calcium sulfate, potassium sulfate and other similar soluble salts. The goal of natural brine processing is to separate and precipitate the soluble salts or ions away from the water. Due to the differences in the physical and chemical characteristics of brine samples, the processing methods are varied, and can result in inconsistency of processing and varied technical performance for the different useful components from the natural brine.
Bromine is the first component extracted during the processing of natural brine. In natural brine, the bromine exists in the form of bromine sodium and bromine magnesium and other soluble salts.
The bromine production process is as follows:
| 1. | natural brine is pumped from underground through extraction wells by subaqueous pumps; | |
| 2. | the natural brine then passes through transmission pipelines to storage reservoirs; | |
| 3. | the natural brine is sent to the bromine refining plant where bromine is extracted from the natural brine. In neutral or acidic water, the bromine ion is easily oxidized by adding the oxidative of chlorine, which generates the single bromine away from the brine. Thereafter the extracted single bromine is blown out by forced air, then absorbed by sulfur dioxide or soda by adding acid, chlorine and sulfur. Extracted bromine is stored in containers of different sizes; and | |
| 4. | the wastewater from this refining process is then transported by pipeline to brine pans. |
Our production feeds include (i) natural brine; (ii) vitriol; (iii) chlorine; (iv) sulfur; and (v) coal.
4
Crude Salt
We also produce crude salt, which is produced from the evaporation of the wastewater after our bromine production process. Once the brine is returned to the surface and the bromine is removed, the remaining brine is pumped to on-site containing pools and then exposed to natural sunshine. This causes the water to evaporate from the brine, resulting in salt being left over afterwards. Crude salt is the principal material in alkali production as well as chlorine alkali production and is widely used in the chemical, food and beverage, and other industries.
Chemical Products
We produce chemical products through our wholly-owned subsidiary, Shouguang Yuxin Chemical Industry Company Limited, or SYCI. The products we produce and the markets in which they are sold include, among others:
| Product name | Application sector |
| Hydroxyl guar gum | Oil Exploration & Production |
| Demulsified agent | Oil Exploration & Production |
| Corrosion inhibitor for acidizing | Oil Exploration & Production |
| Bactericide | Oil Exploration / Agricultural |
| Iron ion stabilizer | Oil Exploration & Production |
| Clay stabilizing agent | Oil Exploration & Production |
| Solid lubricant | Oil Exploration & Production |
| Polyether lubricant | Oil Exploration & Production |
| Bromopropane | Agricultural |
| Chlorantraniliprole | Agricultural |
| Remaining agent | Paper Making |
| Enhanced mild paper expansion agent | Paper Making |
| Chelant | Paper Making |
| Semi-finished Product of Tetramethylbenzidine | Pharmaceutical intermediates |
| Semi-finished Product of Trimethylolpropane | Pharmaceutical intermediates |
| Material of Lactic acid Trimethylolpropane | Pharmaceutical intermediates |
| Sodium Methoxide | By Products |
| Hydrobroic Acid | By Products |
| Sodium Bromide | By Products |
| Di Bromo Aldehyde | Agricultural &Pharmaceutical intermediates |
| Environment-friendly Solid Lubricants | Oil Exploration & Production |
| Environment-friendly Polyether Lubricants | Oil Exploration & Production |
SYCI concentrates its efforts on the production and sale of chemical products that are used in oil and gas field exploration, oil and gas distribution, oil field drilling, papermaking chemical agents, inorganic chemicals and manufacture and sell materials that are used for human and animal antibiotics.. SYCI also engages in depth study of existing products and new product research and development at the same time. Currently, SYCI's annual production of oil and gas field exploration products and related chemicals is over 26,000 tons, and its production of papermaking-related chemical products is over 5,000 tons. These products are mainly distributed to large domestic papermaking manufacturers and major oilfields such as Shengli Oilfield and Talimu Oilfields. SYCI's annual production capacity of materials that are used for human and animal antibiotics is over 6,800 tons.
SYCI’s factories are located in Shouguang City at 2nd Living District, Qinghe Oil Factory, Shouguang City, Shandong Province, China. The company has been certified as ISO9001-2000 compliant and received the Quality Products and Services Guarantee Certificate from China Association for Quality. SYCI has been accredited by Shandong as a Provincial Credit Enterprises and is a Class One supplier for both China Petroleum & Chemical Corporation (“SINOPEC”) and Petro China Company Limited.
Segment disclosure
We have four reportable segments: bromine, crude salt, chemical products and natural gas.
5
The amounts set forth below are based upon on an average RMB to USD exchange rates of $0.15062 and $0.14811 during fiscal years 2016 and 2017, respectively.
| Net Revenue by Segment | ||||||||||||||||
| Year Ended December 31, 2017 | Year Ended December 31, 2016 | |||||||||||||||
| Segment: | % of total | % of total | ||||||||||||||
| Bromine | $ | 42,224,901 | 39 | % | $ | 56,811,730 | 38 | % | ||||||||
| Crude Salt | $ | 8,986,080 | 8 | % | $ | 8,985,852 | 6 | % | ||||||||
| Chemical Products | $ | 56,311,460 | 53 | % | $ | 83,477,420 | 56 | % | ||||||||
| Total sales | $ | 107,522,441 | 100 | % | $ | 149,275,002 | 100 | % | ||||||||
| Segment: | Percentage Decrease in Net Revenue from fiscal year 2016 to 2017 | |||
| Bromine | (26 | %) | ||
| Crude Salt- | — | |||
| Chemical Products | (33 | %) | ||
| SCHC’s products sold in metric tons | Year ended December 31, 2017 | Year ended December 31, 2016 | Percentage Change Decrease | |||||||||
| Bromine | 10,681 | 14,955 | (29 | %) | ||||||||
| Crude Salt | 274,534 | 316,161 | (13 | %) | ||||||||
| Chemical products segment sold in metric tons |
Year ended December 31, 2017 |
Year ended December 31, 2016 |
Percentage Change Decrease | |||||||||
| Oil and gas exploration additives | 6,751 | 10,505 | (36 | %) | ||||||||
| Paper manufacturing additives | 2,016 | 3,032 | (33 | %) | ||||||||
| Pesticides manufacturing additives | 1,309 | 2,179 | (40 | %) | ||||||||
| Pharmaceutical intermediates | 1,058 | 1,617 | (35 | %) | ||||||||
| By products | 7,638 | 12,043 | (37 | %) | ||||||||
| 18,772 | 29,376 | (36 | %) | |||||||||
| Income from Operations by Segment | ||||||||||||||||
| Year ended December 31, 2017 | Year ended December 31, 2016 | |||||||||||||||
| Segment: | % of total | % of total | ||||||||||||||
| Bromine | $ | 12,460,230 | 90 | % | $ | 21,224,862 | 45 | % | ||||||||
| Crude Salt | $ | 2,426,137 | 18 | % | 9,076 | — | ||||||||||
| Chemical Products | $ | (1,024,569 | ) | (7 | %) | $ | 25,473,792 | 55 | % | |||||||
| Natural Gas | $ | (116,465 | ) | (1 | %) | $ | (4,906 | ) | — | |||||||
| Income from operations before corporate costs | $ | 13,745,333 | 100 | % | $ | 46,702,824 | 100 | % | ||||||||
| Corporate costs | $ | (1,015,963 | ) | $ | (682,210 | ) | ||||||||||
| Unrealized translation difference | $ | (1,557,759 | ) | $ | 1,702,728 | |||||||||||
| Income from operations | $ | 11,171,611 | $ | 47,723,342 | ||||||||||||
6
Year Ended December 31, 2017(Restated) | Bromine * | Crude Salt * | Chemical Products | Natural Gas | Segment Total | Corporate | Total | |||||||||||||||||||||
| Net revenue (external customers) | $ | 42,224,901 | $ | 8,986,080 | $ | 56,311,460 | $ | — | $ | 107,522,441 | $ | — | $ | 107,522,441 | ||||||||||||||
| Net revenue (intersegment) | 6,305,642 | — | — | — | 6,305,642 | — | 6,305,642 | |||||||||||||||||||||
| Income from operations before income taxes | 12,460,230 | 2,426,137 | (1,024,569 | ) | (116,465 | ) | 13,745,333 | (2,573,722 | ) | 11,171,611 | ||||||||||||||||||
| Income taxes | 3,156,016 | 585,521 | (131,397 | ) | — | 3,610,140 | — | 3,610,140 | ||||||||||||||||||||
| Income from operations after income taxes | 9,304,214 | 1,840,616 | (893,172 | ) | (116,465 | ) | 10,135,193 | (2,573,722 | ) | 7,561,471 | ||||||||||||||||||
| Total assets | 147,124,127 | 51,512,530 | 186,677,501 | 2,119,756 | 387,433,914 | 65,509 | 387,499,423 | |||||||||||||||||||||
| Depreciation and amortization | 14,533,169 | 2,452,737 | 3,211,407 | — | 20,197,313 | — | 20,197,313 | |||||||||||||||||||||
| Capital expenditures | 465,655 | 17,411,762 | — | 61,235 | 17,938,652 | — | 17,938,652 | |||||||||||||||||||||
| Goodwill | — | — | 29,374,909 | — | 29,374,909 | — | 29,374,909 | |||||||||||||||||||||
Year Ended December 31, 2016 | Bromine * | Crude Salt * | Chemical Products | Natural Gas | Segment Total | Corporate | Total | |||||||||||||||||||||
| Net revenue (external customers) | $ | 56,811,730 | $ | 8,985,852 | $ | 83,477,420 | $ | — | $ | 149,275,002 | $ | — | $ | 149,275,002 | ||||||||||||||
| Net revenue (intersegment) | 8,484,617 | — | — | — | 8,484,617 | — | 8,484,617 | |||||||||||||||||||||
| Income from operations before income taxes | 21,224,862 | 9,076 | 25,473,792 | (4,906 | ) | 46,702,824 | 1,020,518 | 47,723,342 | ||||||||||||||||||||
| Income taxes | 5,306,216 | 9,022 | 6,494,969 | — | 11,810,207 | — | 11,810,207 | |||||||||||||||||||||
| Income from operations after income taxes | 15,918,646 | 54 | 18,978,823 | (4,906 | ) | 34,892,617 | 1,020,518 | 35,913,135 | ||||||||||||||||||||
| Total assets | 143,145,960 | 33,980,033 | 186,676,983 | 1,799,094 | 365,602,070 | 89,283 | 365,691,353 | |||||||||||||||||||||
| Depreciation and amortization | 15,056,980 | 5,221,667 | 4,601,599 | — | 24,880,246 | — | 24,880,246 | |||||||||||||||||||||
| Capital expenditures | 12,912,583 | 2,335,963 | — | 1,747,316 | 16,995,862 | — | 16,995,862 | |||||||||||||||||||||
| Goodwill | — | — | 27,668,539 | — | 27,668,539 | — | 27,668,539 | |||||||||||||||||||||
Sales and Marketing
We have an in-house sales staff of 19 persons. Our customers send their orders to us first. Our in-house sales staff then attempts to satisfy these orders based on our actual production schedules and inventories on hand. Many of our customers have a long term relationship with us. We expect this to continue due to stable demand for mineral products, however, these relationship can not be guaranteed in the future.
Principal Customers
We sell a substantial portion of our products to a limited number of PRC customers. Our principal customers during 2017 were Shandong Morui Chemical Company Limited, Shandong Brother Technology Limited, Kuerle Xingdong Trading Limited, Shouguang Weidong Chemical Company Limited and Shouguang Shen Runfa Ocean Chemical Company Limited. We have ongoing policies in place to ensure that sales are made to customers who are credit-worthy. We are not aware of any allowances for doubtful debts required for each of the years ended December 31, 2017 and 2016.
7
During each of the years ended December 31, 2017 and 2016, sales to our three largest bromine customers, based on net revenue from such customers, aggregated $17,950,659 and $23,862,341, respectively, or approximately 43% and 42% of total net revenue from sale of bromine; and sales to our largest customer represented approximately 19% and 17%, respectively, of total net revenue from the sale of bromine.
During each of the years ended December 31, 2017 and 2016, sales to our three largest crude salt customers, based on net revenue from such customers, aggregated $8,947,283 and $8,985,852, respectively, or approximately 100% and 100% of total net revenue from sale of crude salt; and sales to our largest customer represented approximately 42% and 43%, respectively, of total net revenue from the sale of crude salt.
During each of the years ended December 31, 2017 and 2016, sales to our three largest chemical products customers, based on net revenue from such customers, aggregated $8,269,199 and $12,887,715, respectively, or approximately 15% and 15% of total net revenue from sale of chemical products; and sales to our largest customer represented approximately 6% and 7%, respectively, of total net revenue from the sale of chemical products.
This concentration of customers for all three segments makes us vulnerable to an adverse near-term impact, should one or more of these relationships be terminated.
Principal Suppliers
Our principal external suppliers are Shandong Xinlong Biological Technology Company limited, Shouguang City Rongguang Trading Company Limited and Shandong Xinlong Group Company limited, Shouguang Hongye Trading Company Limited and Zibo City Zichuan Fuli Chemical Raw Material Factory.
During each of the years ended December 31, 2017 and 2016, we purchased 66% and 61%, respectively, of raw materials for our bromine and crude production from three suppliers.
During each of the years ended December 31, 2017 and 2016, we purchased 55% and 70%, respectively, of raw materials for our chemical products production from three suppliers. We purchased a portion of the bromine produced by the Company internally as well, at cost totaling $6,305,642 and $8,484,617, for the years ended December 31, 2017 and 2016 respectively, for the production of chemical products.
This supplier concentration makes us vulnerable to a near-term adverse impact, should the relationships be terminated.
8
Business Strategy
Expansion of Production Capacity to Meet Demand
▼ Bromine and Crude Salt
In view of keen competition and the trend of less bromine contraction of brine water being extracted in Shouguang City, Shandong Province, the Company had announced its intent to access more bromine and crude salt resources by finding new underground brine water resources in the Sichuan Province. The Company completed the drilling of its first exploratory well in December 2011 and announced in mid-January 2012 that the Company discovered underground brine water resources in Daying County. In September 2014, the Company started deeper drilling exploration under its existing well and did an exploration analysis on the resources from different levels. On January 30, 2015 we announced that we had found natural gas resources under our bromine well in the Sichuan area. On November 23, 2015 the company’s wholly owned subsidiary SCHC entered into an agreement with the People’s Government of Daying County in Sichuan Province for the exploration and development of natural gas and brine resources (including bromine and crude salt). On January 11, 2017, the Company announced that it completed the first brine water and natural gas well field construction in Sichuan Province. Later on January 20, 2017 it announced the commencement of trial production. Then later on, the company found some issues related to the water and other potential impurities in the natural gas during trial production.
Currently, the company has found the solution to solve the waste water problem in the natural gas project. Now it is trying to solve the technical drilling problem. The Company had been working with Xinan Shiyou Daxue (Southwest Petroleum University) and found the way to solve the technical drilling problem of DCHC and ordered custom equipment. The natural gas project may commence production gradually once such equipment arrives and are being installed. The Company will strive for completion in the first half of 2018.
In order to improve the bromine and crude salt production capacity, the Company will continue to enhance its existing bromine and crude salt production facilities. In the fourth quarter of 2017, the Company incurred enhancement works in our crude salt field at a cost of approximately $13.7 million. The Company expects to carry out enhancement projects for the extraction wells in 2018, which will cost approximately $40 million. We also expect to carry out enhancement projects for the transmission channels and ducts for rectification and improvement in order to meet the new environmental rules in China in 2018, which will costs of approximately $8.5 million. The company will also expect to invest approximately $1.0 million in Sichuan Province for the natural gas resource project in 2018. The Company expects such enhancement expenditures will be funded by the Company’s cash on hand.
On September 1, 2017, the Company received notification from the Government of Yangkou County, Shouguang City of PRC that production at all its factories be halted with immediate effect in order for the Company to perform rectification and improvement in accordance with the county’s new safety and environmental protection requirements.
The Company has been working closely with the County authorities to develop rectification plans for both its bromine and crude salt businesses and had agreed on a plan in October 2017. SCHC is currently under rectification process. The Company believes this rectification and improvement process will cost approximately $35 million in total. The Company incurred rectification and improvements in the amount of $17,938,652 as of December 31, 2017. The Company expects to complete the rectification and improvements of the bromine and crude salt factories and be ready for the government inspection in the first half of 2018, and will resume operations upon receipt of approval from the government.
▼ Chemical Products
On November 24, 2017, the Company received a letter from the Government of Yangkou County, Shouguang City notifying the Company to relocate its two chemical production plants located in the second living area of the Qinghe Oil Extraction Plant to the Bohai Marine Fine Chemical Industrial Park. This is because the two plants are located in a residential area and their production activities will have certain impact on the living environment of the residents. This is as a result of the country’s effort to improve the development of the chemical industry, manage safe production and curb environmental pollution accident effectively, and ensure the quality of living environment of residents. All chemical enterprises which do not comply with the requirements of the safety and environmental protection regulations will be ordered to shut down. The Company believes this relocation process will cost approximately $60 million in total. The Company incurred relocation cost in the amount of $9,732,118 as of December 31, 2017 and estimated that the new factory will be fully operational by the beginning of 2020.
9
Competition
To date, our sales have been limited to customers within the PRC and we expect that our sales will remain primarily domestic for the immediate future. Our marketing strategy involves developing long term ongoing working relationships with customers based on large multi-year agreements which foster mutually advantageous relationships.
We compete with PRC domestic private companies and state-owned companies. Certain state-owned and state backed competitors are more established and have more control of certain resources in terms of pricing than we do. We compete in our business based on price, our reputation for quality and on-time delivery, our relationship with suppliers and our geographical proximity to natural brine deposits in the PRC for bromine, crude salt and chemical productions. Management believes that our stable quality, manufacturing processes and plant capacity for the production of bromine, crude salt and chemical products are key considerations in awarding contracts in the PRC.
Our principal competitors in the bromine business are Shandong Yuyuan Group Company Limited, Shandong Haihua Group Company Limited, Shandong Dadi Salt Chemical Group Company Limited and Shandong Haiwang Chemical Company Limited, all of which produce bromine principally for use in their chemicals businesses and sell part of the bromine produced to customers. These companies may switch to selling bromine to the market if they no longer use bromine in their chemical businesses.
Our principal competitors in the crude salt business are Shandong Haiwang Chemical Company Limited, Shandong Haihua Group Company Limited, Shandong Weifang Longwei Industrial Company Limited, Shandong Yuyuan Group Company Limited and Shandong Caiyangzi Saltworks.
Our principal competitors in the chemical business are Beijing Shiji Zhongxing Energy Technology Co., Ltd, Yanan Chaozheng Nijiang Co., Ltd, Shandong Dacheng Pesticides Company Limited, Binhua Group Company Limited, Dongying City Dongchen (Group) Chemical Industry Company Limited, Beijing Peikangjiaye Technologies Limited, Shouguang Fukang Pharmaceutical Co., Ltd. Shandong Xinhua Pharmaceutical Limited by Share Ltd, Hunan Erkang Pharmaceutical Limited by Share Ltd and Xinan Synthetic Pharmaceutical Limited by Share Ltd.
Government Regulation
China has begun to reinforce the environmental requirements for the entire chemical industry, demanding the closure or rectification of those factories that do not meet the emission requirements and are highly polluting. In early 2017, the government announced the closure or relocation of those chemical industry facilities that are close to residential areas and the new environmental law officially came into full effect in January 2018.
The following is a summary of the principal governmental laws and regulations that are or may be applicable to our operations in the PRC. The scope and enforcement of many of the laws and regulations described below are uncertain. We cannot predict the effect of further developments in the Chinese legal system, including the promulgation of new laws, changes to existing laws or the interpretation or enforcement of laws.
In the natural resources sector, the PRC and the various provinces have enacted a series of laws and regulations over the past 20 years, including laws and regulations designed to improve safety and decrease environmental degradation. The "China Mineral Resources Law" declares state ownership of all mineral resources in the PRC. However, mineral exploration rights can be purchased, sold and transferred to foreign owned companies. Mineral resource rights are granted by the Central Government permitting recipients to conduct mineral resource activities in a specific area during the license period. These rights entitle the licensee to undertake mineral resource activities and infrastructure and ancillary work, in compliance with applicable laws and regulations, within the specific area covered by the license during the license period. The licensee is required to submit a proposal and feasibility studies to the relevant authority and to pay the Central Government a natural resources tax in an amount equal to a percent of annual crude salt sales and tones of bromine sold. Shandong Province has determined that bromine is to be extracted only by licensed entities and we hold one of such licenses. Despite the province desire to limit extraction to licensed entities hundreds of smaller operations continue to extract bromine without licenses.
The Ministry of Land and Resources (“MLR”) is the principal regulator of mineral rights in China. The Ministry has authority to grant licenses for land-use and exploration rights, issue permits for mineral rights and leases, oversee the fees charged for them and their transfer, and review reserve evaluations. We are required to hold a bromine and salt production license in order to operate our bromine and salt production business in the PRC. Our bromine and salt production license is subject to a yearly audit. If we do not successfully pass the yearly approval by relevant government authorities, our bromine and salt production operations may be suspended until we are able to comply with the license requirements which could have a material adverse effect on our business, financial condition and results of operations.
10
All of our operating activities in China have been authorized by or obtained written consent from land and resources departments of local governments except bromine Factory No.10 and 11. In addition, all of our operations are subject to and have passed government safety inspections. We also have been granted environmental certification from the PRC Bureau of Environmental Protection that is not subject to expiration.
Employees
As of December 31, 2017, we employed approximately 699 full-time employees, of whom approximately 64% are with SCHC, 35% are with SYCI. Approximately 6% of our employees are management personnel and 4% are sales and procurement staff. None of our employees are represented by a union.
Our employees in China participate in a state pension arrangement organized by Chinese municipal and provincial governments. We are required to contribute to the arrangement at the rate of 19% of the average monthly salary. In addition, we are required by Chinese law to cover employees in China with other types of social insurance. Our total contribution amounts to 30% of the average monthly salary. We have purchased social insurance for almost all of our employees. Expense related to social insurance was approximately $1,093,716 for fiscal year 2017.
Available Information
We make available free of charge on or through our internet website, www.gulfresourcesinc.com, our Annual Reports on Form 10-K, Quarterly Reports on Form 10-Q, Current Reports on Form 8-K, and all amendments to those reports, if any, filed or furnished pursuant to Section 13(a) or 15(d) of the Securities Exchange Act of 1934 as soon as reasonably practicable after they are electronically filed with, or furnished to, the Securities and Exchange Commission. The information contained on our website is not intended to be incorporated into this Annual Report on Form 10-K.
11
PART II
Item 7. Management’s Discussion and Analysis of Financial Condition and Results of Operations.
Restatement of Previously issued Financial Statements
We determined that the entire one-time mandatory federal transition tax on accumulated foreign earnings can be offset against a portion of the Company’s US federal net operating loss carryovers and foreign tax credit carryovers. As a result, the Company did not need to accrue the $5,402,000 of income taxes and we are restating our consolidated financial statements as of and for the year ended December 31,2017 to correct this error. See Note 2 to the Consolidated Financial Statements included in Item 8 for a reconciliation of the previously reported amounts to the restated amounts.
Overview
We are a holding company which conducts operations through our wholly-owned China-based subsidiaries. Our business is conducted and reported in four segments, namely, bromine, crude salt, chemical products and natural gas.
Through our wholly-owned subsidiary, SCHC, we produce and trade bromine and crude salt. We are one of the largest producers of bromine in China, as measured by production output. Elemental bromine is used to manufacture a wide variety of bromine compounds used in industry and agriculture. Bromine also is used to form intermediary chemical compounds such as Tetramethylbenzidine. Bromine is commonly used in brominated flame retardants, fumigants, water purification compounds, dyes, medicines and disinfectants. Crude salt is the principal material in alkali production as well as chlorine alkali production and is widely used in the chemical, food and beverage, and other industries.
Through our wholly-owned subsidiary, SYCI, we manufacture and sell chemical products used in oil and gas field exploration, oil and gas distribution, oil field drilling, papermaking chemical agents, inorganic chemicals and manufacture and sell materials that are used for human and animal antibiotics..
On December 12, 2006, we acquired, through a share exchange, Upper Class Group Limited, a British Virgin Islands holding corporation which then owned all of the outstanding shares of SCHC. Under accounting principles generally accepted in the United States, the share exchange is considered to be a capital transaction in substance, rather than a business combination. That is, the share exchange is equivalent to the issuance of stock by Upper Class for the net assets of our Company, accompanied by a recapitalization, and is accounted for as a change in capital structure. Accordingly, the accounting for the share exchange was identical to that resulting from a reverse acquisition, except no goodwill was recorded. Under reverse takeover accounting, the post reverse acquisition comparative historical consolidated financial statements of the legal acquirer, our Company, are those of the legal acquiree, Upper Class Group Limited, which is considered to be the accounting acquirer. Share and per share amounts reflected in this report have been retroactively adjusted to reflect the merger.
On February 5, 2007, the Company, acting through SCHC, acquired SYCI. Since the ownership of the Company and SYCI was then substantially the same, the transaction was accounted for as a transaction between entities under common control, whereby we recognized the assets and liabilities of SYCI at their carrying amounts. Share and per share amounts stated in this report have been retroactively adjusted to reflect the merger.
On August 31, 2008, SYCI completed the construction of a new chemical production line. It passed the examination by Shouguang City Administration of Work Safety and local fire department. This new production line focuses on producing environmental friendly additive products, solid lubricant and polyether lubricant, for use in oil and gas exploration. The line has an annual production capacity of 5,000 tons. Formal production of this chemical production line started on September 15, 2008. The total annual production capacity of SYCI is 36,300 tons.
On October 12, 2009 we completed a 1-for-4 reverse stock split of our common stock, such that for each four shares outstanding prior to the stock split there was one share outstanding after the reverse stock split. All shares of common stock referenced in this report have been adjusted to reflect the stock split figures. On October 27, 2009 our shares began trading on the NASDAQ Global Select Market under the ticker symbol “GFRE” and on June 30, 2011 we changed our ticker symbol to “GURE” to better reflection of our corporate name.
On January 12, 2015, the Company and SCHC entered into an Equity Interest Transfer Agreement with SCRC pursuant to which SCHC agreed to acquire SCRC and all rights, title and interest in and to all assets owned by SCRC, a leading manufacturer of materials for human and animal antibiotics in China and other parts of Asia.
On February 4, 2015 the Company closed the transactions contemplated by the agreement between the Company, SCHC and SCRC.
On the closing date, the Company issued 7,268,011 shares of its common stock, par value $0.0005 per share (the “Shares”), at the closing market price of $1.84 per Share on the closing date to the four former equity owners of SCRC .The issuance of the Shares was exempt from registration pursuant to Regulation S of the Securities Act of 1933, as amended. On the closing date, the Company entered into a lock-up agreement with the four former equity owners of SCRC. In accordance with the terms of the lock-up agreement, the shareholders agreed not to sell or transfer the Shares for five years from the date the stock certificates evidencing the Shares were issued.
The sellers of SCRC agreed as part of the purchase price to accept the Shares, based on a valuation of $2.00, which was a 73% premium to the price on the day the agreement was entered into. For accounting purposes, the Shares are now being valued at $1.84, which was the closing price of our stock on the day of the closing date of the agreement. The price difference between the original $2.00 and the current $1.84 is solely for accounting purposes. There has been no change in the number of shares issued.
12
On November 24, 2015, Gulf Resources, Inc., a Delaware corporation consummated a merger with and into its wholly-owned subsidiary, Gulf Resources, Inc., a Nevada corporation. As a result of the reincorporation, the Company is now a Nevada corporation.
On December 15, 2015, the Company registered a new subsidiary in the Sichuan Province of the PRC named Daying County Haoyuan Chemical Company Limited (“DCHC”) with registered Capital of RMB50,000,000, and there was RMB13,848,730 capital contributed by SCHC as of December 31, 2017. DCHC was established to further explore and develop natural gas and brine resources (including bromine and crude salt) in China.
On September 2, 2016, the Company announced the planned merger of two of its 100% owned subsidiaries, ShouguanYuxin Chemical Co., Limited (“SYCI”) and ShouguanRongyuan Chemical Co., Ltd (“SCRC”). On March 24, 2017, the legal process of the merger was completed and SCRC was officially deregistered on March 28, 2017. The results of these two subsidiaries were reported as SYCI in the fiscal year 2017.
As disclosed in the Company’s Current Report on Form 8-K filed on September 8, 2017 the Company disclosed that on September 1, 2017, the Company received letters from the Yangkou County, Shouguang City government addressed to each of its subsidiaries, SCHC and SYCI, which stated that in an effort to improve the safety and environmental protection management level of chemical enterprises, the plants are requested to immediately stop production and perform rectification and improvements in accordance with the country's new safety and environmental protection requirements. In the Company’s press release of August 11, 2017 and on its conference call of August 14, 2017, the Company addressed concerns that increased government enforcement of stringent environmental rules that were adopted in early 2017 to insure corporations bring their facilities up to necessary standards so that pollution and other negative environmental issues are limited and remediated, could have an impact on our business in both the short and long-term. The Company also expressed that although it believed its facilities were fully compliant, the Company did not know how its facilities would fare under the new rules and that the Company expected to have a full understanding of the implications within the next two months. Teams of inspectors from the government were sent to many provinces to inspect all mining and manufacturing facilities. The local government requested that facilities be closed, so that the facilities can undergo the inspection and analysis in the most efficient manner by inspectors’ team. As a result, our facilities were closed on September 1, 2017.
Later on, the Safety Supervision and Administration Department and the Environmental Protection Departments of the local government conducted inspections of every bromine production enterprise within its jurisdiction, in order to improve security, environmental protections, pollution, and safety. The Company had been working closely with the County authorities to develop rectification plans for both its bromine and its chemical businesses. The Company and the government had agreed on a rectification plan for SCHC, the Company’s bromine and crude salt businesses which is currently under process.
On November 24, 2017, Gulf Resources received a letter from the People’s Government of Yangkou County, Shouguang City notifying the Company that due to the new standards and regulations relating to safety production and environmental pollution, from certain local governmental departments, such as the municipal environmental protection department, the security supervision department and the fire department, have decided to relocate chemical enterprises to a new industrial park called Bohai Marine Fine Chemical Industry Park. Chemical companies that are not being asked to move into the park will be permanently closed. Although we are in compliance with regulations within the county, due to the proximity of our subsidiary, SYCI’s production plant to a residential area, we have been asked to relocate our chemical production plant to Bohai Marine Fine Chemical Industry Park. However, we must not commence activities until we have relocated the production plant and received inspection approval from related departments. The Company expects to complete the rectification and improvements of the bromine and crude salt factories and be ready for the government inspection in the first half of 2018, and will resume operations upon receipt of approval from the government. We expect the new chemical factory to be fully operational in the beginning of 2020 (See note 1(b) in notes to the consolidated financial statements).
The Company had been working with Xinan Shiyou Daxue (Southwest Petroleum University) and found the way to solve the technical drilling problem of DCHC and ordered custom equipment. The natural gas project may commence production gradually once such equipment arrives and are being installed. The Company will strive for completion in the first half of 2018.
As a result of our acquisitions of SCHC and SYCI, our historical consolidated financial statements and the information presented below reflects the accounts of SCHC, SYCI and DCHC, the consolidated financial statements and the information presented below as of and for the year ended December 31, 2017. The following discussion should be read in conjunction with our consolidated financial statements and notes thereto appearing elsewhere in this report.
13
RESULTS OF OPERATIONS
Year ended December 31, 2017 as compared to year ended December 31, 2016
| Years ended | ||||||||||||
|
December 31, 2017 (Restated) |
December 31, 2016 | Percent Change Increase/ (Decrease) | ||||||||||
| Net Revenue | $ | 107,522,441 | $ | 149,275,002 | (28 | %) | ||||||
| Cost of Net Revenue | $ | (63,157,090 | ) | $ | (94,785,671 | ) | (33 | %) | ||||
| Gross Profit | $ | 44,365,351 | $ | 54,489,331 | (19 | %) | ||||||
| Sales, Marketing and Other Operating Expense | $ | (278,600 | ) | $ | (343,105 | ) | (19 | %) | ||||
| Research and Development Costs | $ | (195,195 | ) | $ | (261,931 | ) | (25 | %) | ||||
| Write-off / Impairment on property, plant and equipment | $ | (17,581,244 | ) | $ | (106,545 | ) | 16,401 | % | ||||
| Loss on demolition of factory | $ | — | $ | (1,053,445 | ) | (100 | %) | |||||
| Direct labor and factory overheads incurred during plant shutdown | $ | (6,883,557 | ) | $ | — | |||||||
| General and Administrative Expenses | $ | (8,536,757 | ) | $ | (5,434,755 | ) | 57 | % | ||||
| Other Operating Income | $ | 281,613 | $ | 433,792 | (35 | %) | ||||||
| Income from Operations | $ | 11,171,611 | $ | 47,723,342 | (77 | %) | ||||||
| Other Income, Net | $ | 391,842 | $ | 312,696 | 25 | % | ||||||
| Income before Taxes | $ | 11,563,453 | $ | 48,036,038 | (76 | %) | ||||||
| Income Taxes | $ | (3,610,140 | ) | $ | (11,810,207 | ) | (69 | %) | ||||
| Net Income | $ | 7,953,313 | $ | 36,225,831 | (78 | %) | ||||||
Net Revenue The table below shows the changes in net revenue in the respective segment of the Company for the fiscal year 2017 compared to the same period in 2016:
| Net Revenue by Segment | ||||||||||||||||||||
| Year Ended | Year Ended | Percent Change | ||||||||||||||||||
| December 31, 2017 | December 31, 2016 | Decrease | ||||||||||||||||||
| Segment | Percent of total | Percent of total | ||||||||||||||||||
| Bromine | $ | 42,224,901 | 39 | % | $ | 56,811,730 | 38 | % | (26 | %) | ||||||||||
| Crude Salt | $ | 8,986,080 | 8 | % | $ | 8,985,852 | 6 | % | — | |||||||||||
| Chemical Products | $ | 56,311,460 | 53 | % | $ | 83,477,420 | 56 | % | (33 | %) | ||||||||||
| Total sales | $ | 107,522,441 | 100 | % | $ | 149,275,002 | 100 | % | (28 | %) | ||||||||||
| Years Ended December 31 | Percent Change | |||||||||||
| Bromine and crude salt segments product sold in tonnes | 2017 | 2016 | Decrease | |||||||||
| Bromine (excluded volume sold to SYCI) | 10,681 | 14,955 | (29 | %) | ||||||||
| Crude Salt | 274,534 | 316,161 | (13 | %) | ||||||||
| Years Ended December 31 | Percent Change | |||||||||||
| Chemical products segment sold in tonnes | 2017 | 2016 | Decrease | |||||||||
| Oil and gas exploration additives | 6,751 | 10,505 | (36%) | |||||||||
| Paper manufacturing additives | 2,016 | 3,032 | (33%) | |||||||||
| Pesticides manufacturing additives | 1,309 | 2,179 | (40%) | |||||||||
| Pharmaceutical intermediates | 1,075 | 1,617 | (34%) | |||||||||
| By products | 7,638 | 12,043 | (37%) | |||||||||
| Overall | 18,789 | 29,376 | (36%) | |||||||||
14
Bromine segment
The sales volume of bromine decreased from 14,955 tonnes for the fiscal year 2016 to 10,681 tonnes for the same period in 2017, a decrease of 29%. The major reason for the decrease in the sales volume of bromine was mainly due to the closure of all of our plant and factories to perform rectification and improvement since September 1, 2017. Some of our local customers were also requested to stop production, which affected our customers’ industries and our sales volume.
The selling price of bromine increased from $3,799 per tonne for the fiscal year 2016 to $3,953 per tonne for the same period in 2017, an increase of 4%.
The table below shows the changes in the average selling price and changes in the sales volume of bromine for the fiscal year 2017 from the same period in 2016.
| Fiscal Year | ||||
| Decrease in net revenue of bromine as a result of: | 2017 vs. 2016 | |||
| Increase in average selling price | $ | 1,978,753 | ||
| Decrease in sales volume | $ | (16,565,582 | ) | |
| Total effect on net revenue of bromine | $ | (14,586,829 | ) | |
Crude salt segment
The sales volume of crude salt decreased by 13% from 316,161 tonnes for the fiscal year 2016 to 274,534 tonnes for the same period in 2017. The average selling price of crude salt increased from $28.42 per tonne for the fiscal year 2016 to $32.73 per tonne for the same period in 2017 an increase of 15%. The major reason for the decrease in the sales volume of crude salt was mainly due to the closure of all of our plant and factories to perform rectification and improvement since September 1, 2017. Some of our local customers were also requested to stop production, which affected our customers’ industries and our sales volume.
The table below shows the changes in the average selling price and changes in the sales volume of crude salt for the fiscal year 2017 from the same period in 2016.
| Fiscal Year | ||||
| Increase in net revenue of crude salt as a result of: | 2017 vs. 2016 | |||
| Increase in average selling price | $ | 1,273,055 | ||
| Decrease in sales volume | $ | (1,272,827 | ) | |
| Total effect on net revenue of crude salt | $ | 228 | ||
15
Chemical products segment
| Product Mix of Chemical Product Segment | ||||||||||||||||||||
| Year Ended | Year Ended | Percent Change | ||||||||||||||||||
| December 31, 2017 | December 31, 2016 | Decrease | ||||||||||||||||||
| Chemical Products | Percent of total | Percent of total | ||||||||||||||||||
| Oil and gas exploration additives | $ | 12,852,210 | 23 | % | $ | 19,914,575 | 24 | % | (35 | %) | ||||||||||
| Paper manufacturing additives | $ | 2,275,236 | 4 | % | $ | 3,456,932 | 4 | % | (34 | %) | ||||||||||
| Pesticides manufacturing additives | $ | 6,953,930 | 12 | % | $ | 11,194,214 | 13 | % | (38 | %) | ||||||||||
| Pharmaceutical intermediates | $ | 24,922,328 | 44 | % | $ | 34,159,589 | 41 | % | (27 | %) | ||||||||||
| By products | $ | 9,307,756 | 17 | % | $ | 14,752,110 | 18 | % | (37 | %) | ||||||||||
| Total sales | $ | 56,311,460 | 100 | % | $ | 83,477,420 | 100 | % | (33 | %) | ||||||||||
Net revenue from our chemical products segment decreased from $83,477,420 for the fiscal year 2016 to $56,311,460 for the same period in 2017, a decrease of approximately 33%. This decrease was primarily attributable to the closure of our chemical factories and being relocated since September 1, 2017. Some of our local customers were also requested to stop production, which affected our customers’ industries and our sales volume. Net revenue from our oil and gas exploration chemicals contributed $12,852,210 (or 23%) and $19,914,575 (or 24%) of our chemical segment revenue for the fiscal year 2017 and 2016, respectively, with a decrease of $7,062,365, or 35%. Net revenue from our paper manufacturing additives decreased from $3,456,932 for the fiscal year 2016 to $2,275,236 for the same period in 2017, a decrease of approximately 34%. Net revenue from our pesticides manufacturing additives decreased from $11,194,214 for the fiscal year 2016 to $6,953,930 for the same period in 2017, a decrease of approximately 38%. Net revenue from our pharmaceutical intermediates decreased from $34,159,589 for the fiscal year 2016 to $24,922,328 for the same period in 2017, a decrease of approximately 27%. Net revenue from our by products was $14,752,110 for the fiscal year 2016 compared to $9,307,756 for the same period in 2016, a decrease of approximately 37%.
The table below shows the changes in the average selling price and changes in the sales volume of major chemical products of SYCI for the fiscal year 2017 from the same period in 2016
| Decrease in net revenue of major chemical products, for fiscal year 2017 vs. 2016, as a result of: | Oil and gas exploration additives | Paper manufacturing additives | Pesticides manufacturing additives | Pharmaceutical intermediates | By products | Total | ||||||||||||||||||
| Increase/(Decrease) in average selling price | $ | 69,512 | $ | (29,744 | ) | $ | 306,042 | $ | 2,768,309 | $ | (62,569 | ) | $ | 3,051,550 | ||||||||||
| Decrease in sales volume | $ | (7,131,877 | ) | $ | (1,151,952 | ) | $ | (4,546,326 | ) | $ | (12,005,570 | ) | $ | (5,381,785 | ) | $ | (30,217,510 | ) | ||||||
| Total effect on net revenue of chemical products | $ | (7,062,365 | ) | $ | (1,181,696 | ) | $ | (4,240,284 | ) | $ | (9,237,261 | ) | $ | (5,444,354 | ) | $ | (27,165,960 | ) | ||||||
Cost of Net Revenue
| Cost of Net Revenue by Segment | ||||||||||||||||||||
| Year Ended | Year Ended | Percent Change | ||||||||||||||||||
| December 31, 2017 | December 31, 2016 | Decrease | ||||||||||||||||||
| Segment | Percent of total | Percent of total | ||||||||||||||||||
| Bromine | $ | 20,991,198 | 33 | % | $ | 30,879,323 | 32 | % | (32 | %) | ||||||||||
| Crude Salt | $ | 4,329,663 | 7 | % | $ | 8,187,291 | 9 | % | (47 | %) | ||||||||||
| Chemical Products | $ | 37,836,229 | 60 | % | $ | 55,719,057 | 59 | % | (32 | %) | ||||||||||
| Total Cost of Net Revenue | $ | 63,157,090 | 100 | % | $ | 94,785,671 | 100 | % | (33 | %) | ||||||||||
16
Cost of net revenue reflects mainly the raw materials consumed and the direct salaries and benefits of staff engaged in the production process, electricity, depreciation and amortization of manufacturing plant and machinery and other manufacturing costs. Our cost of net revenue was $63,157,090 for fiscal year 2017, a decrease of $31,628,581 (or approximately 33%) compared to fiscal year 2016. This decrease was primarily attributable to the closure of all of our plant and factories to perform rectification and improvement since September 1, 2017. Some of our local customers were also requested to stop production, which affected our customers’ industries and our sales volume.
Bromine production capacity and utilization of our factories
The table below represents the annual capacity and utilization ratios for all of our bromine producing properties:
| Annual Production Capacity (in tonnes) |
Utilization Ratio (i) | |||||||
| Fiscal year 2016 | 47,347 | 36% | ||||||
| Fiscal year 2017 | 42,808 | 42% | ||||||
| Variance of the fiscal year 2017 and 2016 | - | 6% | ||||||
(i) Utilization ratio is calculated based on the actual production volume in tonnes for the year divided by the annual production capacity in tonnes.
Our utilization ratio increased by 6% for the fiscal year 2017 as compared with the same period in 2016. The utilization ratio for year 2017 was annualized based on the 8 months actual production. This increase in utilization ratio was mainly due to the demolition Factory No.6 in December 2016, which reduced the total annual production capacity.
In view of the trend of a decrease in the bromine concentration of brine water being extracted at our production facilities, and in order to reduce the leakage rate and attempt to recover the annual production capacity of bromine and crude salt to a higher level in the future, we intend to carry out enhancement works in our existing bromine extraction. The Company expects to carry out enhancement projects for the extraction wells in 2018, which will cost approximately $40 million. We also expect to carry out enhancement projects for the transmission channels and ducts for rectification and improvement in order to meet the new environmental rules in China in 2018, which will costs of approximately $8.5 million.
Bromine segment
For the fiscal year 2017, the cost of net revenue for our bromine segment was $20,991,198, a decrease of $9,888,125 (or 32%) compared to $30,879,323 for the fiscal year 2016. The major components of our cost of net revenue for the bromine segment were cost of raw materials and finished goods consumed of $5,081,097 (or 24%), depreciation and amortization of manufacturing plant and machinery of $9,966,196 (or 47%) and electricity of $2,114,611 (or 10%) for fiscal year 2017. The major components of our cost of net revenue for the bromine segment were cost of raw materials and finished goods consumed of $8,198,333 (or 27%), depreciation and amortization of manufacturing plant and machinery of $14,614,059 (or 47%) and electricity of $2,566,285 (or 8%) for fiscal year 2016, a similar cost structure as compared with the same in 2017. The decrease in net cost of net revenue was mainly attributable to the closure of all of our plant and factories to perform rectification and improvement since September 1, 2017. Some of our local customers were also requested to stop production, which affected our customers’ industries and our sales volume.
The table below represents the major production cost components of bromine per ton sold for the respective periods:
| Year Ended | Year Ended | |||||||||||||||||||
| December 31, 2017 | December 31, 2016 | % Change | ||||||||||||||||||
| Percent of total | Percent of total | |||||||||||||||||||
| Raw materials | $ | 931 | 42 | % | $ | 971 | 42 | % | (4 | %) | ||||||||||
| Depreciation and amortization | $ | 811 | 36 | % | $ | 851 | 37 | % | (5 | %) | ||||||||||
| Electricity | $ | 172 | 8 | % | $ | 149 | 7 | % | 15 | % | ||||||||||
| Others | $ | 308 | 14 | % | $ | 320 | 14 | % | (4 | %) | ||||||||||
| Production cost of bromine per ton | $ | 2,222 | 100 | % | $ | 2,292 | 100 | % | (3 | %) | ||||||||||
17
Crude salt segment
For the fiscal year 2017, the cost of net revenue for our crude salt segment was $4,329,663, representing a decrease of $3,857,628, or 47%, over the same period in 2016. The decrease in cost was mainly due to the decrease in volume of crude salt sold and unit production cost. The decrease in cost was mainly due to the decrease in depreciation and amortization of manufacturing plant and machinery mainly dueto (i) some plant and equipment related to the crude salt and bromine facilities were fully depreciated in June 2016; and (ii) the demolition Factory No.6 in December 2016 for bromine and crude salt segment, which partially offset by the increase in depreciation and amortization of manufacturing plant and machinery due to the enhancement projects carried out for our extraction wells and transmission channels and ducts which commenced in August 2016 and completed in September 2016.The significant costs were depreciation and amortization of $1,801,050 (or 42%), resource tax calculated based on the crude salt sold of $971,819 (or 22%) and electricity of $267,022 (or 6%) for the fiscal year 2017. The significant costs were depreciation and amortization of $5,837,225 (or 71%), resource tax calculated based on the crude salt sold of $919,268 (or 11%) and electricity of $437,453 (or 5%) for the fiscal year 2016. The table below represents the major production cost components of crude salt per ton sold for the respective periods:
| Year Ended | Year Ended | |||||||||||||||||||
| December 31, 2017 | December 31, 2016 | % Change | ||||||||||||||||||
| Percent of total | Percent of total | |||||||||||||||||||
| Depreciation and amortization | $ | 6.6 | 42 | % | $ | 18.5 | 70 | % | (64 | %) | ||||||||||
| Resource tax | $ | 3.5 | 22 | % | $ | 2.9 | 13 | % | (22 | %) | ||||||||||
| Electricity | $ | 1.0 | 6 | % | $ | 1.4 | 6 | % | (30 | %) | ||||||||||
| Others | $ | 4.7 | 30 | % | $ | 3.1 | 11 | % | 50 | % | ||||||||||
| Production cost of crude salt per ton | $ | 15.8 | 100 | % | $ | 25.9 | 100 | % | (39 | %) | ||||||||||
Chemical products segment
For the fiscal year 2017, the cost of net revenue for our chemical products segment was $37,836,229, representing a decrease of $17,882,828, or 32%, over the same period in 2016. This decrease was primarily attributable to the closure of our chemical factories and being relocated since September 1, 2017. Some of our local customers were also requested to stop production, which affected our customers’ industries and our sales volume.
Gross Profit. Gross profit was $44,365,351, or 41%, of net revenue for fiscal year 2017 as compared to $54,489,331, or 37%, of net revenue for fiscal year 2016.
| Gross Profit by Segment | % Point | |||||||||||||||||||
| Year Ended | Year Ended | Change of | ||||||||||||||||||
| December 31, 2017 | December 31, 2016 | Gross Profit | ||||||||||||||||||
| Segment | Percent of Net Revenue | Percent of Net Revenue | ||||||||||||||||||
| Bromine | $ | 21,233,703 | 50 | % | $ | 25,932,407 | 46 | % | 4 | % | ||||||||||
| Crude Salt | $ | 4,656,417 | 52 | % | $ | 798,561 | 9 | % | 43 | % | ||||||||||
| Chemical Products | $ | 18,475,231 | 33 | % | $ | 27,758,363 | 33 | % | — | |||||||||||
| Total Gross Profit | $ | 44,365,351 | 41 | % | $ | 54,489,331 | 37 | % | 4 | % | ||||||||||
18
Bromine segment
For the fiscal year 2017, the gross profit margin for our bromine segment was 50%, as compared to 46% for the fiscal year 2016. This 4% increase is mainly due to the increased average selling price and the decrease in the purchase price of raw material and the decrease in depreciation and amortization of manufacturing plant and machinery mainly due to (i) some plant and equipment related to the crude salt and bromine facilities were fully depreciated in June 2016; and (ii) the demolition Factory No.6 in December 2016 for bromine and crude salt segment, which partially offset by the increase in depreciation and amortization of manufacturing plant and machinery due to the enhancement projects carried out for our extraction wells and transmission channels and ducts which commenced in August 2016 and completed in September 2016 .
Crude salt segment
For the fiscal year 2017, the gross profit margin for our crude salt segment was 52% as compared to 9% for the same period in 2016. This 43% increase is mainly due to the increase in crude salt price and decrease in depreciation and amortization of manufacturing plant and machinery as mentioned in cost of net revenue of crude salt.
Chemical products segment
The gross profit margin for our chemical products segment for the fiscal year 2017 was 33% as compared to 33% for the same period in 2016.
Research and Development Costs The total research and development costs incurred for the fiscal years 2017 and 2016 were $195,195 and $261,931, respectively, a decrease of 25%. Research and development costs for the fiscal year 2017 represented raw materials used by SYCI for testing the manufacturing routine. Research and development costs for the fiscal year 2016 represented raw materials used by SYCI and SCRC for testing the manufacturing routine.
Direct labor and factory overheads incurred during plant shutdown On September 1, 2017, the Company received notification from the government of Yangkou County, Shouguang City of PRC that production at all its factories be halted with immediate effect in order for the Company to perform rectification and improvement in accordance with the county’s new safety and environmental protection requirements. As such, direct labor and factory overhead costs (including depreciation of plant and machinery) of a total amount of $6,883,557 incurred from September 2017 to December 2017 which would have been presented in the cost of net revenue were presented as expense for production from previous cost in production in the fiscal year, 2017.
Write-off/Impairment on property, plant and equipment. Write-off and impairment loss on property, plant and equipment for the fiscal year 2017 and 2016 were $17,581,244 and $106,545, respectively, an increase of 16,401%. Write-off and impairment loss on property, plant and equipment of $17,581,244 for the fiscal year 2017 represented (i) the impairment loss on property, plant and equipment related to the transmission channels and ducts in fiscal year 2017 in the amount of $216,182; (ii) the impairment loss on property, plant and equipment related to the relocation of our chemical production plant to Bohai Marine Fine Chemical Industry Park in the amount of $16,636,322; and (iii) write-off certain protective shells to crude salt fields of $619,112 during the enhancement project that started in November 2017 and was completed in December 2017; and (vi) the write-off $109,628 due to part of the Factory construction equipment not meeting the government's safety and environmental standards. Write-off on property, plant and equipment of $106,545 for the fiscal year 2016 represented the write-off of (i) certain protective shells to transmission pipelines and ducts replaced was $90,395 during the enhancement project that started in August 2016 and was completed in September 2016; and (ii) certain machinery and equipment replaced during the enhancement work to our bromine production facilities in Factory No. 7 of $16,150.
General and Administrative Expenses. General and administrative expenses were $8,536,757 for the fiscal year 2017, an increase of $3,102,002 (or 57%) as compared to $5,434,755 for the same period in 2016. The increase was primarily due to (i) the unrealized exchange loss in relation to the translation difference of inter-company balances in USD and RMB for the fiscal year 2017 in the amount of $1,557,759, as compared to the unrealized exchange gain for the same period in 2016 in the amount of $1,702,728; (ii) a non-cash expense related to stock options granted to employees increased from $40,300 for the fiscal year 2016 to $372,400 for the same period of 2017.
Other Operating Income. Other operating income was $281,613 for the fiscal year 2017, a decrease of $152,179(or 35%) as compared to $433,792 for the same period in 2016 for sales of wastewater. Wastewater is generated from the production of bromine and eventually becomes crude salt when it evaporates. Not all of our bromine production plants have sufficient area on the property to allow for evaporation of wastewater to produce crude salt. Certain of our customers who have facilities located adjacent to our bromine production plants have agreed to allow us to channel our wastewater into brine pans on their properties for evaporation. These customers then are able to sell the resulting crude salt themselves. We signed agreements with four of our customers to sell them our wastewater at market prices.
19
Income from Operations. Income from operations was $11,171,611 for the fiscal year 2017 (or 10% of net revenue), a decrease of $36,551,731 (or approximately 77%) over income from operations for the fiscal year 2016.
| Income from Operations by Segment | ||||||||||||||||
| Year ended December 31, 2017 | Year ended December 31, 2016 | |||||||||||||||
| Segment: | % of total | % of total | ||||||||||||||
| Bromine | $ | 12,460,230 | 90 | % | $ | 21,224,862 | 45 | % | ||||||||
| Crude Salt | $ | 2,426,137 | 18 | % | $ | 9,076 | — | % | ||||||||
| Chemical Products | $ | (1,024,569 | ) | (7 | %) | $ | 25,473,792 | 55 | % | |||||||
| Natural Gas | $ | (116,465 | ) | (1 | %) | $ | (4,906 | ) | — | |||||||
| Income from operations before corporate costs | $ | 13,745,333 | 100 | % | $ | 46,702,824 | 100 | % | ||||||||
| Corporate costs | $ | (1,015,963 | ) | $ | (682,210 | ) | ||||||||||
| Unrealized translation difference | $ | (1,557,759 | ) | $ | 1,702,728 | |||||||||||
| Income from operations | $ | 11,171,611 | $ | 47,723,342 | ||||||||||||
Bromine segment
Income from operations from our bromine segment was $12,460,230 for the fiscal year 2017, a decrease of $8,764,632 (or approximately 41%) compared to the same period in 2016. This decrease was mainly due to the closure of all of our plant and factories to perform rectification and improvement since September 1, 2017. Some of our local customers were also requested to stop production, which affected our customers’ industries and our sales volume.
20
Crude salt segment
Income from operations from our crude salt segment was $2,426,137 for the fiscal year 2017, an increase of $2,417,061 (or approximately 26631%) as compared to the same period in 2016. This increase is mainly attributable to increased selling price of crude salt and the decrease in depreciation and amortization of manufacturing plant and machinery as mentioned in cost of net revenue of crude salt.
Chemical products segment
Loss from operations from our chemical products segment was $1,024,569 for the fiscal year 2017, compared to an income of $25,473,792 recorded in the same period in 2016. This was mainly due to (i) the closure of our chemical factories and being relocated since September 1, 2017. Some of our local customers were also requested to stop production, which affected our customers’ industries and our sales volume; and (ii) the impairment loss on property, plant and equipment related to the relocation of our chemical production plant to Bohai Marine Fine Chemical Industry Park.
Other Income, Net. Other income, net, which represent bank interest income, net of capital lease interest expense was $391,842 for the fiscal year 2017, an increase of $79,146 (or approximately 25%) as compared to the same period in 2016.
Net Income(Restated). Net income was $7,953,313 for the fiscal year 2017, a decrease of $28,272,518 (or approximately 78%) as compared to the same period in 2016. This decrease was mainly due to (i) the closure of all of our plant and factories to perform rectification and improvement and relocation since September 1, 2017. Some of our local customers were also requested to stop production, which affected our customers’ industries and our sales volume; and (ii) the impairment loss on property, plant and equipment related to the relocation of our chemical production plant to Bohai Marine Fine Chemical Industry Park.
Effective Tax Rate(Restated). Our effective tax rates for the fiscal years 2017 and 2016 were 31% and 25%, respectively. The effective tax rate of 31% for the fiscal year 2017 differs from the PRC statutory income tax rate of 25% mainly due to non-deductible item in connection with the unrealized exchange loss. The effective tax rate of 25% for the fiscal year 2016 is consistent with the PRC statutory income tax rate.
LIQUIDITY AND CAPITAL RESOURCES
As of December 31, 2017, cash and cash equivalents were $208,906,759 as compared to $163,884,574 as of December 31, 2016. The components of this increase of $45,022,185 are reflected below.
| Statement of Cash Flows | ||||||||
| Years Ended December 31 | ||||||||
| 2017 | 2016 | |||||||
| Net cash provided by operating activities | $ | 62,751,616 | $ | 55,216,598 | ||||
| Net cash used in investing activities | $ | (28,419,975 | ) | $ | (14,961,379 | ) | ||
| Net cash used in financing activities | $ | (273,873 | ) | $ | (287,387 | ) | ||
| Effects of exchange rate changes on cash and cash equivalents | $ | 10,964,417 | $ | (9,689,650 | ) | |||
| Net cash inflow | $ | 45,022,185 | $ | 30,278,182 | ||||
For the fiscal years 2017 and 2016, we met our working capital and capital investment requirements mainly by using cash flows from operations and cash on hand.
Net Cash Provided by Operating Activities (Restated)
During the years ended December 31, 2017 and 2016, we had positive cash flow from operating activities of approximately $62.8 million and $55.2 million respectively, primarily attributable to net income.
21
During the year ended December 31, 2017, cash flow from operating activities of approximately $62.8 million exceeded our net income of approximately $8.0 million due to non-cash charges in the amount of approximately $36.7 million, mainly in the form of depreciation and amortization of property, plant and equipment, property, plant and equipment impairment and exchange loss on intercompany balances; and cash used in working capital of approximately $18.0 million, which mainly consisted of a decrease in accounts receivable and inventories and partially offset by the increase in prepayment and deposit and decrease in accounts payable and accrued expenses and taxes payable.
During the year ended December 31, 2016, cash flow from operating activities of approximately $55.2 million exceeded our net income of approximately $36.2 million due to non-cash charges in the amount of approximately $25.3 million, mainly in the form of depreciation and amortization of property, plant and equipment, exchange loss on intercompany balances and loss on demolition of factory; partially offset cash used in working capital of approximately $6.4 million, which mainly consisted of an increase in accounts receivable and a decrease in accounts payable and accrued expenses and retention payable, partially offset by the decrease in inventories.
Accounts receivable
Cash collections on our accounts receivable had a major impact on our overall liquidity. The following table presents the aging analysis of our accounts receivable as of December 31, 2017 and 2016.
| December 31, 2017 | December 31, 2016 | |||||||||||||||
| % of total | % of total | |||||||||||||||
| Aged 1-30 days | $ | 1,955,296 | 7 | % | $ | 10,300,739 | 20 | % | ||||||||
| Aged 31-60 days | $ | 1,284,013 | 4 | % | $ | 11,074,573 | 21 | % | ||||||||
| Aged 61-90 days | $ | 692,781 | 2 | % | $ | 10,577,810 | 21 | % | ||||||||
| Aged 91-120 days | $ | 2,675,960 | 9 | % | $ | 7,919,209 | 15 | % | ||||||||
| Aged 121-150 days | $ | 8,783,405 | 30 | % | $ | 6,924,979 | 13 | % | ||||||||
| Aged 151-180 days | $ | 5,079,545 | 17 | % | $ | 5,037,908 | 10 | % | ||||||||
| Aged 181-210days | $ | 5,983,997 | 20 | % | $ | — | — | |||||||||
| Aged 211-240 days | $ | 3,310,887 | 11 | % | $ | — | — | |||||||||
| Total | $ | 29,765,884 | 100 | % | $ | 51,835,218 | 100 | % | ||||||||
The overall accounts receivable balance as of December 31, 2017 decreased by $22,069,334 (or 43%), as compared to those as of December 31, 2016. Such decrease is mainly attributable to the closure of all of our plant and factories to perform rectification and improvement since September 1, 2017. In fiscal year 2016, a 90 to 180-day credit period was granted to customers with good payment history. To maintain the source of the Company’s business and in view of the strong cash flow position that the Company is in, management has extended credit terms to some customers up to 240 days in the fiscal year 2017. Approximately 66% of the balances of accounts receivable as of December 31, 2017 more than 90 days in the amount of $16,967,786 was settled by February 28, 2018. We have policies in place to ensure that sales are made to customers with an appropriate credit history and we perform ongoing credit evaluation on the financial condition of our customers.
Some of our customers’ production is also affected by the new safety and environmental protection rules. We have communicated with our customers who have stopped their production for inspection by the government and have not resumed production. They confirmed that they will make payments owing to our Company on time. Based on our knowledge of these customers, they appear to have the ability to settle the accounts receivable as of December 31, 2017 within the credit term. Therefore, we believe that no allowance for doubtful debts accounts for the fiscal year 2017 is required.
Inventory
Our inventory consists of the following:
| December 31, 2017 | December 31, 2016 | |||||||||||||||
| Percent of total | Percent of total | |||||||||||||||
| Raw materials | $ | 396,482 | 33 | % | $ | 818,500 | 14 | % | ||||||||
| Finished goods | $ | 844,224 | 71 | % | $ | 4,370,331 | 74 | % | ||||||||
| Work-in-process | $ | — | — | $ | 692,850 | 12 | % | |||||||||
| 1,240,706 | 104 | % | 5,881,681 | 100 | % | |||||||||||
| Allowance for obsolete and slowing-moving inventory | $ | (43,921 | ) | (4 | %) | $ | — | — | ||||||||
| Total | $ | 1,196,785 | 100 | % | $ | 5,881,681 | 100 | % | ||||||||
22
The net inventory levels as of December 31, 2017 decreased by $4,684,896 (or 80%), as compared to the net inventory levels as of December 31, 2016.
Raw materials decreased by 52% as of December 31, 2017 as compared to December 31, 2016. All of the raw materials are basic chemical industry materials, few of which have a possibility of loss over time, or major fluctuations in their prices. As SYCI was required by the government to relocate the factory and our new factory was estimated to be in operation in 2 years as the most conservative target, we made an allowance for obsolete inventory of $43,921. We concluded that all of our raw materials for SCHC as of December 31, 2017 are fully realizable for production of finished goods without any impairment. We sold raw materials in amount of $357,518 due to our chemical factory relocation in Jan 2018.
Our finished goods consist of bromine, crude salt and chemical products. Our chemical products are similar to raw materials. There is no loss over time and a stable market price exists with a positive gross profit margin of 33% for the fiscal year 2017 (33% for fiscal year 2016). Therefore, we believe that the realization of the chemical products is 100%. We sold finished goods in amount of $1,899,910 in Jan 2018. There is no bromine in stock at the end of the fiscal year 2017.
As of December 31, 2017, the crude salt included in the inventory is approximately $0.7 million. The annual loss of crude salt due to evaporation is approximately 3%. The average selling price of crude salt per tonne increased from $28.42 for the fiscal year 2016 to $32.73 for the same period in 2017. In the same period, gross profit also increased from 9% for the fiscal year 2016 to 52% for the same period in 2017. We believe that there will be no realization problem for crude salt as we do not expect selling price to be lower than the current price.
Net Cash Used In Investing Activities
In the fiscal year 2017, we used approximately $10.5 million cash for the prepayment of land leases. In the same period, we also used approximately $17.9 million cash to carry out enhancement projects to our crude salt fields and enhancement for meet the government's safety and environmental standards.
In the fiscal year 2016, we used approximately $0.7 million cash for the prepayment of land leases. In the same period, we also used approximately $15.23 million cash to carry out enhancement projects to our existing bromine extraction and crude salt production facilities and $1.74 million cash for the construction of roads and related infrastructure needed to begin operations in the remote and mountainous region of Daying county.
The above investing activities were financed by the opening cash balances as of December 31, 2016 and cash generated from operation during the fiscal year 2017.
Net Cash Used In Financing Activities
We repaid approximately $0.3 million cash for our capital lease obligation for the fiscal year 2017 and 2016.
We believe that our available funds and cash flows generated from operations will be sufficient to meet our anticipated ongoing operating needs for the next twelve months.
Working capital was approximately $247.8 million at December 31, 2017 as compared to approximately $207.8 million at December 31, 2016. The increase was mainly attributable to the cash provided by operating activities during the fiscal year 2017.
23
We had available cash of approximately $208.9 million at December 31, 2017, most of which is in highly liquid current deposits which earn no or little interest. We intend to retain the cash for the rectification and improvements of our bromine and crude salt factories, the relocation of our chemical factories (See note 1(b) in the notes to the consolidated financial statements), future expansion of our bromine and crude salt businesses through acquisition, enhancements to our existing bromine and crude salt business, and further development of the new resources in Sichuan Province. We do not anticipate paying cash dividends in the foreseeable future. As of February 28, 2018, we have cash of approximately $223.1 million and believe that there is enough funds to cover the rectification and improvement, the setting up of the new chemical factory and the operating expense of the Company during the rectification and relocation period.
In the future we intend to focus our efforts on the activities of SCHC, SYCI and DCHC as these segments continue to expand within the Chinese market.
We may not be able to identify, successfully integrate or profitably manage any businesses or business segment we may acquire, or any expansion of our business. An expansion may involve a number of risks, including possible adverse effects on our operating results, diversion of management’s attention, inability to retain key personnel, risks associated with unanticipated events and the consolidated financial statement effect of potential impairment of acquired intangible assets, any of which could have a materially adverse effect on our condition and results of operations. In addition, if competition for acquisition candidates or operations were to increase, the cost of acquiring businesses could increase materially. We may effect an acquisition with a target business which may be financially unstable, under-managed, or in its early stages of development or growth. Our inability to implement and manage our expansion strategy successfully may have a material adverse effect on our business and future prospects.
Contractual Obligations and Commitments
We have no significant contractual obligations not fully recorded on our consolidated balance sheets or fully disclosed in the notes to our consolidated financial statements. Additional information regarding our contractual obligations and commitments at December 31, 2017 is provided in the notes to our consolidated financial statements. See “Notes to Consolidated Financial Statements, Note 18 - Capital Commitment and Operating Lease Commitments.”
Material Off-Balance Sheet Arrangements
We do not currently have any off-balance sheet arrangements falling within the definition of Item 303(a) of Regulation S-K.
Critical Accounting Policies and Estimates
Our Consolidated Financial Statements are prepared in accordance with accounting principles generally accepted in the United States of America (U.S. GAAP), which requires us to make judgments, estimates and assumptions. See “Note 1 – Nature of Business and Summary of Significant Accounting Policies,” in Notes to the Consolidated Financial Statements, which is included in “Item 8. Financial Statements and Supplementary Data,” which describes our significant accounting policies and methods used in the preparation of our Consolidated Financial Statements. The methods, estimates and judgments that we use in applying our accounting policies require us to make difficult and subjective judgments, often as a result of the need to make estimates regarding matters that are inherently uncertain.
24
Our most critical estimates include:
• allowance for doubtful accounts, which impacts revenue;
• the valuation of inventory, which impacts gross margins;
• impairment of long-lived assets;
• the valuation and recognition of share-based compensation, which impacts operating expenses; and
• the recognition and measurement of deferred income taxes, which impact our provision for taxes.
Allowance for Doubtful Accounts
We makes estimates of the uncollectibility of accounts receivable, especially analyzing accounts receivable and historical bad debts, customer concentrations, customer credit-worthiness, current economic trends and changes in customer payment terms, when evaluating the adequacy of the allowance for doubtful accounts. Credit evaluations are undertaken for all major sale transactions before shipment is authorized. On a quarterly basis, we evaluate aged items in the accounts receivable aging report and provide an allowance in an amount we deem adequate for doubtful accounts. If management were to make different judgments or utilize different estimates, material differences in the amount of our reported operating expenses could result.
Inventory Valuation
Inventory is stated at the lower of cost or market, with cost determined on a first-in first-out basis. The carrying value of inventory is reduced for estimated obsolescence by the difference between its cost and the estimated market value based upon assumptions about future demand. We evaluate the inventory carrying value for potential excess and obsolete inventory exposures by analyzing historical and anticipated demand. If actual future demand or market conditions are less favorable than those projected by management, additional inventory write-downs may be required in the future, which could have a material adverse effect on our results of operations.
Depreciation of Property, Plant and Equipment
Property, plant and equipment are stated at cost less accumulated depreciation and any impairment losses. Expenditures for new facilities or equipment, and major expenditures for betterment of existing facilities or equipment are capitalized and depreciated using the straight-line method at rates sufficient to depreciate such costs over the estimated productive lives. All other ordinary repair and maintenance costs are expensed as incurred. Mineral rights are recorded at cost less accumulated depreciation and any impairment losses. Mineral rights are amortized ratably over the term of the lease, or the equivalent term under the units of production method, whichever is shorter. In some situations, the life of the asset may be extended or shortened if circumstances arise that would lead us to believe that the estimated life of the asset has changed. The life of leasehold improvements may change based on the extension of lease contracts with our landlords. Changes in the estimated lives of assets will result in an increase or decrease in the amount of depreciation recognized in future periods.
Impairment of Long Lived Assets
We periodically evaluate whether events or circumstances have occurred that indicate long-lived assets may not be recoverable or that the remaining useful life may warrant revision. When such events or circumstances are present, we assess the recoverability of long-lived assets by determining whether the carrying value will be recovered through the expected undiscounted future cash flows resulting from the use of the asset. In the event the sum of the expected undiscounted future cash flows is less than the carrying value of the asset, an impairment loss equal to the excess of the asset’s carrying value over its fair value is recorded.
Valuation Allowance on Deferred Tax Assets
We evaluate our deferred income tax assets to determine if valuation allowances are required or should be adjusted. A valuation allowance is established against our deferred tax assets based on consideration of all available evidence, both positive and negative, using a “more likely than not” standard. This assessment considers, among other matters, the nature, frequency and severity of recent losses, forecasts of future profitability, the duration of statutory carry forward periods, our experience with expiring unused tax attributes and tax planning alternatives. In making such judgments, significant weight is given to evidence that can be objectively verified.
25
Stock-based compensation
We account for stock-based compensation in accordance with the fair value recognition provisions of U.S. GAAP. We use the Black-Scholes model which requires the input of highly subjective assumptions. These assumptions include estimating the length of time employees will retain their vested stock options before exercising them, the estimated volatility of our common stock price over the expected term and the number of options that will ultimately not complete their vesting requirements. The assumptions for expected volatility and expected term are the two assumptions that significantly affect the grant date fair value. Changes in expected risk-free rate of return do not significantly impact the calculation of fair value, and determining this input is not highly subjective.
We use annualized historical stock price volatility which is deemed to be appropriate to serve as the expected volatility of our stock price and is assumed to be constant and prevailing. The expected term represents the weighted-average period that our stock options are expected to be outstanding. The expected life is based on historical option exercise pattern.
Recent Accounting Pronouncements
See “Note 1 – Nature of Business and Summary of Significant Accounting Policies” of the Notes to Consolidated Financial Statements in Item 8. Financial Statements and Supplementary Data for a full description of recent accounting pronouncements including the respective expected dates of adoption and effects on Consolidated Balance Sheets and Consolidated Statements of Income.
Item 8. Financial Statements and Supplementary Data
The financial statements and supplementary data required by this item are included in a separate section of this Report. See “Index to Consolidated Financial Statements” on Page F-1.
26
GULF RESOURCES, INC.
AND SUBSIDIARIES
CONSOLIDATED FINANCIAL STATEMENTS
DECEMBER 31, 2017 and 2016
C O N T E N T S
| PAGE | |
| REPORT OF INDEPENDENT REGISTERED PUBLIC ACCOUNTING FIRMS | F-2 |
| CONSOLIDATED BALANCE SHEETS | F-3 |
| CONSOLIDATED STATEMENTS OF INCOME AND COMPREHENSIVE INCOME | F-4 |
| CONSOLIDATED STATEMENTS OF STOCKHOLDERS' EQUITY | F-5 |
| CONSOLIDATED STATEMENTS OF CASH FLOWS | F-6 – F-7 |
| NOTES TO CONSOLIDATED FINANCIAL STATEMENTS | F-8 – F-26 |
| FINANCIAL STATEMENT SCHEDULE: | |
| SCHEDULE I – PARENT ONLY FINANCIAL INFORMATION | S-1 – S-2 |
F-1
REPORT OF INDEPENDENT REGISTERED PUBLIC ACCOUNTING FIRM
To the Board of Directors and
Stockholders of Gulf Resources, Inc. and Subsidiaries
Opinion on the Financial Statements
We have audited the accompanying consolidated balance sheets of Gulf Resources, Inc. and Subsidiaries (the Company) as of December 31, 2017 and 2016, and the related consolidated statements of income and comprehensive income, changes in stockholders’ equity, and cash flows for each of the years in the two-year period ended December 31, 2017, and the related notes and schedules (collectively referred to as the consolidated financial statements). In our opinion, the consolidated financial statements present fairly, in all material respects, the financial position of the Company as of December 31, 2017 and 2016, and the results of its operations and its cash flows for each of the years in the two-year period ended December 31, 2017, in conformity with accounting principles generally accepted in the United States of America.
Restatement of 2017 consolidated financial statements
As discussed in Note 2 to the consolidated financial statements, the accompanying December 31, 2017 consolidated financial statements have been restated to correct misstatements related to the one-time mandatory federal transition tax on accumulated foreign earnings.
Basis for Opinion
These consolidated financial statements are the responsibility of the Company’s management. Our responsibility is to express an opinion on the Company’s consolidated financial statements based on our audits. We are a public accounting firm registered with the Public Company Accounting Oversight Board (United States) (PCAOB) and are required to be independent with respect to the Company in accordance with the U.S. federal securities laws and the applicable rules and regulations of the Securities and Exchange Commission and the PCAOB.
We conducted our audits in accordance with the standards of the PCAOB. Those standards require that we plan and perform the audit to obtain reasonable assurance about whether the consolidated financial statements are free of material misstatement, whether due to error or fraud. The Company is not required to have, nor were we engaged to perform, an audit of its internal control over financial reporting. As part of our audits, we are required to obtain an understanding of internal control over financial reporting, but not for the purpose of expressing an opinion on the effectiveness of the Company’s internal control over financial reporting. Accordingly, we express no such opinion.
Our audits included performing procedures to assess the risks of material misstatement of the consolidated financial statements, whether due to error or fraud, and performing procedures that respond to those risks. Such procedures included examining, on a test basis, evidence regarding the amounts and disclosures in the consolidated financial statements. Our audits also included evaluating the accounting principles used and significant estimates made by management, as well as evaluating the overall presentation of the consolidated financial statements. We believe that our audits provide a reasonable basis for our opinion.
/s/ Morison Cogen LLP
We have served as the Company’s auditor since 2011.
Blue Bell, Pennsylvania
March 16, 2018 (except for the effects of the restatement described in Note 2, to which the date is November 9, 2018).
F-2
| GULF RESOURCES, INC. | |
| AND SUBSIDIARIES | |
| CONSOLIDATED BALANCE SHEETS | |
| (Expressed in U.S. dollars) |
| As of December 31, | ||||||||
| 2017 Restated | 2016 | |||||||
| Current Assets | ||||||||
| Cash | $ | 208,906,759 | $ | 163,884,574 | ||||
| Accounts receivable | 29,765,884 | 51,835,218 | ||||||
| Inventories, net | 1,196,785 | 5,881,681 | ||||||
| Prepayments and deposits | 1,395,289 | 117,338 | ||||||
| Prepaid land leases | 246,640 | 47,255 | ||||||
| Other receivables | 2,089 | 1,424 | ||||||
| Total Current Assets | 241,513,446 | 221,767,490 | ||||||
| Non-Current Assets | ||||||||
| Property, plant and equipment, net | 95,114,504 | 108,731,126 | ||||||
| Property, plant and equipment under capital leases, net | 492,238 | 554,257 | ||||||
| Prepaid land leases, net of current portion | 14,477,771 | 4,754,169 | ||||||
| Deferred tax assets | 6,526,555 | 2,215,772 | ||||||
| Goodwill | 29,374,909 | 27,668,539 | ||||||
| Total non-current assets | 145,985,977 | 143,923,863 | ||||||
| Total Assets | $ | 387,499,423 | $ | 365,691,353 | ||||
| Liabilities and Stockholders’ Equity | ||||||||
| Current Liabilities | ||||||||
| Accounts payable and accrued expenses | $ | 1,032,083 | $ | 8,682,318 | ||||
| Retention payable | 956,351 | 733,869 | ||||||
| Capital lease obligation, current portion | 203,206 | 187,678 | ||||||
| Taxes payable-current | 1,041,592 | 4,341,331 | ||||||
| Total Current Liabilities | 3,233,232 | 13,945,196 | ||||||
| Non-Current Liabilities | ||||||||
| Capital lease obligation, net of current portion | 2,303,995 | 2,284,959 | ||||||
| Total non-Current Liabilities | 2,303,995 | 2,284,959 | ||||||
| Total Liabilities | $ | 5,537,227 | $ | 16,230,155 | ||||
| Stockholders’ Equity | ||||||||
| PREFERRED STOCK; $0.001 par value; 1,000,000 shares authorized; none outstanding | $ | — | $ | — | ||||
| COMMON STOCK; $0.0005 par value; 80,000,000 shares authorized; 47,052,940 and 47,052,940 shares issued; and 46,803,791 and 46,793,791 shares outstanding as of December 31, 2017 and 2016, respectively | 23,525 | 23,525 | ||||||
| Treasury stock; 249,149 and 259,149 shares as of December 31, 2017 and 2016 | (554,870 | ) | (577,141 | ) | ||||
| Additional paid-in capital | 94,524,608 | 94,156,679 | ||||||
| Retained earnings unappropriated | 255,572,431 | 248,941,696 | ||||||
| Retained earnings appropriated | 24,233,544 | 22,910,966 | ||||||
| Accumulated other comprehensive income(loss) | 8,162,958 | (15,994,527 | ) | |||||
| Total Stockholders’ Equity | 381,962,196 | 349,461,198 | ||||||
| Total Liabilities and Stockholders’ Equity | $ | 387,499,423 | $ | 365,691,353 | ||||
The accompanying notes are an integral part of these consolidated financial statements.
F-3
| GULF RESOURCES, INC. |
| AND SUBSIDIARIES |
| CONSOLIDATED STATEMENTS OF INCOME AND COMPREHENSIVE INCOME |
| (Expressed in U.S. dollars) |
| Years Ended December 31, | ||||||||
| 2017 Restated | 2016 | |||||||
| NET REVENUE | ||||||||
| Net revenue | $ | 107,522,441 | $ | 149,275,002 | ||||
| OPERATING INCOME (EXPENSE) | ||||||||
| Cost of net revenue | (63,157,090 | ) | (94,785,671 | ) | ||||
| Sales, marketing and other operating expenses | (278,600 | ) | (343,105 | ) | ||||
| Research and development cost | (195,195 | ) | (261,931 | ) | ||||
| Write-off / Impairment on property, plant and equipment | (17,581,244 | ) | (106,545 | ) | ||||
| Loss on demolition of factory | — | (1,053,445 | ) | |||||
| Direct labor and factory overheads incurred during plant shutdown | (6,883,557 | ) | — | |||||
| General and administrative expenses | (8,536,757 | ) | (5,434,755 | ) | ||||
| Other operating income | 281,613 | 433,792 | ||||||
| (96,350,830 | ) | (101,551,660 | ) | |||||
| INCOME FROM OPERATIONS | 11,171,611 | 47,723,342 | ||||||
| OTHER INCOME (EXPENSE) | ||||||||
| Interest expense | (164,321 | ) | (174,921 | ) | ||||
| Interest income | 556,163 | 487,617 | ||||||
| 391,842 | 312,696 | |||||||
| INCOME BEFORE INCOME TAXES | 11,563,453 | 48,036,038 | ||||||
| INCOME TAXES | (3,610,140 | ) | (11,810,207 | ) | ||||
| NET INCOME | $ | 7,953,313 | $ | 36,225,831 | ||||
| COMPREHENSIVE INCOME | ||||||||
| NET INCOME | 7,953,313 | 36,225,831 | ||||||
| OTHER COMPREHENSIVE INCOME (LOSS) | ||||||||
| - Foreign currency translation adjustments | 24,157,485 | (24,930,808 | ) | |||||
| COMPREHENSIVE INCOME | $ | 32,110,798 | $ | 11,295,023 | ||||
| EARNINGS PER SHARE | ||||||||
| BASIC | $ | 0.17 | $ | 0.78 | ||||
| DILUTED | $ | 0.17 | $ | 0.78 | ||||
| WEIGHTED AVERAGE NUMBER OF SHARES | ||||||||
| BASIC | 46,796,476 | 46,279,033 | ||||||
| DILUTED | 46,835,830 | 46,625,663 | ||||||
The accompanying notes are an integral part of these consolidated financial statements.
F-4
GULF RESOURCES, INC.
AND SUBSIDIARIES
CONSOLIDATED STATEMENTS OF STOCKHOLDERS’ EQUITY
YEARS ENDED DECEMBER 31, 2017 AND 2016
(Expressed in U.S. dollars)
| Common stock | Accumulated | |||||||||||||||||||||||||||||||||||||||
| Number | Number | Number | Additional | Retained | Retained | other | ||||||||||||||||||||||||||||||||||
| of shares | of shares | of treasury | Treasury | paid-in | earnings | earnings | comprehensive | |||||||||||||||||||||||||||||||||
| issued | outstanding | stock | Amount | stock | capital | unappropriated | appropriated | Income(loss) | Total | |||||||||||||||||||||||||||||||
| (Restated) | (Restated) | |||||||||||||||||||||||||||||||||||||||
BALANCE AT JANUARY 1, 2016 | 46,276,269 | 46,007,120 | 269,149 | 23,139 | $ | (599,441 | ) | $ | 94,124,065 | $ | 215,286,395 | $ | 20,340,436 | $ | 8,936,281 | $ | 338,110,875 | |||||||||||||||||||||||
| Translation adjustment | - | — | — | — | — | — | — | — | (24,930,808 | ) | (24,930,808 | ) | ||||||||||||||||||||||||||||
| Common stock issued | 10,000 | (10,000 | ) | 22,300 | (7,300 | ) | — | — | — | 15,000 | ||||||||||||||||||||||||||||||
| Cashless exercise of stock options | 776,671 | 776,671 | — | 386 | — | (386 | ) | — | — | — | — | |||||||||||||||||||||||||||||
| Issuance of stock options to employees and director | — | — | — | — | — | 40,300 | — | — | — | 40,300 | ||||||||||||||||||||||||||||||
Net income for year ended December 31, 2016 | — | — | — | — | — | — | 36,225,831 | — | — | 36,225,831 | ||||||||||||||||||||||||||||||
| Transfer to statutory common reserve fund | — | — | — | — | — | — | (2,570,530 | 2,570,530 | — | — | ||||||||||||||||||||||||||||||
BALANCE AT DECEMBER 31, 2016 | 47,052,940 | 46,793,791 | 259,149 | 23,525 | $ | (577,141 | ) | $ | 94,156,679 | $ | 248,941,696 | $ | 22,910,966 | $ | (15,994,527 | ) | $ | 349,461,198 | ||||||||||||||||||||||
BALANCE AT JANUARY 1, 2017 | 47,052,940 | 46,793,791 | 259,149 | 23,525 | $ | (577,141 | ) | $ | 94,156,679 | $ | 248,941,696 | $ | 22,910,966 | $ | (15,994,527 | ) | $ | 349,461,198 | ||||||||||||||||||||||
| Translation adjustment | — | — | — | — | — | — | — | 24,157,485 | 24,157,485 | |||||||||||||||||||||||||||||||
| Common stock issued | — | 10,000 | (10,000 | ) | — | 22,271 | (4,471 | ) | — | — | — | 17,800 | ||||||||||||||||||||||||||||
Issuance of stock options to employees and directors | — | — | — | — | — | 372,400 | — | — | — | 372,400 | ||||||||||||||||||||||||||||||
Net income for year ended December 31, 2017 (Restated) | — | — | — | — | — | — | 7,953,313 | — | — | 7,953,313 | ||||||||||||||||||||||||||||||
| Transfer to statutory common reserve fund | — | — | — | — | — | — | (1,322,578 | ) | 1,322,578 | — | — | |||||||||||||||||||||||||||||
BALANCE AT DECEMBER 31, 2017 (Restated) | 47,052,940 | 46,803,791 | 249,149 | 23,525 | $ | (554,870 | ) | $ | 94,524,608 | $ | 255,572,431 | $ | 24,233,544 | $ | 8,162,958 | $ | 381,962,196 | |||||||||||||||||||||||
The accompanying notes are an integral part of these consolidated financial statements.
F-5
| GULF RESOURCES, INC. | ||||||||
| AND SUBSIDIARIES | ||||||||
| CONSOLIDATED STATEMENTS OF CASH FLOWS | ||||||||
| (Expressed in U.S. dollars) | ||||||||
| Years Ended December 31, | ||||||||
| 2017 Restated | 2016 | |||||||
| CASH FLOWS FROM OPERATING ACTIVITIES | ||||||||
| Net income | $ | 7,953,313 | $ | 36,225,831 | ||||
| Adjustments to reconcile net income to net cash provided by operating activities: | ||||||||
| Interest on capital lease obligation | 163,184 | 174,167 | ||||||
| Amortization of prepaid land leases | 982,108 | 774,250 | ||||||
| Depreciation and amortization | 20,197,313 | 24,880,246 | ||||||
| Allowance for obsolete and slow-moving inventories | 43,921 | (12,691 | ) | |||||
| Write-off / Impairment loss on property, plant and equipment | 17,581,244 | 106,545 | ||||||
| Loss on demolition of factory | — | 1,053,445 | ||||||
| Unrealized translation difference | 1,557,759 | (1,702,728 | ) | |||||
| Deferred tax asset | (4,126,947 | ) | 3,013 | |||||
| Stock-based compensation expense-options | 372,400 | 40,300 | ||||||
| Treasury stock issued for services | 17,800 | 15,000 | ||||||
| Changes in assets and liabilities | ||||||||
| Accounts receivable | 26,110,087 | (6,167,996 | ) | |||||
| Other receivables | (580 | ) | (877 | ) | ||||
| Inventories | 4,883,850 | 901,528 | ||||||
| Prepayment and deposits | (1,389,367 | ) | (128,384 | ) | ||||
| Accounts payable and accrued expenses | (8,203,290 | ) | (503,015 | ) | ||||
| Retention payable | 206,211 | (365,150 | ) | |||||
| Taxes payable | (3,597,390 | ) | (76,886 | ) | ||||
| Net cash provided by operating activities | 62,751,616 | 55,216,598 | ||||||
| CASH FLOWS FROM INVESTING ACTIVITIES | ||||||||
| Additions of prepaid land leases | (10,481,323 | ) | (673,934 | ) | ||||
| Compensation received from government on property disposition | — | 2,708,417 | ||||||
| Purchase of property, plant and equipment | (17,938,652 | ) | (16,995,862 | ) | ||||
| Net cash used in investing activities | (28,419,975 | ) | (14,961,379 | ) | ||||
| CASH FLOWS FROM FINANCING ACTIVITIES | ||||||||
| Repayment of capital lease obligation | (273,873 | ) | (287,387 | ) | ||||
| Net cash used in financing activities | (273,873 | ) | (287,387 | ) | ||||
| EFFECTS OF EXCHANGE RATE CHANGES ON CASH AND CASH EQUIVALENTS | 10,964,417 | (9,689,650 | ) | |||||
| NET INCREASE IN CASH AND CASH EQUIVALENTS | 45,022,185 | 30,278,182 | ||||||
| CASH AND CASH EQUIVALENTS - BEGINNING OF YEAR | 163,884,574 | 133,606,392 | ||||||
| CASH AND CASH EQUIVALENTS - END OF YEAR | $ | 208,906,759 | $ | 163,884,574 | ||||
F-6
| GULF RESOURCES, INC. |
| AND SUBSIDIARIES |
| CONSOLIDATED STATEMENTS OF CASH FLOWS (CONTINUED) |
| (Expressed in U.S. dollars) |
| Years Ended December 31, | ||||||||
2017 Restated | 2016 | |||||||
| SUPPLEMENTAL DISCLOSURE OF CASH FLOW INFORMATION | ||||||||
| Cash paid during the year for: | ||||||||
| Income taxes | $ | 11,113,143 | $ | 12,140,763 | ||||
| SUPPLEMENTAL DISCLOSURE OF NON-CASH INVESTING AND FINANCING ACTIVITIES | ||||||||
| Par value of common stock issued upon cashless exercise of options | $ | — | $ | 386 | ||||
The accompanying notes are an integral part of these consolidated financial statements.
F-7
GULF RESOURCES, INC.
AND SUBSIDIARIES
NOTES TO CONSOLIDATED FINANCIAL STATEMENTS
DECEMBER 31, 2017
(Expressed in U.S. dollars)
NOTE 1 – NATURE OF BUSINESS AND SUMMARY OF SIGNIFICANT ACCOUNTING POLICIES
(a) Basis of Presentation and Consolidation
The accompanying audited consolidated financial statements have been prepared by Gulf Resources, Inc (“Gulf Resources”). a Nevada corporation and its subsidiaries (collectively, the “Company”). On November 24, 2015, Gulf Resources, Inc., a Delaware corporation consummated a merger with and into its wholly-owned subsidiary, Gulf Resources, Inc., a Nevada corporation. As a result of the reincorporation, the Company is now a Nevada corporation.
The consolidated financial statements include the accounts of Gulf Resources, Inc. and its wholly-owned subsidiary, Upper Class Group Limited, a company incorporated in the British Virgin Islands, which owns 100% of Hong Kong Jiaxing Industrial Limited, a company incorporated in Hong Kong (“HKJI”). HKJI owns 100% of Shouguang City Haoyuan Chemical Company Limited ("SCHC") which owns 100% of Shouguang Yuxin Chemical Industry Co., Limited (“SYCI”) and Daying County Haoyuan Chemical Company Limited (“DCHC”). All material intercompany transactions have been eliminated on consolidation.
Upper Class Group Limited was incorporated with limited liability in the British Virgin Islands on July 28, 2006 and was inactive until October 9, 2006 when Upper Class Group Limited acquired all the issued and outstanding stock of Shouguang City Haoyuan Chemical Company Limited (“SCHC”). SCHC is an operating company incorporated in Shouguang City, Shangdong Province, the People’s Republic of China (the “PRC”) on May 18, 2005. SCHC is engaged in manufacturing and trading bromine and crude salt in China. Since the ownership of Upper Class Group Limited and SCHC were the same, the merger was accounted for as a transaction between entities under common control, whereby Upper Class Group Limited recognized the assets and liabilities transferred at their carrying amounts.
On December 12, 2006, Gulf Resources, Inc. (formerly Diversifax, Inc.), a public “shell” company, acquired Upper Class Group Limited and its wholly-owned subsidiary, SCHC (together “Upper Class”). Under the terms of the agreement, all stockholders of Upper Class received a total amount of 13,250,000 (restated for the 2-for-1 stock split in 2007 and the 1-for-4 stock split in 2009) shares of voting common stock of Gulf Resources, Inc. in exchange for all shares of Upper Class’ common stock held by all stockholders. Under accounting principles generally accepted in the United States, the share exchange is considered to be a capital transaction in substance, rather than a business combination. That is, the share exchange is equivalent to the issuance of stock by Upper Class for the net monetary assets of Gulf Resources, Inc., accompanied by a recapitalization, and is accounted for as a change in capital structure. Accordingly, the accounting for the share exchange will be identical to that resulting from a reverse acquisition, except no goodwill will be recorded. Under reverse takeover accounting, the post reverse acquisition comparative historical financial statements of the legal acquirer, Gulf Resources, Inc., are those of the legal acquiree, Upper Class, which is considered to be the accounting acquirer. Share and per share amounts stated have been retroactively adjusted to reflect the merger.
On February 5, 2007, SCHC acquired Shouguang Yuxin Chemical Industry Co., Limited (“SYCI”), a company incorporated in PRC on October 30, 2000. SYCI manufactures chemical products utilized in oil and gas field explorations and as papermaking chemical agents. Under the terms of the merger agreement, all stockholders of SYCI received a total amount of 8,094,059 (restated for the 2-for-1 stock split in 2007 and the 1-for-4 stock split in 2009) shares of voting common stock of Gulf Resources, Inc. in exchange for all shares of SYCI’s common stock held by all stockholders. Also, upon the completion of the merger, Gulf Resources, Inc. paid a $2,550,000 dividend to the original stockholders of SYCI. Since the ownership of Gulf Resources, Inc. and SYCI are substantially the same, the merger was accounted for as a transaction between entities under common control, whereby Gulf Resources, Inc. recognized the assets and liabilities of the Company transferred at their carrying amounts. Share and per share amounts stated have been retroactively adjusted to reflect the merger.
On November 11, 2007, Upper Class formed Hong Kong Jiaxing Industrial Limited (formerly known as Jiaxing Technology Limited) (“HKJI”), a wholly-owned subsidiary of Upper Class, in Hong Kong. Upper Class transferred its equity interest in SCHC to HKJI.
On January 12, 2015, Gulf Resources and SCHC, a wholly owned subsidiary of the Company, entered into an Equity Interest Transfer Agreement (the “Agreement”) with Shouguang City Rongyuan Chemical Co., Ltd (“SCRC”).
On February 4, 2015 the Company closed the transactions contemplated by the Agreement between the Company, SCHC and SCRC.
F-8
On the Closing Date, the Company issued 7,268,011shares of its common stock, par value $0.0005 per share (the “Shares”), at the closing market price of $1.84 per Share on the Closing Date to the four former equity owners of SCRC .The issuance of the Shares was exempt from registration pursuant to Regulation S of the Securities Act of 1933, as amended. On the Closing Date, the Company entered into a lock-up agreement with the four former equity owners of SCRC. In accordance with the terms of the lock-up agreement, the shareholders have agreed not to sell or transfer the Shares for five years from the date the stock certificates evidencing the Shares are issued.
The sellers of SCRC agreed as part of the purchase price to accept 7,268,011 shares of Gulf Resources stock, based on a valuation of $2.00, which was a 73% premium to the price on the day the agreement was reached. For accounting purposes, these shares are now being valued at $1.84, which was the closing price of Gulf Resources' stock on the day of the closing of the agreement. The price difference between the original $2.00 and the current $1.84 is solely for accounting purposes. There has been no change in the number of shares issued.
On December 15, 2015, the Company registered a new subsidiary in the Sichuan Province of the PRC named Daying County Haoyuan Chemical Company Limited (“DCHC”) with registered Capital of RMB50,000,000, and there has been RMB13,848,730 capital contributed by SCHC as of December 31, 2017. DCHC was established to further explore and develop natural gas and brine resources (including bromine and crude salt) in China.
On September 2, 2016, the Company announced the planned merger of two of its 100% owned subsidiaries, ShouguanYuxin Chemical Co., Limited (“SYCI”) and ShouguanRongyuan Chemical Co., Ltd (“SCRC”). On March 24, 2017, the legal process of the merger was completed and SCRC was officially deregistered on March 28, 2017. The results of these two subsidiaries were reported as SYCI in the fiscal year 2017.
(b) Nature of the Business
The Company manufactures and trades bromine and crude salt through its wholly-owned subsidiary, Shouguang City Haoyuan Chemical Company Limited ("SCHC"), manufactures chemical products for use in the oil industry, pesticides, paper manufacturing industry and manufacturer of materials for human and animal antibiotics through its wholly-owned subsidiary, ShouguangYuxin Chemical Industry Co., Limited ("SYCI")in the People’s Republic of China (“PRC”). DCHC was established to further explore and develop natural gas and brine resources (including bromine and crude salt) in PRC. The business is not fully operational as of December 31, 2017.
On September 1, 2017, the Company received notification from the Government of Yangkou County, Shouguang City of PRC that production at all its factories be halted with immediate effect in order for the Company to perform rectification and improvement in accordance with the county’s new safety and environmental protection requirements.
The Company has been working closely with the County authorities to develop rectification plans for both its bromine and crude salt businesses and had agreed on a plan in October 2017. SCHC is currently under rectification process. The Company believes this rectification and improvement process will cost approximately $35 million in total. The Company incurred rectification and improvements in the amount of $17,938,652 as of December 31, 2017. The Company expects to complete the rectification and improvements of the bromine and crude salt factories and be ready for the government inspection in the first half of 2018, and will resume operations upon receipt of approval from the government.
On November 24, 2017, the Company received a letter from the Government of Yangkou County, Shouguang City notifying the Company to relocate its two chemical production plants located in the second living area of the Qinghe Oil Extraction Plant to the Bohai Marine Fine Chemical Industrial Park. This is because the two plants are located in a residential area and their production activities will have certain impact on the living environment of the residents. This is as a result of the country’s effort to improve the development of the chemical industry, manage safe production and curb environmental pollution accident effectively, and ensure the quality of living environment of residents. All chemical enterprises which do not comply with the requirements of the safety and environmental protection regulations will be ordered to shut down. The Company believes this relocation process will cost approximately $60 million in total. The Company incurred relocation cost in the amount of $9,732,118 as of December 31, 2017 and estimated that the new factory will be fully operational by the beginning of 2020.
The Company had been working with Xinan Shiyou Daxue (Southwest Petroleum University) and found the way to solve the technical drilling problem of DCHC and ordered custom equipment. The natural gas project may commence production gradually once such equipment arrives and are being installed. The Company will strive for completion in the first half of 2018.
F-9
NOTE 1 – NATURE OF BUSINESS AND SUMMARY OF SIGNIFICANT ACCOUNTING POLICIES – Continued
(c) Use of Estimates
The Company’s consolidated financial statements have been prepared in accordance with accounting principles generally accepted in the United States of America and this requires management to make estimates and assumptions that affect the reported amounts of assets and liabilities at the date of the consolidated financial statements and the reported amounts of revenues and expenses during the reporting period. The Company bases its estimates on historical experience and on various other assumptions that are believed to be reasonable under the circumstances. The most significant accounting estimates with regard to these consolidated financial statements that require the most significant and subjective judgments include, but are not limited to, useful lives of property, plant and equipment, recoverability of long-lived assets, determination of impairment losses, assessment of market value of inventories and provision for inventory obsolescence, allowance for doubtful accounts, recognition and measurement of current and deferred income taxes, valuation allowance for deferred tax assets, and assumptions used for the valuation of share based payments. Accordingly, actual results may differ significantly from these estimates under different assumptions or conditions.
(d) Cash and Cash Equivalents
Cash and cash equivalents consist of all cash balances and highly liquid investments with original maturities of three months or less. Because of short maturity of these investments, the carrying amounts approximate their fair values.
(e) Accounts Receivable and Allowance of Doubtful Accounts
Accounts receivable is stated at cost, net of allowance for doubtful accounts. The normal credit term extended to customers ranges between 90 and 240 days. The company reviews all receivables that exceed the term. The Company establishes an allowance for doubtful accounts based on management’s assessment of the collectability of trade and other receivables. A considerable amount of judgment is required in assessing the amount of allowance and the Company considers the historical level of credit losses. The Company makes judgments about the credit worthiness of each customer based on ongoing credit evaluations, and monitors current economic trends that might impact the level of credit losses in the future. If the financial condition of the customer begins to deteriorate, resulting in their inability to make payments within credit term provided, a larger allowance may be required.
As of December 31, 2017 and 2016, allowances for doubtful accounts were nil. No allowances for doubtful accounts were charged to the income statement for the years ended December 31, 2017 and 2016.
(f) Concentration of Credit Risk
The Company is exposed to credit risk in the normal course of business, primarily related to accounts receivable and cash and cash equivalents. Substantially all of the Company’s cash and cash equivalents are maintained with financial institutions in the PRC, namely, Industrial and Commercial Bank of China Limited, China Merchants Bank Company Limited and Sichuan Rural Credit Union, which are not insured or otherwise protected. The Company placed $208,906,759 and $163,884,574 with these institutions as of December 31, 2017 and 2016, respectively. The Company has not experienced any losses in such accounts in the PRC.
Concentrations of credit risk with respect to accounts receivable exists as the Company sells a substantial portion of its products to a limited number of customers. However, such concentrations of credit risks are limited since the Company performs ongoing credit evaluations of its customers’ financial condition and extends credit terms as and when appropriate. Approximately 13% and 62% of the balances of accounts receivable as of December 31, 2017 and December 31, 2016, respectively, were 90 days old or less. Approximately 57% of the accounts receivable as of December 31, 2017 was collected by February 28, 2018. Approximately 66% of the accounts receivable as of December 31, 2017 more than 90 days old were collected by February 28, 2018.
The rate of collection in February 2018 for accounts receivable aged more than 90 days as of December 31, 2017 was analyzed as follows:
| Accounts Receivable Aging | Percent Collected |
| 90-120 days | 49% |
| 121-150 days | 42% |
| 151-180 days | 52% |
| 181-210 days | 100% |
| 211-240 days | 100% |
F-10
NOTE 1 – NATURE OF BUSINESS AND SUMMARY OF SIGNIFICANT ACCOUNTING POLICIES – Continued
(g) Inventories
Inventories are stated at the lower of cost, determined on a first-in first-out cost basis, or net realizable value. Costs of work-in-progress and finished goods comprise direct materials, direct labor and an attributable portion of manufacturing overhead. Net realizable value is based on estimated selling price less costs to complete and selling expenses.
(h) Property, Plant and Equipment
Property, plant and equipment are stated at cost less accumulated depreciation and any impairment losses. Expenditures for new facilities or equipment, and major expenditures for betterment of existing facilities or equipment are capitalized and depreciated using the straight-line method at rates sufficient to depreciate such costs less 5% residual value over the estimated productive lives. All other ordinary repair and maintenance costs are expensed as incurred.
Mineral rights are recorded at cost less accumulated depreciation and any impairment losses. Mineral rights are amortized ratably over the term of the lease, or the equivalent term under the units (in tonnes) of production method, whichever is shorter.
Construction in process primarily represents direct costs of construction of property, plant and equipment. Costs incurred are capitalized and transferred to property, plant and equipment upon completion, at which time depreciation commences.
The Company’s depreciation and amortization policies on property, plant and equipment other than mineral rights and construction in process are as follows:
|
Useful life (in years) | |
| Buildings (including salt pans) | 8 - 20 |
| Plant and machinery (including protective shells, transmission channels and ducts) | 3 - 8 |
| Motor vehicles | 5 |
| Furniture, fixtures and equipment | 3 - 8 |
Property, plant and equipment under the capital lease are depreciated over their expected useful lives on the same basis as owned assets, or where shorter, the term of the lease, which is 20 years.
(i) Asset Retirement Obligation
The Company follows Financial Accounting Standards Board Accounting Standards Codification (“FASB ASC”), which established a uniform methodology for accounting for estimated reclamation and abandonment costs. FASB ASC 410 requires the fair value of a liability for an asset retirement obligation to be recognized in the period in which the legal obligation associated with the retirement of the long-lived asset is incurred. When the liability is initially recorded, the offset is capitalized by increasing the carrying amount of the related long-lived asset. Over time, the liability is accreted to its present value each period, and the capitalized cost is depreciated over the useful life of the related asset. To settle the liability, the obligation is paid, and to the extent there is a difference between the liability and the amount of cash paid, a gain or loss upon settlement is recorded.
Currently, there are no reclamation or abandonment obligations associated with the land being utilized for exploitation by the bromine and crude salt factories. Also, for the two chemical plants that are to be relocated, currently, there are no obligations to restore the land to its original condition.
F-11
NOTE 1 – NATURE OF BUSINESS AND SUMMARY OF SIGNIFICANT ACCOUNTING POLICIES – Continued
(j) Recoverability of Long Lived Assets
In accordance with FASB ASC 360-10-35 “Impairment or Disposal of Long-lived Assets”, long-lived assets to be held and used are analyzed for impairment whenever events or changes in circumstances indicate that the carrying amount of an asset may not be fully recoverable or that the useful lives of those assets are no longer appropriate. The Company evaluates at each balance sheet date whether events and circumstances have occurred that indicate possible impairment.
The Company determines the existence of such impairment by measuring the expected future cash flows (undiscounted and without interest charges) and comparing such amount to the carrying amount of the assets. An impairment loss, if one exists, is then measured as the amount by which the carrying amount of the asset exceeds the discounted estimated future cash flows. Assets to be disposed of are reported at the lower of the carrying amount or fair value of such assets less costs to sell. Asset impairment charges are recorded to reduce the carrying amount of the long-lived asset that will be sold or disposed of to their estimated fair values. Charges for the asset impairment reduce the carrying amount of the long-lived assets to their estimated salvage value in connection with the decision to dispose of such assets.
To comply with the new safety and environmental regulations (see Note 1 (b)), the Company started the rectification and improvement program for the bromine and crude salt factories towards the end of the third quarter of fiscal year 2017, and as a result recorded an impairment loss of $216,181 and a write-off of $728,740 for certain property, plant and equipment in the year ended December 31, 2017.
With the relocation of the chemical factories and the length of time required to set up the new factory building in the Bohai Marine Fine Chemical Industrial Park (see Note 1 (b)), the Company believes that it is not beneficial to move the existing plant and equipment to the new premises. This is because of the age of the plant and equipment and the impact on the production efficiency at the new plant with using plant and equipment that are idle for a substantial amount of time. In addition, the Company also risks the possibility of not passing the inspection by the government at the new plant if existing plant and equipment are used. Therefore, an impairment loss of $16,636,322 equivalent to the net book values of all the property, plant and equipment at the two chemical factories were recorded in the year ended December 31, 2017.
For the year ended December 31, 2016, certain property, plant and machinery, with net book values of $106,545 were replaced during the enhancement project to protective shells for transmission channels. Write-offs of the same amounts were made and included in write-off/impairment on property, plant and equipment.
(k) Retirement Benefits
Pursuant to the relevant laws and regulations in the PRC, the Company participates in a defined contribution retirement plan for its employees arranged by a governmental organization. The Company makes contributions to the retirement plan at the applicable rate based on the employees’ salaries. The required contributions under the retirement plans are charged to the consolidated statement of income on an accrual basis when they are due. The Company’s contributions totaled $1,093,716 and $1,039,096 for the years ended December 31, 2017 and 2016, respectively.
(l) Mineral Rights
The Company follows FASB ASC 805 “Business Combinations” that certain mineral rights are considered tangible assets and that mineral rights should be accounted for based on their substance. Mineral rights are included in property, plant and equipment.
(m) Leasing arrangements
Rentals payable under operating leases are charged to the consolidated statement of income on a straight line basis over the term of the relevant lease. For capital leases, the present value of future minimum lease payments at the inception of the lease is reflected as an asset and a liability in the consolidated balance sheet. Amounts due within one year are classified as short-term liabilities and the remaining balance as long-term liabilities.
F-12
NOTE 1 – NATURE OF BUSINESS AND SUMMARY OF SIGNIFICANT ACCOUNTING POLICIES – Continued
(n) Reporting Currency and Translation
The financial statements of the Company’s foreign subsidiaries are measured using the local currency, Renminbi (“RMB”), as the functional currency; whereas the functional currency and reporting currency of the Company is the United States dollar (“USD” or “$”).
As such, the Company uses the “current rate method” to translate its PRC operations from RMB into USD, as required under FASB ASC 830 “Foreign Currency Matters”. The assets and liabilities of its PRC operations are translated into USD using the rate of exchange prevailing at the balance sheet date. The capital accounts are translated at the historical rate. Adjustments resulting from the translation of the balance sheets of the Company’s PRC subsidiaries are recorded in stockholders’ equity as part of accumulated other comprehensive income. The consolidated statement of income and comprehensive income is translated at average rates during the reporting period. Gains or losses resulting from transactions in currencies other than the functional currencies are recognized in net income for the reporting periods as part of general and administrative expense. Included in the general and administrative expense is a foreign exchange loss of $1,557,759 and a foreign exchange gain $1,702,728 for the years ended December 31, 2017 and 2016. The consolidated statement of cash flows is translated at average rates during the reporting period, with the exception of issuance of shares and payment of dividends which are translated at historical rates.
(o) Foreign Operations
All of the Company’s operations and assets are located in PRC. The Company may be adversely affected by possible political or economic events in this country. The effect of these factors cannot be accurately predicted.
(p) Revenue Recognition
The Company recognizes revenue, net of value-added tax, when persuasive evidence of an arrangement exists, delivery of the goods has occurred, customer acceptance has been obtained, which means the significant risks and ownership have been transferred to the customer, the price is fixed or determinable and collectability is reasonably assured.
(q) Income Taxes
The Company accounts for income taxes in accordance with the Income Taxes Topic of the FASB ASC, which requires the use of the liability method of accounting for deferred income taxes. Under this method, deferred income taxes are recorded to reflect the tax consequences on future years of temporary differences between the tax basis of assets and liabilities and their reported amounts at each period end. Deferred tax assets and liabilities are measured using tax rates that are expected to apply to taxable income for the years in which those tax assets and liabilities are expected to be realized or settled. The deferred income tax effects of a change in tax rates are recognized in the period of enactment. If it is more likely than not that some portion or all of a deferred tax asset will not be realized, a valuation allowance is recognized. The guidance also provides criteria for the recognition, measurement, presentation and disclosures of uncertain tax positions. A tax benefit from an uncertain tax position may be recognized if it is “more likely than not” that the position is sustainable based solely on its technical merits.
(r) Exploration Costs
Exploration costs, which included the cost of researching for appropriate places to drill wells and the cost of well drilling in search of potential natural brine or other resources, are charged to the income statement as incurred. Once the commercial viability of a project has been confirmed, all subsequent costs are capitalized.
For oil and gas properties, the successful efforts method of accounting is adopted. The Company carries exploratory well costs as an asset when the well has found a sufficient quantity of reserves to justify its completion as a producing well and where the Company is making sufficient progress assessing the reserves and the economic and operating viability of the project. Exploratory well costs not meeting these criteria are charged to expenses. Exploratory wells that discover potentially economic reserves in areas where major capital expenditure will be required before production would begin and when the major capital expenditure depends upon the successful completion of further exploratory work remain capitalized and are reviewed periodically for impairment.
(s) Contingencies
The Company accrues for costs relating to litigation, including litigation defense costs, claims and other contingent matters, including liquidated damage liabilities, when such liabilities become probable and reasonably estimable. Such estimates may be based on advice from third parties or on management’s judgment, as appropriate. Revisions to accruals are reflected in earnings (loss) in the period in which different facts or information become known or circumstances change that affect the Company’s previous assumptions with respect to the likelihood or amount of loss. Amounts paid upon the ultimate resolution of such liabilities may be materially different from previous estimates.
F-13
NOTE 1 – NATURE OF BUSINESS AND SUMMARY OF SIGNIFICANT ACCOUNTING POLICIES – Continued
(t) Stock-based Compensation
Common stock, stock options and stock warrants issued to employees or directors are recorded at their fair values estimated at grant date using the Black-Scholes model and the portion that is ultimately expected to vest is recognized as compensation cost over the requisite service period.
Common stock, stock options and stock warrants issued to other than employees or directors are recorded on the basis of their fair value using the Black-Scholes option-pricing model on the basis of the market price of the underlying common stock on the “valuation date,” which for options and warrants related to contracts that have substantial disincentives to non-performance is the date of the contract, and for all other contracts the measurement date is the date that the service is complete. Expense related to the options and warrants is recognized on a straight-line basis over the period in which services are to be received. Where expense must be recognized prior to a valuation date, the expense is computed under the Black-Scholes model on the basis of the market price of the underlying common stock at the end of the period, and any subsequent changes in the market price of the underlying common stock up through the valuation date is reflected in the expense recorded in the subsequent period in which that change occurs.
(u) Basic and Diluted Earnings per Share of Common Stock
Basic earnings per common share are based on the weighted average number of shares outstanding during the periods presented. Diluted earnings per share are computed using weighted average number of common shares plus dilutive common share equivalents outstanding during the period. Potential common shares that would have the effect of increasing diluted earnings per share are considered to be anti-dilutive, i.e. the exercise prices of the outstanding stock options were greater than the market price of the common stock. Anti-dilutive common stock equivalents which were excluded from the calculation of number of dilutive common stock equivalents amounted to 43,541 and 135,938 shares for the years ended December 31, 2017 and 2016, respectively.
The following table sets forth the computation of basic and diluted earnings per share:
| Years ended December 31, | ||||||||
| 2017 Restated | 2016 | |||||||
| Numerator | ||||||||
| Net income | $ | 7,953,313 | $ | 36,225,831 | ||||
| Denominator | ||||||||
| Basic: Weighted-average common shares outstanding during the year | 46,796,476 | 46,279,033 | ||||||
| Add: Dilutive effect of stock options | 39,354 | 346,630 | ||||||
| Diluted | 46,835,830 | 46,625,663 | ||||||
| Earnings per share | ||||||||
| Basic | $ | 0.17 | $ | 0.78 | ||||
| Diluted | $ | 0.17 | $ | 0.78 | ||||
F-14
NOTE 1 – NATURE OF BUSINESS AND SUMMARY OF SIGNIFICANT ACCOUNTING POLICIES – Continued
(v) Goodwill
Goodwill represents the excess of the purchase price over the net of the fair value of the identifiable tangible and intangible assets acquired and the fair value of liabilities assumed in business acquisitions. Goodwill impairment is assessed based on qualitative factors to determine whether it is more likely than not that the fair value of a reporting entity is less than its carry amount, including goodwill. If the Company determines that it is more likely than not that the fair value of a reporting entity is less than its carry amount, the two-step goodwill impairment test will be performed. As of December 31, 2017, the Company performed the qualitative assessment and determined that it is not more likely than not that the fair value of goodwill is less than its carrying amount and therefore deemed a full impairment loss to be unnecessary. Management believes there has been no impairment to the value of recorded goodwill as of December 31, 2017.
(w) New Accounting Pronouncements
Recently Adopted Accounting Pronouncements
In March 2016, the FASB issued ASU No. 2016-09, Compensation – Stock Compensation (Topic 718): Improvements to Employee Share-Based Payment Accounting, which simplifies several aspects of the accounting for share-based payment award transactions, including: (1) income tax consequences; (2) classification of awards as either equity or liabilities, and (3) classification on the statement of cash flows. For public companies, the amendments in this ASU are effective for annual periods beginning after December 15, 2016, and interim periods within those annual periods. The Company adopted the amendments in this Update as of January 1, 2017.There is no impact on the financial statements since any excess tax benefits were fully offset by a valuation allowance and not recognized for financial statement purposes.
Recently Issued Accounting Pronouncements Not Yet Adopted
In May 2014, the FASB issued ASU No. 2014-09, Revenue from Contracts with Customers (Topic 606). The core principle of the guidance is that an entity should recognize revenue to depict the transfer of promised goods or services to customers in an amount that reflects the consideration to which the entity expects to be entitled in exchange for those goods or services. In August 2015, FASB issued ASU 2015-14 which deferred the effective date of Update 2014-09 to annual reporting periods beginning after December 15, 2017. Early application is permitted only as of annual reporting periods beginning after December 15, 2016. The Company expects to adopt the new standard in the first quarter of 2018. The Company does not expect the adoption of this Update to have a material effect on the financial statements.
In February 2016, the FASB issued ASU No. 2016-02, Leases (Topic 842). The amendments in this Update specify the accounting for leases. The core principle of Topic 842 is that a lessee should recognize the assets and liabilities that arise from leases. For public business entities, the amendments in this Update are effective for fiscal years beginning after December 15, 2018, including interim periods within those fiscal years. The Company is evaluating the impact of this on the consolidated financial statements and related disclosures.
In June 2016, the FASB issued ASU No. 2016-13 Financial Instruments – Credit Losses (Topic 326), Measurement of Credit Losses on Financial Instruments. The amendments in this update affect loans, debt securities, trade receivables, and any other financial assets that have the contractual right to receive cash. The ASU requires and entity to recognize expected credit losses rather than incurred losses for financial assets. For public entities, the amendments are effective for fiscal years beginning after December 15, 2019, including interim periods within those fiscal years. The Company is currently evaluating the impact of this on the consolidated financial statements and disclosures.
In August 2016, the FASB issued ASU No. 2016-15, Statement of Cash Flows (Topic 230), Classification of Certain Cash Receipts and Cash Payments. The Update addresses eight specific changes to how cash receipts and cash payments are presented and classified in the statement of cash flows. The amendments in this Update are effective for public business entities for fiscal years beginning after December 15, 2017, and interim periods within those fiscal years. Early adoption is permitted. An entity that elects early adoption must adopt all of the amendments in the same period. The amendments in this Update should be applied using a retrospective transition method to each period presented. If it is impracticable to apply the amendments retrospectively for some of the issues, the amendments for those issues would be applied prospectively as of the earliest date practicable. The Company does not expect the adoption of this Update to have a material effect on the financial statements.
In January 2017, the FASB issued ASU No. 2017-01, Business Combinations (Topic 805), Clarifying the Definition of a Business. The amendments in this Update provide a more robust framework to use in determining when a set of assets and activities is a business. The amendments in this Update are effective for annual periods beginning after December 15, 2017, including interim periods within those periods. The Company does not expect the adoption of this Update to have a material effect on the financial statements.
In January 2017, the FASB issued ASU No. 2017-04, Intangibles – Goodwill and Other (Topic 350), Simplifying the Test for Goodwill Impairment. To simplify the subsequent measurement of goodwill, the Board eliminated Step 2 from the goodwill impairment test. Instead, under the amendments in this Update, an entity should perform its annual, or interim, goodwill impairment test by comparing the fair value of a reporting unit with its carrying amount. An entity should recognize an impairment charge for the amount by which the carrying amount exceeds the reporting unit’s fair value; however, the loss recognized should not exceed the total amount of goodwill allocated to that reporting unit. A public business entity that is a U.S. Securities and Exchange Commission (SEC) filer should adopt the amendments in this Update for its annual or any interim goodwill impairment tests in fiscal years beginning after December 15, 2019. The Company is currently evaluating the effect of the adoption of this Update.
In May 2017, the FASB issued ASU 2017-09, Compensation – Stock Compensation (Topic 718), Scope of Modification Accounting. The amendments in this Update provide guidance about which changes to the terms or conditions of a share-based payment award require an entity to apply modification accounting. The amendments in this Update are effective for all entities for annual periods, and interim periods within those annual periods, beginning after December 15, 2017. The amendments in this Update should be applied prospectively to an award modified on or after the adoption date.
F-15
NOTE 2 – RESTATEMENT OF PREVIOUSLY ISSUED FINANCIAL STATEMENTS
The Company determined that the entire amount of the one-time mandatory federal transition tax on accumulated foreign earnings can be offset against a portion of the Company’s US federal net operating loss carryovers and foreign tax credit carryovers. As a result, the Company did not need to accrue the $5,402,000 of income taxes and is restating the consolidated financial statements as of and for the year ended December 31, 2017 to correct this error.
The table below sets forth the effect of the restatement on the consolidated statements of income and comprehensive income for the year ended December 31, 2017.
| Years Ended December 31,2017 | ||||||||||||
| As Reported | Correction | As Restated | ||||||||||
| INCOME TAXES | $ | (9,012,140 | ) | $ | 5,402,000 | $ | (3,610,140 | ) | ||||
| NET INCOME | $ | 2,551,313 | $ | 5,402,000 | $ | 7,953,313 | ||||||
| COMPREHENSIVE INCOME | $ | 26,708,798 | $ | 5,402,000 | $ | 32,110,798 | ||||||
| EARNINGS PER SHARE | ||||||||||||
| BASIC | $ | 0.05 | $ | 0.12 | $ | 0.17 | ||||||
| DILUTED | $ | 0.05 | $ | 0.12 | $ | 0.17 | ||||||
The table below sets forth the effect of the restatement on the consolidated balance sheet for the year ended December 31, 2017.
| As of December 31, 2017 | ||||||||||||
| As Reported | Correction | As Restated | ||||||||||
| Taxes payable-current | $ | 1,474,592 | $ | (433,000 | ) | $ | 1,041,592 | |||||
| Total Current Liabilities | 3,666,232 | (433,000 | ) | 3,233,232 | ||||||||
| Taxes payable-non-current | 4,969,000 | (4,969,000 | ) | — | ||||||||
| Total non-Current Liabilities | 7,272,995 | (4,969,000 | ) | 2,303,995 | ||||||||
| Total Liabilities | 10,939,227 | (5,402,000 | ) | 5,537,227 | ||||||||
| Retained earnings unappropriated | 250,170,431 | 5,402,000 | 255,572,431 | |||||||||
| Total Stockholders’ Equity | $ | 376,560,196 | 5,402,000 | $ | 381,962,196 | |||||||
The restatement has no impact on cash flows from operating, investing and financing activities for the year ended December 31, 2017 except for the following disclosure:
| Years Ended December 31,2017 | ||||||||||||
| As Report | Correction | Restated | ||||||||||
| CASH FLOWS FROM OPERATING ACTIVITIES | ||||||||||||
| Net income | $ | 2,551,313 | $ | 5,402,000 | $ | 7,953,313 | ||||||
| Taxes payable | $ | 1,804,610 | $ | (5,402,000 | ) | $ | (3,597,390 | ) | ||||
The table below sets forth the effect of the restatement on the consolidated statements of stockholders’ equity for the year ended December 31, 2017.
| Years Ended December 31, | ||||||||
| Retained earnings unappropriated | Total | |||||||
| Net income for year ended December 31,2017, as reported | $ | 2,551,313 | $ | 2,551,313 | ||||
| Correction | $ | 5,402,000 | $ | 5,402,000 | ||||
| Net income for year ended December 31,2017, as restated | $ | 7,953,313 | $ | 7,953,313 | ||||
| Balance at December 31,2017, as reported | $ | 250,170,431 | $ | 376,560,196 | ||||
| Correction | $ | 5,402,000 | $ | 5,402,000 | ||||
| Balance at December 31,2017, as restated | $ | 255,572,431 | $ | 381,962,196 | ||||
F-16
NOTE 3 – INVENTORIES
Inventories consist of:
| As of December 31, | ||||||||
| 2017 | 2016 | |||||||
| Raw materials | $ | 396,482 | $ | 818,500 | ||||
| Finished goods | 844,224 | 4,370,331 | ||||||
| Work-in-process | — | 692,850 | ||||||
| Allowance for obsolete and slow-moving inventories | (43,921 | ) | — | |||||
| $ | 1,196,785 | $ | 5,881,681 | |||||
NOTE 4 – PREPAID LAND LEASE
The Company prepaid for land leases with lease terms for periods ranging from one to fifty years to use the land on which the production facilities and warehouses of the Company are situated. The prepaid land lease is amortized on a straight line basis.
The Company paid $9,732,118 for a 50-year lease of a piece of land for the new factory at Bohai Marine Fine Chemical Industrial Park in December, 2017. The land use certificate is being processed by the government and the commencement date of the lease will be known upon completion of the application process.
During the year ended December 31, 2017, amortization of prepaid land lease totaled $989,816, of which $634,535 and $355,281 were recorded as cost of net revenue and direct labor and factory overheads incurred during plant shutdown.
During the year ended December 31, 2016, amortization of prepaid land lease totaled $774,250, which was recorded as cost of net revenue.
The Company has the rights to use certain parcels of land located in Shouguang, the PRC, through lease agreements signed with local townships or the government authority. For parcels of land that are collectively owned by local townships, the Company cannot obtain land use rights certificates. The parcels of land of which the Company cannot obtain land use rights certificates covers a total of approximately 54.97 square kilometers of aggregate carrying value of $645,761 and approximately 54.97 square kilometers of aggregate carrying value of $620,978 as at December 31, 2017 and 2016, respectively.
NOTE 5– PROPERTY, PLANT AND EQUIPMENT, NET
Property, plant and equipment, net consist of the following:
| As of December 31, | ||||||||
| 2017 | 2016 | |||||||
| At cost: | ||||||||
| Mineral rights | $ | 4,711,822 | $ | 4,438,115 | ||||
| Buildings | 67,748,512 | 61,656,398 | ||||||
| Plant and machinery | 200,742,652 | 186,228,562 | ||||||
| Motor vehicles | 8,792 | 8,282 | ||||||
| Furniture, fixtures and office equipment | 4,150,588 | 4,553,473 | ||||||
| Construction in progress | 183,036 | 374,790 | ||||||
| Total | 277,545,402 | 257,259,620 | ||||||
| Less: accumulated depreciation and amortization | (163,597,407 | ) | (146,844,072 | ) | ||||
| Impairment | (18,833,491 | ) | (1,684,422 | ) | ||||
| Net book value | $ | 95,114,504 | $ | 108,731,126 | ||||
The Company has certain buildings and salt pans erected on parcels of land located in Shouguang, PRC, and such parcels of land are collectively owned by local townships or the government. The Company has not been able to obtain property ownership certificates over these buildings and salt pans. The aggregate carrying values of these properties situated on parcels of the land are $27,432,351 and $35,184,613 as at December 31, 2017 and 2016, respectively.
During the year ended December 31, 2017, depreciation and amortization expense totaled $19,930,786 of which $13,443,298 and $1,213,010 were recorded as cost of net revenue and administrative expenses, respectively. During the year ended December 31, 2017, depreciation and amortization expense related to property, plant and equipment of $5,274,478 was recorded in direct labor and factory overheads incurred during plant shutdown.
During the year ended December 31, 2016, depreciation and amortization expense totaled $24,552,507 of which $23,220,525 and $1,331,982 were recorded as cost of net revenue and administrative expenses, respectively.
F-17
NOTE 5 – PROPERTY, PLANT AND EQUIPMENT, NET – Continued
In the third quarter of 2017, the Company incurred enhancement works for rectification and improvement in order to meet the new environmental rules in China at costs of approximately $0.6 million.
In the fourth quarter of 2017, the Company incurred enhancement works for rectification and improvement in order to meet the new environmental rules in China at costs of approximately $17.3 million.
In the third quarter of 2016, the Company incurred enhancement works in our existing bromine extraction and crude salt production facilities at costs of approximately $15.23 million. The above enhancement projects have estimated useful lives of 5 to 8 years and are capitalized as buildings and plant and machinery.
At the end of November 2016, the Company has signed the demolition compensation agreement for its Factory No. 6 with the Yangzi Street Office of Weifang City Binhai Economic-Technological Development Zone for the Taiwan Island Ecological Culture City Project.
The operation of the original Factory No.6 was stopped at the end of November 2016 to allow for the demolition of the factory by the government collection unit. The total written off during the demolition period was $3,761,862.
Upon the completion of demolition and clearance of all ground fixtures in December 2016, a total sum of $2,708,417 was received from government. The write-off and demolition costs were offset against the compensation proceeds resulting in a net loss on demolition of factory of $1,053,445. This is included in the income statement for the year ended December 31, 2016 as loss on demolition of factory. This is accounted for in accordance with FASB ASC 605-40 “Revenue Recognition – Gains and Losses”.
In the fiscal year 2016, the company incurred $1,747,316 for the construction of roads and related infrastructure needed to begin operations in the remote and mountainous region of Daying county.
For the years ended December 31, 2017 and 2016, ordinary repair and maintenance expenses were $130,842 and $463,156, respectively.
F-18
NOTE 6 – PROPERTY, PLANT AND EQUIPMENT UNDER CAPITAL LEASES, NET
Property, plant and equipment under capital leases, net consist of the following:
| As of December 31, | ||||||||
| 2017 | 2016 | |||||||
| At cost: | ||||||||
| Buildings | $ | 125,939 | $ | 118,623 | ||||
| Plant and machinery | 2,314,196 | 2,229,775 | ||||||
| Total | 2,440,135 | 2,348,398 | ||||||
| Less: accumulated depreciation and amortization | (1,947,897 | ) | (1,794,141 | ) | ||||
| Net book value | $ | 492,238 | $ | 554,257 | ||||
The above buildings erected on parcels of land located in Shouguang, PRC, are collectively owned by local townships. The Company has not been able to obtain property ownership certificates over these buildings as the Company could not obtain land use rights certificates on the underlying parcels of land.
During the year ended December 31, 2017, depreciation and amortization expense totaled $266,527, of which $198,998 and $67,529 were recorded as cost of net revenue and administrative expenses, respectively.
During the year ended December 31, 2016, depreciation and amortization expense totaled $327,738, which was recorded as cost of sales.
NOTE 7 – ACCOUNTS PAYABLE AND ACCRUED EXPENSE
Accounts payable and accrued expenses consist of the following:
| As of December 31, | ||||||||
| 2017 | 2016 | |||||||
| Accounts payable | $ | — | $ | 7,513,075 | ||||
| Salary payable | 393,617 | 319,489 | ||||||
| Social security insurance contribution payable | 135,203 | 119,444 | ||||||
| Other payables | 503,263 | 730,310 | ||||||
| Total | $ | 1,032,083 | $ | 8,682,318 | ||||
NOTE 8 – DUE TO A RELATED PARTY AND RELATED PARTY TRANSACTIONS
On September 25, 2012, the Company purchased five stories of a commercial building in the PRC, through SYCI, from Shandong Shouguang Vegetable Seed Industry Group Co., Ltd. (the “Seller”) at a cost of approximately $5.7 million in cash, of which Mr. Ming Yang, the Chairman of the Company, had a 99% equity interest in the Seller. The cost of the five stories of the commercial building was valued by an independent appraiser on September 17, 2012 to its fair value and recorded as property, plant and equipment. The Company commenced using the property as the new headquarters for the office in early January, 2013. During the fiscal year 2013, the Company entered into an agreement with the Seller to provide property management services for an annual amount of $100,704 for five years from January 1, 2013 to December 31, 2017. The company recorded in general and administrative expense an amount of $100,704 in the years ended December 31, 2017 and 2016. The amount owed to the Seller as of December 31, 2017 and 2016 was $95,454 and $89,933 and was recorded in accounts payable and accrued expenses.
During the fiscal year 2017 and 2016, the Company borrowed $450,000 and $655,369, and fully repaid later during the same period, from Jiaxing Lighting Appliance Company Limited (Jiaxing Lighting”), in which Mr. Ming Yang, a shareholder and the Chairman of the Company, has a 100% equity interest. The amounts due to Jiaxing Lighting were unsecured, interest free and repayable on demand.
F-19
NOTE 9 – TAXES PAYABLE(Restated)
| Taxes payable consists of the following: | ||||||||
| As of December 31, | ||||||||
| 2017 Restated | 2016 | |||||||
| Income tax payable | $ | — | $ | 1,849,535 | ||||
| Natural resource tax | 156,147 | 651,230 | ||||||
| Value added tax payable | — | 887,913 | ||||||
| Land use tax payable | 810,841 | 818,921 | ||||||
| Other tax payables | 74,604 | 133,732 | ||||||
| Total current taxes payable | $ | 1,041,592 | $ | 4,341,331 | ||||
NOTE 10 – CAPITAL LEASE OBLIGATIONS
The components of capital lease obligations are as follows:
| Imputed | As of December 31, | |||||||||||
| Interest rate | 2017 | 2016 | ||||||||||
| Total capital lease obligations | 6.7% | $ | 2,507,201 | $ | 2,472,637 | |||||||
| Less: Current portion | (203,206 | ) | (187,678 | ) | ||||||||
| Capital lease obligations, net of current portion | $ | 2,303,995 | $ | 2,284,959 | ||||||||
Interest expense from capital lease obligations amounted to $163,184 and $174,167, which were charged to the consolidated statement of income for the years ended December 31, 2017 and 2016. See Note 19 for future minimum lease payments disclosure.
NOTE 11 –EQUITY
| (a) | Authorized shares |
During the annual general meeting held on June 18, 2013, the shareholders of the Company approved the amendment to the Certificate of Incorporation to decrease the number of the authorized shares of the Company’s common stock to 80,000,000. The Company has completed the filing of the amendment and restatement of the Certificate of Incorporation with the Secretary of the State of Delaware to decrease the number of authorized shares of the Company’s common stock. Accordingly, 80,000,000 is disclosed as the authorized shares of the Company’s common stock in the consolidated balance sheet as of December 31, 2017.
| (b) | Retained Earnings - Appropriated |
In accordance with the relevant PRC regulations and the PRC subsidiaries’ Articles of Association, the Company’s PRC subsidiaries are required to allocate a portion of its profit after tax to the following reserve:
Statutory Common Reserve Funds
SCHC, SYCI and DCHC are required each year to transfer at least 10% of the profit after tax as reported under the PRC statutory financial statements to the Statutory Common Reserve Funds until the balance reaches 50% of the registered share capital. This reserve can be used to make up any loss incurred or to increase share capital. Except for the reduction of losses incurred, any other application should not result in this reserve balance falling below 25% of the registered capital. The Statutory Common Reserve Fund for SCHC, SYCI and DCHC is 46%, 14% and 0% of its registered capital as of December 31, 2017. The Statutory Common Reserve Fund for SCHC, SYCI, SCRC and DCHC is 43%, 50%, 11% and 0% of its registered capital as of December 31, 2016.
F-20
NOTE 12 – TREASURY STOCK
In September 2017, the Company issued 10,000 shares of common stock from the treasury shares to one of its consultants. The shares were valued at the closing market price on the date of the agreement and recorded as general and administrative expense in the condensed consolidated statements of income and comprehensive income for the fiscal year 2017. The shares issued were deducted from the treasury shares at weighted average cost and the excess of the cost over the closing market price was charged to additional paid-in-capital.
In July 2016, the Company issued 10,000 shares of common stock from the treasury shares to one of its consultants. The shares were valued at the closing market price on the date of the agreement and recorded as general and administrative expense in the consolidated statements of income and comprehensive income for the year ended December 31, 2016. The shares issued were deducted from the treasury shares at weighted average cost and the excess of the cost over the closing market price was charged to additional paid-in-capital.
NOTE 13 – STOCK-BASED COMPENSATION
Pursuant to the Company’s Amended and Restated 2007 Equity Incentive Plan approved in 2011(“Plan”), the aggregate number of shares of the Company’s common stock available for grant and issuance of stock options is 4,341,989 shares. On October 5, 2015, during the annual meeting of the Company’s stockholders, the aggregate number of shares reserved and available for grant and issuance pursuant to the Plan was increased to 10,341,989. As of December 31, 2017, the number of shares of the Company’s common stock available for issuance under the Plan is 6,714,989.
The fair value of each option award below is estimated on the date of grant using the Black-Scholes option-pricing model. The risk free rate is based on the yield-to-maturity in continuous compounding of the US Government Bonds with the time-to-maturity similar to the expected tenor of the option granted, volatility is based on the annualized historical stock price volatility of the Company, and the expected life is based on the historical option exercise pattern.
On March 2, 2017, the Company granted to an independent director an option to purchase 12,500 shares of the Company’s common stock at an exercise price of $1.98 per share and the options vested immediately. The options were valued at $9,000 fair value, with assumed 57.42% volatility, a three-year expiration term, with an expected tenor of 1.69 years, a risk free rate of 1.59% and no dividend yield.
On May 7, 2017, the Company granted to an independent director an option to purchase 12,500 shares of the Company’s common stock at an exercise price of $1.90 per share and the options vested immediately. The options were valued at $5,700 fair value, with assumed 45.71% volatility, a three-year expiration term with an expected tenor of 1.70 years, a risk free rate of 1.25% and no dividend yield.
On July 1, 2017, the Company granted to an independent director an option to purchase 12,500 shares of the Company’s common stock at an exercise price of $1.62 per share and the options vested immediately. The options were valued at $4,500 fair value, with assumed 43.45% volatility, a three-year expiration term with expected tenor of 1.70 years, a risk free rate of 1.34% and no dividend yield.
On August 23, 2017, the Company granted to 18 members of the management staff options to purchase 281,000 shares of the Company’s common stock, at an exercise price of $1.454 per share and the options vested immediately. The options were valued at $146,700 fair value, with assumed 42.65% volatility, a four-year expiration term with an expected tenor of 1.41 years, a risk free rate of 1.26% and no dividend yield.
On August 23, 2017, the Company granted to three directors options to purchase 300,000 shares of the Company’s common stock, at an exercise price of $1.454 per share and the options vested immediately. The options were valued at $191,800 fair value, with assumed 46.47% volatility, a four-year expiration term with an expected tenor of 2.26 years, a risk free rate of 1.34% and no dividend yield.
On December 18, 2017, the Company granted to an independent director an option to purchase 12,500 shares of the Company’s common stock at an exercise price of $1.44 per share and the options vested immediately. The options were valued at $4,350 fair value, with assumed 44.16% volatility, a three-year expiration term with expected tenor of 1.66 years, a risk free rate of 1.78% and no dividend yield.
On December 18, 2017, the Company granted to a consultant to purchase 30,000 shares of the Company’s common stock, respectively, at an exercise price of $1.44 per share and the options vested immediately. The options were valued at $10,350 fair value, respectively, with assumed 44.16% volatility, a three-year expiration term with expected tenor of 1.66 years, a risk free rate of 1.78% and no dividend yield.
For the year ended December 31, 2017 and 2016, total compensation costs for options issued recorded in the consolidated statement of income were $372,400 and $40,300. There were no related tax benefits as a full valuation allowance was recorded in the years ended December 31, 2017 and 2016.
During the year ended December 31, 2016, 776,671 shares of common stock were issued upon cashless exercise of 1,831,500 options.
F-21
NOTE 13 – STOCK-BASED COMPENSATION – Continued
The following table summarizes all Company stock option transactions between January 1, 2016 and December 31, 2017.
| Number of Option and Warrants Outstanding and exercisable |
Weighted- Average Exercise price of Option and Warrants |
Range of Exercise Price per Common Share | ||||||||||
| Balance, December 31, 2015 | 2,399,000 | $ | 1.39 | $0.95 - $12.60 | ||||||||
| Granted and vested during the year ended December 31, 2016 | 80,000 | $ | 1.87 | $1.45 - $2.17 | ||||||||
| Exercised during the year ended December 31, 2016 | (1,831,500 | ) | $ | 1.11 | $0.95-$1.45 | |||||||
| Expired during the year ended December 31, 2016 | (462,500 | ) | $ | 2.24 | $0.95 - $12.60 | |||||||
| Balance, December 31, 2016 | 185,000 | $ | 2.19 | $1.54 - $4.80 | ||||||||
| Granted and vested during the year ended December 31, 2017 | 661,000 | $ | 1.47 | $1.44 - $1.98 | ||||||||
| Exercised during the year ended December 31, 2017 | — | — | — | |||||||||
| Expired during the year ended December 31, 2017 | (37,500 | ) | $ | 2.18 | $1.83-$2.55 | |||||||
| Balance, December 31, 2017 | 808,500 | $ | 1.61 | $1.44 - $4.80 | ||||||||
| Stock and Warrants Options Exercisable and Outstanding | ||||||||
| Weighted Average | Weighted Average | |||||||
| Outstanding | Remaining | Exercise Price of | ||||||
|
at December 31, 2017 |
Range of Exercise Prices |
Contractual Life (Years) |
Options Currently Outstanding | |||||
| Exercisable and outstanding | 808,500 | $1.44 - $4.80 | 3.11 | $1.61 | ||||
All options exercisable and outstanding at December 31, 2017 are fully vested.
The aggregate intrinsic value of options outstanding and exercisable as of December 31, 2017 was $10,571.
The total intrinsic value of options exercised during the years ended December 31, 2016 was $1,479,042.
F-22
NOTE 14 – INCOME TAXES (Restated)
The Company utilizes the asset and liability method of accounting for income taxes in accordance with FASB ASC 740-10.
(a) United States (“US”)
Gulf Resources, Inc. may be subject to the United States of America Tax law at tax rate of 35%. No provision for the US federal income taxes has been made as the Company had no US taxable income for the years ended December 31, 2017 and 2016, and management believes that its earnings are permanently invested in the PRC.
On December 22, 2017, the Tax Cuts and Jobs Act (“TCJA”) was enacted in law. With the new tax law, the corporation income tax rate is reduced from 35% to 21% and there is a one-time mandatory transition tax on accumulated foreign earnings. The Company computed this one-time mandatory transition tax on accumulated foreign earnings to be approximately $5.4 million. However, as the Company has available US federal net operating loss carry forwards and foreign tax credit to fully offset the mandatory inclusion of the accumulated foreign earnings, no net tax liability arose from the inclusion of these accumulated foreign earnings.
(b) British Virgin Islands (“BVI”)
Upper Class Group Limited was incorporated in the BVI and, under the current laws of the BVI, it is not subject to tax on income or capital gain in the BVI. Upper Class Group Limited did not generate assessable profit for the years ended 31 December 31, 2017 and 2016.
(c) Hong Kong
Hong Kong Jiaxing Industrial Limited was incorporated in Hong Kong and is subject to Hong Kong profits tax. The Company is subject to Hong Kong taxation on its activities conducted in Hong Kong and income arising in or derived from Hong Kong. No provision for profits tax has been made as the Company has no assessable income for the years ended December 31, 2017 and 2016. The applicable statutory tax rates for the years ended December 31, 2017 and 2016 are 16.5%.
(d) PRC
Enterprise income tax (“EIT”) for SCHC, SYCI and DCHC in the PRC is charged at 25% of the assessable profits.
The operating subsidiaries SCHC, SYCI and DCHC are wholly foreign-owned enterprises (“FIE”) incorporated in the PRC and are subject to PRC local Income Tax Law.
On February 22, 2008, the Ministry of Finance (“MOF”) and the State Administration of Taxation (“SAT”) jointly issued Cai Shui [2008] Circular 1 (“Circular 1”). According to Article 4 of Circular 1, distributions of accumulated profits earned by a FIE prior to January 1, 2008 to foreign investor(s) in 2008 will be exempted from withholding tax (“WHT”) while distribution of the profit earned by an FIE after January 1, 2008 to its foreign investor(s) shall be subject to WHT at 5% effective tax rate.
As of December 31, 2017 and 2016, the accumulated distributable earnings under the Generally Accepted Accounting Principles (“GAAP”) of PRC that are subject to WHT are $282,660,981 and $255,133,960, respectively. Since the Company intends to reinvest its earnings to further expand its businesses in mainland China, its foreign invested enterprises do not intend to declare dividends to their immediate foreign holding companies in the foreseeable future. Accordingly, as of December 31, 2017 and 2016, the Company has not recorded any WHT on the cumulative amount of distributable retained earnings of its foreign invested enterprises that are subject to WHT in China. As of December 31, 2017 and 2016, the unrecognized WHT are $14,133,049 and $12,756,698, respectively.
F-23
NOTE 14 – INCOME TAXES (Restated) – Continued
The Company’s tax returns are subject to the various tax authorities’ examination. The federal, state and local authorities of the United States may examine the Company’s tax returns filed in the United States for three years from the date of filing. The Company’s US tax returns since 2014 are currently subject to examination. Inland Revenue Department of Hong Kong may examine the Company’s tax returns filed in Hong Kong for seven years from date of filing. The Company’s Hong Kong tax returns from year 2010 are currently subject to examination.
The components of the provision for income taxes from continuing operations are:
| Years ended December 31, | ||||||||
| 2017 Restated | 2016 | |||||||
| Current taxes – PRC | $ | 7,737,087 | 11,807,194 | |||||
| Deferred tax – PRC | (4,126,947 | ) | 3,013 | |||||
| $ | 3,610,140 | $ | 11,810,207 | |||||
The effective income tax expenses differ from the PRC statutory income tax rate of 25% from continuing operations in the PRC as follows:-
| Years ended December 31, | ||||||||
| 2017 Restated | 2016 | |||||||
| Statutory income tax rate-PRC | 25 | % | 25 | % | ||||
| Non-deductible (Non-taxable) items | 4 | % | (1 | %) | ||||
| Change in valuation allowance-US federal net operating loss | 2 | % | 1 | % | ||||
| Effective tax rate | 31 | % | 25 | % | ||||
As of December 31, 2017 and 2016, the Company had a US federal net operating loss (“NOL”) of approximately $15.3 million and $33.1 million. The NOL can be carried forward up to 20 years from the year the loss is incurred and will begin to expire after 2019. It is however subject to limitation of the US tax regulations arising from previous changes in ownership and business of the Company. Due to these limitations, the NOL carryovers as of December 31, 2017 are no longer available for use to offset against future US federal taxable income.
Differences between the application of accounting principles and tax laws cause differences between the bases of certain assets and liabilities for financial reporting purposes and tax purposes. The tax effects of these differences, to the extent they are temporary, are recorded as deferred tax assets and liabilities. Significant components of the Company’s deferred tax assets and liabilities at December 31, 2017 and 2016 are as follows:
| As of December 31, | ||||||||
| 2017 Restated | 2016 | |||||||
| Deferred tax assets: | ||||||||
| Allowance for obsolete and slow-moving inventories | $ | 10,980 | $ | — | ||||
| Impairment on property, plant and equipment | 4,610,228 | 421,105 | ||||||
| Exploration costs | 1,905,347 | 1,794,667 | ||||||
| Compensation costs of unexercised stock options | 98,092 | 120,986 | ||||||
| US federal tax net operating loss | — | 11,575,000 | ||||||
| Total deferred tax assets | 6,624,647 | 13,911,758 | ||||||
| Valuation allowance | (98,092 | ) | (11,695,986 | ) | ||||
| Net deferred tax asset | $ | 6,526,555 | $ | 2,215,772 | ||||
The decrease in valuation allowance for the year ended December 31, 2017 was $11,597,894. This was mainly due to the change in tax rate in the amount of $4,681,528, the utilization of NOL to offset the one-time mandatory transition tax on accumulated foreign earnings in the amount of $3,721,336 and the NOL limitation adjustment in the amount of $3,220,530.
The increases in valuation allowance for the year ended December 31, 2016 was $231,824.
There were no unrecognized tax benefits and accrual for uncertain tax positions as of December 31, 2017 and 2016.
F-24
NOTE 15 – BUSINESS SEGMENTS
The Company has four reportable segments: bromine, crude salt, chemical products and natural gas. The reportable segments are consistent with how management views the markets served by the Company and the financial information that is reviewed by its chief operating decision maker.
An operating segment’s performance is primarily evaluated based on segment operating income, which excludes share-based compensation expense, certain corporate costs and other income not associated with the operations of the segment. These corporate costs (income) are separately stated below and also include costs that are related to functional areas such as accounting, treasury, information technology, legal, human resources, and internal audit. All intersegment transactions have been eliminated. The Company believes that segment operating income, as defined above, is an appropriate measure for evaluating the operating performance of its segments. All the customers are located in PRC.
Year Ended December 31, 2017 (Restated) | Bromine * | Crude Salt * | Chemical Products | Natural Gas | Segment Total | Corporate | Total | |||||||||||||||||||||
| Net revenue (external customers) | $ | 42,224,901 | $ | 8,986,080 | $ | 56,311,460 | $ | — | $ | 107,522,441 | $ | — | $ | 107,522,441 | ||||||||||||||
| Net revenue (intersegment) | 6,305,642 | — | — | — | 6,305,642 | — | 6,305,642 | |||||||||||||||||||||
| Income from operations before income taxes | 12,460,230 | 2,426,137 | (1,024,569 | ) | (116,465 | ) | 13,745,333 | (2,573,722 | ) | 11,171,611 | ||||||||||||||||||
| Income taxes | 3,156,016 | 585,521 | (131,397 | ) | — | 3,610,140 | — | 3,610,140 | ||||||||||||||||||||
| Income from operations after income taxes | 9,304,214 | 1,840,616 | (893,172 | ) | (116,465 | ) | 10,135,193 | (2,573,722 | ) | 7,561,471 | ||||||||||||||||||
| Total assets | 147,124,127 | 51,512,530 | 186,677,501 | 2,119,756 | 387,433,914 | 65,509 | 387,499,423 | |||||||||||||||||||||
| Depreciation and amortization | 14,533,169 | 2,452,737 | 3,211,407 | — | 20,197,313 | — | 20,197,313 | |||||||||||||||||||||
| Capital expenditures | 465,655 | 17,411,762 | — | 61,235 | 17,938,652 | — | 17,938,652 | |||||||||||||||||||||
| Goodwill | — | — | 29,374,909 | — | 29,374,909 | — | 29,374,909 | |||||||||||||||||||||
Year Ended December 31, 2016 | Bromine * | Crude Salt * | Chemical Products | Natural Gas | Segment Total | Corporate | Total | |||||||||||||||||||||
| Net revenue (external customers) | $ | 56,811,730 | $ | 8,985,852 | $ | 83,477,420 | $ | — | $ | 149,275,002 | $ | — | $ | 149,275,002 | ||||||||||||||
| Net revenue (intersegment) | 8,484,617 | — | — | — | 8,484,617 | — | 8,484,617 | |||||||||||||||||||||
| Income from operations before income taxes | 21,224,862 | 9,076 | 25,473,792 | (4,906 | ) | 46,702,824 | 1,020,518 | 47,723,342 | ||||||||||||||||||||
| Income taxes | 5,306,216 | 9,022 | 6,494,969 | — | 11,810,207 | — | 11,810,207 | |||||||||||||||||||||
| Income from operations after income taxes | 15,918,646 | 54 | 18,978,823 | (4,906 | ) | 34,892,617 | 1,020,518 | 35,913,135 | ||||||||||||||||||||
| Total assets | 143,145,960 | 33,980,033 | 186,676,983 | 1,799,094 | 365,602,070 | 89,283 | 365,691,353 | |||||||||||||||||||||
| Depreciation and amortization | 15,056,980 | 5,221,667 | 4,601,599 | — | 24,880,246 | — | 24,880,246 | |||||||||||||||||||||
| Capital expenditures | 12,912,583 | 2,335,963 | — | 1,747,316 | 16,995,862 | — | 16,995,862 | |||||||||||||||||||||
| Goodwill | — | — | 27,668,539 | — | 27,668,539 | — | 27,668,539 | |||||||||||||||||||||
* Common production overheads, operating and administrative expenses and asset items (mainly cash and certain office equipment) of bromine and crude salt segments in SCHC were split by reference to the average selling price and production volume of respective segment.
F-25
NOTE 15 – BUSINESS SEGMENTS – Continued
| Years ended December 31, | ||||||||
| Reconciliations | 2017 | 2016 | ||||||
| Total segment operating income | $ | 13,745,333 | $ | 46,702,824 | ||||
| Corporate costs | (1,015,963 | ) | (682,210 | ) | ||||
| Unrealized translation difference | (1,557,759 | ) | 1,702,728 | |||||
| Income from operations | 11,171,611 | 47,723,342 | ||||||
| Other income | 391,842 | 312,696 | ||||||
| Income before income taxes | $ | 11,563,453 | $ | 48,036,038 | ||||
The following table shows the major customer(s) (10% or more) for the year ended December 31, 2017.
| Number | Customer |
Bromine (000’s) |
Crude Salt (000’s) |
Chemical Products (000’s) |
Total Revenue (000’s) |
Percentage of Total Revenue (%) | ||||||||||||||||||
| 1 | Shandong Morui Chemical Company Limited | $ | 7,852 | $ | 2,952 | $ | 3,463 | $ | 14,267 | 13.3 | % | |||||||||||||
The following table shows the major customer(s) (10% or more) for the year ended December 31, 2016.
| Number | Customer |
Bromine (000’s) |
Crude Salt (000’s) |
Chemical Products (000’s) |
Total Revenue (000’s) |
Percentage of Total Revenue (%) | ||||||||||||||||||
| 1 | Shandong Morui Chemical Company Limited | $ | 9,823 | $ | 2,678 | $ | 5,347 | $ | 17,848 | 12.0 | % | |||||||||||||
NOTE 16 – CUSTOMER CONCENTRATION
The Company sells a substantial portion of its products to a limited number of customers. During the year ended December 31, 2017, the Company sold 36.7% of its products to its top five customers. At December 31, 2017, amount due from these customers were $22,804,914. The Company sells a substantial portion of its products to a limited number of customers. During the year ended December 31, 2016, the Company sold 30.9% of its products to its top five customers. At December 31, 2016, amount due from these customers were $25,111,129.
NOTE 17 – MAJOR SUPPLIERS
During the year ended December 31, 2017, the Company purchased 68.2% of its raw materials from its top five suppliers. At December 31, 2017, amounts due to those suppliers included in accounts payable were $0. During the year ended December 31, 2016, the Company purchased 54.4% of its raw materials from its top five suppliers. At December 31, 2016, amounts due to those suppliers included in accounts payable were $3,598,861.
NOTE 18 – FAIR VALUE OF FINANCIAL INSTRUMENTS
The carrying values of financial instruments, which consist of cash, accounts receivable and accounts payable and other payables, approximate their fair values due to the short-term nature of these instruments. There were no material unrecognized financial assets and liabilities as of December 31, 2017 and 2016.
NOTE 19 – CAPITAL COMMITMENT AND OPERATING LEASE COMMITMENTS
As of December 31, 2017, the Company leased a real property adjacent to Factory No. 1, with the related production facility, channels and ducts, other production equipment and the buildings located on the property, under a capital lease. The future minimum lease payments required under the capital lease, together with the present value of such payments, are included in the table show below.
The Company has leased nine parcel of land under non-cancelable operating leases, which are fixed rentals and expire through December 2021, December 2023, December 2030, December 2031, December 2032, December 2040, February 2059, August 2059 and June 2060, respectively.
F-26
NOTE 19 – CAPITAL COMMITMENT AND OPERATING LEASE COMMITMENTS – Continued
The following table sets forth the Company’s contractual obligations as of December 31, 2017:
| Capital Lease Obligations | Operating Lease Obligations | Property Management Fees | ||||||||||
| Payable within: | ||||||||||||
| the next 12 months | $ | 287,256 | $ | 988,859 | $ | 95,476 | ||||||
| the next 13 to 24 months | 287,256 | 1,012,360 | 95,476 | |||||||||
| the next 25 to 36 months | 287,256 | 1,033,929 | 95,476 | |||||||||
| the next 37 to 48 months | 287,256 | 1,059,600 | 95,476 | |||||||||
| the next 49 to 60 months | 287,256 | 911,781 | 95,476 | |||||||||
| thereafter | 2,298,049 | 16,583,556 | — | |||||||||
| Total | $ | 3,734,329 | $ | 21,590,085 | $ | 477,380 | ||||||
| Less: Amount representing interest | (1,227,128 | ) | ||||||||||
| Present value of net minimum lease payments | $ | 2,507,201 | ||||||||||
Rental expenses related to operating leases of the Company amounted to $1,044,611 and $1,043,615 were charged to the consolidated statements of income for the years ended December 31, 2017 and 2016, respectively.
F-27
SCHEDULE I – PARENT ONLY FINANCIAL INFORMATION
The following presents condensed parent company only financial information of Gulf Resources, Inc.
Condensed Balance Sheets
| As of December 31, | ||||||||
| 2017 Restated | 2016 | |||||||
| Current Assets | ||||||||
| Prepayments and deposits | $ | — | $ | — | ||||
| Total Current Assets | — | — | ||||||
| Non-Current Assets | ||||||||
| Interests in subsidiaries | 317,771,899 | 284,649,094 | ||||||
| Amounts due from group companies | 64,578,603 | 65,197,650 | ||||||
| Total non-current assets | 382,350,502 | 349,846,744 | ||||||
| Total Assets | $ | 382,350,502 | $ | 349,846,744 | ||||
| Liabilities and Stockholders’ Equity | ||||||||
| Current Liabilities | ||||||||
| Other payables and accrued expenses | $ | 245,605 | $ | 242,845 | ||||
| Amounts due to group companies | 142,701 | 142,701 | ||||||
| Total Current Liability | 388,306 | 385,546 | ||||||
| Total Liabilities | $ | 388,306 | 385,546 | |||||
| Stockholders’ Equity | ||||||||
| PREFERRED STOCK; $0.001 par value; 1,000,000 shares authorized; none outstanding | $ | — | $ | — | ||||
| COMMON STOCK; $0.0005 par value; 80,000,000 shares authorized; 47,052,940 and 47,052,940 shares issued; and 46,803,791 and 46,793,791 shares outstanding as of December 31, 2017 and 2016, respectively | 23,525 | 23,525 | ||||||
| Treasury stock; 249,149 and 259,149 shares as of December 31, 2017 and 2016 | (554,870 | ) | (577,141 | ) | ||||
| Additional paid-in capital | 94,524,608 | 94,156,679 | ||||||
| Retained earnings unappropriated | 255,572,431 | 248,941,696 | ||||||
| Retained earnings appropriated | 24,233,544 | 22,910,966 | ||||||
| Cumulative translation adjustment | 8,162,958 | (15,994,527 | ) | |||||
| Total Stockholders’ Equity | 381,962,196 | 349,461,198 | ||||||
| Total Liabilities and Stockholders’ Equity | $ | 382,350,502 | $ | 349,846,744 | ||||
Condensed Statements of Income
| Years Ended December 31, | ||||||||
| 2017 Restated | 2016 | |||||||
| OPERATING EXPENSES | ||||||||
| General and administrative expenses | $ | (1,011,593 | ) | $ | (674,814 | ) | ||
| TOTAL OPERATING EXPENSES | (1,011,593 | ) | (674,814 | ) | ||||
| OTHER EXPENSES | ||||||||
| Interest expense | (414 | ) | (668 | ) | ||||
| TOTAL OTHER EXPENSES | (414 | ) | (668 | ) | ||||
| TOTAL EXPENSES | (1,012,007 | ) | (675,482 | ) | ||||
| Equity in net income of subsidiaries | 8,965,320 | 36,901,313 | ||||||
| INCOME BEFORE TAXES | 7,953,313 | 36,225,831 | ||||||
| INCOME TAXES | — | — | ||||||
| NET INCOME | $ | 7,953,313 | $ | 36,225,831 | ||||
S-1
Condensed Statements of Cash Flows
| Years Ended December 31, | ||||||||
| 2017 Restated | 2016 | |||||||
| CASH FLOWS FROM OPERATING ACTIVITIES | ||||||||
| Net income | $ | 7,953,313 | $ | 36,225,831 | ||||
| Adjustments to reconcile net income to net cash provided by operating activities: | ||||||||
| Equity earnings in unconsolidated subsidiaries | (8,965,320 | ) | (36,901,313 | ) | ||||
| Stock-based compensation expense-options | 372,400 | 40,300 | ||||||
| Shares issued from treasury stock for services | 17,800 | 15,000 | ||||||
| Changes in assets and liabilities: | ||||||||
| Other payables and accrued expenses | 2,760 | (64,375 | ) | |||||
| Net cash used in operating activities | (619,047 | ) | (684,557 | ) | ||||
| CASH FLOWS FROM FINANCING ACTIVITIES | ||||||||
| Advances from group companies | 619,047 | 684,557 | ||||||
| Net cash provided by financing activities | 619,047 | 684,557 | ||||||
| NET INCREASE IN CASH AND CASH EQUIVALENTS | — | — | ||||||
| CASH AND CASH EQUIVALENTS - BEGINNING OF YEAR | — | — | ||||||
| CASH AND CASH EQUIVALENTS - END OF YEAR | $ | — | $ | — | ||||
| SUPPLEMENTAL DISCLOSURE OF NON-CASH INVESTING AND FINANCING ACTIVITIES | ||||||||
| Par value of common stock issued upon cashless exercise of options | $ | — | $ | 386 | ||||
| (i) | Basis of presentation |
In the condensed parent-company-only financial statements, the Company’s investment in subsidiaries is stated at cost plus equity in undistributed earnings of subsidiaries since the date of acquisition. The Company’s share of net income of its subsidiaries is included in condensed statements of income using the equity method. These condensed parent-company-only financial statements should be read in connection with the consolidated financial statements and notes thereto.
As of December 31, 2017, the Company itself has no purchase commitment, capital commitment and operating lease commitment.
| (ii) | Restricted Net Assets |
Schedule I of Rule 5-04 of Regulation S-X requires the condensed financial information of registrant shall be filed when the restricted net assets of consolidated subsidiaries exceed 25 percent of consolidated net assets as of the end of the most recently completed fiscal year. For purposes of the above test, restricted net assets of consolidated subsidiaries shall mean that amount of the registrant’s proportionate share of net assets of consolidated subsidiaries (after intercompany eliminations) which as of the end of the most recent fiscal year may not be transferred to the parent company by subsidiaries in the form of loans, advances or cash dividends without the consent of a third party (i.e., lender, regulatory agency, foreign government, etc.).
The condensed parent company financial statements have been prepared in accordance with Rule 12-04, Schedule I of Regulation S-X as the restricted net assets of the subsidiaries of Gulf Resources, Inc. exceed 25% of the consolidated net assets of Gulf Resources, Inc. The ability of the Company’s Chinese operating subsidiaries to pay dividends may be restricted due to the foreign exchange control policies and availability of cash balances of the Chinese operating subsidiaries. Because a significant portion of the Company’s operations and revenues are conducted and generated in China, a significant portion of the revenues being earned and currency received are denominated in RMB. RMB is subject to the exchange control regulation in China, and, as a result, the Company may be unable to distribute any dividends outside of China due to PRC exchange control regulations that restrict the Company’s ability to convert RMB into US Dollars.
S-2
Item 9A. Controls and Procedures.
Evaluation of Disclosure Controls and Procedure We maintain “disclosure controls and procedures”, as such term is defined under Exchange Act Rule 13a-15(e), that are designed to ensure that information required to be disclosed in our Exchange Act reports is recorded, processed, summarized, and reported within the time periods specified in the SEC’s rules and forms, and that such information is accumulated and communicated to our management, including our Chief Executive Officer and Chief Financial Officer, as appropriate, to allow timely decisions regarding required disclosures. In designing and evaluating the disclosure controls and procedures, our management recognized that any controls and procedures, no matter how well designed and operated, can provide only reasonable assurance of achieving the desired control objectives and in reaching a reasonable level of assurance our management necessarily was required to apply its judgment in evaluating the cost-benefit relationship of possible controls and procedures. We have carried out an evaluation as required by Rule 13a-15(d) under the supervision and with the participation of our management, including our Chief Executive Officer and Chief Financial Officer, of the effectiveness of the design and operation of our disclosure controls and procedures as of December 31, 2017. Based upon their evaluation, the Chief Executive Officer and Chief Financial Officer concluded that as of December 31, 2017, due to the material weakness described below, the Company’s disclosure controls and procedures were not effective as of the end of the period covered by this Form 10-k/A to provide reasonable assurance that information required to be disclosed by the Company in the reports that it files or submits under the Exchange Act is required, processed , summarized and reported within the time periods specified in the SEC’S rules and forms, and were not effective as of the end of the period covered by this Form 10-K/A to provide reasonable assurance that such information is accumulated and communicated to the Company’s management, including the principal executive officer and principal financial officer, to allow timely decisions regarding required disclosure.
Management’s Report on Internal Control over Financial Reporting Our management is responsible for establishing and maintaining adequate internal control over financial reporting, as such term is defined in Exchange Act Rules 13a-15(f) and 15d-15(f). Internal control over financial reporting refers to the process designed by, or under the supervision of, our principal executive officer and principal financial officer, and effected by our Board of Directors, management and other personnel, to provide reasonable assurance regarding the reliability of financial reporting and the preparation of financial statements for external purposes in accordance with generally accepted accounting principles, and includes those policies and procedures that:
| (1) | Pertain to the maintenance of records that in reasonable detail accurately and fairly reflect the transactions and dispositions of our assets; |
| (2) | Provide reasonable assurance that transactions are recorded as necessary to permit preparation of financial statements in accordance with generally accepted accounting principles, and that our receipts and expenditures are being made only in accordance with authorization of our management and directors; and |
| (3) | Provide reasonable assurance regarding prevention or timely detection of unauthorized acquisitions, use or disposition of our assets that could have a material effect on the financial statements. |
Internal control over financial reporting cannot provide absolute assurance of achieving financial reporting objectives because of its inherent limitations. Internal control over financial reporting is a process that involves human diligence and compliance and is subject to lapses in judgment and breakdowns resulting from human failures. Internal control over financial reporting also can be circumvented by collusion or improper management override. Because of such limitations, there is a risk that material misstatements may not be prevented or detected on a timely basis by internal control over financial reporting. However, these inherent limitations are known features of the financial reporting process. Therefore, it is possible to design into the process safeguards to reduce, though not eliminate, this risk. Management is responsible for establishing and maintaining adequate internal control over financial reporting for the company.
Management has used the framework set forth in the report entitled Internal Control—Integrated Framework published by the Committee of Sponsoring Organizations of the Treadway Commission (2013 framework), known as COSO, to evaluate the effectiveness of our internal control over financial reporting.
A material weakness is a deficiency, or a combination of deficiencies, in internal control over financial reporting, such that there is a reasonable possibility that a material misstatement of the Company’s annual or interim financial statements will not be prevented or detected on a timely basis. Based on such evaluation and the material weakness described below our CEO and CFO have concluded that, as of December 31, 2017, our internal controls over financial reporting was ineffective.
Subsequent to the filing of the Company’s annual report on Form 10-K/A for the year ended December 31, 2017 on March 23, 2018, the Company filed Amendment No.2 on Form 10-K/A to reflect the correction of an error related to the one-time mandatory federal transition tax on accumulated foreign earnings.
Management is actively engaged in the planning for, and implementation of, remediation efforts to address the material weakness identified above. The remediation plan includes i) the implementation of new controls designed to evaluate the appropriateness of foreign tax recognition policies and procedures, ii) new controls over recording foreign tax transactions, and iii) additional training for accounting and financial reporting personnel.
Management believes the measures described above and others that may be implemented will remediate the material weaknesses that we have identified. As management continues to evaluate and improve internal control over financial reporting, we may decide to take additional measures to address control deficiencies or determine to modify, or in appropriate circumstances not to complete, certain of the remediation measures identified.
This annual report does not include an attestation report of our registered public accounting firm regarding internal control over financial reporting. Management’s report was not subject to attestation by our registered public accounting firm pursuant to the Dodd-Frank Wall Street Reform and Consumer Protection Act, which permits us to provide only management’s report in this annual report.
Changes in Internal Control Over Financial Reporting
There were no changes in our internal control over financial reporting (as such term is defined in Rules 13a-15(f) under the Exchange Act) during our most recently completed fiscal quarter that have materially affected, or are reasonably likely to materially affect, our internal control over financial reporting.
27
PART III
28
PART IV
Item 15. Exhibits and Financial Statement Schedules.
(a) Financial Statements and Schedules
| (1) | Financial Statements – The financial statements filed as part of this filing are listed on the index to the Financial Statements and Supplementary Data, Item 8 of Part II, on page F-1. |
| (2) | Financial Statement Schedules – “Schedule I – Parent Only Financial Information” filed as part of this filing is listed on the Financial Statements and Supplementary Data, Item 8 of Part II, on pages S-1 and S-2. All other financial statement schedules have been omitted because they are not applicable, or the information required is set forth in the Consolidated Financial Statements or related notes thereto. |
(b) Exhibit Index
* Filed herewith.
** Previously filed
29
Pursuant to the requirements of Section 13 or 15(d) of the Securities and Exchange Act, the Company has duly caused this Report to be signed on its behalf by the undersigned thereunto duly authorized.
Pursuant to the requirements of the Securities Exchange Act of 1934, the Company has duly caused this Report to be signed on its behalf by the undersigned, thereunto duly authorized.
| Date: November 9, 2018 | By: | /s/ Xiaobin Liu |
| By: Xiaobin Liu | ||
|
Title: Chief Executive Officer | ||
| By: | /s/ Min Li | |
| By: Min Li | ||
|
Title: Chief Financial Officer |
Pursuant to the requirements of the Securities and Exchange Act of 1934, this Report has been signed below by the following person on behalf of the Company and in the capacities and on the dates indicated.
| SIGNATURE | TITLE | DATE | ||
| /s/ Xiaobin Liu | November 9, 2018 | |||
| Xiaobin Liu | Chief Executive Officer and Director | |||
| /s/ Min Li | November 9, 2018 | |||
| Min Li | Chief Financial Officer | |||
| /s/ Ming Yang | November 9, 2018 | |||
| Ming Yang | Director | |||
| /s/ Naihui Miao | November 9, 2018 | |||
| Naihui Miao | Director | |||
| /s/ Tengfei Zhang | November 9, 2018 | |||
| Tengfei Zhang | Director | |||
| /s/ Yang Zou | November 9, 2018 | |||
| Yang Zou | Director | |||
| /s/ Nan Li | November 9, 2018 | |||
| Nan Li | Director | |||
| /s/ Shi Tong Jiang | November 9, 2018 | |||
| Shi Tong Jiang | Director |
30