Attached files
| file | filename |
|---|---|
| 8-K - 8-K - CBTX, Inc. | f8-k.htm |
Exhibit 99.1
|
|
East Coast Tour November 13-15, 2018 NASDAQ: CBTX |
|
|
2 NO OFFER OR SOLICITATION This communication does not constitute an offer to sell, a solicitation of an offer to sell, the solicitation or an offer to buy any securities or a solicitation or any vote or approval. There will be no sale of securities in any jurisdiction in which such an offer, solicitation or sale would be unlawful prior to registration or qualification under the securities laws of any such jurisdiction. No offer of securities shall be made except by means of a prospectus meeting the requirement of Section 10 of the Securities Act of 1933, as amended. NON-GAAP FINANCIAL MEASURES This presentation contains certain non-GAAP (generally accepted accounting principles) financial measures, including tangible equity and tangible book value per share. The non-GAAP financial measures that CBTX, Inc. (the “Company”) discusses in this presentation should not be considered in isolation or as a substitute for the most directly comparable or other financial measures calculated in accordance with GAAP. A reconciliation of the non-GAAP financial measures used in this presentation to the most directly comparable GAAP measures is provided at the end of this presentation. FORWARD LOOKING STATEMENTS This presentation contains “forward-looking statements” within the meaning of the Private Securities Litigation Reform Act of 1995. These forward‑looking statements reflect the Company’s current views with respect to, among other things, future events and its financial performance. These statements are often, but not always, made through the use of words or phrases such as “may,” “should,” “could,” “predict,” “potential,” “believe,” “will likely result,” “expect,” “continue,” “will,” “anticipate,” “seek,” “estimate,” “intend,” “plan,” “projection,” “would” and “outlook,” or the negative version of those words or other comparable words or phrases of a future or forward‑looking nature. These forward‑looking statements are not historical facts, and are based on current expectations, estimates and projections about our industry, management’s beliefs and certain assumptions made by management, many of which, by their nature, are inherently uncertain and beyond our control. Accordingly, the Company cautions you that any such forward‑looking statements are not guarantees of future performance and are subject to risks, assumptions and uncertainties that are difficult to predict. Although the Company believes that the expectations reflected in these forward‑looking statements are reasonable as of the date made, actual results may prove to be materially different from the results expressed or implied by the forward‑looking statements. There are or will be important factors that could cause our actual results to differ materially from those indicated in these forward‑looking statements, including, but not limited to, the following: natural disasters and adverse weather, acts of terrorism, an outbreak of hostilities or other international or domestic calamities, and other matters beyond our control; the geographic concentration of our markets in Beaumont and Houston, Texas; our ability to prudently manage our growth and execute our strategy; risks associated with our acquisition and de novo branching strategy; changes in management personnel; the amount of nonperforming and classified assets that we hold; time and effort necessary to resolve nonperforming assets; deterioration of our asset quality; interest rate risk associated with our business; business and economic conditions generally and in the financial services industry, nationally and within our primary markets; volatility and direction of oil prices and the strength of the energy industry, generally and within Texas; the composition of our loan portfolio, including the identity of our borrowers and the concentration of loans in specialized industries; changes in the value of collateral securing our loans; our ability to maintain important deposit customer relationships and our reputation; our ability to maintain effective internal control over financial reporting; operational risks associated with our business; increased competition in the financial services industry, particularly from regional and national institutions; volatility and direction of market interest rates; liquidity risks associated with our business; systems failures or interruptions involving our information technology and telecommunications systems or third‑party servicers; interruptions or breaches in the Company’s information system security; the failure of certain third party vendors to perform; environmental liability associated with our lending activities; the institution and outcome of litigation and other legal proceedings against us or to which we may become subject; changes in the laws, rules, regulations, interpretations or policies relating to financial institution, accounting, tax, trade, monetary and fiscal matters; and further government intervention in the U.S. financial system. The foregoing factors should not be construed as exhaustive and should be read together with the other cautionary statements included under “Cautionary Note Regarding Forward-Looking Statements” and “Risk Factors” in the Company’s Annual Report on Form 10-K filed with the SEC on March 23, 2018 and any updates to those risk factors set forth in the Company’s subsequent Quarterly Reports on Form 10-Q or Current Reports on Form 8-K. If one or more events related to these or other risks or uncertainties materialize, or if our underlying assumptions prove to be incorrect, actual results may differ materially from what we anticipate. Accordingly, you should not place undue reliance on any such forward‑looking statements. Any forward‑looking statement speaks only as of the date on which it is made, and the Company does not undertake any obligation to publicly update or review any forward‑looking statement, whether as a result of new information, future developments or otherwise. New factors emerge from time to time, and it is not possible for the Company to predict which will arise. In addition, the Company cannot assess the impact of each factor on its business or the extent to which any factor, or combination of factors, may cause actual results to differ materially from those contained in any forward‑looking statements. All forward-looking statements, expressed or implied, included in this communication are expressly qualified in their entirety by this cautionary statement. This cautionary statement should also be considered in connection with any subsequent written or oral forward-looking statements that the Company or persons acting on the Company’s behalf may issue. Annualized, pro forma, projected and estimated numbers are used for illustrative purpose only, are not forecasts and may not reflect actual results. SAFE HARBOR STATEMENT |
|
|
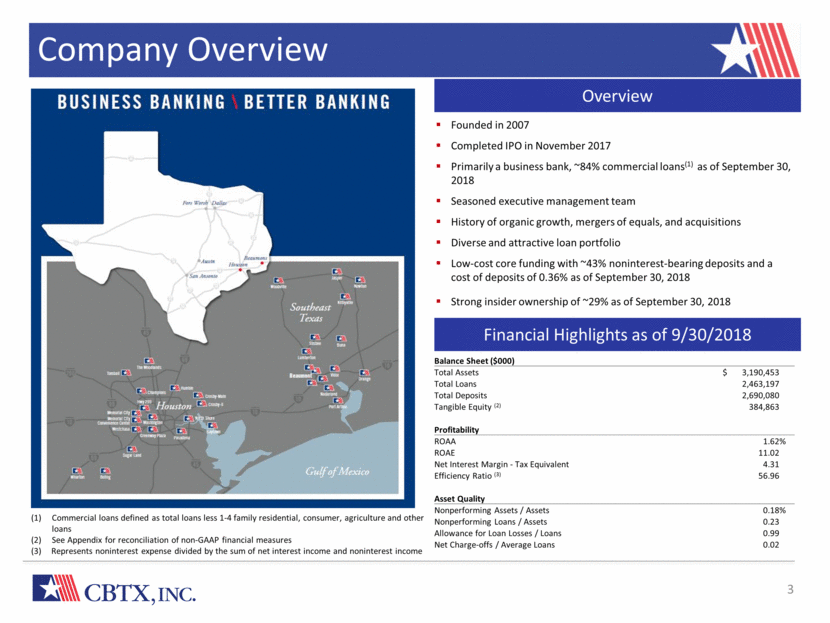
Founded in 2007 Completed IPO in November 2017 Primarily a business bank, ~84% commercial loans(1) as of September 30, 2018 Seasoned executive management team History of organic growth, mergers of equals, and acquisitions Diverse and attractive loan portfolio Low-cost core funding with ~43% noninterest-bearing deposits and a cost of deposits of 0.36% as of September 30, 2018 Strong insider ownership of ~29% as of September 30, 2018 The Bank Built or Business Company Overview 3 Overview Financial Highlights as of 9/30/2018 Commercial loans defined as total loans less 1-4 family residential, consumer, agriculture and other loans See Appendix for reconciliation of non-GAAP financial measures (3) Represents noninterest expense divided by the sum of net interest income and noninterest income Balance Sheet ($000) Total Assets $ 3,190,453 Total Loans 2,463,197 Total Deposits 2,690,080 Tangible Equity (2) 384,863 Profitability ROAA 1.62 % ROAE 11.02 Net Interest Margin - Tax Equivalent 4.31 Efficiency Ratio (3) 56.96 Asset Quality Nonperforming Assets / Assets 0.18 % Nonperforming Loans / Assets 0.23 Allowance for Loan Losses / Loans 0.99 Net Charge-offs / Average Loans 0.02 |
|
|
Strengths & Investment Rationale 4 Strength of management team Significant insider ownership Relationship-based business bank with a strong credit culture Key emphasis on developing core loan and deposit relationships led by bankers who support clients through tailored financial solutions Strength of operating markets Platform and team with significant scalability Track record of growth and expansion Disciplined approach to M&A allows for shareholder value to be enhanced through strategic acquisitions Attractive core deposit base ~43% noninterest-bearing deposits ~93% core deposits with minimal reliance on time deposits ~ 81% of loan customers also had a deposit relationship as of September 30, 2018 Attractive cost of deposits of 0.36% Strong operating performance ~$3.2 billion in assets in one of the most desirable banking markets in the country Attractive and improving ROAA 4% + net interest margin improving in rising rate environment Improving efficiency ratio with scalable infrastructure Significant scarcity value – largest Texas community bank focused on Houston and Beaumont markets |
|
|
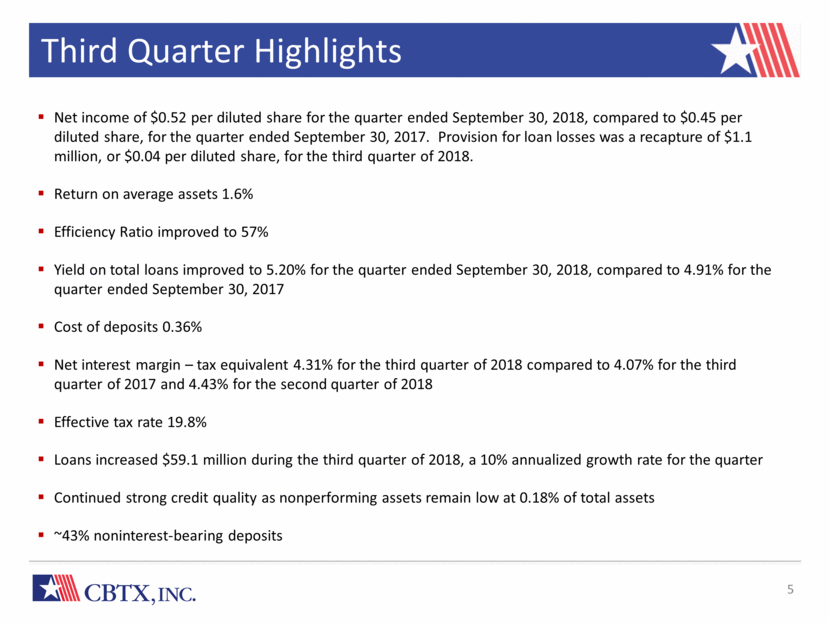
5 Third Quarter Highlights Net income of $0.52 per diluted share for the quarter ended September 30, 2018, compared to $0.45 per diluted share, for the quarter ended September 30, 2017. Provision for loan losses was a recapture of $1.1 million, or $0.04 per diluted share, for the third quarter of 2018. Return on average assets 1.6% Efficiency Ratio improved to 57% Yield on total loans improved to 5.20% for the quarter ended September 30, 2018, compared to 4.91% for the quarter ended September 30, 2017 Cost of deposits 0.36% Net interest margin – tax equivalent 4.31% for the third quarter of 2018 compared to 4.07% for the third quarter of 2017 and 4.43% for the second quarter of 2018 Effective tax rate 19.8% Loans increased $59.1 million during the third quarter of 2018, a 10% annualized growth rate for the quarter Continued strong credit quality as nonperforming assets remain low at 0.18% of total assets ~43% noninterest-bearing deposits |
|
|
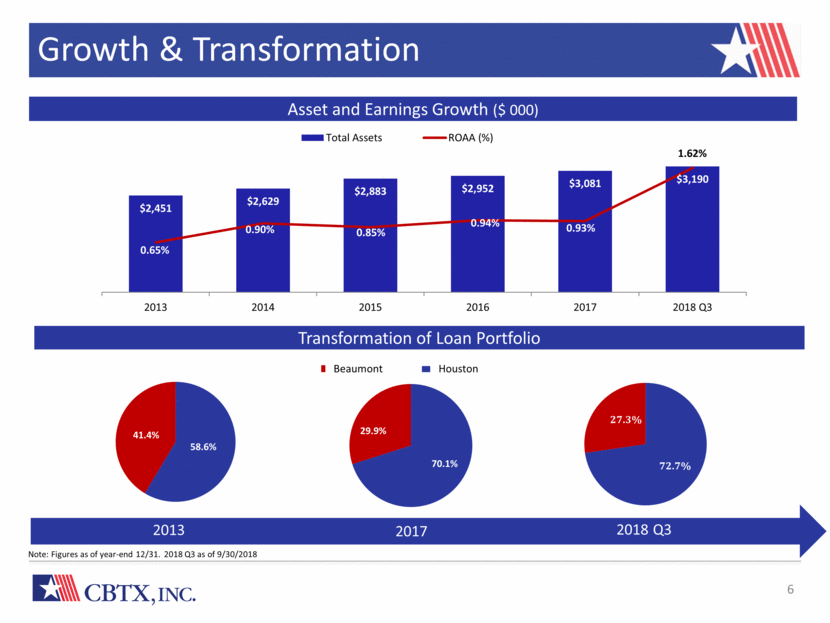
6 Growth & Transformation 2013 2017 Beaumont Houston Transformation of Loan Portfolio Note: Figures as of year-end 12/31. 2018 Q3 as of 9/30/2018 2018 Q3 Asset and Earnings Growth ($ 000) 58.6% 41.4% 70.1% 29.9% $2,451 $2,629 $2,883 $2,952 $3,081 $3,190 0.65% 0.90% 0.85% 0.94% 0.93% 1.62% 0.00% 0.20% 0.40% 0.60% 0.80% 1.00% 1.20% 1.40% 1.60% 1.80% $0 $500 $1,000 $1,500 $2,000 $2,500 $3,000 $3,500 2013 2014 2015 2016 2017 2018 Q3 Total Assets ROAA (%) 72.7% 27.3% |
|
|
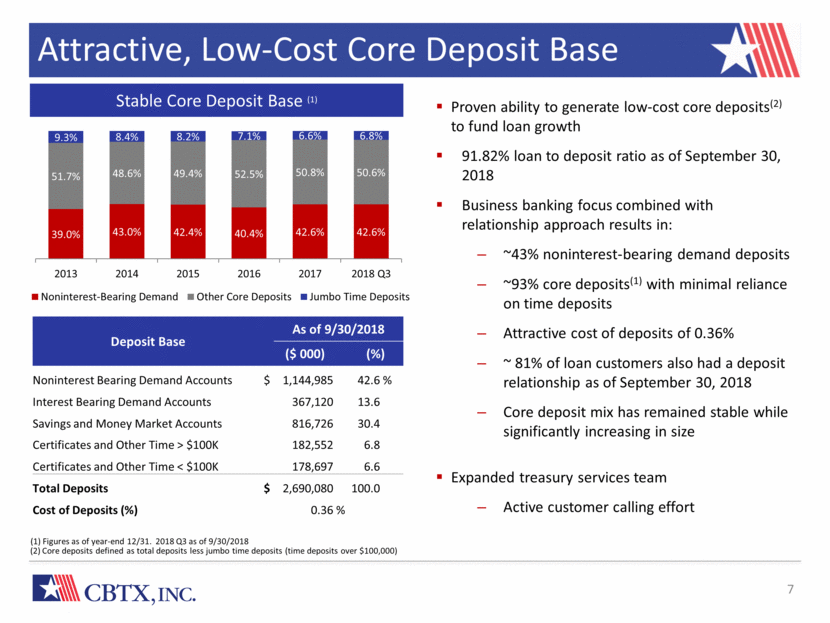
The Bank Built or Business Attractive, Low-Cost Core Deposit Base 7 Stable Core Deposit Base (1) Proven ability to generate low-cost core deposits(2) to fund loan growth 91.82% loan to deposit ratio as of September 30, 2018 Business banking focus combined with relationship approach results in: ~43% noninterest-bearing demand deposits ~93% core deposits(1) with minimal reliance on time deposits Attractive cost of deposits of 0.36% ~ 81% of loan customers also had a deposit relationship as of September 30, 2018 Core deposit mix has remained stable while significantly increasing in size Expanded treasury services team Active customer calling effort (2) Core deposits defined as total deposits less jumbo time deposits (time deposits over $100,000) (1) Figures as of year-end 12/31. 2018 Q3 as of 9/30/2018 Deposit Base As of 9/30/2018 ($ 000) (%) Noninterest Bearing Demand Accounts $ 1,144,985 42.6 % Interest Bearing Demand Accounts 367,120 13.6 Savings and Money Market Accounts 816,726 30.4 Certificates and Other Time > $100K 182,552 6.8 Certificates and Other Time < $100K 178,697 6.6 Total Deposits $ 2,690,080 100.0 Cost of Deposits (%) 0.36 % 39.0% 43.0% 42.4% 40.4% 42.6% 42.6% 51.7% 48.6% 49.4% 52.5% 50.8% 50.6% 9.3% 8.4% 8.2% 7.1% 6.6% 6.8% 2013 2014 2015 2016 2017 2018 Q3 Noninterest-Bearing Demand Other Core Deposits Jumbo Time Deposits |
|
|
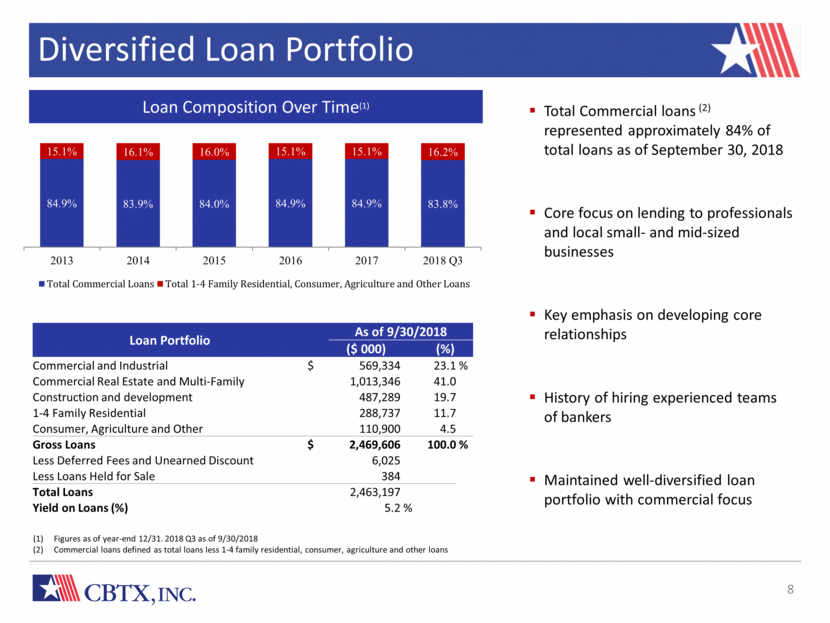
The Bank Built or Business Diversified Loan Portfolio 8 Loan Composition Over Time(1) Total Commercial loans (2) represented approximately 84% of total loans as of September 30, 2018 Core focus on lending to professionals and local small- and mid-sized businesses Key emphasis on developing core relationships History of hiring experienced teams of bankers Maintained well-diversified loan portfolio with commercial focus Figures as of year-end 12/31. 2018 Q3 as of 9/30/2018 Commercial loans defined as total loans less 1-4 family residential, consumer, agriculture and other loans Loan Portfolio As of 9/30/2018 ($ 000) (%) Commercial and Industrial $ 569,334 23.1 % Commercial Real Estate and Multi-Family 1,013,346 41.0 Construction and development 487,289 19.7 1-4 Family Residential 288,737 11.7 Consumer, Agriculture and Other 110,900 4.5 Gross Loans $ 2,469,606 100.0 % Less Deferred Fees and Unearned Discount 6,025 Less Loans Held for Sale 384 Total Loans 2,463,197 Yield on Loans (%) 5.2 % 84.9% 83.9% 84.0% 84.9% 84.9% 83.8% 15.1% 16.1% 16.0% 15.1% 15.1% 16.2% 2013 2014 2015 2016 2017 2018 Q3 Total Commercial Loans Total 1-4 Family Residential, Consumer, Agriculture and Other Loans |
|
|
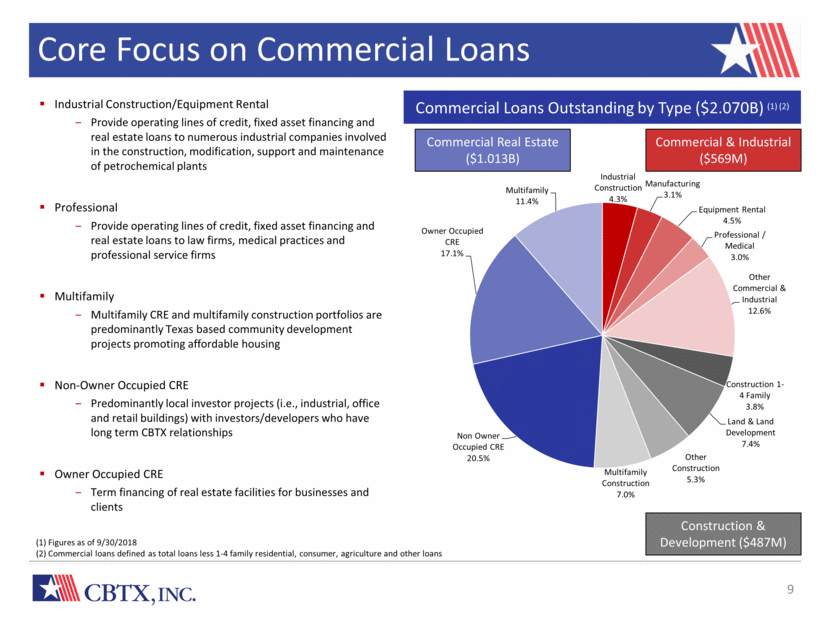
The Bank Built or Business Core Focus on Commercial Loans 9 Commercial Loans Outstanding by Type ($2.070B) (1) (2) (1) Figures as of 9/30/2018 (2) Commercial loans defined as total loans less 1-4 family residential, consumer, agriculture and other loans Construction & Development ($487M) Commercial Real Estate ($1.013B) Commercial & Industrial ($569M) Industrial Construction/Equipment Rental Provide operating lines of credit, fixed asset financing and real estate loans to numerous industrial companies involved in the construction, modification, support and maintenance of petrochemical plants Professional Provide operating lines of credit, fixed asset financing and real estate loans to law firms, medical practices and professional service firms Multifamily Multifamily CRE and multifamily construction portfolios are predominantly Texas based community development projects promoting affordable housing Non-Owner Occupied CRE Predominantly local investor projects (i.e., industrial, office and retail buildings) with investors/developers who have long term CBTX relationships Owner Occupied CRE Term financing of real estate facilities for businesses and clients Industrial Construction 4.3% Manufacturing 3.1% Equipment Rental 4.5% Professional / Medical 3.0% Other Commercial & Industrial 12.6% Construction 1 - 4 Family 3.8% Land & Land Development 7.4% Other Construction 5.3% Multifamily Construction 7.0% Non Owner Occupied CRE 20.5% Owner Occupied CRE 17.1% Multifamily 11.4% |
|
|
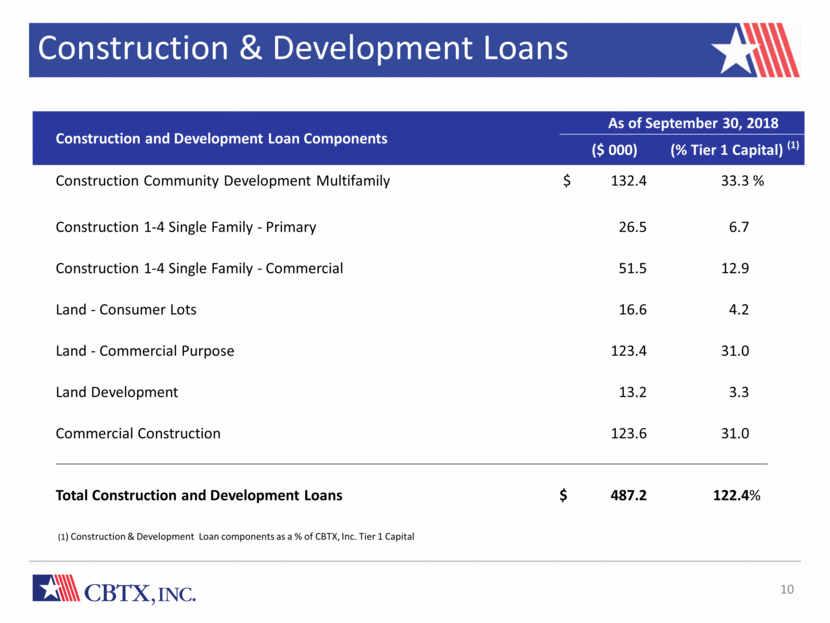
The Bank Built or Business Construction & Development Loans 10 (1) Construction & Development Loan components as a % of CBTX, Inc. Tier 1 Capital Construction and Development Loan Components As of September 30, 2018 ($ 000) (% Tier 1 Capital) (1) Construction Community Development Multifamily $ 132.4 33.3 % Construction 1-4 Single Family - Primary 26.5 6.7 Construction 1-4 Single Family - Commercial 51.5 12.9 Land - Consumer Lots 16.6 4.2 Land - Commercial Purpose 123.4 31.0 Land Development 13.2 3.3 Commercial Construction 123.6 31.0 Total Construction and Development Loans $ 487.2 122.4 % |
|
|
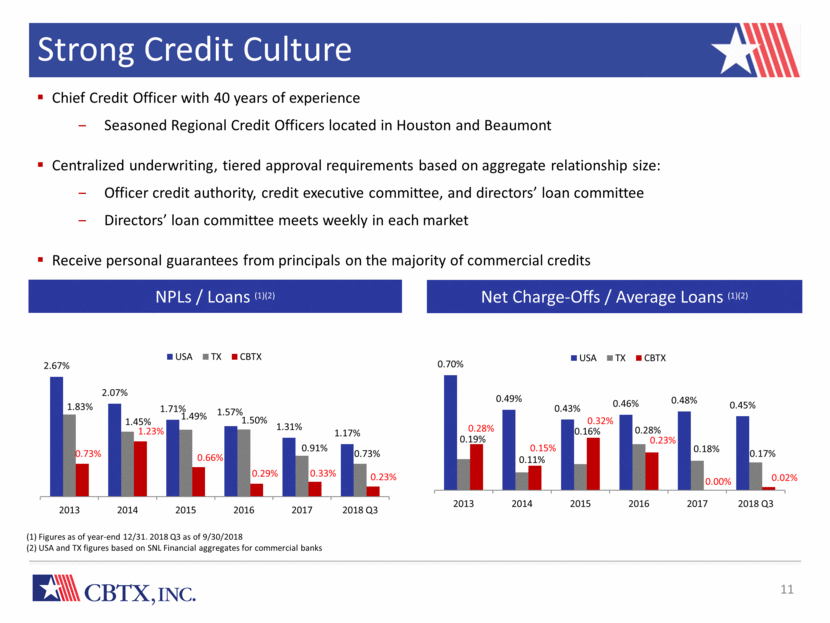
The Bank Built or Business Strong Credit Culture 11 Chief Credit Officer with 40 years of experience Seasoned Regional Credit Officers located in Houston and Beaumont Centralized underwriting, tiered approval requirements based on aggregate relationship size: Officer credit authority, credit executive committee, and directors’ loan committee Directors’ loan committee meets weekly in each market Receive personal guarantees from principals on the majority of commercial credits NPLs / Loans (1)(2) Net Charge-Offs / Average Loans (1)(2) (1) Figures as of year-end 12/31. 2018 Q3 as of 9/30/2018 (2) USA and TX figures based on SNL Financial aggregates for commercial banks 2.67% 2.07% 1.71% 1.57% 1.31% 1.17% 1.83% 1.45% 1.49% 1.50% 0.91% 0.73% 0.73% 1.23% 0.66% 0.29% 0.33% 0.23% 2013 2014 2015 2016 2017 2018 Q3 USA TX CBTX 0.70% 0.49% 0.43% 0.46% 0.48% 0.45% 0.19% 0.11% 0.16% 0.28% 0.18% 0.17% 0.28% 0.15% 0.32% 0.23% 0.00% 0.02% 2013 2014 2015 2016 2017 2018 Q3 USA TX CBTX |
|
|
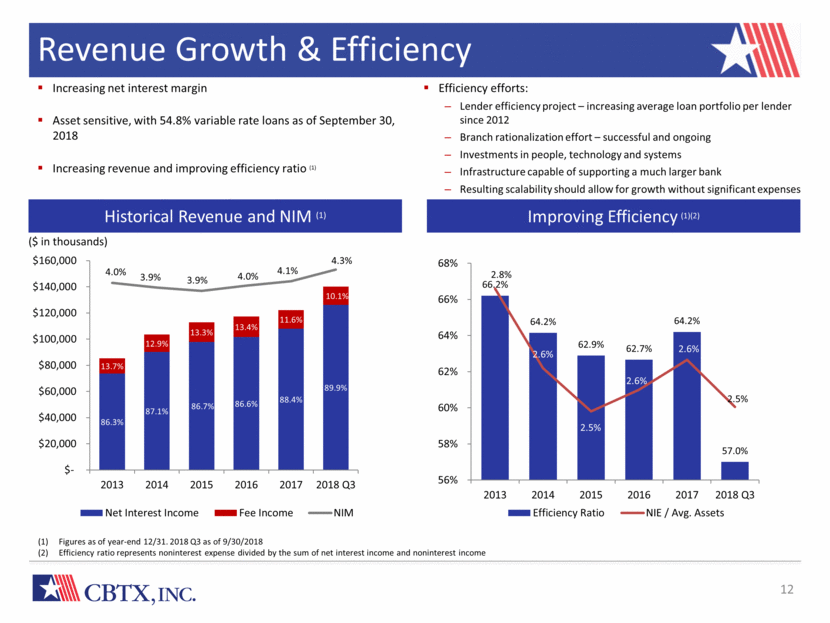
The Bank Built or Business Revenue Growth & Efficiency 12 Increasing net interest margin Asset sensitive, with 54.8% variable rate loans as of September 30, 2018 Increasing revenue and improving efficiency ratio (1) Historical Revenue and NIM (1) Improving Efficiency (1)(2) ($ in thousands) Efficiency efforts: Lender efficiency project – increasing average loan portfolio per lender since 2012 Branch rationalization effort – successful and ongoing Investments in people, technology and systems Infrastructure capable of supporting a much larger bank Resulting scalability should allow for growth without significant expenses Figures as of year-end 12/31. 2018 Q3 as of 9/30/2018 Efficiency ratio represents noninterest expense divided by the sum of net interest income and noninterest income 86.3% 87.1% 86.7% 86.6% 88.4% 89.9% 13.7% 12.9% 13.3% 13.4% 11.6% 10.1% 4.0% 3.9% 3.9% 4.0% 4.1% 4.3% 0.0% 0.5% 1.0% 1.5% 2.0% 2.5% 3.0% 3.5% 4.0% 4.5% $- $20,000 $40,000 $60,000 $80,000 $100,000 $120,000 $140,000 $160,000 2013 2014 2015 2016 2017 2018 Q3 Net Interest Income Fee Income NIM 66.2% 64.2% 62.9% 62.7% 64.2% 57.0% 2.8% 2.6% 2.5% 2.6% 2.6% 2.5% 2.3% 2.4% 2.5% 2.6% 2.7% 2.8% 2.9% 56% 58% 60% 62% 64% 66% 68% 2013 2014 2015 2016 2017 2018 Q3 Efficiency Ratio NIE / Avg. Assets |
|
|
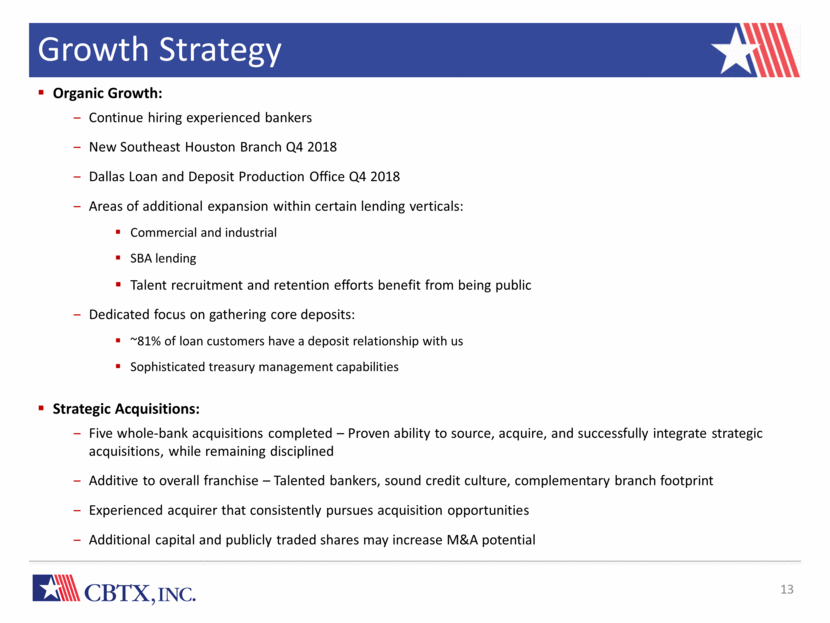
13 Growth Strategy Organic Growth: Continue hiring experienced bankers New Southeast Houston Branch Q4 2018 Dallas Loan and Deposit Production Office Q4 2018 Areas of additional expansion within certain lending verticals: Commercial and industrial SBA lending Talent recruitment and retention efforts benefit from being public Dedicated focus on gathering core deposits: ~81% of loan customers have a deposit relationship with us Sophisticated treasury management capabilities Strategic Acquisitions: Five whole-bank acquisitions completed – Proven ability to source, acquire, and successfully integrate strategic acquisitions, while remaining disciplined Additive to overall franchise – Talented bankers, sound credit culture, complementary branch footprint Experienced acquirer that consistently pursues acquisition opportunities Additional capital and publicly traded shares may increase M&A potential |
|
|
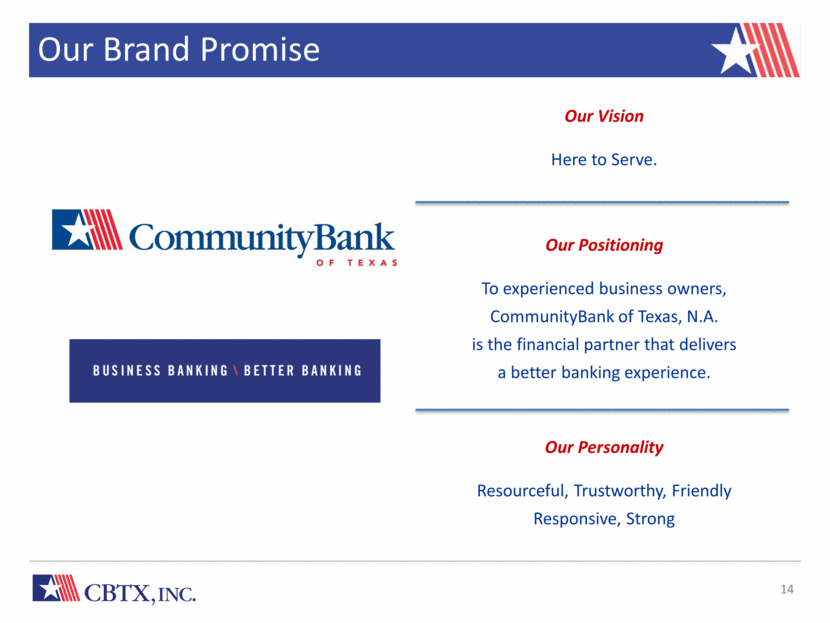
14 Our Brand Promise Our Vision Here to Serve. Our Positioning To experienced business owners, CommunityBank of Texas, N.A. is the financial partner that delivers a better banking experience. Our Personality Resourceful, Trustworthy, Friendly Responsive, Strong |
|
|
Appendix |
|
|
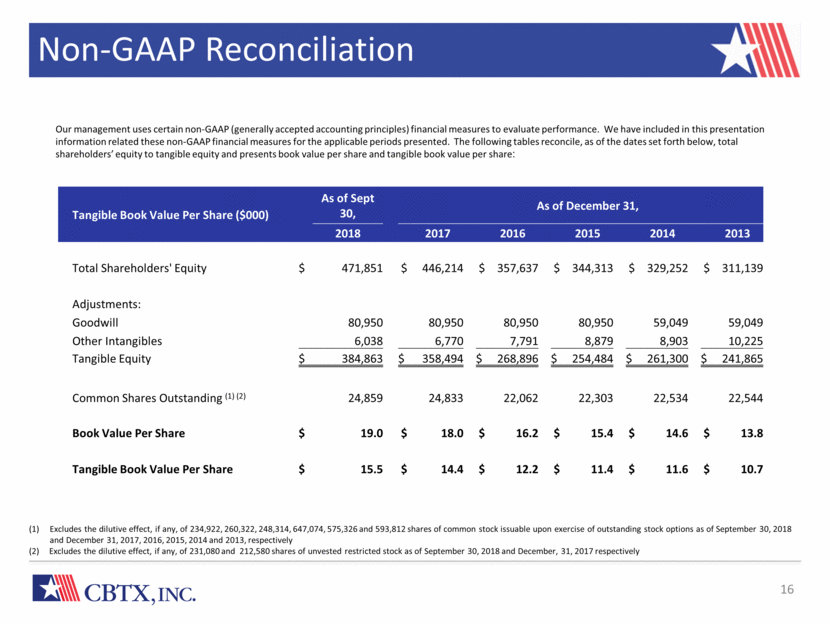
16 Non-GAAP Reconciliation Excludes the dilutive effect, if any, of 234,922, 260,322, 248,314, 647,074, 575,326 and 593,812 shares of common stock issuable upon exercise of outstanding stock options as of September 30, 2018 and December 31, 2017, 2016, 2015, 2014 and 2013, respectively (2) Excludes the dilutive effect, if any, of 231,080 and 212,580 shares of unvested restricted stock as of September 30, 2018 and December, 31, 2017 respectively Our management uses certain non-GAAP (generally accepted accounting principles) financial measures to evaluate performance. We have included in this presentation information related these non-GAAP financial measures for the applicable periods presented. The following tables reconcile, as of the dates set forth below, total shareholders’ equity to tangible equity and presents book value per share and tangible book value per share: Tangible Book Value Per Share ($000) As of Sept 30, As of December 31, 2018 2017 2016 2015 2014 2013 Total Shareholders' Equity $ 471,851 $ 446,214 $ 357,637 $ 344,313 $ 329,252 $ 311,139 Adjustments: Goodwill 80,950 80,950 80,950 80,950 59,049 59,049 Other Intangibles 6,038 6,770 7,791 8,879 8,903 10,225 Tangible Equity $ 384,863 $ 358,494 $ 268,896 $ 254,484 $ 261,300 $ 241,865 Common Shares Outstanding (1) (2) 24,859 24,833 22,062 22,303 22,534 22,544 Book Value Per Share $ 19.0 $ 18.0 $ 16.2 $ 15.4 $ 14.6 $ 13.8 Tangible Book Value Per Share $ 15.5 $ 14.4 $ 12.2 $ 11.4 $ 11.6 $ 10.7 |

