Attached files
| file | filename |
|---|---|
| EX-99.1 - EX-99.1 - Regional Management Corp. | d634750dex991.htm |
| 8-K - 8-K - Regional Management Corp. | d634750d8k.htm |
Exhibit 99.2
3Q 2018 Earnings Call Supplemental Presentation November 8, 2018
Safe Harbor Statement This document contains summarized information concerning Regional Management Corp. (the “Company”) and the Company’s business, operations, financial performance, and trends. No representation is made that the information in this document is complete. For additional financial, statistical, and business information, please see the Company’s most recent Annual Report on Form 10?K and Quarterly Reports on Form 10?Q filed with the U.S. Securities and Exchange Commission (the “SEC”), as well as the Company’s other reports filed with the SEC from time to time. Such reports are or will be available on the Company’s website (www.regionalmanagement.com) and the SEC’s website (www.sec.gov). This presentation, the related remarks, and the responses to various questions may contain various “forward?looking statements” within the meaning of the Private Securities Litigation Reform Act of 1995, which represent the Company’s expectations or beliefs concerning future events. Words such as “may,” “will,” “should,” “likely,” “anticipates,” “expects,” “intends,” “plans,” “projects,” “believes,” “estimates,” “outlook,“and similar expressions may be used to identify these forward?looking statements. Such forward?looking statements are about matters that are inherently subject to risks and uncertainties, many of which are outside of the control of the Company. Factors that could cause actual results or performance to differ from the expectations expressed or implied in such forward?looking statements include, but are not limited to, the following: changes in general economic conditions, including levels of unemployment and bankruptcies; risks associated with the Company’s transition to a new loan origination and servicing software system; risks related to opening new branches, including the ability or inability to open new branches as planned; risks inherent in making loans, including repayment risks and value of collateral, which risks may increase in light of adverse or recessionary economic conditions; risks relating to the Company’s first asset?backed securitization; changes in interest rates; the risk that the Company’s existing sources of liquidity become insufficient to satisfy its needs or that its access to these sources becomes unexpectedly restricted; changes in federal, state, or local laws, regulations, or regulatory policies and practices, and risks associated with the manner in which laws and regulations are interpreted, implemented, and enforced; the impact of changes in tax laws, guidance, and interpretations, including related to certain provisions of the Tax Cuts andJobs Act; the timing and amount of revenues that may be recognized by the Company; changes in current revenue and expense trends (including trends affecting delinquencies and credit losses); changes in the Company’s markets and general changes in the economy (particularly in the markets served by the Company); changes in the competitive environment in which the Company operates or in the demand for its products; risks related to acquisitions; changes in operating and administrative expenses; and the departure, transition, or replacement of key personnel. Such factors and others are discussed in greater detail in the Company’s filings with the SEC. The Company cannot guarantee future events, results, actions, levels of activity, performance, or achievements. Except to the extent required by law, neither the Company nor any of its respective agents, employees, or advisors intend or have any duty or obligation to supplement, amend, update, or revise any forward?looking statement, whether as a result of new information, future developments, or otherwise. This presentation also contains certain non?GAAP measures. Please refer to the Appendix accompanying this presentation for a reconciliation of non?GAAP measures to the most comparable GAAP measures. The information and opinions contained in this document are provided as of the date of this presentation and are subject to change without notice. This document has not been approved by any regulatory or supervisory authority. 2
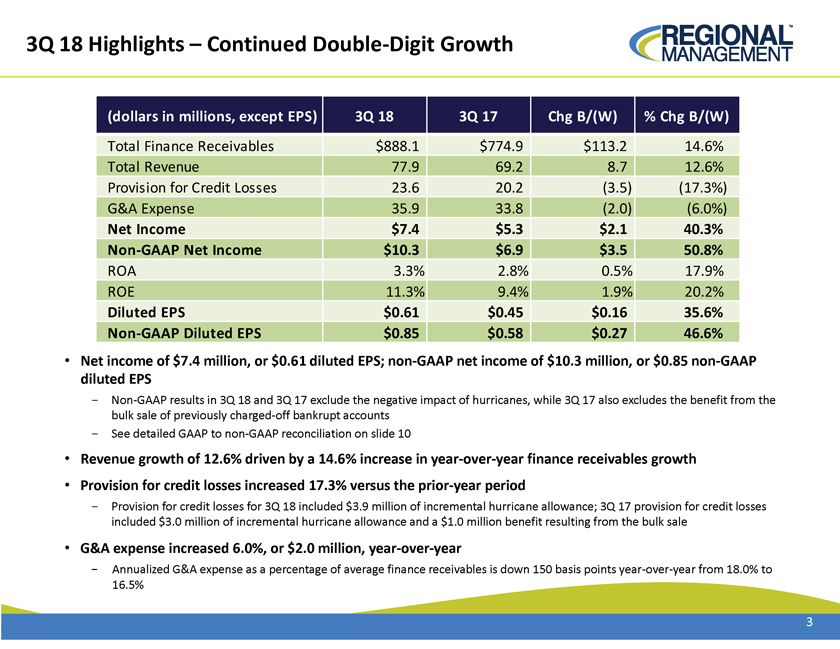
3Q 18 Highlights –Continued Double?Digit Growth (dollars in millions, except EPS) 3Q 18 3Q 17 Chg B/(W) % Chg B/(W) Total Finance Receivables $888.1 $774.9 $113.2 14.6% Total Revenue 77.9 69.2 8.7 12.6% Provision for Credit Losses 23.6 20.2 (3.5) (17.3%) G&A Expense 35.9 33.8 (2.0) (6.0%) Net Income $7.4 $5.3 $2.1 40.3% Non?GAAP Net Income $10.3 $6.9 $3.5 50.8% ROA 3.3% 2.8% 0.5% 17.9% ROE 11.3% 9.4% 1.9% 20.2% Diluted EPS $0.61 $0.45 $0.16 35.6% Non?GAAP Diluted EPS $0.85 $0.58 $0.27 46.6% • Net income of $7.4 million, or $0.61 diluted EPS; non?GAAP net income of $10.3 million, or $0.85 non?GAAP diluted EPS - Non?GAAP results in 3Q 18 and 3Q 17 exclude the negative impact of hurricanes, while 3Q 17 also excludes the benefit from the bulk sale of previously charged?off bankrupt accounts - See detailed GAAP to non?GAAP reconciliation on slide 10 • Revenue growth of 12.6% driven by a 14.6% increase in year?over?year finance receivables growth • Provision for credit losses increased 17.3% versus the prior?year period - Provision for credit losses for 3Q 18 included $3.9 million of incremental hurricane allowance; 3Q 17 provision for credit losses included $3.0 million of incremental hurricane allowance and a $1.0 million benefit resulting from the bulk sale • G&A expense increased 6.0%, or $2.0 million, year?over?year - Annualized G&A expense as a percentage of average finance receivables is down 150 basis points year?over?year from 18.0% to 16.5% 3
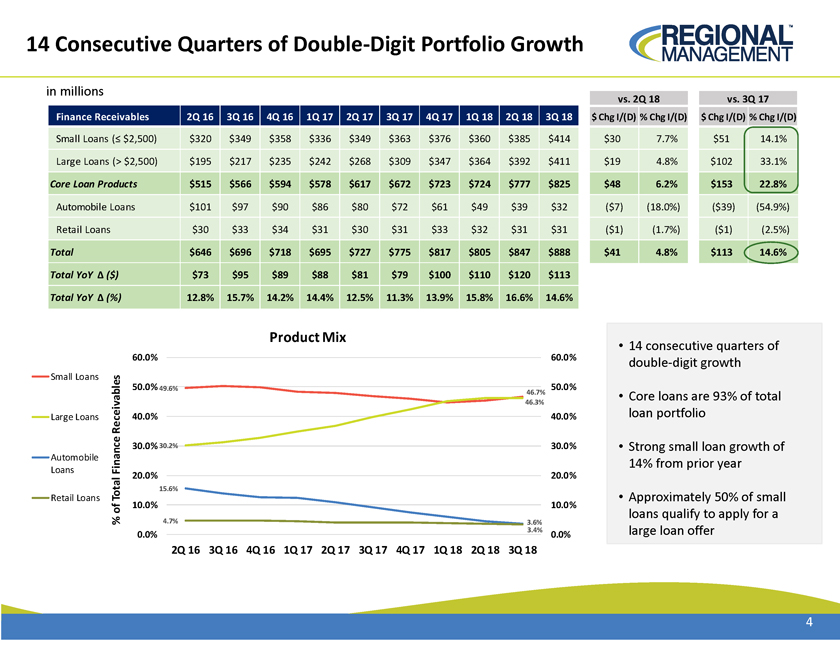
14 Consecutive Quarters of Double?Digit Portfolio Growth in millions Finance Receivables 2Q 16 3Q 16 4Q 16 1Q 17 2Q 17 3Q 17 4Q 17 1Q 18 2Q 18 3Q 18 Small Loans (? $2,500) $320 $349 $358 $336 $349 $363 $376 $360 $385 $414 Large Loans (> $2,500) $195 $217 $235 $242 $268 $309 $347 $364 $392 $411 Core Loan Products $515 $566 $594 $578 $617 $672 $723 $724 $777 $825 Automobile Loans $101 $97 $90 $86 $80 $72 $61 $49 $39 $32 Retail Loans $30 $33 $34 $31 $30 $31 $33 $32 $31 $31 Total $646 $696 $718 $695 $727 $775 $817 $805 $847 $888 Total YoY Ä ($) $73 $95 $89 $88 $81 $79 $100 $110 $120 $113 Total YoY Ä (%) 12.8% 15.7% 14.2% 14.4% 12.5% 11.3% 13.9% 15.8% 16.6% 14.6% vs. 2Q 18 vs. 3Q 17 $ Chg I/(D) % Chg I/(D) $ Chg I/(D) % Chg I/(D) $30 7.7% $51 14.1% $19 4.8% $102 33.1% $48 6.2% $153 22.8% ($7) (18.0%) ($39) (54.9%) ($1) (1.7%) ($1) (2.5%) $41 4.8% $113 14.6% • 14 consecutive quarters of double?digit growth • Core loans are 93% of total loan portfolio • Strong small loan growth of 14% from prior year • Approximately 50% of small loans qualify to apply for a large loan offer 4
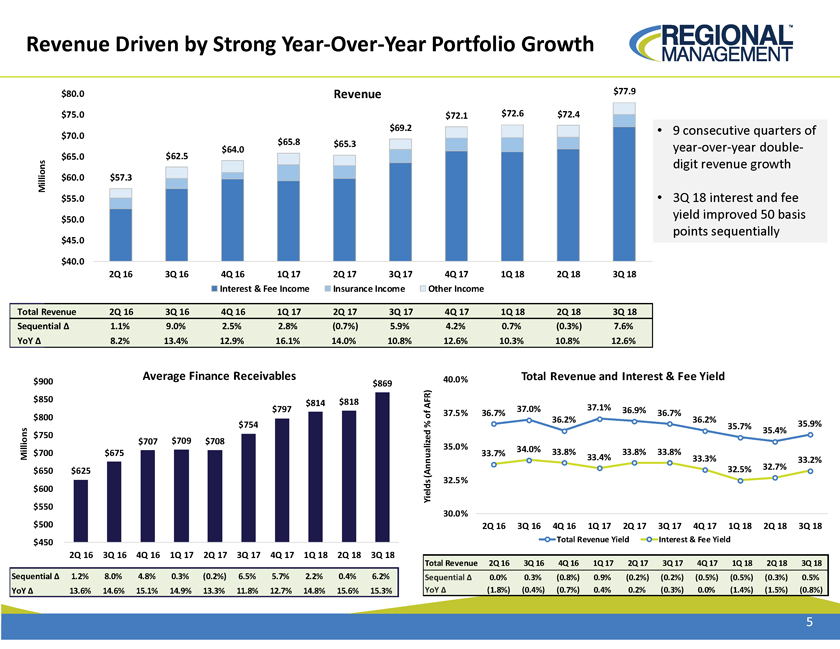
Revenue Driven by Strong Year?Over?Year Portfolio Growth $80.0 Revenue $77.9 $75.0 $72.1 $72.6 $72.4 $70.0 $69.2 $64.0 $65.8 $65.3 $65.0 $62.5 Millions $60.0 $57.3 $55.0 $50.0 $45.0 $40.0 2Q 16 3Q 16 4Q 16 1Q 17 2Q 17 3Q 17 4Q 17 1Q 18 2Q 18 3Q 18 Interest & Fee Income Insurance Income Other Income • 9 consecutive quarters of year?over?year double?digit revenue growth • 3Q 18 interest and fee yield improved 50 basis points sequentially Total Revenue 2Q 16 3Q 16 4Q 16 1Q 17 2Q 17 3Q 17 4Q 17 1Q 18 2Q 18 3Q 18 Sequential Ä 1.1% 9.0% 2.5% 2.8% (0.7%) 5.9% 4.2% 0.7% (0.3%) 7.6% YoY Ä 8.2% 13.4% 12.9% 16.1% 14.0% 10.8% 12.6% 10.3% 10.8% 12.6% Average Finance Receivables 40.0% Total Revenue and Interest & Fee Yield $900 $869 $850 $814 $818 $797 AFR) 37.5% 36.7% 37.0% 37.1% 36.9% 36.7% $800 of 36.2% 36.2% 35.9% $754 % 35.7% 35.4% $750 $707 $709 $708 35.0% 34.0% $700 $675 33.7% 33.8% 33.8% 33.8% Millions 33.4% 33.3% 33.2% 32.5% 32.7% $650 $625 (Annualized Yields 32.5% $600 $550 30.0% $500 2Q 16 3Q 16 4Q 16 1Q 17 2Q 17 3Q 17 4Q 17 1Q 18 2Q 18 3Q 18 $450 Total Revenue Yield Interest & Fee Yield 2Q 16 3Q 16 4Q 16 1Q 17 2Q 17 3Q 17 4Q 17 1Q 18 2Q 18 3Q 18 Total Revenue 2Q 16 3Q 16 4Q 16 1Q 17 2Q 17 3Q 17 4Q 17 1Q 18 2Q 18 3Q 18 Sequential Ä 1.2% 8.0% 4.8% 0.3% (0.2%) 6.5% 5.7% 2.2% 0.4% 6.2% Sequential Ä 0.0% 0.3% (0.8%) 0.9% (0.2%) (0.2%) (0.5%) (0.5%) (0.3%) 0.5% YoY Ä 13.6% 14.6% 15.1% 14.9% 13.3% 11.8% 12.7% 14.8% 15.6% 15.3% YoY Ä (1.8%) (0.4%) (0.7%) 0.4% 0.2% (0.3%) 0.0% (1.4%) (1.5%) (0.8%) 5
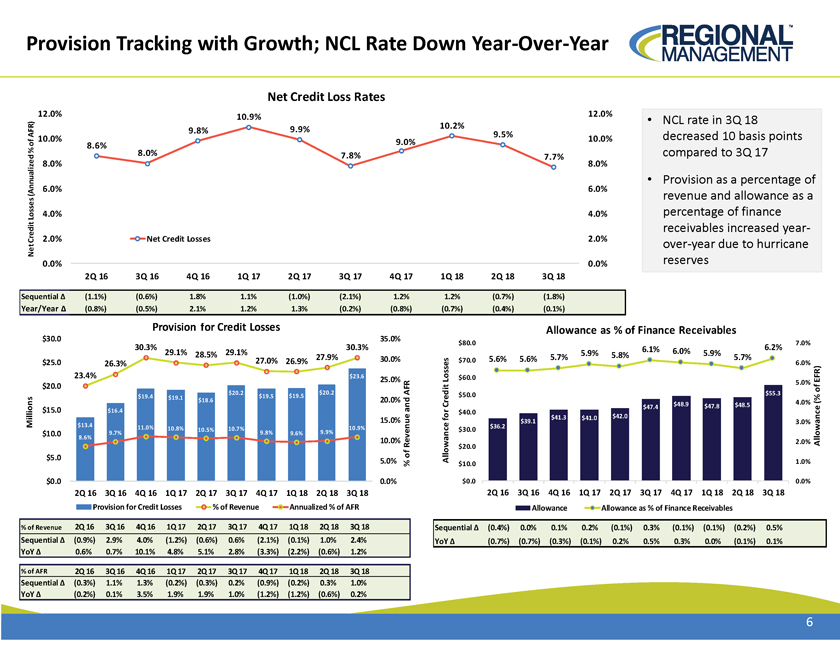
Provision Tracking with Growth; NCL Rate Down Year?Over?Year Net Credit Loss Rates 12.0% 10.9% 12.0% • NCL rate in 3Q 18 10.2% 9.8% 9.9% AFR) 10.0% 9.0% 9.5% 10.0% decreased 10 basis points of 8.6% % 8.0% 7.8% 7.7% compared to 3Q 17 8.0% 8.0% • Provision as a percentage of 6.0% 6.0% (Annualized revenue and allowance as a Losses 4.0% 4.0% percentage of finance Credit receivables increased year? 2.0% Net Credit Losses 2.0% Net over?year due to hurricane 0.0% 0.0% reserves 2Q 16 3Q 16 4Q 16 1Q 17 2Q 17 3Q 17 4Q 17 1Q 18 2Q 18 3Q 18 Sequential Ä (1.1%) (0.6%) 1.8% 1.1% (1.0%) (2.1%) 1.2% 1.2% (0.7%) (1.8%) Year/Year Ä (0.8%) (0.5%) 2.1% 1.2% 1.3% (0.2%) (0.8%) (0.7%) (0.4%) (0.1%) Provision for Credit Losses Allowance as % of Finance Receivables $30.0 35.0% $80.0 7.0% 30.3% 30.3% 6.1% 6.2% 29.1% 28.5% 29.1% 5.9% 6.0% 5.9% 27.9% 5.7% 5.8% 5.7% 27.0% 26.9% 30.0% $70.0 5.6% 5.6% $25.0 26.3% 6.0% 23.4% $23.6 $60.0 $20.0 25.0% Losses 5.0% EFR) $20.2 $20.2 AFR $55.3 of $19.4 $19.1 $19.5 $19.5 $50.0 $18.6 20.0% $48.9 $48.5 4.0% (% $15.0 and Credit $47.4 $47.8 $16.4 $40.0 $42.0 15.0% for $41.3 $41.0 $39.1 3.0% Millions $13.4 $36.2 9.7% 11.0% 10.8% 10.5% 10.7% 9.8% 9.9% 10.9% $30.0 $10.0 9.6% 8.6% 10.0% Revenue 2.0% Allowance $20.0 $5.0 5.0% of Allowance 1.0% % $10.0 $0.0 0.0% $0.0 0.0% 2Q 16 3Q 16 4Q 16 1Q 17 2Q 17 3Q 17 4Q 17 1Q 18 2Q 18 3Q 18 2Q 16 3Q 16 4Q 16 1Q 17 2Q 17 3Q 17 4Q 17 1Q 18 2Q 18 3Q 18 Provision for Credit Losses % of Revenue Annualized % of AFR Allowance Allowance as % of Finance Receivables % of Revenue 2Q 16 3Q 16 4Q 16 1Q 17 2Q 17 3Q 17 4Q 17 1Q 18 2Q 18 3Q 18 Sequential Ä (0.4%) 0.0% 0.1% 0.2% (0.1%) 0.3% (0.1%) (0.1%) (0.2%) 0.5% Sequential Ä (0.9%) 2.9% 4.0% (1.2%) (0.6%) 0.6% (2.1%) (0.1%) 1.0% 2.4% YoY Ä (0.7%) (0.7%) (0.3%) (0.1%) 0.2% 0.5% 0.3% 0.0% (0.1%) 0.1% YoY Ä 0.6% 0.7% 10.1% 4.8% 5.1% 2.8% (3.3%) (2.2%) (0.6%) 1.2% % of AFR 2Q 16 3Q 16 4Q 16 1Q 17 2Q 17 3Q 17 4Q 17 1Q 18 2Q 18 3Q 18 Sequential Ä (0.3%) 1.1% 1.3% (0.2%) (0.3%) 0.2% (0.9%) (0.2%) 0.3% 1.0% YoY Ä (0.2%) 0.1% 3.5% 1.9% 1.9% 1.0% (1.2%) (1.2%) (0.6%) 0.2% 6
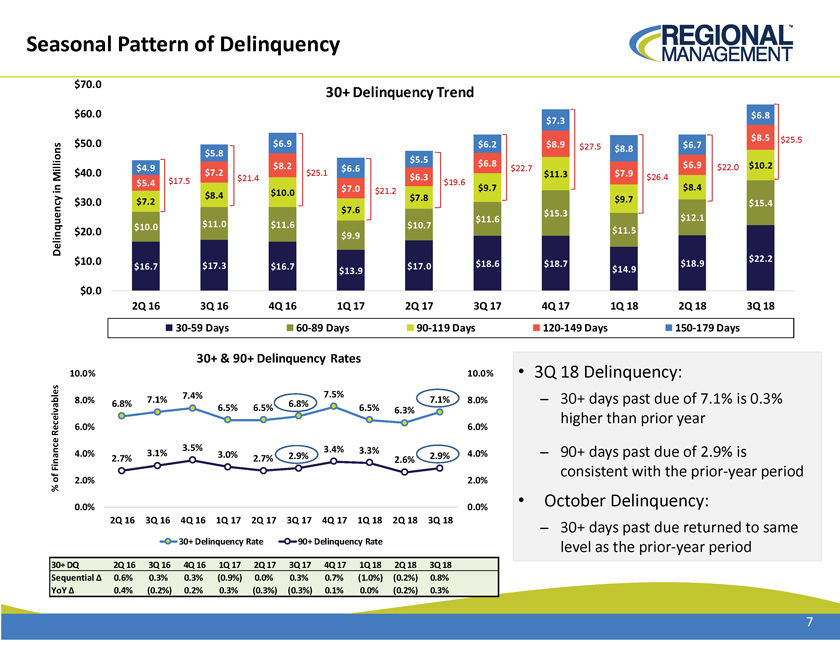
Seasonal Pattern of Delinquency $70.0 30+ Delinquency Trend $60.0 $6.8 $7.3 $8.5 $25.5 $50.0 $6.9 $6.2 $8.9 $27.5 $6.7 $8.8 $5.8 $5.5 $8.2 $6.8 $6.9 $10.2 $4.9 $6.6 $22.7 $22.0 $40.0 $7.2 $25.1 $11.3 $7.9 $21.4 $6.3 $26.4 Millions $5.4 $17.5 $19.6 in $7.0 $21.2 $9.7 $8.4 Delinquency $8.4 $10.0 $7.8 $9.7 $30.0 $7.2 $15.4 $7.6 $15.3 $12.1 $11.6 $10.0 $11.0 $11.6 $10.7 $20.0 $11.5 $9.9 $10.0 $22.2 $16.7 $17.3 $16.7 $17.0 $18.6 $18.7 $18.9 $13.9 $14.9 $0.0 2Q 16 3Q 16 4Q 16 1Q 17 2Q 17 3Q 17 4Q 17 1Q 18 2Q 18 3Q 18 30?59 Days 60?89 Days 90?119 Days 120?149 Days 150?179 Days 30+ & 90+ Delinquency Rates 10.0% 10.0% • 3Q 18 Delinquency: 7.4% 7.5% 8.0% 7.1% 7.1% 8.0% ?30+ days past due of 7.1% is 0.3% 6.8% 6.8% 6.5% 6.5% 6.5% 6.3% higher than prior year 6.0% 6.0% Receivables 3.5% 3.4% 3.3% 4.0% 3.1% 3.0% 2.9% 2.9% 4.0% ?90+ days past due of 2.9% is Finance 2.7% 2.7% 2.6% consistent with the prior?year period 2.0% 2.0% 0.0% 0.0% • October Delinquency: 2Q 16 3Q 16 4Q 16 1Q 17 2Q 17 3Q 17 4Q 17 1Q 18 2Q 18 3Q 18 ?30+ days past due returned to same 30+ Delinquency Rate 90+ Delinquency Rate level as the prior?year period 30+ DQ 2Q 16 3Q 16 4Q 16 1Q 17 2Q 17 3Q 17 4Q 17 1Q 18 2Q 18 3Q 18 Sequential Ä 0.6% 0.3% 0.3% (0.9%) 0.0% 0.3% 0.7% (1.0%) (0.2%) 0.8% YoY Ä 0.4% (0.2%) 0.2% 0.3% (0.3%) (0.3%) 0.1% 0.0% (0.2%) 0.3% 7
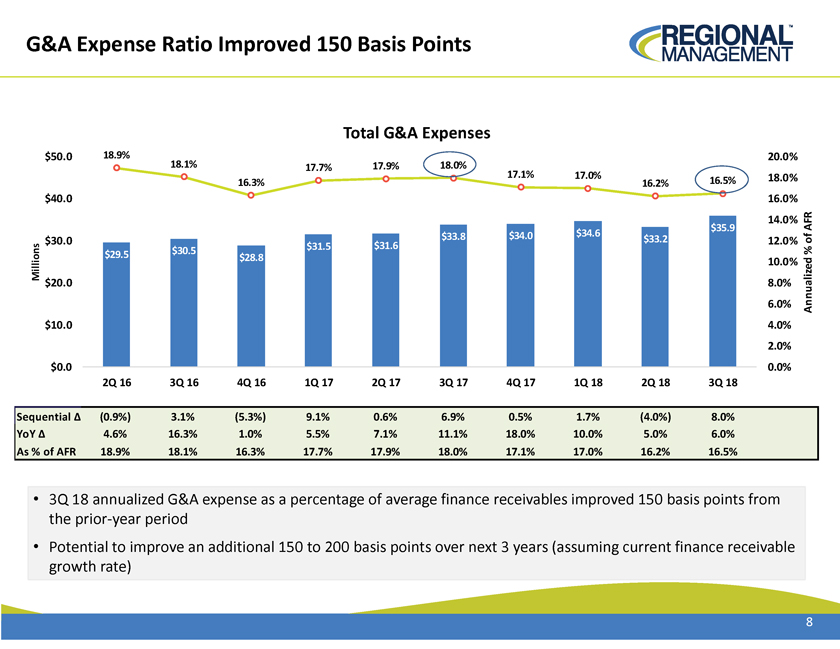
G&A Expense Ratio Improved 150 Basis Points Total G&A Expenses $50.0 18.9% 20.0% 18.1% 17.7% 17.9% 18.0% 17.1% 17.0% 18.0% 16.3% 16.2% 16.5% $40.0 16.0% 14.0% $34.0 $34.6 $35.9 AFR $33.8 $33.2 $30.0 $31.5 $31.6 12.0% of $29.5 $30.5 % Millions $28.8 10.0% $20.0 8.0% 6.0% Annualized $10.0 4.0% 2.0% $0.0 0.0% 2Q 16 3Q 16 4Q 16 1Q 17 2Q 17 3Q 17 4Q 17 1Q 18 2Q 18 3Q 18 Sequential Ä (0.9%) 3.1% (5.3%) 9.1% 0.6% 6.9% 0.5% 1.7% (4.0%) 8.0% YoY Ä 4.6% 16.3% 1.0% 5.5% 7.1% 11.1% 18.0% 10.0% 5.0% 6.0% As % of AFR 18.9% 18.1% 16.3% 17.7% 17.9% 18.0% 17.1% 17.0% 16.2% 16.5% • 3Q 18 annualized G&A expense as a percentage of average finance receivables improved 150 basis points from the prior?year period • Potential to improve an additional 150 to 200 basis points over next 3 years (assuming current finance receivable growth rate) 8
Appendix 9
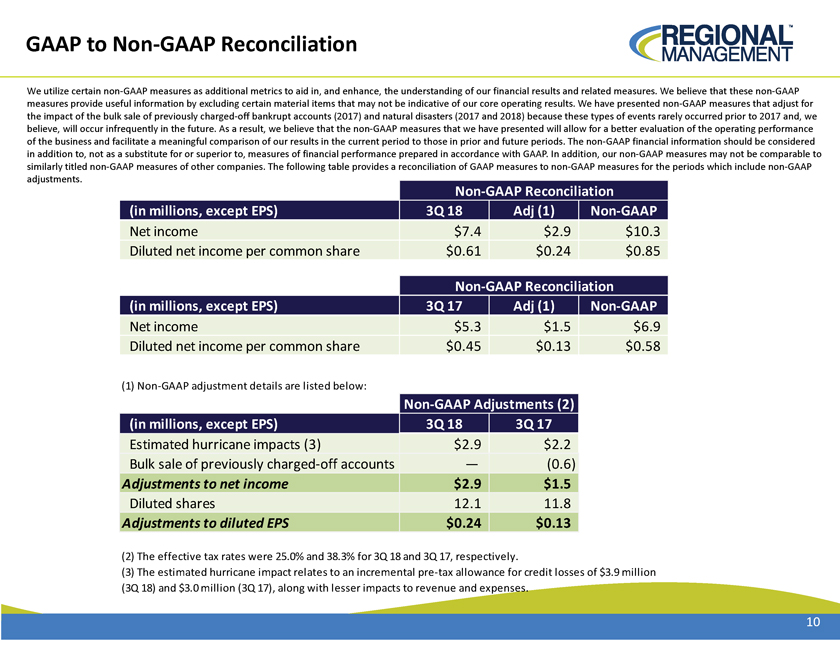
GAAP to Non?GAAP Reconciliation We utilize certain non?GAAP measures as additional metrics to aid in, and enhance, the understanding of our financial results and related measures. We believe that these non?GAAP measures provide useful information by excluding certain material items that may not be indicative of our core operating results. We have presented non?GAAP measures that adjust for the impact of the bulk sale of previously charged?off bankrupt accounts (2017) and natural disasters (2017 and 2018) because these types of events rarely occurred prior to 2017 and, we believe, will occur infrequently in the future. As a result, we believe that the non?GAAP measures that we have presented will allow for a better evaluation of the operating performance of the business and facilitate a meaningful comparison of our results in the current period to those in prior and future periods. The non?GAAP financial information should be considered in addition to, not as a substitute for or superior to, measures of financial performance prepared in accordance with GAAP. In addition, our non?GAAP measures may not be comparable to similarly titled non?GAAP measures of other companies. The following table provides a reconciliation of GAAP measures to non?GAAP measures for the periods which include non?GAAP adjustments. Non?GAAP Reconciliation (in millions, except EPS) 3Q 18 Adj (1) Non?GAAP Net income $7.4 $2.9 $10.3 Diluted net income per common share $0.61 $0.24 $0.85 Non?GAAP Reconciliation (in millions, except EPS) 3Q 17 Adj (1) Non?GAAP Net income $5.3 $1.5 $6.9 Diluted net income per common share $0.45 $0.13 $0.58 (1) Non?GAAP adjustment details are listed below: Non?GAAP Adjustments (2) (in millions, except EPS) 3Q 18 3Q 17 Estimated hurricane impacts (3) $2.9 $2.2 Bulk sale of previously charged?off accounts — (0.6) Adjustments to net income $2.9 $1.5 Diluted shares 12.1 11.8 Adjustments to diluted EPS $0.24 $0.13 (2) The effective tax rates were 25.0% and 38.3% for 3Q 18 and 3Q 17, respectively. (3) The estimated hurricane impact relates to an incremental pre?tax allowance for credit losses of $3.9 million (3Q 18) and $3.0 million (3Q 17), along with lesser impacts to revenue and expenses. 10