Attached files
| file | filename |
|---|---|
| EX-99.1 - EX-99.1 - Ready Capital Corp | a18-39785_1ex99d1.htm |
| 8-K - 8-K - Ready Capital Corp | a18-39785_18k.htm |

DISCLAIMER FORWARD LOOKING STATEMENTS T hi s presentati on contai ns statements that consti tute “forward-looki ng statements,” as such term is defi ned in Secti on 27A of the Securi ti es Act of 1933, as amended, and Secti on 21E of the Securi ti es Exchange Act of 1934, as amended, and such statements are intended to be covered by the safe harbors provi ded by the same. T hese statements are based on current expectati ons of Ready Capi tal Corporati on (“RC”) and Owens Real ty Mortgage, Inc. (“ORM”) and are subj ect to a number of trends and uncertai nties that coul d cause actual resul ts to di ffer materi all y from those descri bed in the forward-looki ng statements; nei ther RC nor ORM can gi ve any assurance that expectati ons wi l l be attained. Factors that coul d cause actual resul ts to di ffer materi all y from expectati ons i nclude, but are not l imi ted to, the ri sk that the merger will not be consummated wi thin the expected ti me period or at al l; the occurrence of any event, change or other ci rcumstances that coul d gi ve ri se to the termi nati on of the merger agreement; the i nabi li ty to obtain stockholder approval s relati ng to the merger or the fai lure to sati sfy the other condi ti ons to compl eti on of the merger; fluctuati ons in the adj usted book value per share of the shares of both RC and ORM ; ri sks rel ated to di srupti on of management attenti on from the compani es’ ongoi ng busi ness operati ons due to the proposed merger; the effect of the announcement of the proposed merger on RC's and ORM’s operating resul ts and busi nesse s generall y; the outcome of any l egal proceedi ngs rel ati ng to the merger; changes in future loan acqui si ti on and production; the abili ty to retai n key personnel ; availabil ity of sui tabl e i nvestment opportuni ties; changes in i nterest rates; changes in the yi eld curve; changes in prepayment rates; the avai labili ty and terms of financing; general economi c condi ti ons; market condi ti ons; conditions in the market for mortgage-rel ated i nvestments; legi sl ati ve and regul atory changes that coul d adversel y affect the businesse s of RC and ORM; and other factors, i ncl uding those set forth in the Ri sk Factors secti on of RC and ORM’s most recent Annual Reports on Form 10-K and Quarterl y Report on Form 10-Q fil ed wi th the U.S. Securi ti es and Exchange Commi ssi on (the “SEC”), and other reports fil ed by RC and ORM with the SEC, copi es of whi ch are avail abl e on the SEC’s websi te, www.sec.gov. Nei ther RC nor ORM assumes any responsi bili ty for i nformati on rel ati ng to the other, and nei ther ORM nor RC undertakes any obl i gation to update these statements for revi si ons or changes after the date of thi s presentati on, except as requi red by l aw. ADDITIONAL INFORMATION REGARDING THE MERGER In connection wi th the merger, RC expects to fil e a regi strati on statement on Form S-4 wi th the SEC that i ncludes a preli mi nary j oi nt proxy statement/prospectus, and will fil e other rel evant documents concerni ng the proposed merger. T he regi strati on statement filed wi ll be subject to revi sions pri or to bei ng decl ared effecti ve by the SEC, some of whi ch revi si ons may be si gnifi cant. T he regi strati on statement and j oi nt proxy statement/prospectus wi ll contain important i nformation about the proposed merger and related matters. Before making any v oting or investment decisions, investors are urged to read the definitiv e j oint proxy statement / prospectus and any other documents to be filed w ith the SEC in connection with the merger or incorporated by reference in the definitiv e j oint proxy statement / prospectus because they w ill contain important information about ORM, RC and the merger. Stockholders of ORM and RC may obtai n free copies of the regi strati on statement and other rel evant documents fil ed by RC with the SEC (as they become avail able) through the websi te mai ntained by the SEC at www.sec.gov. Copi es of the documents fi l ed by RC wi th the SEC are al so avai l able free of charge on RC’s websi te at www.readycapi tal .com. T hi s communi cati on shall not consti tute an offer to sell or the soli ci tati on of an offer to buy any securi ti es, nor shall there be any sale of securi ti es in any juri sdi ction in whi ch such offer, sol i ci tation or sal e would be unlawful pri or to regi strati on or quali fi cati on under the securities l aws of any such j uri sdi cti on. No offeri ng of securi ti es shal l be made except by means of a prospectus meeti ng the requirements of Secti on 10 of the U.S. Securi ti es Act of 1933, as amended. 2
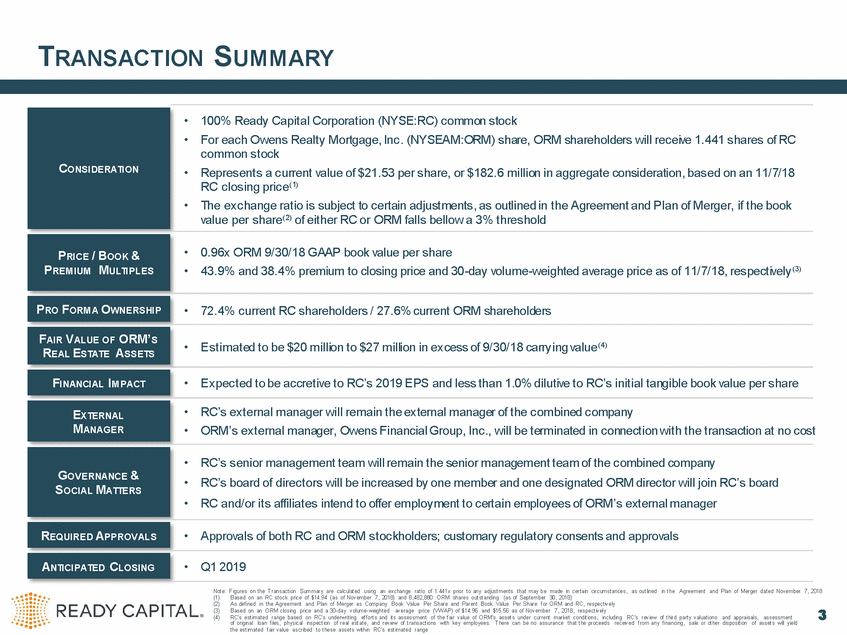
TRANSACTION SUMMARY • Estimated to be $20 million to $27 million in excess of 9/30/18 carrying value t Note: Figures on the Transaction Summary are calculated using an exchange ratio of 1.441x prior to any adjustments that may be made in certain circumstances, as outlined in the Agreement and Plan of Merger dated November 7, 2018 (1) (2) (3) (4) Based on an RC stock price of $14.94 (as of November 7, 2018) and 8,482,880 ORM shares outstanding (as of September 30, 2018) As defined in the Agreement and Plan of Merger as Company Book Value Per Share and Parent Book Value Per Share for ORM and RC, respectively Based on an ORM closing price and a 30-day volume-weighted average price (VWAP) of $14.96 and $15.56 as of November 7, 2018, res pectively 3 RC’s estimated range based on RC’s underwriting efforts and its assessment of the fair value of ORM’s assets under current market conditions, including RC’s review of third party valuations and appraisals, assessment of original loan files, physical inspection of real estate, and review of transactions with key employees. There can be no assurance that the proceeds received from any financing, sale or other disposition of assets will yield the estimated fair value ascribed to these assets within RC’s estimated range CONSIDERATION • 100% Ready Capital Corporation (NYSE:RC) common stock •For each Owens Realty Mortgage, Inc. (NYSEAM:ORM) share, ORM shareholders will receive 1.441 shares of RC common stock •Represents a current value of $21.53 per share, or $182.6 million in aggregate consideration, based on an 11/7/18 RC closing price(1) • The exchange ratio is subject to certain adjustments, as outlined in the Agreement and Plan of Merger, if the book value per share(2) of either RC or ORM falls bellow a 3% threshold PRICE / BOOK & PREMIUM MULTIPLES •0.96x ORM 9/30/18 GAAP book value per share • 43.9% and 38.4% premium to closing price and 30-day volume-weighted average price as of 11/7/18, respectively(3) PRO FORMA OWNERSHIP • 72.4% current RC shareholders / 27.6% current ORM shareholders FAIR VALUE OF ORM’S REAL ESTATE ASSETS (4) FINANCIAL IMPACT •Expected to be accretive to RC’s 2019 EPS and less than 1.0% dilutive to RC’s initial tangible book value per share EXTERNAL MANAGER •RC’s external manager will remain the external manager of the combined company •ORM’s external manager, Owens Financial Group, Inc., will be terminated in connection with the transaction at no cos GOVERNANCE & SOCIAL MATTERS •RC’s senior management team will remain the senior management team of the combined company •RC’s board of directors will be increased by one member and one designated ORM director will join RC’s board •RC and/or its affiliates intend to offer employment to certain employees of ORM’s external manager REQUIRED APPROVALS •Approvals of both RC and ORM stockholders; customary regulatory consents and approvals ANTICIPATED CLOSING •Q1 2019
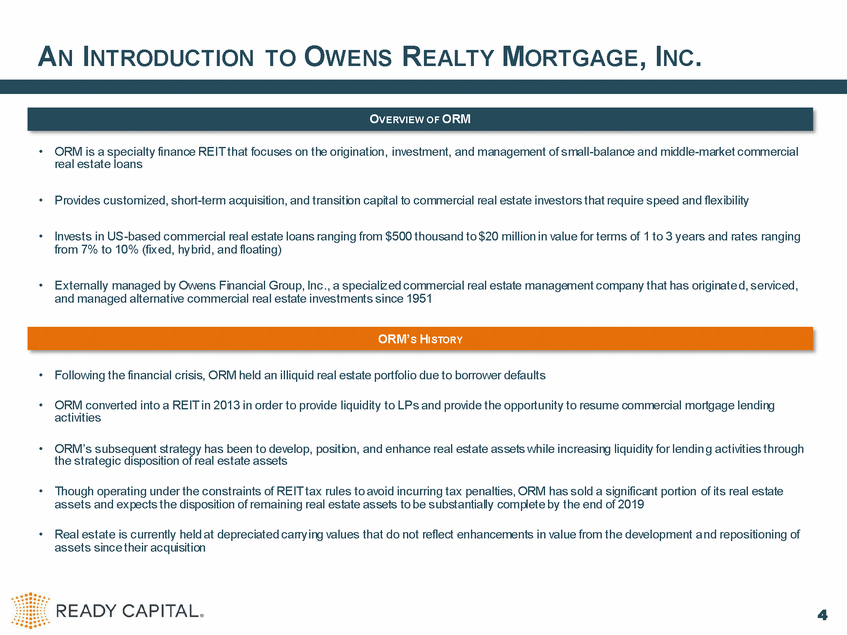
AN INTRODUCTION TO OWENS REALTY MORTGAGE, INC. • ORM is a specialty finance REIT that focuses on the origination, investment, and management of small-balance and middle-market commercial real estate loans • Provides customized, short-term acquisition, and transition capital to commercial real estate investors that require speed and flexibility • Invests in US-based commercial real estate loans ranging from $500 thousand to $20 million in value for terms of 1 to 3 years and rates ranging from 7% to 10% (fixed, hybrid, and floating) • Externally managed by Owens Financial Group, Inc., a specialized commercial real estate management company that has originate d, serviced, and managed alternative commercial real estate investments since 1951 • Following the financial crisis, ORM held an illiquid real estate portfolio due to borrower defaults • ORM converted into a REIT in 2013 in order to provide liquidity to LPs and provide the opportunity to resume commercial mortgage lending activities • ORM’s subsequent strategy has been to develop, position, and enhance real estate assets while increasing liquidity for lendin g activities through the strategic disposition of real estate assets • Though operating under the constraints of REIT tax rules to avoid incurring tax penalties, ORM has sold a significant portion of its real estate assets and expects the disposition of remaining real estate assets to be substantially complete by the end of 2019 • Real estate is currently held at depreciated carrying values that do not reflect enhancements in value from the development a nd repositioning of assets since their acquisition 4 ORM’S HISTORY OVERVIEW OF ORM
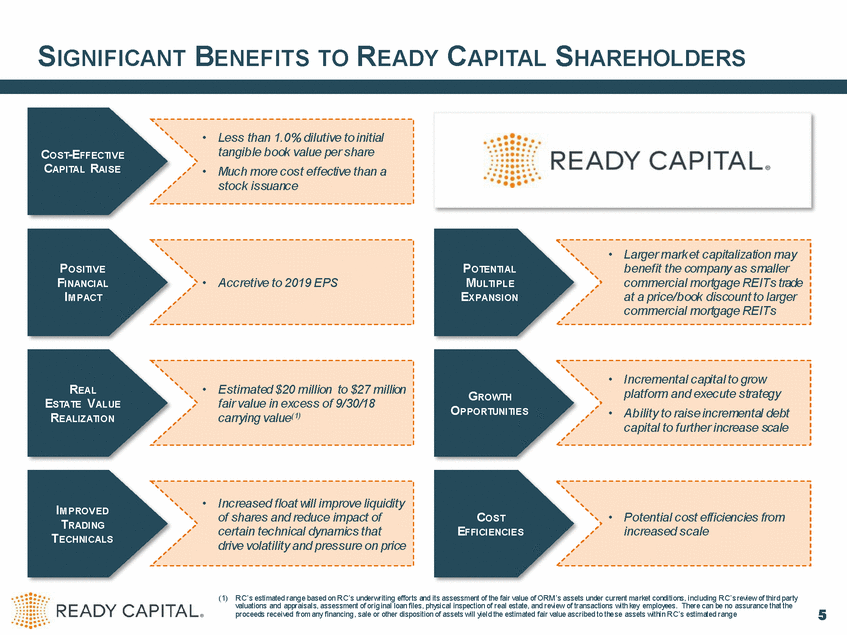
SIGNIFICANT BENEFITS TO READY CAPITAL SHAREHOLDERS • Less than 1.0% dilutive to initial tangible book value per share Much more cost effective than a stock issuance COST-EFFECTIVE CAPITAL RAISE • • Larger mark et capitalization may benefit the company as smaller commercial mortgage REITs trade at a price/book discount to larger commercial mortgage REITs POSITIVE FINANCIAL IMPACT POTENTIAL MULTIPLE EXPANSION • Accretive to 2019 EPS • Incremental capital to grow platform and execute strategy Ability to raise incremental debt capital to further increase scale REAL ESTATE VALUE REALIZATION • Estimated $20 million to $27 million fair value in excess of 9/30/18 carrying value(1) GROWTH OPPORTUNITIES • • Increased float will improve liquidity of shares and reduce impact of certain technical dynamics that drive volatility and pressure on price IMPROVED TRADING TECHNICALS COST EFFICIENCIES • Potential cost efficiencies from increased scale (1) RC’s estimated range based on RC’s underwriting efforts and its assessment of the fair value of ORM’s assets under current market conditions, including RC’s review of third party valuations and appraisals, assessment of orig inal loan files, physical inspection of real estate, and review of transactions with key employees. There can be no assurance that the proceeds received from any financing, sale or other disposition of assets will yield the estimated fair value ascribed to these assets within RC’s estimated range 5
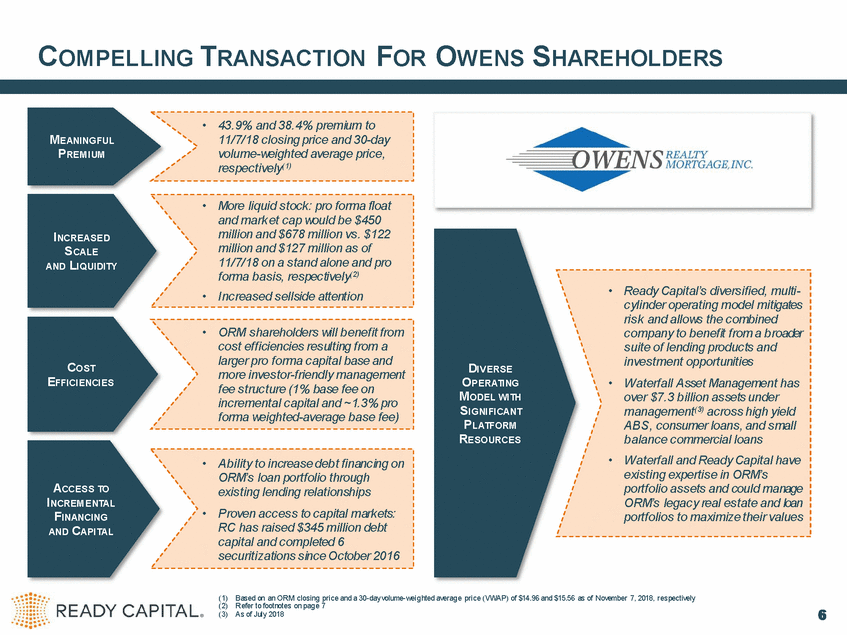
COMPELLING TRANSACTION FOR OWENS SHAREHOLDERS • 43.9% and 38.4% premium to 11/7/18 closing price and 30-day volume-weighted average price, respectively(1) MEANINGFUL PREMIUM • More liquid stock: pro forma float and mark et cap would be $450 million and $678 million vs. $122 million and $127 million as of 11/7/18 on a stand alone and pro forma basis, respectively(2) Increased sellside attention INCREASED SCALE AND LIQUIDITY • Ready Capital’s diversified, multi-cylinder operating model mitigates risk and allows the combined company to benefit from a broader suite of lending products and investment opportunities Waterfall Asset Management has over $7.3 billion assets under management(3) across high yield ABS, consumer loans, and small balance commercial loans Waterfall and Ready Capital have existing expertise in ORM’s portfolio assets and could manage ORM’s legacy real estate and loan portfolios to maximize their values • • ORM shareholders will benefit from cost efficiencies resulting from a larger pro forma capital base and more investor-friendly management fee structure (1% base fee on incremental capital and ~1.3% pro forma weighted-average base fee) COST EFFICIENCIES DIVERSE OPERATING MODEL WITH SIGNIFICANT PLATFORM RESOURCES • • • Ability to increase debt financing on ORM’s loan portfolio through existing lending relationships Proven access to capital markets: RC has raised $345 million debt capital and completed 6 securitizations since October 2016 ACCESS TO INCREMENTAL FINANCING AND CAPITAL • (1) Based on an ORM closing price and a 30-day volume-weighted average price (VWAP) of $14.96 and $15.56 as of November 7, 2018, respectively (2) Refer to footnotes on pag e 7 (3) As of July 2018 6
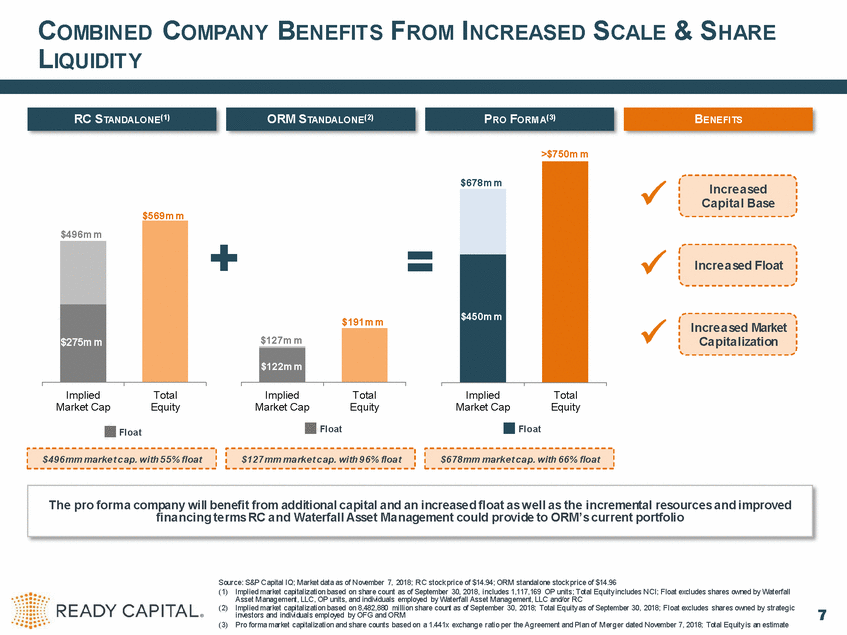
COMBINED COMPANY LIQUIDIT Y BENEFIT S FROM INCREASED SCALE & SHARE >$750m m Increased Capital Base $569m m Increased Float $191m m Increased Market Capitalization Implied Market Cap Total Equity Implied Market Cap Total Equity Implied Market Cap Total Equity Float Float Float Source: S&P Capital IQ; Market data as of November 7, 2018; RC stock price of $14.94; ORM standalone stock price of $14.96 (1) Implied market capitalization based on share count as of September 30, 2018, includes 1,117,169 OP units; Total Equity includes NCI; Float excludes shares owned by Waterfall Asset Manag ement, LLC, OP units, and individuals employed by Waterfall Asset Manag ement, LLC and/or RC Implied market capitalization based on 8,482,880 million share count as of September 30, 2018; Total Equity as of September 30, 2018; Float excludes shares owned by strategic investors and individuals employed by OFG and ORM Pro forma market capitalization and share counts based on a 1.441x exchange ratio per the Agreement and Plan of Merger dated November 7, 2018; Total Equity is an estimate (2) 7 (3) The pro forma company will benefit from additional capital and an increased float as w ell as the incremental resources and improved financing terms RC and Waterfall Asset Management could provide to ORM’s current portfolio $678mm market cap. with 66% float $127mm market cap. with 96% float $496mm market cap. with 55% float $127m m $122m m $496m m $275m m $678m m $450m m BENEFITS PRO FORMA(3) ORM STANDALONE(2) RC STANDALONE(1)
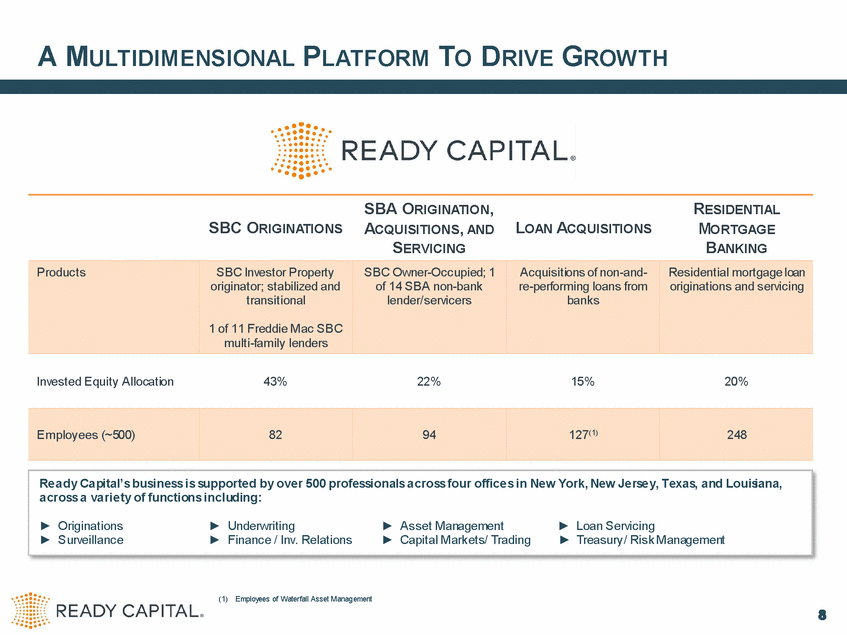
A MULTIDIMENSIONAL PLATFORM TO DRIVE GROWTH SBA ORIGINATION, ACQUISITIONS, AND SERVICING RESIDENTIAL MORTGAGE BANKING SBC ORIGINATIONS LOAN ACQUISITIONS Invested Equity Allocation 43% 22% 15% 20% (1) Employees of Waterfall Asset Management 8 Ready Capital’s business is supported by over 500 professionals across four offices in New York, New Jersey, Texas, and Louisiana, across a variety of functions including: Originations Underwriting Asset Management Loan Servicing Surveillance Finance / Inv. Relations Capital Markets/ Trading Treasury/ Risk Management Employees (~500)8294127(1)248 ProductsSBC Investor PropertySBC Owner-Occupied; 1 Acquisitions of non-and-Residential mortgage loan originator; stabilized andof 14 SBA non-bankre-performing loans from originations and servicing transitional lender/servicersbanks 1 of 11 Freddie Mac SBC multi-family lenders
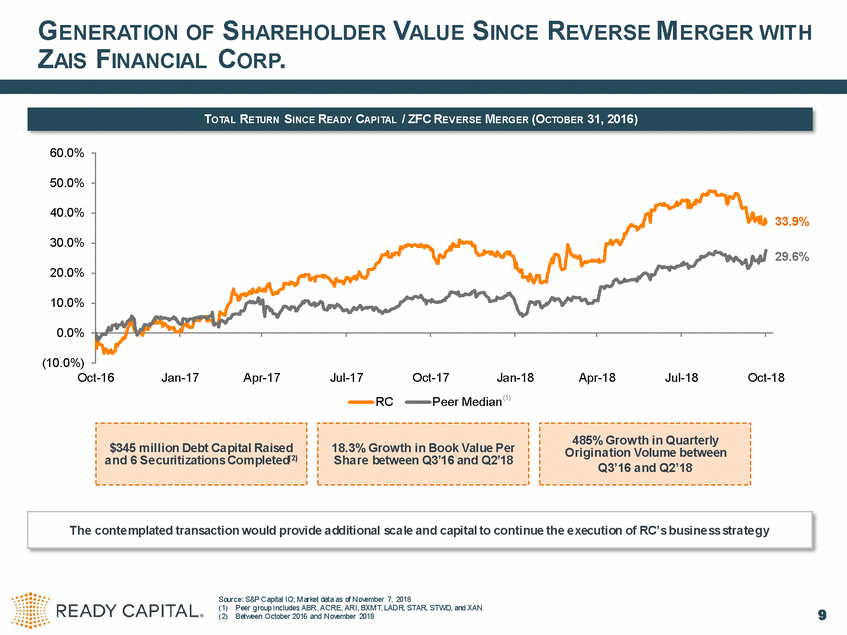
GENERAT ION OF SHAREHOLDER VALUE SINCE REVERSE MERGER WIT H ZAIS FINANCIAL CORP. 60.0% 50.0% 40.0% 33.9% 30.0% 29.6% 20.0% 10.0% 0.0% (10.0%) Oct-16 Jan-17 Apr-17 Jul-17 Oct-17 Jan-18 Apr-18 Jul-18 Oct-18 Peer Median (1) RC Origination Volume between Source: S&P Capital IQ; Market data as of November 7, 2018 (1) Peer g roup includes ABR, ACRE, ARI, BXMT, LADR, STAR, STWD, and XAN (2) Between October 2016 and November 2018 9 The contemplated transaction would provide additional scale and capital to continue the execution of RC’s business strategy 485% Growth in Quarterly Q3’16 and Q2’18 18.3% Growth in Book Value Per Share between Q3’16 and Q2’18 $345 million Debt Capital Raised and 6 Securitizations Completed(2) TOTAL RETURN SINCE READY CAPITAL / ZFC REVERSE MERGER (OCTOBER 31, 2016)
APPENDIX 10

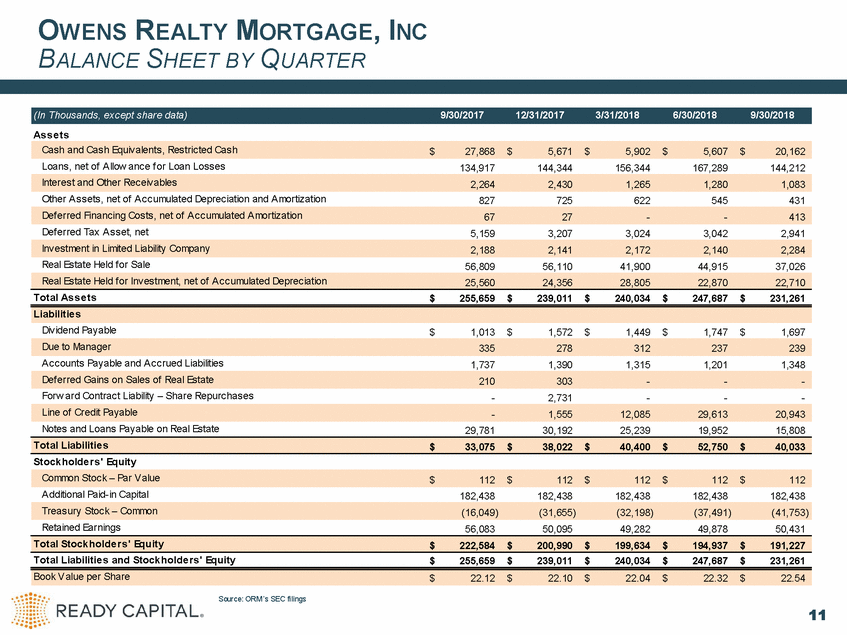
OWENS REALTY MORTGAGE, BALANCE SHEET BY QUARTER INC As s e ts Loans, net of Allow ance f or Loan Losses 134,917 144,344 156,344 167,289 144,212 Other Assets, net of Accumulated Depreciation and Amortization 827 725 622 545 431 Def erred Tax Asset, net 5,159 3,207 3,024 3,042 2,941 Real Estate Held f or Sale 56,809 56,110 41,900 44,915 37,026 Total As s e ts $ 255,659 $ 239,011 $ 240,034 $ 247,687 $ 231,261 Dividend Payable $ 1,013 $ 1,572 $ 1,449 $ 1,747 $ 1,697 Accounts Payable and Accrued Liabilities 1,737 1,390 1,315 1,201 1,348 Forw ard Contract Liability – Share Repurchases - 2,731 - - - Notes and Loans Payable on Real Estate 29,781 30,192 25,239 19,952 15,808 Stock holde rs ' Equity Additional Paid-in Capital 182,438 182,438 182,438 182,438 182,438 Retained Earnings 56,083 50,095 49,282 49,878 50,431 Total Liabilitie s and Stock holde rs ' Equity $ 255,659 $ 239,011 $ 240,034 $ 247,687 $ 231,261 Source: ORM’s SEC filings 11 Book Value per Share$22.12$22.10 $22.04 $22.32 $22.54 Total Stock holde rs ' Equity$222,584$200,990$199,634$194,937$191,227 Treasury Stock – Common(16,049)(31,655)(32,198)(37,491)(41,753) Common Stock – Par Value$112$112 $112 $112 $112 Total Liabilitie s$33,075 $38,022 $40,400$52,750$40,033 Line of Credit Payable-1,55512,08529,61320,943 Def erred Gains on Sales of Real Estate210303---Due to Manager335278312237239 Liabilitie s Real Estate Held f or Investment, net of Accumulated Depreciation25,56024,35628,80522,87022,710 Investment in Limited Liability Company2,1882,1412,1722,1402,284 Def erred Financing Costs, net of Accumulated Amortization6727--413 Interest and Other Receivables2,2642,4301,2651,2801,083 Cash and Cash Equivalents, Restricted Cash$27,868 $5,671 $5,902 $5,607 $20,162 (In Thousands, except share data)9/30/201712/31/20173/31/20186/30/20189/30/2018
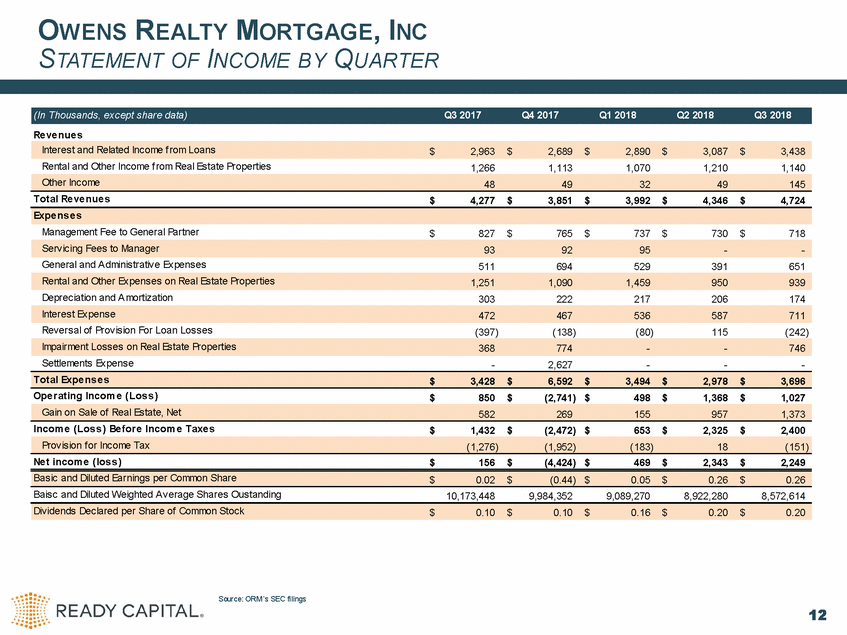
OWENS REALTY MORTGAGE, INC STATEMENT OF INCOME QUARTER BY Re ve nue s Rental and Other Income f rom Real Estate Properties 1,266 1,113 1,070 1,210 1,140 Total Re ve nue s $ 4,277 $ 3,851 $ 3,992 $ 4,346 $ 4,724 Management Fee to General Partner $ 827 $ 765 $ 737 $ 730 $ 718 General and Administrative Expenses 511 694 529 391 651 Depreciation and Amortization 303 222 217 206 174 Reversal of Provision For Loan Losses (397) (138) (80) 115 (242) Settlements Expense - 2,627 - - - Ope rating Incom e (Los s ) $ 850 $ (2,741) $ 498 $ 1,368 $ 1,027 Incom e (Los s ) Be fore Incom e Taxe s $ 1,432 $ (2,472) $ 653 $ 2,325 $ 2,400 Ne t incom e (los s ) $ 156 $ (4,424) $ 469 $ 2,343 $ 2,249 Baisc and Diluted Weighted Average Shares Oustanding 10,173,448 9,984,352 9,089,270 8,922,280 8,572,614 Source: ORM’s SEC filings 12 Dividends Declared per Share of Common Stock$0.10$0.10 $0.16 $0.20 $0.20 Basic and Diluted Earnings per Common Share$0.02$(0.44) $0.05 $0.26 $0.26 Provision f or Income Tax(1,276)(1,952)(183)18(151) Gain on Sale of Real Estate, Net5822691559571,373 Total Expe ns e s$3,428$6,592 $3,494 $2,978 $3,696 Impairment Losses on Real Estate Properties368774--746 Interest Expense472467536587711 Rental and Other Expenses on Real Estate Properties1,2511,0901,459950939 Servicing Fees to Manager939295--Expe ns e s Other Income48493249145 Interest and Related Income f rom Loans$2,963$2,689 $2,890 $3,087 $3,438 (In Thousands, except share data)Q3 2017Q4 2017Q1 2018Q2 2018Q3 2018
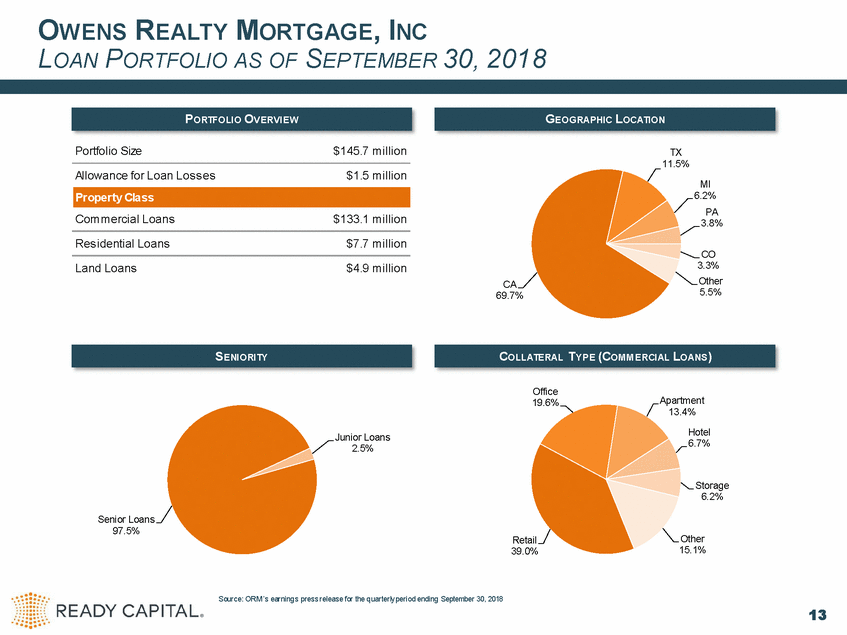
OWENS REALTY MORTGAGE, INC LOAN PORTFOLIO SEPTEMBER 30, 2018 AS OF Portfolio Size $145.7 m illion TX 11.5% Allowance for Loan Los s es $1.5 m illion MI 6.2% PA 3.8% Com m ercial Loans $133.1 m illion Res idential Loans $7.7 m illion CO 3.3% Other 5.5% Land Loans $4.9 m illion CA 69.7% Office 19.6% Apartment 13.4% Hotel 6.7% Junior Loans 2.5% Storage 6.2% Senior Loans 97.5% Other 15.1% Retail 39.0% Source: ORM’s earning s press release for the q uarterly period ending September 30, 2018 13 COLLATERAL TYPE (COMMERCIAL LOANS) SENIORITY Property Class GEOGRAPHIC LOCATION PORTFOLIO OVERVIEW
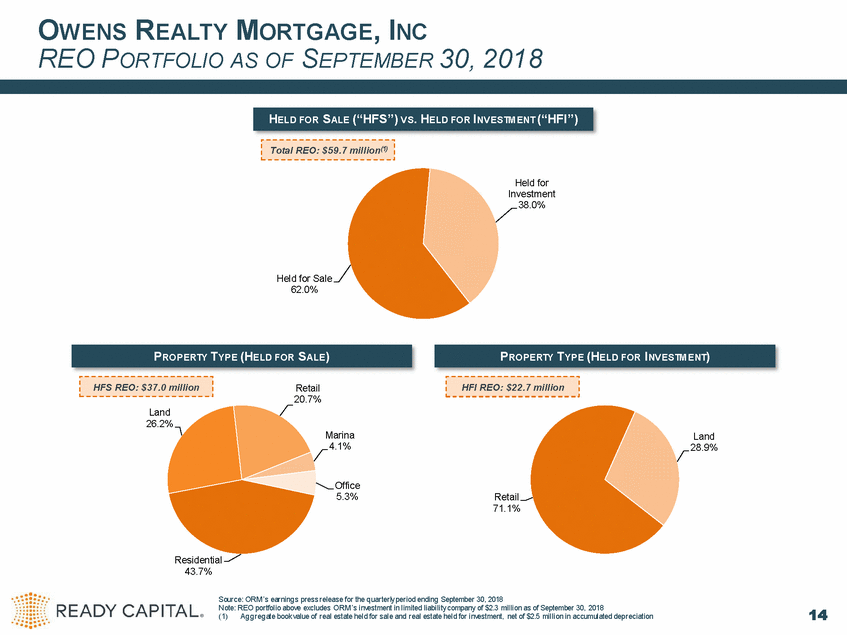
OWENS REALTY MORTGAGE, INC REO PORTFOLIO SEPTEMBER 30, 2018 AS OF Held for Investment 38.0% Held for Sale 62.0% Retail 20.7% Land 26.2% Marina 4.1% Land 28.9% Office 5.3% Retail 71.1% Residential 43.7% Source: ORM’s earnings press release for the quarterly period ending September 30, 2018 Note: REO portfolio above excludes ORM’s investment in limited liability company of $2.3 million as of September 30, 2018 (1)Aggregate book value of real estate held for sale and real estate held for investment, net of $2.5 million in accumulated depreciation 14 HFI REO: $22.7 million HFS REO: $37.0 million PROPERTY TYPE (HELD FOR INVESTMENT) PROPERTY TYPE (HELD FOR SALE) Total REO: $59.7 million(1) HELD FOR SALE (“HFS”) VS. HELD FOR INVESTMENT (“HFI”)
[LOGO]